B-055, in: T.C. Fox and H.V. Rectanus (Chairs). Remediation of Chlorinated and Recalcitrant Compounds—2012. Eighth International Conference on Remediation of Chlorinated and Recalcitrant Compounds (Monterey, CA; May 2012). ISBN 978-0-9819730-5-0, ©2012 Battelle Memorial Institute, Columbus, OH, www.battelle.org/chlorcon.
Predicting the Operational Life of Zero-Valent Iron during ISCR-Enhanced Bioremediation of TCE DNAPL
James Peale ([email protected]) and Erik Bakkom
(Maul Foster & Alongi, Inc., Portland, Oregon, USA) Jim Mueller, Josephine Molin, and Andrzej Przepiora
(Adventus Americas Inc., Freeport, IL, USA) Background/Objectives. Groundwater at an active manufacturing facility on an 80-acre site in Portland, Oregon, was impacted by TCE and its degradation products. Operations at the facility began in 1980, and included the use of TCE from approximately 1980 to 1989. TCE and/or TCE-containing wastewater were released to the subsurface in the early 1980s, roughly between 1980 and 1984. In 2006, concentrations of TCE and cis-1,2-dichloroethene (DCE) in the primary release area ranged as high as 592,000 and 90,000 µg/L (respectively) at depths ranging from approximately 50 to 110 ft below ground surface (bgs). Although not observed during drilling or groundwater sampling, the presence of TCE DNAPL was inferred by concentrations approaching 50% of the aqueous solubility limit. Approach/Activities. Based upon bench and field pilot studies, ISCR-enhanced bioremediation was selected for primary source area treatment and implemented in early 2009. Implementation consisted of an approximately 150 foot-long permeable reactive barrier (PRB) consisting of EHC® and KB-1®, installed at depths ranging from approx-imately 40 to 112 ft bgs using direct-push technology. Groundwater data were collected from 23 performance monitoring wells located upgradient, within, and downgradient of the PRB. Early data confirmed the success of the approach, with 99.99% TCE mass removal less than a year following completion, with many wells below the USEPA MCL (5 µg/L). Results/Lessons Learned. While the performance data indicated successful remediation of TCE DNAPL, residual concentrations of degradation products (primarily cis-1,2-DCE and vinyl chloride) prompted questions regarding the long-term stability of the zero-valent iron (ZVI) component of the EHC material. The primary mechanism resulting in reduced effectiveness of ZVI is consumption of iron by processes such as corrosion, reduction of chlorinated VOCs, reduction of nitrate, and reduction of sulfate. Pre-injection groundwater concentration data were used to estimate the aggregate rate of ZVI consumption based on the total amount of ZVI injected, with a predicted operational life of the ZVI ranging from 14-60 years. Subsequent performance data (including iron, dissolved oxygen, nitrate, sulfate, and CVOC) will be used to further evaluate the predicted operational life. Modeling will be completed using publically available iron corrosion/consumption calculations and geochemical models. These data and calculations will be presented and compared to available data from other sites.
PREDICTING THE OPERATIONAL LIFE OF ZERO-VALENT IRON DURING
ISCR-ENHANCED BIOREMEDIATION OF TCE AND TCE DNAPL
James G.D. Peale, RG Erik I. Bakkom, PE (Maul Foster & Alongi Inc.)
Josephine Molin Jim Mueller
Andrzej Przepiora (FMC Environmental Solutions/Adventus)
May 2012

Site Overview Technology Summary Problem Statement Analysis Results Summary Implications
TOPICS
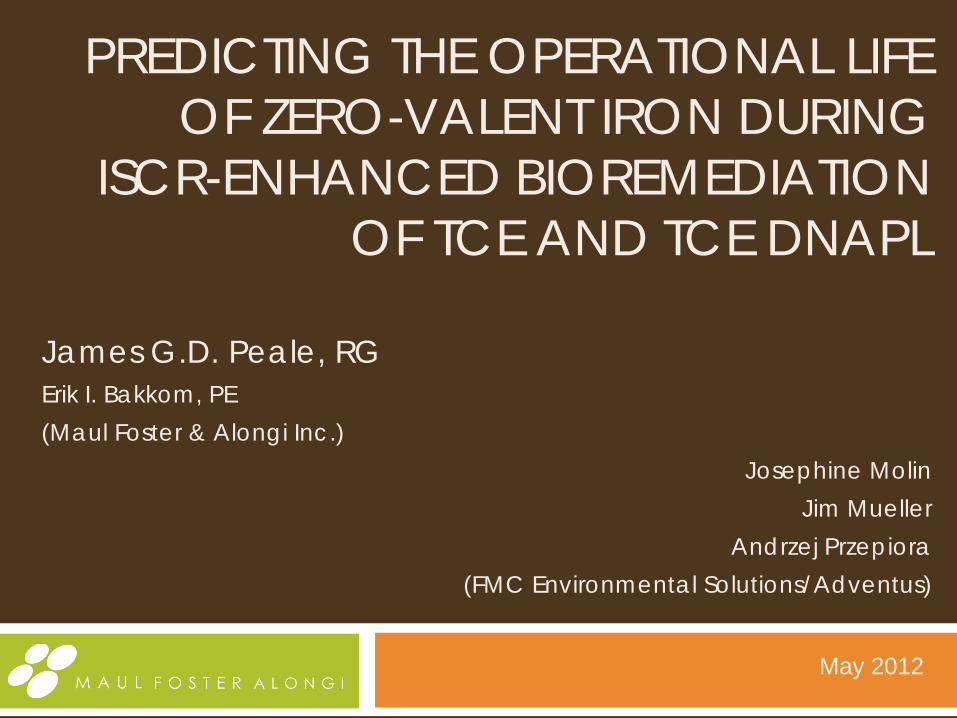
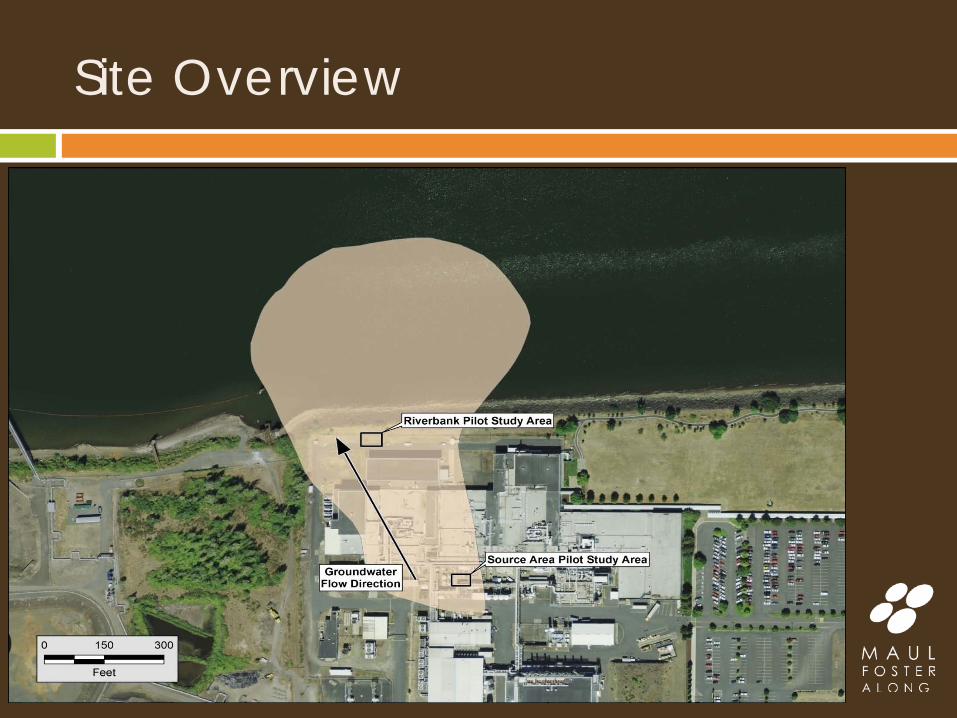
Former MGP waste site redeveloped for manufacturing in 1970s
80+ acres adjacent to Portland Harbor NPL site TCE or TCE+wastewater released from a recycling
system (1980-1985) Impacts from release discovered in 2002 Source Zone
Impacts from about 15-34 m bgs TCE up to 592,000 ug/L (DNAPL levels)
No TCE DNAPL observed Cis-1,2-DCE up to 90,800 ug/L Very little VC (< 100 ug/L)
Site Overview
Site Overview
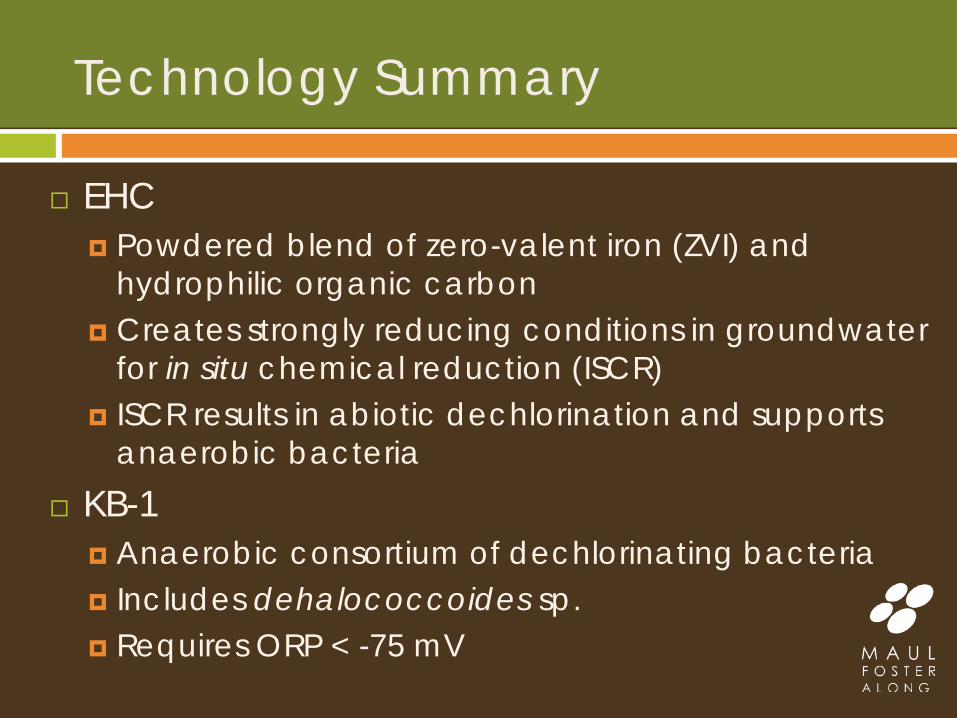
Technology Summary
EHC Powdered blend of zero-valent iron (ZVI) and
hydrophilic organic carbon Creates strongly reducing conditions in groundwater
for in situ chemical reduction (ISCR) ISCR results in abiotic dechlorination and supports
anaerobic bacteria KB-1
Anaerobic consortium of dechlorinating bacteria Includes dehalococcoides sp. Requires ORP < -75 mV
Technology Summary
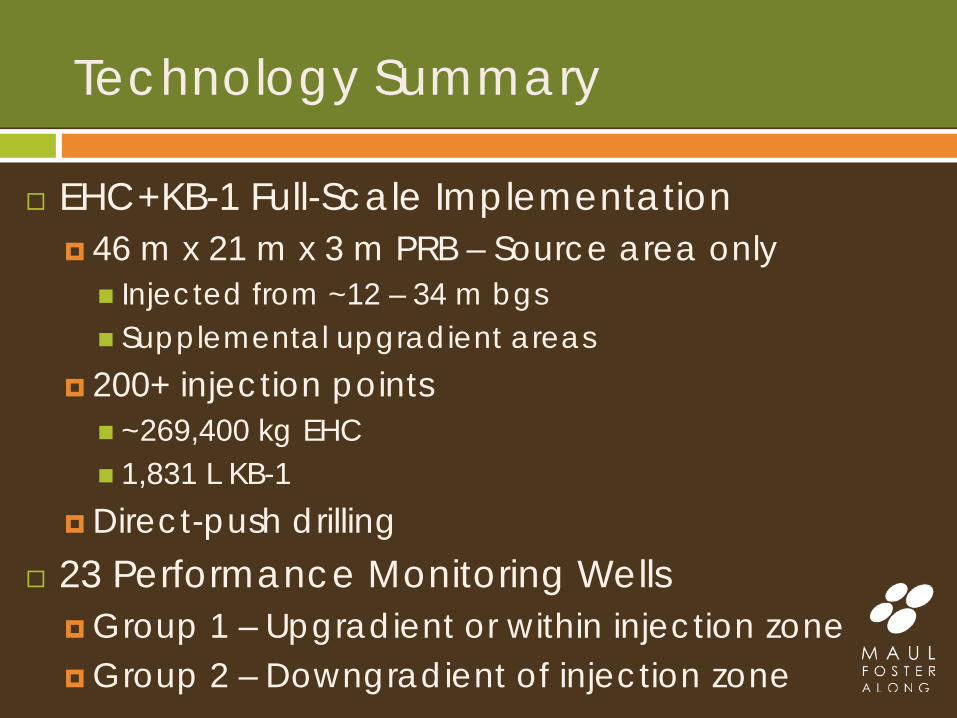
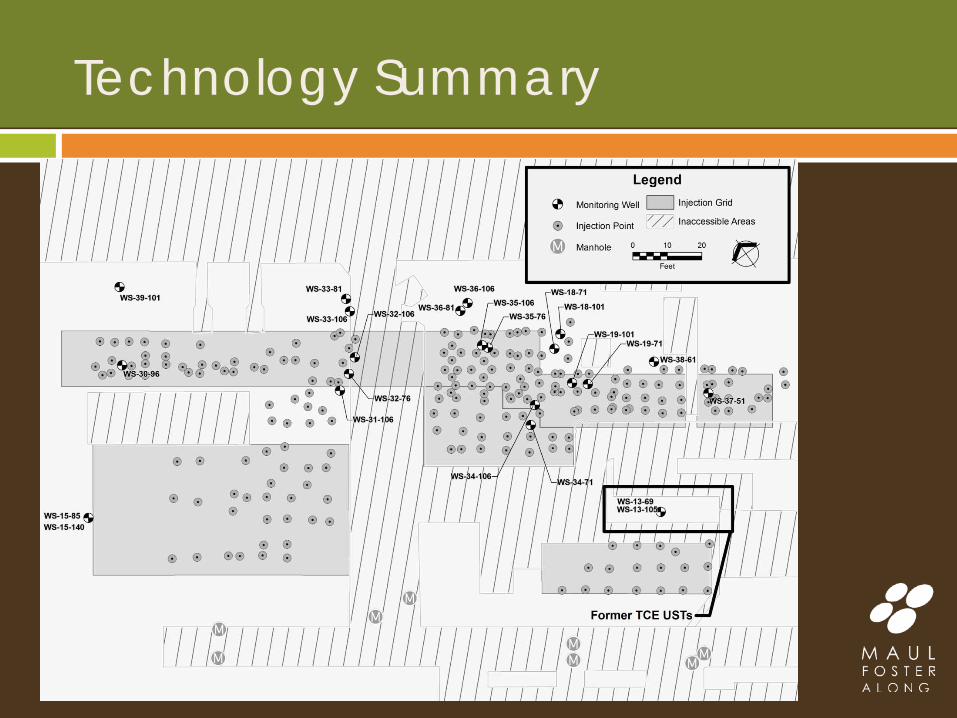
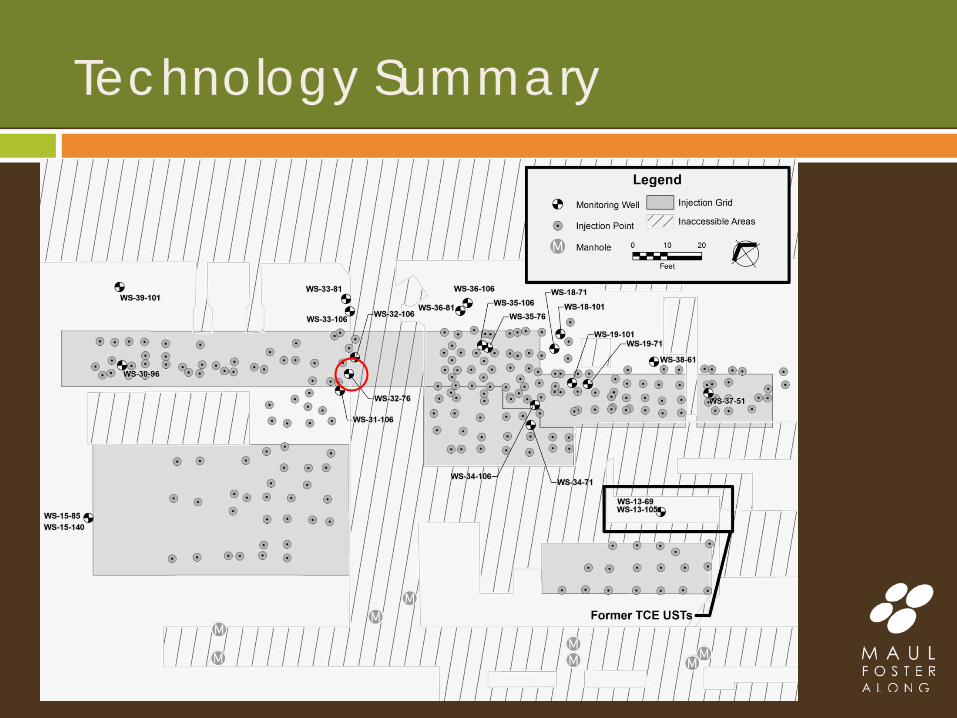
EHC+KB-1 Full-Scale Implementation 46 m x 21 m x 3 m PRB – Source area only Injected from ~12 – 34 m bgs Supplemental upgradient areas
200+ injection points ~269,400 kg EHC 1,831 L KB-1
Direct-push drilling 23 Performance Monitoring Wells
Group 1 – Upgradient or within injection zone Group 2 – Downgradient of injection zone
Technology Summary
Technology Summary
Technology Summary
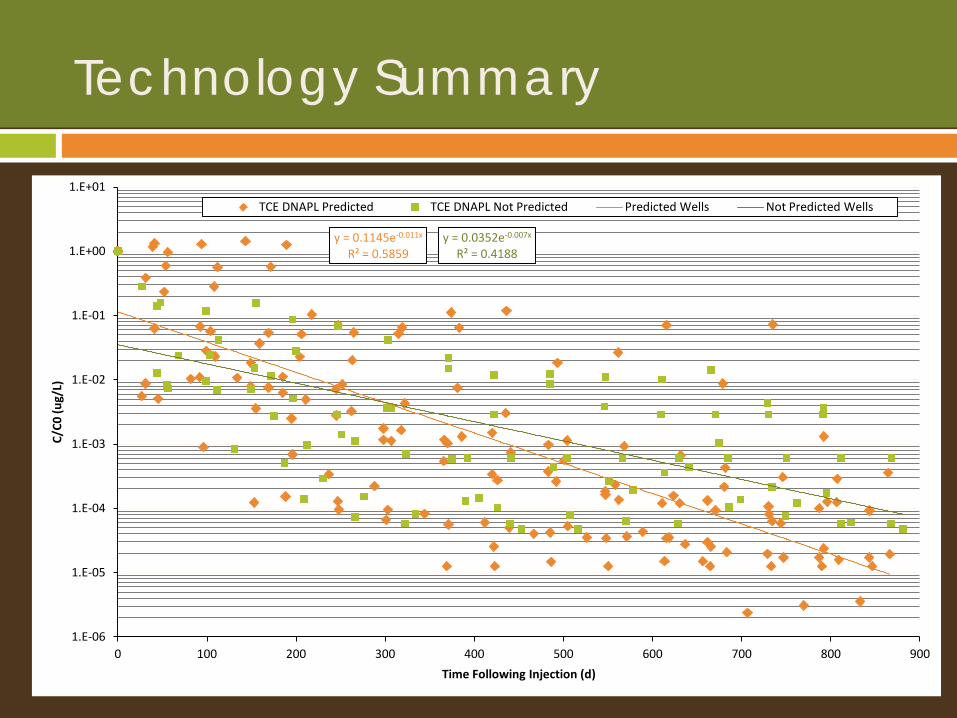
Insert TCE normalized plot? Subset of wells with pre-injection TCE > 11,000 ug/L
y = 0.1145e-0.011x R² = 0.5859
y = 0.0352e-0.007x R² = 0.4188
1.E-06
1.E-05
1.E-04
1.E-03
1.E-02
1.E-01
1.E+00
1.E+01
0 100 200 300 400 500 600 700 800 900
C/C0
(ug/
L)
Time Following Injection (d)
TCE DNAPL Predicted TCE DNAPL Not Predicted Predicted Wells Not Predicted Wells
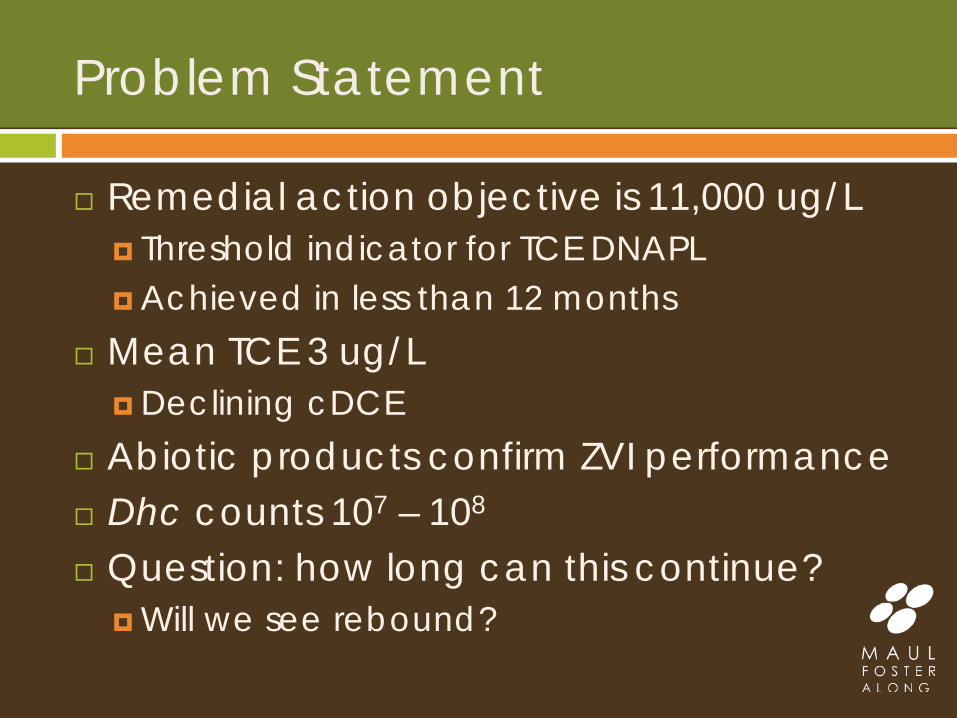
Problem Statement
Remedial action objective is 11,000 ug/L Threshold indicator for TCE DNAPL Achieved in less than 12 months
Mean TCE 3 ug/L Declining cDCE
Abiotic products confirm ZVI performance Dhc counts 107 – 108
Question: how long can this continue? Will we see rebound?
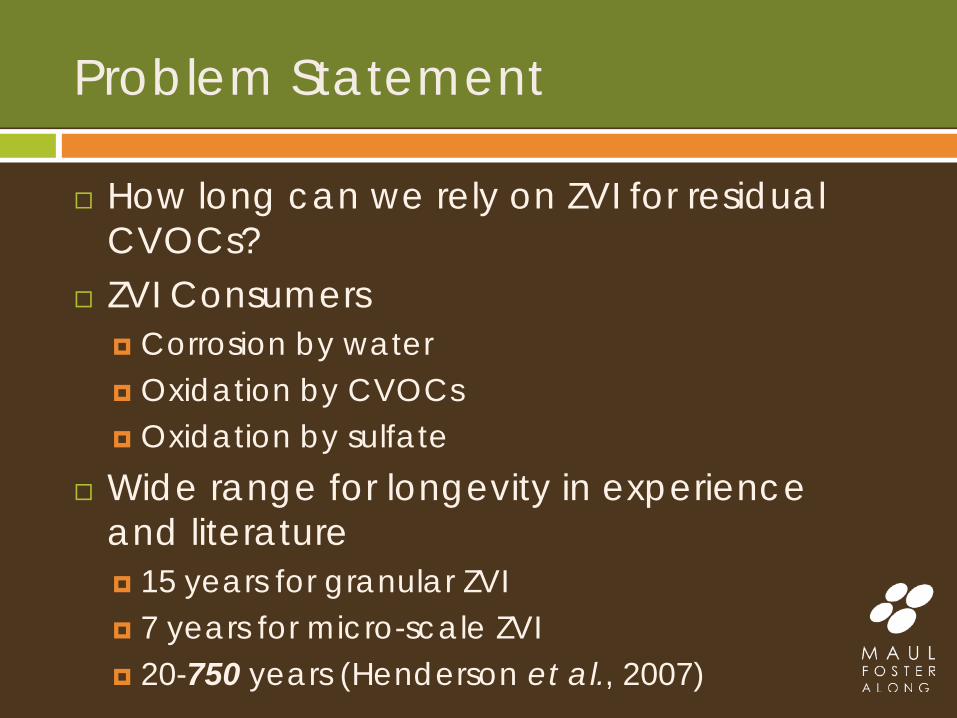
Problem Statement
How long can we rely on ZVI for residual CVOCs?
ZVI Consumers Corrosion by water Oxidation by CVOCs Oxidation by sulfate
Wide range for longevity in experience and literature 15 years for granular ZVI 7 years for micro-scale ZVI 20-750 years (Henderson et al., 2007)
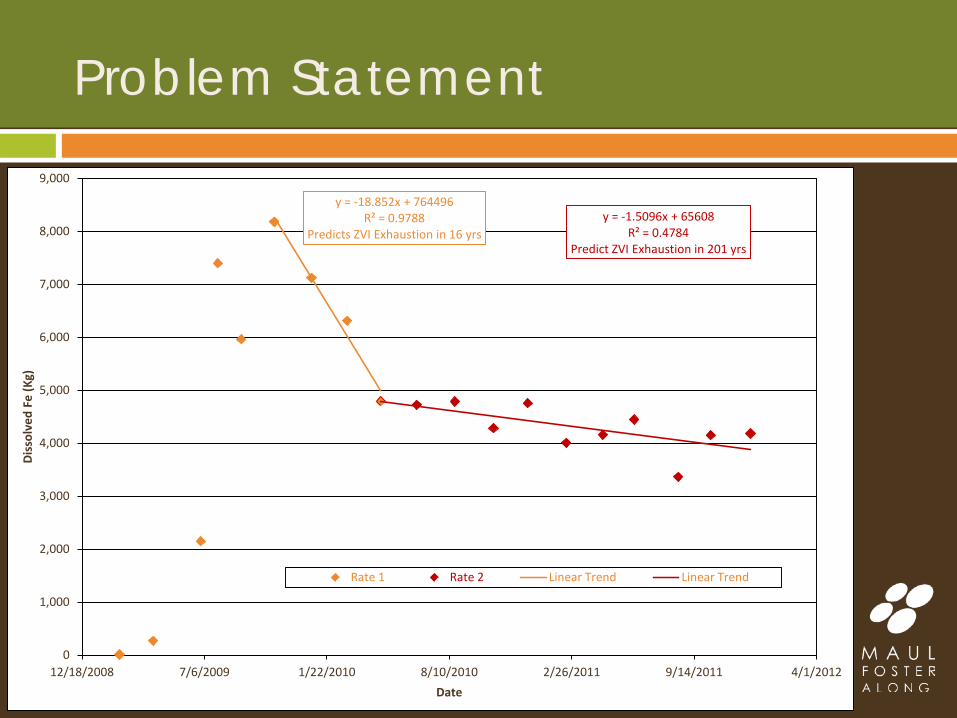
Problem Statement
y = -18.852x + 764496 R² = 0.9788
Predicts ZVI Exhaustion in 16 yrs y = -1.5096x + 65608
R² = 0.4784 Predict ZVI Exhaustion in 201 yrs
0
1,000
2,000
3,000
4,000
5,000
6,000
7,000
8,000
9,000
12/18/2008 7/6/2009 1/22/2010 8/10/2010 2/26/2011 9/14/2011 4/1/2012
Diss
olve
d Fe
(Kg)
Date
Rate 1 Rate 2 Linear Trend Linear Trend
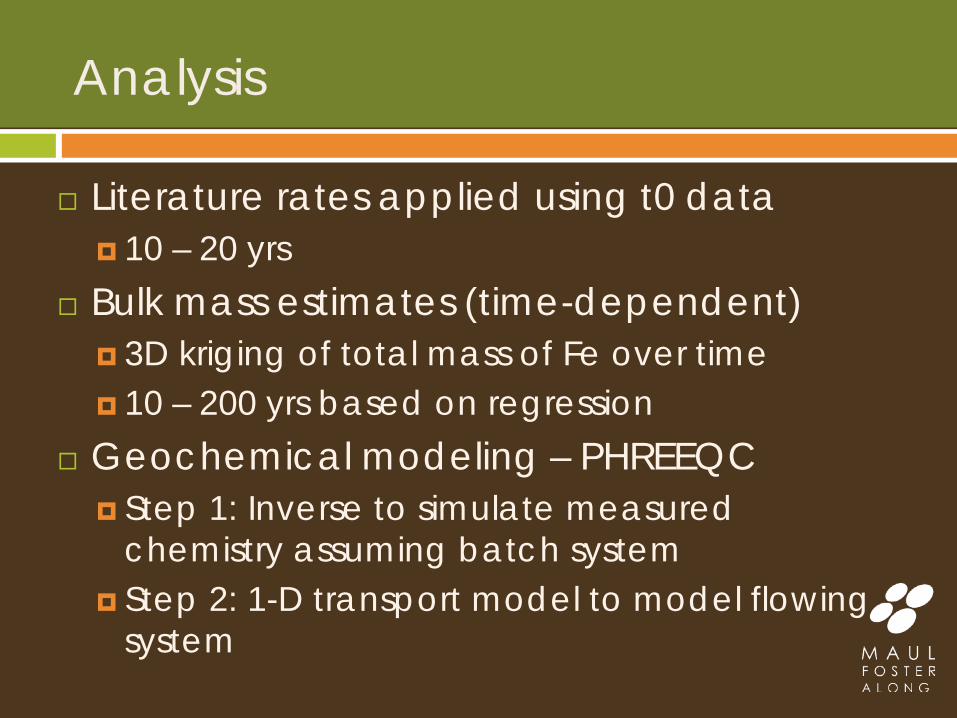
Analysis
Literature rates applied using t0 data 10 – 20 yrs
Bulk mass estimates (time-dependent) 3D kriging of total mass of Fe over time 10 – 200 yrs based on regression
Geochemical modeling – PHREEQC Step 1: Inverse to simulate measured
chemistry assuming batch system Step 2: 1-D transport model to model flowing
system
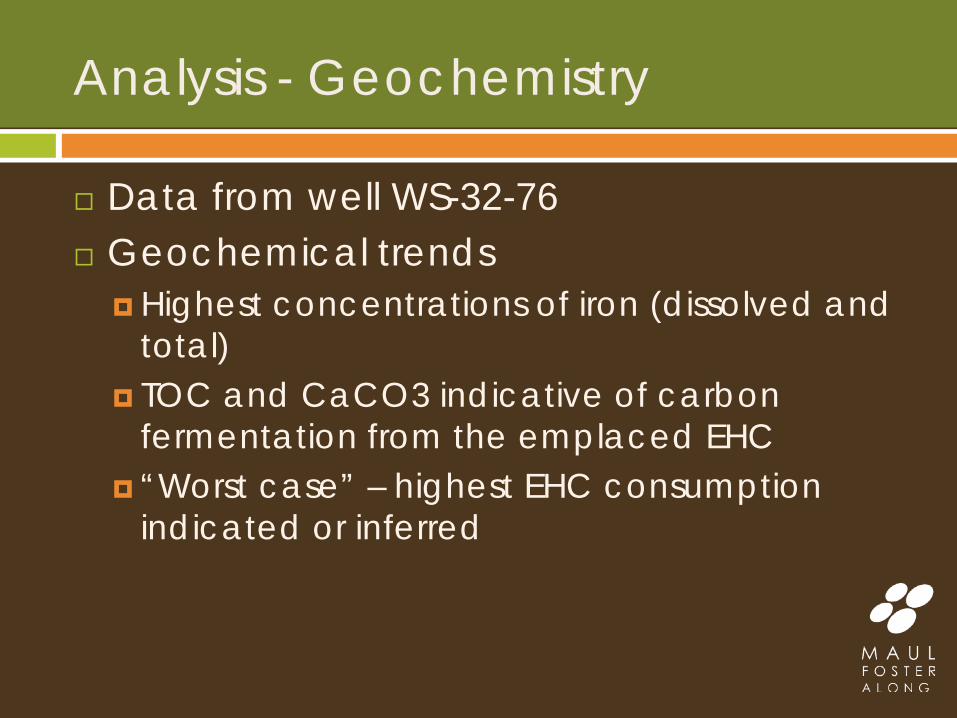
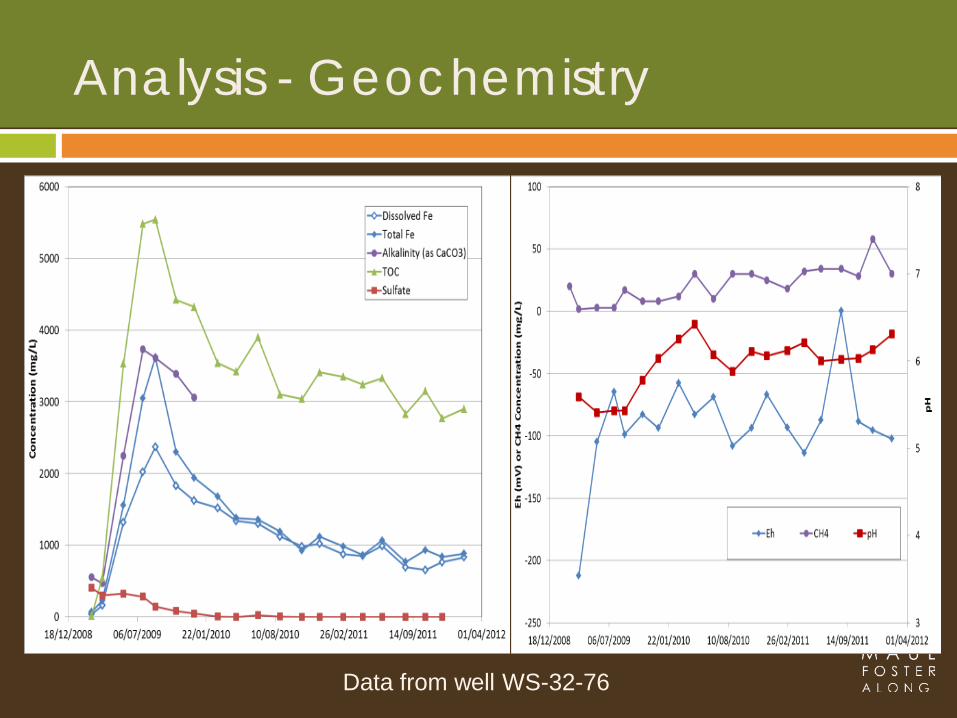
Analysis - Geochemistry
Data from well WS-32-76 Geochemical trends
Highest concentrations of iron (dissolved and total)
TOC and CaCO3 indicative of carbon fermentation from the emplaced EHC
“Worst case” – highest EHC consumption indicated or inferred
Analysis - Geochemistry
Data from well WS-32-76
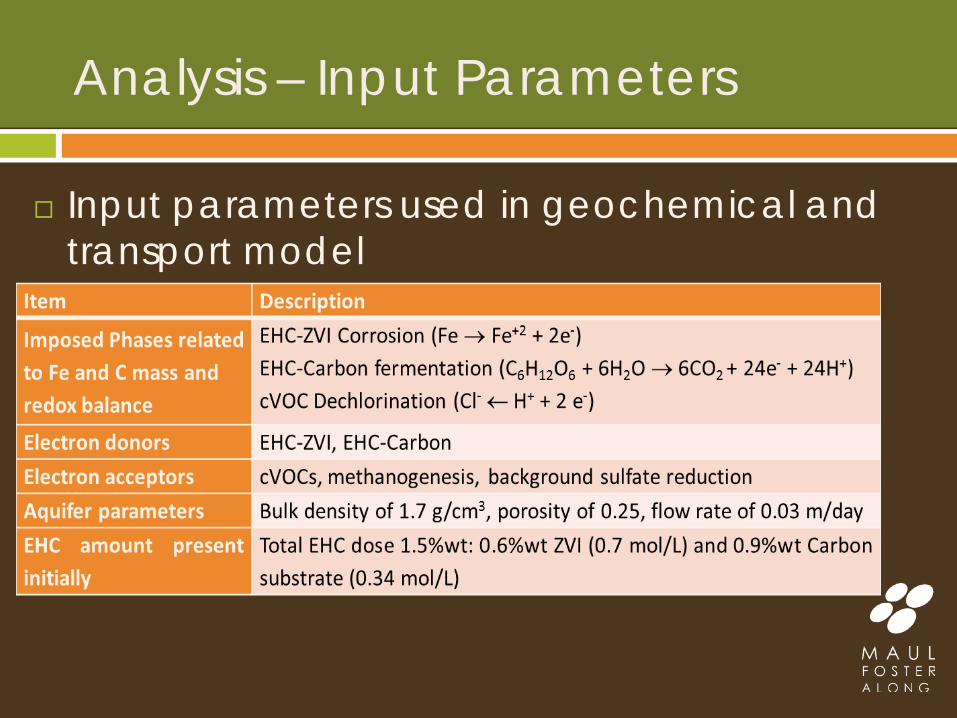
Analysis – Input Parameters
Input parameters used in geochemical and transport model
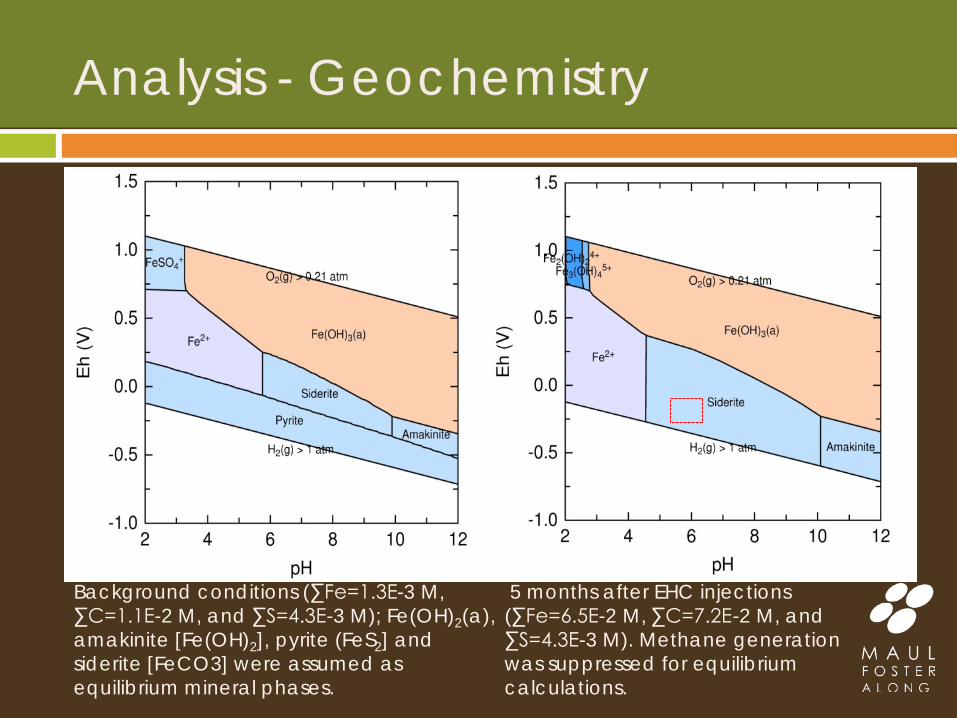
Background conditions (∑Fe=1.3E-3 M, ∑C=1.1E-2 M, and ∑S=4.3E-3 M); Fe(OH)2(a), amakinite [Fe(OH)2], pyrite (FeS2] and siderite [FeCO3] were assumed as equilibrium mineral phases.
Analysis - Geochemistry
5 months after EHC injections (∑Fe=6.5E-2 M, ∑C=7.2E-2 M, and ∑S=4.3E-3 M). Methane generation was suppressed for equilibrium calculations.
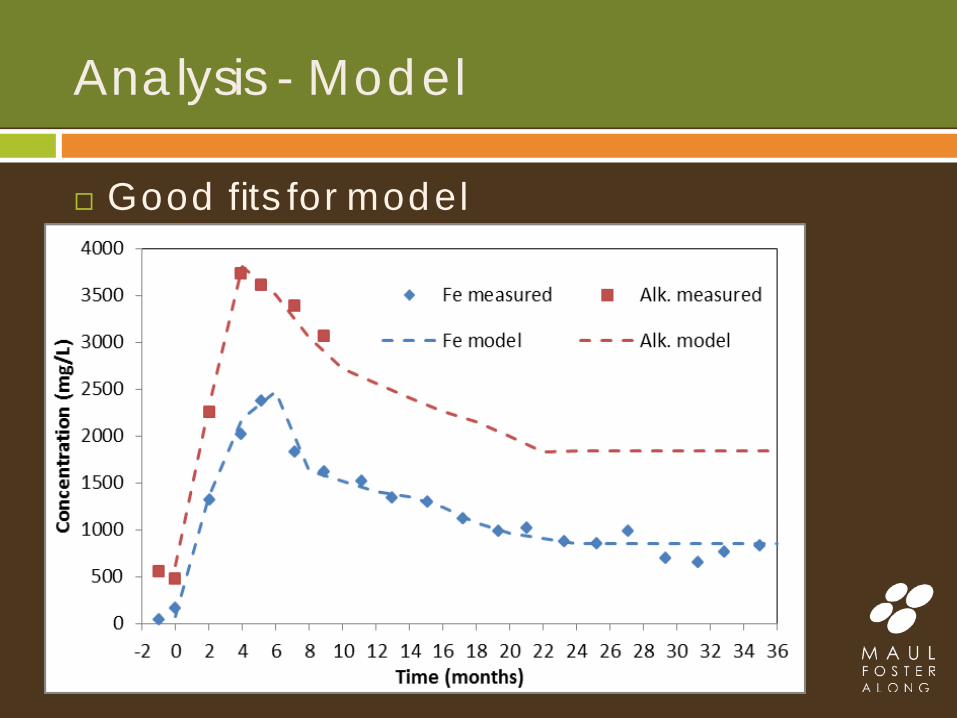
Analysis - Model
Good fits for model
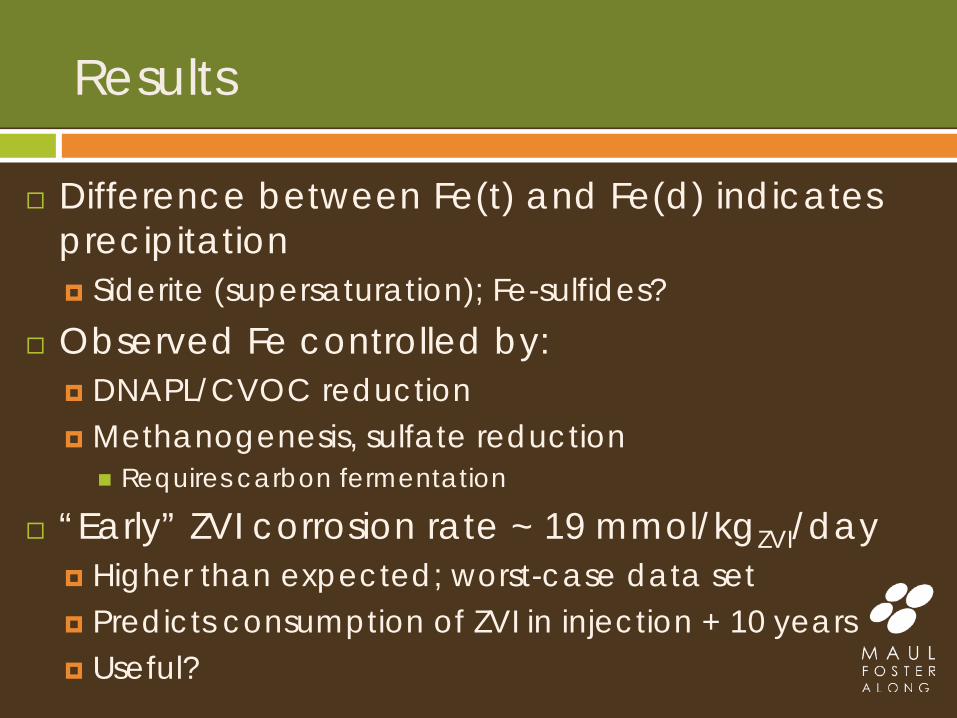
Results
Difference between Fe(t) and Fe(d) indicates precipitation Siderite (supersaturation); Fe-sulfides?
Observed Fe controlled by: DNAPL/CVOC reduction Methanogenesis, sulfate reduction Requires carbon fermentation
“Early” ZVI corrosion rate ~ 19 mmol/kgZVI/day Higher than expected; worst-case data set Predicts consumption of ZVI in injection + 10 years Useful?
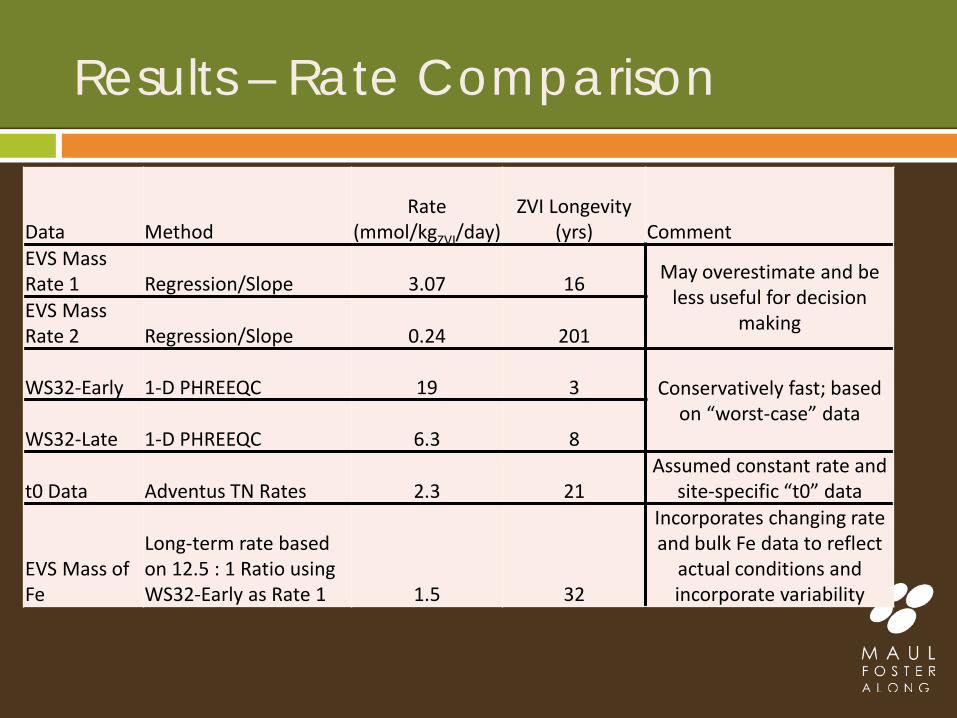
Results – Rate Comparison
Data Method Rate
(mmol/kgZVI/day) ZVI Longevity
(yrs) Comment EVS Mass Rate 1 Regression/Slope 3.07 16 May overestimate and be
less useful for decision making EVS Mass
Rate 2 Regression/Slope 0.24 201
WS32-Early 1-D PHREEQC 19 3 Conservatively fast; based on “worst-case” data
WS32-Late 1-D PHREEQC 6.3 8
t0 Data Adventus TN Rates 2.3 21 Assumed constant rate and
site-specific “t0” data
EVS Mass of Fe
Long-term rate based on 12.5 : 1 Ratio using WS32-Early as Rate 1 1.5 32
Incorporates changing rate and bulk Fe data to reflect
actual conditions and incorporate variability
Summary
Literature range sets boundaries 20 – 750 yrs (latter less useful) Developing data set
Regression provides simple tool for prediction Dual rates observed and should be considered Early consumption followed by equilibrium
Modeling is promising approach Estimates match lower range of regression Can provide conservative (short) predictions to
improve site planning/closure
Implications
Micro-scale ZVI is extremely durable Data fit well with other observations
Similarity to presumed P&T timeframes (30 yrs) How do we manage long-term?
Is monitoring required to demonstrate complete exhaustion?
How can we extend confidence of this long-term remedy to support site closure?

Acknowledgements/Questions
Thank you.
FMC Environmental Solutions / Adventus
Questions?
Recommended