Predicting Lawyering Effectiveness:
Broadening the Basis for Law School Admission Decisions
This paper reports an eight year empirical study to identify what factors are important to
lawyer effectiveness and to assess whether those factors can be predicted. The
research explores whether a predictive test of professional effectiveness should be used
in law school admissions to supplement the LSAT and Index Score which only predict
first year law grades. More than eleven hundred lawyers who graduated from two law
schools between 1973 and 2006 took our experimental test, provided access to
information from their academic history, and named peer and supervisor raters who
could evaluate their current professional performance. Over 4000 respondents returned
performance appraisals. Statistical analysis of scores on the new test, LSAT, UGPA,
FYGPA, and performance ratings suggest that prediction of professional effectiveness is
possible; the new test predicted 24 of 26 professional effectiveness factors. Additionally,
concordant with literature on employment selection, results showed no significant
differences in race/ethnic or gender group performance. After validation with a national
sample, this approach could increase merit-based diversity of student bodies and the
profession as well as improving the projected professional competency of those chosen
to receive legal training.

Predicting Lawyer Effectiveness:Broadening the Basis for LawSchool Admission Decisionslsi_1245 620..661
Marjorie M. Shultz and Sheldon Zedeck
Law school admission decisions are heavily influenced by a student’s undergraduategrade point average (UGPA) and Law School Admission Test (LSAT) score. Thesemeasures, although predictive of first-year law school grades, make no effort to predictprofessional competence and, for the most part, they do not. These measures also createadverse impact on applicants from underrepresented racial/ethnic groups. This articledescribes the rationale for and process by which we explored new tests to predict lawyereffectiveness rather than law school grades and reports results of a multiyear empiricalstudy involving over 3,000 graduates from Berkeley Law School and Hastings College ofthe Law. Tests measuring personality constructs, interests, values, and judgment pre-dicted lawyering competency but had little or no adverse impact on underrepresentedminority applicants. Combined with the LSAT and UGPA, these broader tests couldassess law applicants on the basis both of projected professional effectiveness and academicindicators.
INTRODUCTION
The role of standardized testing in education has become increasingly controver-sial over recent years (Sackett, Borneman, and Connelly 2008). This debate includescontention about how postsecondary institutions should make admission decisions.
Marjorie M. Shultz is Professor of Law (Emerita) at Berkeley Law School, University of California atBerkeley. As contact author, Professor Shultz can be reached at Telephone: (510) 642-1921, Fax: (510)642-3856, or [email protected]. Postal address is Berkeley Law School, University of California;Berkeley, CA, 94720.
Sheldon Zedeck is Professor of the Graduate School (Emeritus), Department of Psychology, Universityof California at Berkeley, [email protected].
Funding for this research was received from Berkeley Law School, and also from the Law SchoolAdmission Council (LSAC). The opinions and conclusions are those of the authors and do not necessarilyrepresent the positions or policy of the LSAC. Funding assistance was also provided by the WallaceAlexander Gerbode Foundation, the Hanson Bridgett law firm, Drucilla Stender Ramey, and Martha FayeAfrica. We were ably assisted by graduate student researchers Jamie Clark and Eunice Chang, Ph.D. as wellas by law students including William Kidder, Nicole Thomas, Chhunny Chhean, Sarah London, AubrieDillon, Sarah Sobrahoff, and Shelby Myers. We are grateful to Deans Herma Hill Kay and Chris Edley ofBerkeley, and to Associate Dean Shauna Marshall of Hastings College of the Law for their support of thisstudy. Many staff and administrators at both schools provided vital help. We are especially grateful to LouiseEpstein, Joey Plaster, and Ed Tom at Berkeley; and Gina Barnett at Hastings for their hard work facilitatingthe study. We have benefited from the commentary and suggestions of participants in many faculty work-shops, conference settings, and bar gatherings over the years. We are also indebted to the members of ourNational Advisory Board for nearly eight years of service: Kelly Brown, David Chambers, Phoebe Haddon,Thelton Henderson, Leaetta Hough, Robert Nelson, Beth Cobb O’Neil, Pilar Ossorio, James Outtz, PaulSackett, and Garner Weng.
Law & Social InquiryVolume 36, Issue 3, 620–661, Summer 2011
Law & Social Inquiry
Journal of the American Bar Foundation
620 © 2011 American Bar Foundation.

Particularly, how should universities define merit and qualification; how should diver-sity be construed for admissions purposes; and how important is achieving racial, ethnic,economic, or political diversity in higher education? The Supreme Court’s decision inGrutter v. Bollinger (2003) provided some answers to these questions, offering a consti-tutional reprieve for limited consideration of race in admissions;1 however, this decisiondoes not answer whether and how universities can assess the objective and subjectivequalifications of applicants.
In law schools, the challenge of creating admission criteria is particularly difficultbecause, on one hand, law schools seek to admit those with the strongest academicpotential; however, on the other, a narrow focus on academics may come at the expenseof diversity, professional competency, and society’s mandate for the legal profession.Law schools have traditionally relied heavily upon scholastic dimensions, such as anIndex score—a scoring compilation based on students’ Law School Admission Test(LSAT) scores and their undergraduate grade point average (UGPA), to select potentialprogram candidates. These measures have proven to be valuable predictors of first-yearlaw school grades. However, they do not account for success in the legal professionor for law school outcomes other than first-year grades. The perceived failure of lawschool admissions committees to focus on an applicant’s professional potential hascreated many complaints (Edwards 1992; American Bar Association 1992 [“MacCrateReport”]; Sullivan et al. 2007 [“Carnegie Report”]).
Other scholars also object to admissions practices they see as reinforcing racial andclass privileges (Sturm and Guinier 1996; Kidder 2000, 2001, 2003; Society of Ameri-can Law Teachers 2003). Research consistently shows that affluent White studentsperform better on standardized tests, including the LSAT, than their less advantaged orminority peers (Schmidt and Hunter 1981, 1998; Wightman 1997). As a result, a heavyemphasis on LSAT scores in admission decisions substantially reduces the presence ofAfrican American and Latino students in law school and the profession as well asdiminishing prospects from most non-elite families (Kidder 2000, 2003).
The practices that govern who is admitted into law school play a decisive role inthe composition and performance of the legal profession. The limits and downsides ofcurrent admission practices, as well as the logic of law schools’ role as professionalschools, urge us to look beyond student achievement that can predict first-year gradesin law school. Our current research sought to explore and demonstrate the importanceand potential of an expanded approach to admission decision making.
Using hundreds of interviews with five stakeholder groups, multiple focus groupswith law graduates, and more than 2,000 responses to an alumni survey, we identified 26factors that are important to lawyering effectiveness. Following this finding, we createdinstruments to measure these professional performance factors and validated the scalesthrough responses from a sample of practicing lawyers. We then identified, selected, anddeveloped new tests (other than the LSAT/UGPA/Index score) that correlated withand predicted the large majority of the 26 factors conducive to lawyering effective-ness. Correlations in our data show that our results were race and gender neutral.
1. The constitutional picture regarding race in admissions is complicated by the fact that some states(e.g., California, Washington, Michigan, and Nebraska) have passed state laws or constitutional initiativesthat bar affirmative action in public institutions.
Predicting Lawyer Effectiveness 621

Consequently, the use of expanded measures like ours could substantially reduce theracial and ethnic adverse impact resulting from schools’ undue emphasis on the LSAT.This approach could enable law schools to select better prospective lawyers withimproved professional skills as well as permit entry for those who are meritorious buttypically underrepresented.
LITERATURE REVIEW
Research on Law School Admission Testing
Research on law school admission tests has focused mainly on the efficacy of LSATand UGPA as predictors of first-year, law school grades. Although some schools weighother factors for admission, they especially rely on the LSAT because it is standardizedand relatively objective. The validity of the LSAT and UGPA as predictors of first-yeargrades has consistent statistical support (Schrader 1977; Powers 1982; Linn andHastings 1983; Evans 1984; Wightman 1993; Anthony, Harris, and Pashley 1999;Dalessandro, Stilwell, and Reese 2005).
For example, Dalessandro, Stilwell, and Reese (2005) demonstrated that thecombination of LSAT and UGPA correlates approximately .47 with first-year gradepoint average (FYGPA). They found that on, average, LSAT, by itself, correlates .35with FYGPA, while UGPA alone correlates approximately .20—although these resultsvaried by law school (from .00 to .60). In a prior study, Dalessandro and colleagues(Stilwell, Dalessandro, and Reese 2003) reported similar findings for the LSAT/UGPAcombination from a two-year period. Their results showed a multiple correlation of .49for LSAT and UGPA as predictors of FYGPA, as well as a similar pattern found byDalessandro, Stilwell, and Reese (2005) with regard to variability among law schools.
Despite the LSAT’s moderately good prediction of FYGPA, a question can beraised about how performance is measured in the Law School Admission Council(LSAC), correlational research studies. The LSAT is a “paper-and-pencil” test thatbasically measures analytic and logical reasoning, along with reading (Law SchoolAdmission Council 1999). With regard to determinants of FYGPA, LSAT scoresexplain more variance than undergraduate GPA especially in the first year. An empiri-cal study by Henderson (2004) even explored how test-taking speed can predict per-formance on both the LSAT and eventual law school exams—a finding that increasesthe predictive validity of the LSAT. However, test-taking speed diminished the predic-tive value of LSAT significantly when first-year grades were based on take-home examsor papers instead of exams. This secondary finding from Henderson (2004) raises a keydiscussion: when law students are graded on measurements similar to the LSAT, such asexams that require students to read fact patterns, identify and analyze legal issues,assemble evidence and arguments, and sometimes to assess implications, it seems logicala predictive relationship exists. As such, the predictive value of LSAT with FYGPA areunsurprising at times, especially given that the LSAT was designed to value the skillsthat law professors most valued and rewarded with high grades (La Piana 1998)—thesecourses are larger than most and are often measured through examinations rather thanother grading methods.
LAW & SOCIAL INQUIRY622

Due to this test development limitation, the LSAT may be measuring cognitivetest-taking skills that are rewarded in first-year courses, which are often graded using asimilar methodology because professors may find it difficult within the constraints ofstandard curriculum and methods of assessment to evaluate other types of abilities suchas those identified in lawyer effectiveness factors similar to the ones we identified (e.g.,Negotiations, Interviewing, Integrity, Problem Solving, Creativity, etc.). These capa-bilities are not typically reflected in law school exams or grades (FYGPA). Given thecriterion FYGPA, it would also be surprising if new measures that were noncognitive innature could improve the LSAT/UGPA Index predictive value on first-year grades.
Empirical accounts also document racial and ethnic disparities in standardizedtesting performance and their effect on admission to law school. Wightman (1997)contrasted projected outcomes of admission policies incorporating affirmative actionwith use of the weighted combination (i.e., LSAT coupled with UGPA) as the maindeterminant of admission. Based on data from 1990 to 1991, she concluded that solereliance on LSAT and UGPA would result in systematic exclusion of minorities fromlaw school programs. Wightman did not suggest abandonment of the weighted LSAT/UGPA combination but recommended that other, additional predictors be sought.Norton, Suto, and Reese (2006) examined whether the LSAT and UGPA (individuallyand jointly) over or under predicts first-year performance of certain subgroups. Based ondata of entering students from 2002 to 2004, the researchers found that the combina-tion of LSAT and UGPA resulted in a fairly accurate prediction of first-year law schoolperformance. Furthermore, the differential validity results found varying patterns tothose reported for other cognitive ability tests used in employment settings, like theones explored by Schmidt and Hunter (1981), in that the FYGPA performance ofminority students tended to be slightly overpredicted, while performance of Whitestudents tended to be underpredicted. These findings replicate those of earlier studies(Wightman and Muller 1990; Anthony and Liu 2000; Stilwell and Pashley 2003).
In sum, the combination of the LSAT and UGPA, and each separately, are validpredictors of the FYGPA criterion. However, the LSAT and UGPA are limited even inthis goal because they account for only part of the variance in first-year grades. Diazet al. (2001) attempted to use these measures to examine other law school performanceindicators, such as oral argument rating, but found that the LSAT and other law schooladmission indicators were not predictive.2 Overall, then, the research literature showsthat the narrow cognitive predictors used in law school admission can (1) explain onlyabout 25 percent of the variance in FYGPA, (2) have a disparate impact on underrep-resented minority groups, and (3) seek to explain only certain types of law schoolcriteria and do not directly seek to explain or predict lawyering effectiveness.
Research on Lawyering Effectiveness
In contrast with studies about predicting grades, research on predicting attorneyeffectiveness is limited, particularly with respect to the ways in which success as a lawyer
2. In addition, the key aspect of Diaz et al.’s (2001) research was to identify predictors, such asstate-anxiety, reaction to tests, measures of anxiety and other noncognitive predictors.
Predicting Lawyer Effectiveness 623

can be defined and measured. One study examined the careers of Michigan Law Schoolalumni and compared the success (i.e., income, career satisfaction, and service contri-butions) of minority graduates with that of White graduates (Lempert, Chambers, andAdams 2000). Although the researchers did not explore professional performancedirectly, Lempert, Chambers, and Adams found that the LSAT and UGPA had “virtu-ally no value as predictors of post-law school accomplishments and success” (401–02).One reason for the paucity of research directly assessing, and then predicting, lawyerperformance is the difficulty in developing criterion measures of professional effective-ness. The fact that lawyers work in various settings and practice different specialtiespresents a daunting challenge for identifying common performance measures.
Legal Education and Professional Development: An Educational Continuum, theReport of the Task Force on Law Schools and the Profession: Narrowing the Gap (the“MacCrate Report”), is perhaps the most comprehensive statement of the skills requi-site for practicing law (American Bar Association 1992). The MacCrate Report iden-tifies ten skills and values as desirable for practitioners. These skills are (1) Problemsolving, (2) Legal analysis and reasoning, (3) Legal research, (4) Factual investigation,(5) Communication, (6) Counseling, (7) Negotiation, (8) Litigation and alternativedispute-resolution procedures, (9) Organization and management of legal work, and(10) Recognizing and resolving ethical dilemmas. The MacCrate Report suggested thatthis list of skills and values can be useful to practicing lawyers who want to evaluatetheir own professional capabilities and weaknesses. The critical issue, however, is thatthe report did not identify a way to measure the degree to which an attorney demon-strates these skills. Having a means or mechanism to systematically measure attorneys’performance on these skills could provide a basis for creating a measure of lawyeringperformance and a set of criteria to be used to validate tests with potential for predictinglawyering performance.
Other criteria for lawyer competencies are found in Baird et al. (1979). This reportidentified 20 characteristics for evaluating lawyers: (1) Ability to work well with clientsand groups; (2) Industry, initiative, independence, and effort; (3) Relationships withinthe firm or organization; (4) Speed, efficiency, and timeliness; (5) Research; (6) Generalwriting ability; (7) Responsibility, dependability, and reliability; (8) Analysis; (9) Judg-ment and common sense; (10) Creativity and adaptability; (11) Organization; (12)Knowledge of the law; (13) Oral presentation and communication skill; (14) Attitudeand willingness to work hard; (15) Supervisory ability; (16) Legal drafting; (17) Rela-tions with external groups and the community; (18) Thoroughness; (19) Quantity ofwork and results; and (20) Ability to accept and learn from supervision. This report, likethe MacCrate Report (American Bar Association 1992), emphasized factors that mightbe relevant to attorney effectiveness. However, after searching the literature and firms’practices, the report concluded that very little is known about techniques to measureperformance on the factors. Statements such as “Unfortunately, there is little discussionof how one could evaluate these qualities or their lack in the articles reviewed” (Bairdet al. 1979, 143) appear throughout the report. Where these researchers did find infor-mation regarding formal evaluation systems, they found that the majority of the systemsused devices, such as general rating scales or checklists, that were not very well defined.
Hough (1984), who analyzed the work of lawyers practicing at the Federal TradeCommission (FTC), discussed similar factors of lawyering effectiveness. From this
LAW & SOCIAL INQUIRY624

researcher’s analysis, eleven performance dimensions emerged: (1) Technical knowl-edge, (2) Researching/investigating, (3) Using knowledge, (4) Planning and organizing,(5) Writing, (6) Oral communications, (7) Working with others, (8) Assertive advo-cacy, (9) Working independently, (10) Hard work/dedication, and (11) Professionalism.
What is most notable about these studies is that they identify the critical factors ofattorney effectiveness but do not provide methods for measuring actual attorney per-formance on these factors. The one exception is the study by Hough (1984), who useda behavioral example strategy to identify and develop rating scales that could be used tomeasure and predict particular aspects of FTC attorney performance. However, this wasa limited sample of attorneys and a single practice setting.
Research on Employment Selection
Effective lawyering, like performance in many careers, relies on varied dimensionsof human intelligence. As traditionally used in psychometric testing, the category“cognitive” mainly encompasses academic and test-taking capability, especially verbaland numeric knowledge and reasoning. Substantial evidence shows that cognitiveability, in this sense, is a predictor of job performance (Sackett et al. 2001; Schmidt2002). However, other elements of intelligence—traditionally labeled “noncognitive”predictors but often referred to as “nonscholastic or nonacademic” (e.g., personality,interpersonal and communication skills, practical judgment, and creativity)—are alsovalid predictors of work performance. For example, some evidence suggests that thedegree of predicting a candidate’s performance in certain positions can be improved ifappropriate additional predictors, such as measures of social skills or personality traits,are used in combination with cognitive ability measures (Hunter and Hunter 1984;Guion 1987; Schmitt et al. 1997).
Research also shows that the inclusion of a broad range of work efficacy predictors,which combines valid noncognitive measures of performance with traditional cognitiveability tests, can minimize disadvantages to members of racial, gender, or ethnic groupsduring the selection process (Hunter and Hunter 1984; Ones, Viswesvaran, andSchmidt 1993; Schmitt et al. 1997). Generally, race/ethnic subgroup differences aresmaller, or nonexistent, on noncognitive measures, such as personality inventories.
Considerable research has been employed in the context of employment to iden-tify and validate a range of cognitive and noncognitive predictors of work effectiveness.The findings from this research can possibly inform measurement and selection pro-cesses that are more predictive of later work performance for a variety of populationsthan the use of more generic or extrinsic screening devices, like scholastic tests ordegrees. The following section summarizes a number of techniques found for assessingfactors predictive of worker effectiveness in various jobs and professions.
Personality and Related Constructs
Strong evidence suggests that certain dimensions of personality are useful inpredicting job performance. Generally, personality can be described as those traits,
Predicting Lawyer Effectiveness 625
states, and moods that are stable and enduring over time, and distinguish one personfrom another (Allport 1937). A broader conceptualization can encompass a person’sstrengths, weaknesses, values, and motivations (Hogan, Hogan, and Warrenfeltz 2007).Personality is important to performance because the degree to which an individual’spersonality fits within the requirements of a job or the values of an organization willhave a significant impact on both success and satisfaction (Chatman 1991; Kristof1996).
Much of the research on personality has embraced the Five-Factor Model (FFM;Big 5), which categorizes personality into five broad factors: Extraversion, Agreeable-ness, Conscientiousness, Neuroticism (Emotional Stability), and Openness to Experi-ence (Wiggins and Trapnell 1997; Saucier and Goldberg 1998). Early meta-analyticwork (Barrick and Mount 1991; Tett, Jackson, and Rothstein 1991; Salgado 1997)found that personality holds some utility for predicting job performance. Barrick andMount (1991) reviewed 117 studies and found personality-performance correlationsranging from .03 to .13 among the five facets of the FFM, with Conscientiousness beingthe strongest and most consistent predictor of job performance across professions. Morerecently, Hurtz and Donovan (2000) reexamined the relationship between personalityand job performance and found that the mean sample-size weighted correlations rangedfrom .04 to .14 across dimensions, again with Conscientiousness having the highestpredictive validity with performance. Conscientiousness is a general predictor of jobperformance, and other Big 5 traits predict job performance in specific types of jobs. Inother words, different jobs call for different personality profiles and strengths (Hogan,Hogan, and Roberts 1996). Research on the Big 5 also shows so little differentialvariation is found from scores on the Big 5 measurement across differing racial groups,which implies that there are few ethnic differences (Hough, Oswald, and Ployhart2001).
Reported correlations between Big 5 factors and job performance of .13 and .14 arerelatively small, but these findings mainly reflect bivariate relationships with criteria(Hurtz and Donovan 2000). Regressing the Big 5 factors (as a set) on job performanceshow coefficients ranging from .1 to .45. Furthermore, individual Big 5 personality traitshave specific facet-level characteristics that may have particular relationships with jobperformance and obscure the relationship of the higher-order personality dimensions tojob performance. For example, the facet of Conscientiousness has more specific facets,such as Order, Impulsivity, Cognitive Structure, Play, Endurance, and Achievement. Ifsome facets correlate negatively and others positively, the aggregate overall correlationof Conscientiousness to job performance may appear deceptively small (Tett, Steele,and Beauregard 2003). Such results call for examining performance and constructs at afiner level.
Situational Judgment
Understanding how potential employees would react in critical situations is impor-tant to predicting work performance. Situational Judgment Tests (SJTs) present descrip-tions of hypothetical job-related scenarios, asking respondents to pick how they wouldhandle the situation from a list of possible responses. The hypothetical situations are
LAW & SOCIAL INQUIRY626

often developed by asking professionals in the field what critical situations they encoun-ter in their jobs (Weekley and Ployhart 2005).
SJTs are often paired with traditional cognitive ability tests in applicant selectionsettings because they have significant criterion-related validity and possess incrementalvalidity beyond cognitive ability and personality measures (McDaniel et al. 2001; Chanand Schmitt 2002). For example, Chan and Schmitt (2002) found that the SJT had asignificant .30 correlation with overall job performance and had an incremental validityof .21 for overall performance. Weekley and Ployhart (2005) found that the SJT wascorrelated .21 with overall job performance and had a significant incremental validityof .18, above and beyond a cognitive ability test and a FFM personality inventory.Another important reason for the popularity of SJTs is that the results show fewerethnic variation than traditional cognitive ability tests (Clevenger et al. 2001).
SJTs are also drawing interest to predict student performance (judged by missionstatement and educational objectives) in undergraduate schools (Oswald et al. 2004).Oswald et al. (2004) showed that the SJT has validity above and beyond cognitiveability and personality measures for predicting college performance. Also in this study,scores on the SJT showed no significant differences across different ethnicities of sampleparticipants.
Biographical Information Data
Past performance is often the best predictor of future performance. Biographicalinformation data measures (BIO) offer structured and systematic methods for collectingand scoring information on an individual’s background and experience (Mumford1994). Items vary both in the nature of the constructs measured (e.g., past attitudes,experiences) and in the type of response scale (e.g., frequency of behavior, amount,degree of agreement). Research has shown that BIO scales can predict both collegeGPA and job performance, and reflect fewer ethnic differences than standardized tests,such as the Scholastic Aptitude Test (SAT; Oswald et al. 2004).
Dispositional Optimism
Dispositional optimism refers to a generalized tendency to expect positive andfavorable outcomes in the future; conversely, pessimism refers to a tendency to expectnegative things happening in the future (Carver and Scheier 1981). Optimism has beenrecognized as a fundamental component of individual adaptability because of its rela-tionship with stress resilience and coping (Scheier and Carver 1992; Hobfoll 2002).
Optimists are more confident and persistent when confronting any challenge,while pessimists are more doubtful and hesitant (Carver and Scheier 2002). Someresearch indicates that optimism predicts lower levels of stress and depression forstudents making the transition to their first year of college (Aspinwall and Taylor 1992;Brissette, Scheier, and Carver 2002). In terms of job performance, evidence suggeststhat dispositional optimism has a unique impact on both self-reported job performanceand organizational performance appraisals (Youssef and Luthans 2007).
Predicting Lawyer Effectiveness 627
Self-Monitoring
Self-monitoring of expressive behavior and self-presentation are critical non-cognitive factors for future job performance. Individuals with a high degree of self-monitoring are good at learning what is socially appropriate in new situations, havegood self-control of their emotional expression (facial and verbal) and can effectivelyuse this ability to create the impressions they seek to create (Snyder 1974; Snyder andGangestad 1986). Some evidence suggests that high self-monitors have more careermobility and success (Kilduff and Day 1994) as well as higher ratings of job performance(Caldwell and O’Reilly 1982; Caligiuri and Day 2000).
Emotion Recognition
A final noncogntive factor found to predict work performance is emotional intel-ligence or recognition. This factor is defined as the ability to regulate one’s ownemotions and to perceive/understand others’ emotions (Goleman 1995). Some studiessuggest that emotional intelligence predicts student performance (Lam and Kirby 2002)as well as job performance (Slaski and Cartwright 2002; Law, Wong, and Song 2004).Questionnaires have typically been used to measure emotional intelligence throughpresenting situations to respondents and prompting for the desired response frommultiple options (Salovey et al. 1995). Ekman (2004) used a different and less verbalapproach; based on extensive research, Ekman has developed a visual test to assessindividuals’ speed and accuracy in recognizing various emotions on slides of faces.
Summary
The literature on noncognitive predictors suggests that there is potential for theprediction of performance in the domain of lawyering. The performance factors perti-nent to lawyering have similar underlying constructs that are measured in variouspredictors. The purpose of the research is twofold. The first phase is to identify thefactors that define lawyering performance and develop a method to measure effective-ness; the second phase is to identify and develop potential predictors of those lawyeringfactors and to study their validity in predicting lawyering performance.
RESEARCH PHASE ONE: DEFINING AND MEASURINGLAWYER EFFECTIVENESS3
The first phase of this research design consists of identifying, defining, and creatingmeasurable dimensions of lawyering effectiveness, followed by obtaining behavioralexamples of each dimension that illustrate different levels of effectiveness on eachperformance dimensions.
3. For greater detail on Phase One methods, sample, and results, see Shultz and Zedeck (2003).
LAW & SOCIAL INQUIRY628

Factors and Scales
Our research sought to predict professional effectiveness in terms of the tasks andskills lawyers perform in their daily profession, as opposed to trying to predict othermeasures of success, such as salary, attempts at bar passage, and time to make partneramong others. To accomplish our goal, we first had to identify the components that areimportant to (i.e., can define) lawyer effectiveness. These factors then became thecriterion measures for our study. For this stage of our work, we also needed to createinstruments that could be used to assess a lawyer’s degree of professional effectiveness ina systematic, structured, and standardized manner. We carried out both of these tasksusing a behaviorally anchored rating scale (BARS) methodology (Smith and Kendall1963) that has been frequently used to establish performance measures in organizationalsettings.
In our initial study (Shultz and Zedeck 2003), we identified factors important forlawyer effectiveness by interviewing individuals (n = 133) within five stakeholdergroups associated with Berkeley Law: alumni (n = 62, across three cities), clients (n = 6,plus reading their consumer complaints), faculty (n = 10), students (n =5 1), and judges(n = 4) (Shultz and Zedeck 2003). We posed questions to the stakeholders, such as thefollowing to obtain effectiveness data: “If you were looking for a lawyer for an importantmatter for yourself, who would you identify, and why? What qualities and behaviorwould cause you to choose that attorney? What kind of lawyer do you want to teach orbe?” From these interviews and focus groups 26 factors important to lawyering effec-tiveness emerged (see Table 1).
Following, in new rounds of focus groups with law school alumni (n = 87, acrossthree cities, working with one factor at a time, we asked participants for specificexamples of attorney behaviors within each construct (“What behavior would tell youthat a particular lawyer had or lacked effectiveness on the Client Advice and Relationsfactor?”). We obtained more than 800 behavioral examples that were offered by indi-vidual participants to represent poor, below average, average, good, and outstandingbehaviors across the 26 factors. This part of the research enabled us to create effective-ness factor rating scales that represent different levels of performance (ranging from “1”to “5”).
Then, using Berkeley Alumni Office e-mail contact information for graduates(1970–2002), we systematically studied the levels of effectiveness (as viewed by thosewho responded) by administering an online survey asking alumni to rate (subsets of) theoriginal raw, unrated behavioral examples from the preceding focus groups. We askedsurvey respondents to rate examples on a five-point, Likert scale, anchored by 1 = poorand 5 = outstanding, according to how effective they thought the stated behavior wasas an illustration of a given effectiveness factor.
Description of Survey Sample
The sample for the online survey was obtained from the 9,555 alumni population(from the Alumni Office database) who graduated between 1970 and 2002. We sent ane-mail request for participation to those who had e-mail addresses on file and hard copy
Predicting Lawyer Effectiveness 629

mailing to postal addresses for the remaining, which generated a total sample of 2,012respondents. The responding sample was slightly more male, heavily White, and evenlydivided among three age groups (30–39, 40–49, and 50–59) and four categories of yearsof practice experience (1–5, 6–10, 11–20, and over 20 years). Representativeness of thesample is not easy to determine with exactness, given limitations in available data aboutall graduates over this period;4 however, we found that the gender and racial backgroundseemed to be fairly representative of the law school’s population. Aggregate data from1971 to 2002 show a population of entering students that was 55 percent male and 45percent female, which is fairly representative of our sample (57 percent male; 42 percentfemale). Similarly, based on self-identification, our respondents’ group was 75 percent
4. Our sample began with graduates from 1970; racial information on these students at the time theyenrolled at Boalt in 1967 is not available. Similarly, the aggregate admissions data cited above includestudents admitted and enrolled in the fall of 2002 whereas the most recent graduates in our sample wouldhave enrolled in the fall of 1999. Nonetheless, there is a substantial amount of continuity in the two poolsand approximations about representativeness are appropriate.
TABLE 1.List of 26 Effectiveness Factors
Factors Identified as Important to Lawyer Effectiveness
Analysis and ReasoningCreativity/InnovationProblem SolvingPractical JudgmentResearching the LawFact FindingQuestioning and InterviewingInfluencing and AdvocatingWritingSpeakingListeningStrategic PlanningOrganizing and Managing One’s Own WorkOrganizing and Managing Others (Staff/Colleagues)Negotiation SkillsAble to See the World Through the Eyes of OthersNetworking and Business DevelopmentProviding Advice & Counsel & Building Relationships with ClientsDeveloping Relationships within the Legal ProfessionEvaluation, Development, and MentoringPassion and EngagementDiligenceIntegrity/HonestyStress ManagementCommunity Involvement and ServiceSelf-Development
Note: Adapted from Shultz and Zedeck (2003).
LAW & SOCIAL INQUIRY630

White, 4 percent African American, 5 percent Latino, and 10 percent Asian/PacificIslander. These racial percentages are comparative to school enrollment data for stu-dents from 1971 to 2002: 72 percent were White, 8 percent were African American, 10percent were Latino, and 9 percent were Asian/Pacific Islander.
Analysis of Survey Data and Results
To analyze responses, we first calculated means and standard deviations (SDs) foreach behavioral example. The mean value indicates the assessed level of effectiveness foreach factor example. The standard deviation provides a measure of agreement amongthe respondents. For instance, if an example had a standard deviation of 0, it wouldindicate that all the respondents assigned the same value for the level of effectiveness,and we would conclude that the assessment of effectiveness level was not affected by therespondent’s type of practice, years practicing, gender, etc. On the other hand, a standarddeviation of 2.00, for an example, with a mean value of 3.00 would indicate that themajority of respondents provided values that ranged from 1.0 through 5.0, indicating lessagreement about the assessed level of effectiveness. High standard deviation values canbe further examined to determine if the disagreement can be explained by type ofpractice, or number of years in practice, or gender, or other respondent backgroundcharacteristics. We adopted an a priori rule, one used in similar research projects (Zedeck,Jacobs, and Kafry 1976; Zedeck, Kafry, and Jacobs 1976), that a standard deviation of lessthan 1.0 would represent “general agreement” among the respondents.
Approximately 674 out of the 715 examples, or about 94 percent of the examples,had standard deviations of less than 1.0. This means that respondents showed generalagreement about the level of effectiveness with respect to almost all of the examples. Anumber of behavioral examples within a specific effectiveness factor had the same meanvalue (i.e., there were several examples with a mean of 2.00, or 3.00, etc., and each withstandard deviations less than 1.0). This pool of “surviving items” allowed us greatflexibility in developing rating scales, choosing examples, and tailoring scales to fitparticular needs (e.g., to focus on particular types of practice). For example, because foreach level of the scale we had multiple examples that tapped different types of practice,we could develop scales for a factor such as “Analysis and Reasoning” that was mostappropriate for litigation, as well as another scale for the same factor that was mostappropriate for transactional law. Also, the number of examples used to define the scalevaried from five to nine, providing sufficient detail for the rater to capture the essenceof the effectiveness factor.
The results of this analysis suggest general agreement across the total sampleconcerning the constructed effectiveness factors and their scaled behavioral examples.Despite this, we employed additional analyses to investigate whether differences orpatterns of differences were noted as a function of gender, race, years in practice, andtype of practice. These analyses examined differences either in means or standarddeviations. Differences between means would suggest that the groups of interestdiffered, on average, in terms of their assessments about “level of effectiveness.”Differences between standard deviations would suggest within-group differences aboutlevel-of-effectiveness judgments. Given overall results showing high agreement for the
Predicting Lawyer Effectiveness 631

total sample across 94 percent of the examples, we did not expect many instances ofdifferences, nor did we find many.
Summary of Phase One
In Phase One, through interviews and focus groups, we first identified 26 factorsdeemed important to lawyer effectiveness. Next, again using focus groups and inter-views, followed by a survey to which more than 2,000 Berkeley alumni responded, weconstructed 26 BARS to be used in measuring individual lawyer performance. One setof 26 BARS was used in the next phase of the research. Each effectiveness factor wasgeneral and diverse in terms of the types of behaviors required in different types ofpractice. This strategy was used to accommodate the practice diversity of the populationthat would participate in the next phase; instructions to the raters allowed the rater touse the BARS as a frame of reference.
We assumed that all 26 factors were distinct from one another and did not subjectthem to a factor analysis for determination of an underlying performance construct. Wedid this because we wanted to be able to differentiate particular aspects of lawyeringperformance. Also, we judged it important for future application to facilitate rating ofspecific performance criteria as opposed to a general performance measure.5
RESEARCH PHASE TWO: SELECTING AND VALIDATING NEWPREDICTORS OF LAWYER EFFECTIVENESS
With factors important to lawyer effectiveness and performance measurementscales from Phase One in hand, our task now became whether we can predict workperformance using noncognitive scales. Phase Two required multiple steps. We firstselected and developed noncognitive scales hypothesized to predict performance scoreson the 26 BARS or factors. Following, we administered these scales to participants aswell as collected measures of participants’ prior academic achievement; a discussion ofthe participants in this study is presented in the next (i.e., Results) section. Next, weasked supervisors, peers, and participants themselves to evaluate participants’ profes-sional performance on the effectiveness factor scales. Finally, we analyzed whethernoncognitive test scores correlate with lawyering performance and can explain morevariance of employees’ performance appraisals than their prior academic achievement.
Tests and Scales Identified, Selected, and Developed
Critiques of existing law school admission practices emphasize two significantshortcomings: (1) current methods focus excessively on predictors of academic perfor-
5. As a conceptually meaningful grouping, we placed the 26 effectiveness factors into eight categories,and use these in the tables of results, for presentation purposes: (1) Intellectual and Cognitive; (2) Researchand Information Gathering; (3) Communications; (4) Planning and Organizing; (5) Conflict Resolution;(6) Client and Business Relations; (7) Working with Others; and (8) Character.
LAW & SOCIAL INQUIRY632
mance, ignoring the importance of professional effectiveness as a desirable outcomecriterion; and (2) current methods can produce a significant adverse impact on minoritygroup applicants’ chances of admission. Our research goal was to address both of theseproblems by developing nonacademic predictor tests of professional performance, withthe hope of offering a methodology that could eventually be incorporated into lawschool admission decision making.
Our earlier summary of relevant literatures provided background about nonscho-lastic predictors used in employment selection. Below we describe the tests selected,developed, and used in our research that might serve as possible supplements or comple-ments to the academic performance measures—LSAT, UGPA, and Index—that cur-rently dominate law school admission decisions.
Personality Measures
In the literature review, we noted how certain personality constructs and theirmeasures can predict work performance. When selecting tests that would capturepersonality elements relevant to our 26 lawyer effectiveness factors, we sought threetypes of measures: (1) questions that measured an individual’s ability to get along withothers, (2) questions that identified individuals’ interest in and satisfaction with theirjobs, and (3) questions that recognized tendencies that are counterproductive to careersuccess.
To measure collegiality, as well as occupational success, we used the Hogan Per-sonality Inventory (HPI; Hogan and Hogan 2007), a measure based on the Five-FactorModel that is designed specifically for use with working adults. The HPI is composed of206, true/false, self-report items. Seven primary personality scales are scored on the HPIon the basis of Hogan and Hogan’s (1991) reinterpretation of the Five-Factor model:Adjustment, Ambition, Sociability, Interpersonal Sensitivity, Prudence, Inquisitive,and Learning Approach.6 Interpretation of HPI results is job-specific, with no formulafor a “good” personality. High and low scores on scales are not necessarily better, andscores that lead to success in one job may hinder performance in another. Table 2presents the descriptions of these seven scales.
Also central to our analysis was predicting a person’s success and satisfaction withthe job, which, in this case meant finding a set of interests, motives, and goals conduciveto work in the legal profession. Generally, people prefer to work with others who sharesimilar values and within compatible organizational cultures (Chatman 1991; Kristof1996). Characteristics compatible with and conducive to legal work are presumed to berelated to almost all of the lawyer effectiveness factors identified in Phase One in thatthey reflect a match between the job holder and the requirements of the job andorganization in which one is employed. We measured this set of “personality” constructsby administering the Motives, Values, Preferences Inventory (MVPI; Hogan and Hogan1996). The MVPI directly assesses a person’s motives, shows the relative importance ofvarious values, and makes possible an evaluation of the fit between an individual and
6. The main difference between the HPI and the five-factor model is that it divides extraversion intoadjustment and ambition and divides openness into inquisitive and learning approach.
Predicting Lawyer Effectiveness 633

the organizational culture (Hogan and Hogan 1996). The MVPI has 200 items thatcomprise 10 primary scales: Aesthetic, Affiliation, Altruistic, Commerce, Hedonism,Power, Recognition, Science, Security, and Tradition. High scores (65 percent andabove) indicate those values and drivers that are most important to individuals. Therelative degree of person-job fit can then be determined by comparing a person’s higherscores on the MVPI with the values of the organization and profession
Finally, we included the Hogan Development Survey (HDS; Hogan and Hogan1997), a measure of behavioral tendencies that can “derail” a person’s career success(Bentz, 1985). These counterproductive behaviors are relatively stable over time; theyaim to predict certain performance risks that can interfere with a person’s ability tobuild relationships and collaborate with others in a work atmosphere (Hogan andHogan 1997). The HDS has 168 items that comprise 11 primary scales: Excitable,Skeptical, Cautious, Reserved, Leisurely, Bold, Mischievous, Colorful, Imaginative,Diligent, and Dutiful. Because the scores on the HDS scales measure personalitycharacteristics that can be negative in employment settings, higher scores on an HDSscale increase the chances that counterproductive work behaviors will be problematicfor that specific performance risk.
Situational Judgment Test (SJT)
Measures of an individual’s judgment about and reaction to difficult situations areimportant to work performance. Assessment of situational judgment is done throughuse of hypothetical scenarios. In developing an SJT for this project we first workedindividually and then collaboratively, writing approximately 200 hypothetical situa-tions we believed would reflect one or more of the 26 effectiveness factors. We reviewedsome preexisting SJT items (Camara 2006; Motowidlo 2006) to stimulate scenario ideas
TABLE 2.Desciription of the Seven Subscales in the Hogan Personal Inventory (HPI)
HPI Subscale Description (and Relation to Five-Factor Model Subscale [FFM])
Adjustment Reflects the degree to which a person is steady in the face of pressure, orconversely, moody and self-critical (FFM: Emotional Stability).
Ambition Evaluates the degree to which a person seems leader-like, status-seeking, andachievement-oriented (FFM: Extraversion).
Sociability Assesses the degree to which a person needs and/ or enjoys social interaction(FFM: Extraversion).
InterpersonalSensitivity
Reflects social sensitivity, tact, and perceptiveness (FFM: Agreeableness).
Prudence Concerns self-control and conscientiousness (FFM: Conscientiousness).Inquisitive Reflects the degree to which a person seems imaginative, adventurous, and
analytical (FFM: Openness).Learning
ApproachReflects the degree to which a person enjoys academic activities and values
education as an end in itself (FFM: Openness).
LAW & SOCIAL INQUIRY634
for our project as well as to identify and adapt those that we might use; most of the finalitems were newly written for our project. For each item, we developed four to fiveanswer options representing a range of viable responses. We pilot-tested created itemswith practicing lawyers, for the purposes of checking appropriateness, relevance, andreasonableness, and chose seventy-two SJT items for administration. To determine thescoring key, we used an empirical key (a version of “cross-validation”) based onresponses from participants as well as on hypothesized relationships with our effective-ness factors.
Biographical Information Data (BIO)
From prior research, we assumed that targeted information about personal historywould be predictive of all the factors. Again, we individually and then collaborativelywrote approximately 200 BIO items to cover each of the 26 effectiveness factors. Aswith the SJT, we first reviewed existing BIO measures (Camara 2006; Motowidlo 2006),adapted some for lawyering performance, and wrote most items as originals. We devel-oped four to five answer options to represent a range of viable responses, and afterpilot testing the items with practicing lawyers, we chose eighty BIO questions foradministration. Here, too, we developed an empirical scoring key (a version of“cross-validation”) based on responses from participants, as well as on hypothesizedrelationships with the effectiveness factors.
Dispositional Optimism (OPT)
Optimism may be a valuable resource for lawyers who face great time demands,high job insecurity, considerable conflict, and poor organizational climate (Scheier andCarver 1985; Goldhaber 1999; Heinz, Hull, and Harter 1999; Schiltz 1999; Makikangasand Kinnunen 2003; Xanthopoulou, Bakker, and Schaufeli 2007). To measure optimism(OPT), we used the Revised Life Orientation Test (LOT-R; Scheier, Carver, and Bridges1994), which assesses generalized outcome expectations, with higher scores indicatinga more optimistic overall outlook on life (Scheier and Carver 1985; Scheier, Carver,and Bridges 1994). The LOT-R consists of six items, three of which assess optimism andthree reverse-scored items that measure pessimism, plus four filler items on five-pointLikert scales.
Self-Monitoring (SMS)
Self-monitoring is potentially salient to effective lawyering because of lawyers’distinctive professional responsibilities of speaking for and representing clients ratherthan themselves (i.e., role morality). To assess self-monitoring, we used the Self-Monitoring Scale (SMS), which is a twenty-five-item, true-false scale that assesses anindividual’s tendency to monitor and adapt self-expression (Snyder 1974). We used thestandard questions and scaling of this measure, although we slightly reworded somequestions in ways we hoped would increase their relevance to lawyers.
Predicting Lawyer Effectiveness 635
Emotion Recognition (ER)
We hypothesized that emotional intelligence could be important to lawyers whomust “read” and manage interactions with clients, juries, witnesses, judges, opponentsand colleagues. We modeled our Emotion Recognition Test (ER) after the Facial ActionCoding System (FACS) developed by Ekman (2004). We used stock color photos ofneutral and emotional facial expressions that had been developed in the laboratories ofemotion researchers as stimuli (Ekman 2004; Keltner 2006). Our ER test was a twenty-minute, computerized presentation of faces of different people expressing one of tenemotions: Anger, Compassion, Contempt, Disgust, Embarrassment, Fear, Happiness,Sadness, Shame, and Surprise. The ER instrument included two practice items andseventy-six test items. In each item, participants saw (1) a neutral facial expression,followed by (2) a very brief (1/6 second) change in expression reflecting one particularemotion, and (3) a return to the initial expression. Participants then had five secondsto choose which of the ten emotions appeared during the changed facial expression.Instructions told participants to respond based on their first impression—even if theydid not think they observed a change, or were unsure of the emotion expressed. Facesincluded individuals of various ethnic backgrounds and genders.
Academic Performance Data
To compare our noncognitive tests with conventional admission indicators, weneeded academic history data on those who took the new tests. Based on participantconsent and law school permission, we obtained LSAT scores, undergraduate GPA, andlaw school GPA from either the LSAC or files at two law schools. We had to rescale theLSAT and Index scores for two reasons. First, because our sample, described in the next(i.e., Results) section, included graduates from a thirty-three-year period, the LSATscoring scale has changed three times over this period. Accordingly, we standardizedLSAT scores within each period. Second, the two schools’ weighting of the componentsof the Index score varied between and over time. Accordingly, we decided for purposesof this research to weight LSAT and UGPA information 50-50 throughout.
Data Collection Procedure
Data collection began by e-mailing an invitation to each potential participant.The e-mail included an online link where the new battery of tests was presented. Eachindividual accessing the website had an individual user ID and password for datamanagement purposes. Invitations informed participants that the total process wouldtake up to 120 minutes. We asked participants to indicate acceptance after reading adetailed consent form tailored to the requirements of and with the approval of theBerkeley Committee for the Protection of Human Subjects. Confidentiality commit-ments were explained next. Participants were then asked to provide background infor-mation about their academic history, law school, demographics, work tasks, practice
LAW & SOCIAL INQUIRY636

area, type and size of employer organization, and other relevant information. They wereable to enter and leave the website at will, saving previous work.
The computer then randomly and evenly directed each participant to one of fortydifferent combinations of tests from the battery that we created. Every participant’scombination included the HPI and two to three of the other tests (either the whole ora portion of the test’s items). One participant might take the HPI, HDS, BIO, and OPTdisposition scales. Another might do the HPI, MVPI, and SJT. And yet anotherparticipant might take the HPI, BIO, and ER. As a result, of course, the HPI had thelargest sample size.
We administered the HPI to all participants as an inducement to participate. As abenefit of taking the research tests, participants could opt to receive a confidentialinterpretive report of their occupationally relevant strengths and shortcomings based ontheir responses to the HPI. As a further incentive, participants could register for up tothree continuing education credit (MCLE) units—two for “law practice” credit and onefor “elimination of bias” credit. The bias unit required that participants read materialswritten by the researchers regarding adverse impact in selection processes, followed bya short true/false quiz.
Performance Appraisals
Because our research sought to determine whether the tests we developed oridentified can explain actual on-the-job effectiveness, we needed appraisals of ourparticipants’ legal performance. Accordingly, after they completed the new test battery,we asked each participant to evaluate his/her own lawyering effectiveness and, impor-tantly, to identify four other evaluators—two supervisors and two peers (with contactinformation)—who knew and could assess the participant’s recent lawyering perfor-mance using the 26 BARS constructed in Phase One. The customized software con-tacted named evaluators and asked them to fill out and return appraisals online.
Instructions directed raters to select the score (ranging from 1 to 5 in .5 incre-ments, with 1 = poor and 5 = excellent) that best represented the participant’s level ofwork performance on each of the 26 factors rated. All raters were instructed to rate asmany effectiveness factors as possible, but to skip those not relevant to the job or aboutwhich their knowledge was insufficient. The computer request for rater appraisalsprovided detailed instructions about how to use the BARS. The directions told ratersthat the particular examples on any scale might not apply to the participant’s work orsetting, but that they should use the examples by analogy to illustrate levels of perfor-mance. Figure 1 is an example BARS for “Analysis and Reasoning.”
To understand use of a BARS form, note that the lowest level example for the“Analysis and Reasoning” factor illustrated in Figure 1 reads, “Over-simplifies argu-ments . . . .” Instructions directed appraisers to read scales “from the bottom up,” askingthemselves, “Based on my observation and knowledge of this individual’s performance,do I believe he or she performs or could perform at the level of effectiveness reflected inthis particular example?” When the raters came to a level of effectiveness that theybelieved the individual cannot or could not achieve, they were to mark a value (inhalf-point increments) that represented the highest level that the rater believed the
Predicting Lawyer Effectiveness 637

participant achieves or could achieve. Instructions asked raters to apply the standardbased on the individual ratee’s actual level of experience. For instance, the rater mightrate someone with ten years of experience a “2” on a given BARS but evaluate that samebehavior as a “3” for someone with less experience.
In this article, we calculate employees’ appraisal results by combining peer andsupervisor averages (coined hereafter as “other ratings”). Although we evaluatedvarious other combinations of five potential ratings viewpoints, statistical analysisshowed that use of the other ratings combinations did not change the bottom-lineconclusions of the research.7
RESULTS AND DISCUSSION
This section of the article describes the sample used in the validation phase of theresearch, the correlations between the test measures and academic and lawyeringperformance, and the contribution of noncognitive tests to the prediction of lawyeringperformance.
7. Barrett (2008) analyzed the project’s ratings within rater groups. He concluded that averaging thepeer ratings as well as averaging the supervisor ratings was reasonable; also, the two averages could beaveraged to yield a rating referred to as “Other.” See Shultz and Zedeck (2008) for a complete presentationof intercorrelations among all performance perspectives.
FIGURE 1.Example of “Analysis & Reasoning” Effectiveness Scale
LAW & SOCIAL INQUIRY638
Description of Survey Sample
Data for this phase came from 1,148 alumni of Berkeley Law and Hastings Collegeof the Law who graduated between 1973 and 2006 (for whom the schools had contactinformation; n = 15,750). In order to include the varied law-related jobs held by lawgraduates, we instructed recipients of the invitation that they could participate if theyhad practiced law in the past three years or were in a law-related job—defined as onewhere law training was relevant to the performance of the job or had played a role intheir selection for it (e.g., Chief Executive Officer (CEO) of a poverty assistancenonprofit). In addition, with a potential of five performance evaluations per participant(self, two peers, two supervisors) the number of possible appraisals is 5,740. We receivedmore than 4,000 appraisals (approximately 70 percent of the possible number) despitethe fact that supervisors and peers may well have had no connection to the two lawschools.
Overall, the sample was composed of mainly Berkeley (64.3 percent), female (56.8percent), White (68.5 percent) practicing attorneys, with the largest number employedin large firm (16.6 percent) or government (13.7 percent) practice. The most frequentspecialization was litigation/advocacy (29.1 percent), but all areas of expertise wererepresented in the sample. In terms of differences by school—Berkeley versusHastings—the demographic and professional backgrounds were similar to the overallprofile except that Berkeley alumni were more likely to work in large firms or govern-ment positions, while more Hastings alumni worked in solo or small firm practice orgovernment positions.8
Table 3 presents descriptive statistics on the prior academic achievement (i.e.,their LSAT score, UGPA, and combined Index score) of the total sample, as well asdisaggregations by law school, gender, and race/ethnicity. Berkeley participants hadhigher UGPA and LSAT scores. Males showed no pattern of practical differencescompared to females, but Whites and Asians had a pattern of higher test scorescompared to African Americans and Latino participants. Given the general similarityin results between the two schools, we report subsequent validity results for the com-bined total sample.
Conventional LSAC Measures: Predictors of FYGPA
To compare our sample with previous studies of admission assessment, we exam-ined the relationship between our participants’ prior academic achievement and theirgrades in first year law school. For the current sample, results showed reasonableconsistency with prior research (Dalessandro Stilwell, and Reese 2005; Norton Suto,and Reese 2006). The correlations between LSAT, UGPA, and Index score, respec-tively, and FYGPA in law schools were .42, .21, and .42.
8. A table with a full breakdown of demographics by school is available from the authors.
Predicting Lawyer Effectiveness 639

TA
BL
E3.
Tes
tan
dSc
hool
-Bas
edP
erfo
rman
ceM
easu
res
bySc
hool
,G
ende
r,an
dE
thni
city
Tot
al
Scho
olG
ende
rE
thni
city
**
Has
ting
sB
erke
ley
Fem
ale
Mal
eW
hite
Afr
ican
-A
mer
ican
Lat
ino
Asi
an/P
acifi
cIs
land
er
UG
PAM
ean
3.46
3.34
3.50
*3.
483.
42*
3.51
3.10
3.27
3.51
N11
4140
973
264
849
378
387
8712
8SD
0.36
0.36
0.34
0.35
0.37
0.33
0.40
0.39
0.33
LSA
Tsc
ore
(Zsc
ore)
Mea
n0.
00-0
.31
0.17
*-0
.06
0.08
*0.
29-1
.27
-0.9
7-0
.12*
**N
1126
401
725
636
490
775
8685
123
SD1.
000.
861.
031.
020.
970.
810.
901.
070.
97L
SAT
10–4
8M
ean
41.2
339
.93
41.8
0*40
.68
41.9
9*42
.54
34.9
635
.90
41.5
2N
274
8319
115
811
619
623
2021
SD4.
623.
864.
814.
814.
253.
474.
056.
164.
13L
SAT
120–
180
Mea
n16
3.59
161.
5116
4.85
*16
3.17
164.
4816
5.39
156.
7315
8.33
163.
20**
*N
412
156
256
282
130
257
3030
70SD
6.93
5.75
7.28
6.99
6.74
6.32
6.21
6.97
6.22
LSA
T20
0–80
0M
ean
660.
3662
9.90
678.
12*
659.
4366
1.11
687.
8453
0.70
567.
1162
7.97
***
N44
016
227
819
624
432
233
3532
SD88
.77
80.6
188
.62
90.8
887
.23
66.1
677
.42
84.0
599
.31
50/5
0In
dex
(Zsc
ore)
Mea
n-0
.12
-0.7
60.
23*
-0.1
1-0
.13
0.32
-2.4
1-1
.57
-0.0
9***
N11
2140
072
163
348
877
286
8512
3SD
1.55
1.34
1.55
1.56
1.55
1.24
1.48
1.56
1.40
1stye
arL
GPA
Mea
n2.
782.
882.
72*
2.75
2.81
2.93
2.23
2.28
2.63
***
N10
7239
168
160
546
772
781
8812
2SD
0.62
0.50
0.68
0.61
0.63
0.61
0.35
0.43
0.56
*si
gnifi
cant
diffe
renc
e(p
<.0
5)be
twee
nH
asti
ngs/
Ber
kele
yan
dbe
twee
nFe
mal
e/M
ales
**A
lldi
ffere
nces
betw
een
Whi
tes
and
Afr
ican
-Am
eric
ans
and
betw
een
Whi
tes
and
Lati
nos
are
sign
ifica
nt(p
<.0
5)**
*si
gnifi
cant
diffe
renc
esbe
twee
nW
hite
san
dA
sian
/Pac
ific
Isla
nder
LAW & SOCIAL INQUIRY640

Conventional LSAC Measures: Predictors of Professional Performance
For informational purposes, we wanted to determine the extent to which conven-tional measures predict lawyer effectiveness. Significant positive correlations (seeTable 4) existed between only 8 out of our 26 effectiveness factors and the LSATmeasures; those found were fairly weak, ranging from .07 (Problem Solving) to .15(Writing). Correlations existed mainly where our effectiveness factors overlap withskills the LSAT specifically seeks to measure. However, we also found that two factors—Networking and Community Service—were negatively correlated with the LSAT(r = -.12 and -.10, respectively).
The correlations between the Index score and effectiveness factors generally par-alleled those found for the LSAT. UGPA results showed fewer significant correlationsthan LSAT scores. UGPA correlated best with Writing (r = .12), Managing Self andDiligence (both r = .09), and Integrity (r = .07). Differences in the number of significantcorrelations of UGPA and LSAT may reflect that the LSAT is a one-day test, but UGPAdepends on persistence and the ability to manage and apply oneself for his/ her collegecareer. Diligence, time spent, and management of work could more readily substitute for“smartness” in the UGPA measure than in obtaining higher LSAT scores.
In sum, the LSAT, UGPA and Index were correlated with relatively few of theeffectiveness factors, mainly ones that overlapped with the LSAT’s measurementtargets. For example, the LSAT aims to evaluate analysis and reasoning and it correlatedwith performance appraisals of participants’ “Analysis and Reasoning.” The LSAT andUGPA were not intended to predict lawyering effectiveness. However, given theresearch project’s argument that projections about lawyering effectiveness should beadded to academic indicators when selecting the best qualified law school applicants,the important finding is that, for the most part, the LSAT/academic predictors corre-lated with a very small subset of lawyer effectiveness factors.
New Measures as Predictors of Academic Performance
In general, the new predictors showed few significant correlations with FYGPA; ofthose that did exist, many, especially BIO, HPI scales, and OPT disposition, werenegative.9 For example, BIO correlated -.09 with FYGPA. The HPI results show thatfive (Adjustment, Ambition, Sociability, Interpersonal Sensitivity, and LearningApproach) of the seven scales correlated significantly with FYGPA, with the correla-tions ranging from .07 to .21. Of interest, however, was that except for LearningApproach, all had negative correlations with FYGPA. OPT disposition correlated -.08.With the remaining scales, SJT did not significantly correlate with FYGPA. Of the 11HDS scales, only Excitable correlated (.16) with FYGPA; of the 10 MVPI scales, onlyHedonistic correlated (-.15) with FYGPA. SMS showed no significant correlation andER correlated .08.
To determine whether any of the new predictors would yield incremental validityto prediction of FYGPA beyond that which is obtained by the LSAT alone or by the
9. A complete table of correlations between the new tests and FYGPA is available from the authors.
Predicting Lawyer Effectiveness 641

TA
BL
E4.
UG
PA,
LSA
T,
IND
EX
,an
dFY
GPA
Cor
rela
tion
sw
ith
Per
form
ance
Ana
lysi
s&
Rea
soni
ngC
reat
ivit
yP
robl
emSo
lvin
gP
ract
ical
Judg
men
tR
esea
rchi
ngL
awFa
ctFi
ndin
gQ
uest
ion
&In
terv
iew
Influ
ence
&A
dvoc
ate
Wri
ting
Spea
king
Lis
teni
ngSt
rate
gic
Pla
nnin
gM
anag
ing
Self
Man
agin
gO
ther
s
UG
PA0.
048
0.02
30.
039
0.01
20.
014
0.03
4-0
.005
0.01
4.1
19(*
*)0.
013
0.01
70.
029
.086
(**)
0.05
9L
SAT
.116
(**)
.092
(**)
.069
(*)
0.02
8.0
97(*
*)0.
036
-0.0
450.
029
.150
(**)
0.00
2-0
.045
0.02
40.
040
0.00
8IN
DE
X.1
05(*
*).0
74(*
).0
68(*
)0.
022
.072
(*)
0.04
6-0
.035
0.03
1.1
73(*
*)0.
008
-0.0
160.
036
.080
(*)
0.03
9FY
GPA
.123
(**)
.100
(**)
.099
(**)
0.04
8.1
19(*
*)0.
060
0.01
50.
053
.127
(**)
0.02
60.
006
.086
(*)
0.05
20.
017
Neg
otia
tion
Eye
sof
Oth
ers
Net
wor
king
Adv
isin
gC
lient
sD
evel
opin
gR
elat
ions
hips
Eva
l,D
evel
op&
Men
tor
Pas
sion
Dili
genc
eIn
tegr
ity
Stre
ssM
anag
emen
tC
omm
unit
ySe
rvic
eSe
lfD
evel
opm
ent
Avg
Acr
oss
UG
PA0.
026
0.02
7-0
.014
0.00
6-0
.003
0.03
80.
007
.093
(**)
.067
(*)
0.01
5-0
.015
0.00
70.
043
LSA
T-0
.030
-0.0
48-.
122(
**)
-0.0
54-0
.029
-0.0
24-0
.046
0.06
3.0
89(*
*)-0
.022
-.09
6(**
)-0
.054
0.03
8IN
DE
X-0
.002
-0.0
16-.
094(
**)
-0.0
37-0
.024
0.01
1-0
.028
.096
(**)
.105
(**)
-0.0
05-.
079(
*)-0
.036
0.05
0FY
GPA
-0.0
19-0
.024
-.06
9(*)
-0.0
05-0
.051
0.00
0-0
.032
.067
(*)
0.03
6-0
.037
-.14
9(**
)0.
012
0.05
1
*C
orre
lati
onis
sign
ifica
ntat
the
0.05
leve
l(2-
taile
d).
**C
orre
lati
onis
sign
ifica
ntat
the
0.01
leve
l(2-
taile
d).
LAW & SOCIAL INQUIRY642
Index score alone, we conducted hierarchical multiple regression analyses where orderof predictor variable entry was specified by us.10 Results indicated that five of the HPIscales (Adjustment, Ambition, Sociability, Interpersonal Sensitivity, and LearningApproach) and the OPT disposition scales yielded significant increments above theLSAT. For those results in which there were significant increments, the amounts were1 percent or less. In general, the new predictors added only slight (1 percent) incre-mental validity to LSAT and Index score prediction of law school FYGPA.
New Measures as Predictors of Professional Performance
This section reports the results that were most central to our research. We selected,adapted, or wrote new test instruments to assess whether responses to them would showmeaningful relationships with the effectiveness factors identified in Phase One as beingcritical for lawyering performance. Viewed overall, a number of the new tests correlatedsignificantly with appraisals of professional effectiveness although others did not. Thebest predictive tests were BIO, SJT, a number of HPI scales, and OPT disposition (seeTables 5 and 6). In addition, results, as evidenced by examination of the intercorrela-tions among the predictors (range of .00 to .54), showed that the new predictor tests, forthe most part, measured characteristics that were independent of one another.
Created Instruments: Biographical Information Data (BIO) and SituationalJudgment Test (SJT)
Table 5 shows test correlations between performance and a subset of the tests usedas predictors. BIO scores showed correlations ranging from .09 to .25 (six were .20 orhigher) with 24 of the 26 effectiveness factors (except Integrity and Stress Manage-ment). SJT scores showed correlations with 23 of the effectiveness factors (exceptManaging Others; Evaluation, Development, and Mentoring; and CommunityService), ranging from .11 to .21. The impressive aspects of these results were (1) boththe BIO and SJT predicted large numbers of effectiveness factors; and (2) the correla-tions were generally higher, though moderately, than the correlations between LSATscores and the small subset of effectiveness factors the LSAC measures did predict.
Hogan Personality Inventory
Results show promising correlations for four of the HPI subscales (see Table 6).Adjustment correlated with 22 effectiveness factors ranging from .07 to .22; the stron-gest correlations for Adjustment were with Stress Management (r = .22), and AdvisingClients (r = .13) effectiveness factors. Ambition correlated with 14 effectiveness factors,ranging from .08 to .24; the strongest correlations for Ambition were with Networking
10. Results of these analyses are available from the authors.
Predicting Lawyer Effectiveness 643

TA
BL
E5.
Oth
erT
est
Cor
rela
tion
sw
ith
Per
form
ance
Inte
llect
ual
and
Cog
niti
veR
esea
rch
and
Info
rmat
ion
Gat
heri
ngC
omm
unic
atio
nsP
lann
ing
and
Org
aniz
ing
Ana
lysi
s&
Rea
soni
ngC
reat
ivit
yP
robl
emSo
lvin
gP
ract
ical
Judg
men
tR
esea
rchi
ngL
awFa
ctFi
ndin
gQ
uest
ion
&In
terv
iew
Influ
ence
&A
dvoc
ate
Wri
ting
Spea
king
Lis
teni
ngSt
rate
gic
Pla
nnin
gM
anag
ing
Self
Man
agin
gO
ther
s
BIO
.193
(**)
.247
(**)
.218
(**)
.138
(**)
.129
(**)
.182
(**)
.204
(**)
.199
(**)
.165
(**)
.189
(**)
.151
(**)
.161
(**)
.144
(**)
.148
(**)
SJT
.169
(**)
.173
(**)
.202
(**)
.182
(**)
.132
(**)
.207
(**)
.128
(**)
.212
(**)
.219
(**)
.109
(**)
.186
(**)
.176
(**)
.125
(**)
0.08
1SM
S-0
.006
0.03
5-0
.017
0.02
5-0
.010
-0.0
18-0
.030
-0.0
09-0
.011
0.05
1-0
.042
-0.0
54-0
.044
-0.0
32O
PT0.
021
0.04
1.0
85(*
)0.
064
-0.0
030.
042
.094
(*)
.095
(*)
-0.0
27.1
51(*
*)0.
069
0.07
10.
013
0.05
8ER
0.04
5-0
.009
-0.0
020.
039
.092
(*)
0.02
30.
008
0.03
1.0
89(*
)0.
018
-0.0
490.
030
0.01
90.
019
Con
flict
Res
olut
ion
Clie
nt&
Bus
ines
sR
elat
ions
Wor
king
wit
hO
ther
sC
hara
ter
Avg
Acr
oss
Neg
otia
tion
Eye
sof
Oth
ers
Net
wor
king
Adv
isin
gC
lient
sD
evel
opin
gR
elat
ions
hips
Eva
l,D
evel
op&
Men
tor
Pas
sion
Dili
genc
eIn
tegr
ity
Stre
ssM
anag
emen
tC
omm
unit
ySe
rvic
eSe
lfD
evel
opm
ent
BIO
.177
(**)
.130
(**)
.244
(**)
.198
(**)
.086
(*)
.172
(**)
.216
(**)
.147
(**)
0.07
70.
080.
240(
**)
.143
(**)
.234
(**)
SJT
.133
(**)
.162
(**)
.170
(**)
.166
(**)
.133
(**)
0.06
8.1
89(*
*).1
35(*
*).1
19(*
*).1
75(*
*)0.
058
.155
(**)
.222
(**)
SMS
0.01
00.
007
0.07
00.
000
0.03
1-0
.055
0.02
9-0
.035
-0.0
61-0
.016
.116
(**)
-0.0
040.
009
OPT
0.06
50.
049
.112
(**)
.096
(*)
.092
(*)
0.05
7.1
17(*
*)0.
045
0.02
7.1
30(*
*).1
23(*
*)0.
067
.104
(*)
ER-0
.030
0.01
6-0
.023
0.02
80.
017
0.01
0-0
.021
0.06
30.
026
-0.0
450.
024
0.01
10.
027
**C
orre
lati
onis
sign
ifica
ntat
the
0.01
leve
l(2-
taile
d).
LAW & SOCIAL INQUIRY644

TA
BL
E6.
Hog
anP
erso
nalit
yIn
vent
ory
(HP
I)C
orre
lati
ons
wit
hP
erfo
rman
ce
Inte
llect
ual
and
Cog
niti
veR
esea
rch
and
Info
rmat
ion
Gat
heri
ngC
omm
unic
atio
nsP
lann
ing
and
Org
aniz
ing
Ana
lysi
s&
Rea
soni
ngC
reat
ivit
yP
robl
emSo
lvin
gP
ract
ical
Judg
men
tR
esea
rchi
ngL
awFa
ctFi
ndin
gQ
uest
ion
&In
terv
iew
Influ
ence
&A
dvoc
ate
Wri
ting
Spea
king
Lis
teni
ngSt
rate
gic
Pla
nnin
gM
anag
ing
Self
Man
agin
gO
ther
s
AD
JUST
ME
NT
0.05
1.0
87(*
).0
94(*
*).0
83(*
)0.
059
.088
(*)
.108
(**)
.098
(**)
0.04
7.0
94(*
*).1
19(*
*).1
14(*
*).0
72(*
).0
82(*
)A
MB
ITIO
N0.
013
.112
(**)
.076
(*)
0.04
40.
025
0.06
3.1
12(*
*).0
93(*
*)0.
010
.162
(**)
0.03
8.1
07(*
*)0.
065
.082
(*)
SOC
IAB
ILIT
Y-.
099(
**)
-0.0
44-0
.060
-0.0
16-0
.062
-0.0
65-0
.042
-0.0
49-.
091(
*)0.
035
-0.0
62-0
.056
-.11
6(**
)-0
.039
INT
ER
PE
RSO
NA
L-0
.019
0.02
50.
032
0.05
4-0
.001
0.02
3.1
39(*
*)0.
058
0.01
50.
048
.115
(**)
0.04
00.
018
.124
(**)
PR
UD
EN
CE
.071
(*)
0.01
7.0
89(*
).0
87(*
)0.
049
.096
(**)
.100
(**)
.083
(*)
.094
(**)
0.03
1.1
35(*
*).1
08(*
*).1
99(*
*).1
67(*
*)IN
QU
SIT
IVE
0.01
80.
002
-0.0
17-0
.042
0.00
00.
016
-0.0
29-0
.009
0.03
2-0
.018
-0.0
33-0
.035
-.09
3(**
)-0
.041
LE
AR
NIN
GA
PP
RO
AC
H.0
75(*
)0.
041
.091
(*)
0.06
60.
048
0.06
40.
013
.093
(**)
.097
(**)
0.03
4-0
.026
.077
(*)
.070
(*)
0.02
2
Con
flict
Res
olut
ion
Clie
nt&
Bus
ines
sR
elat
ions
Wor
king
wit
hO
ther
sC
hara
cter
Avg
Acr
oss
Neg
otia
tion
Eye
sof
Oth
ers
Net
wor
king
Adv
isin
gC
lient
sD
evel
opin
gR
elat
ions
hips
Eva
l,D
evel
op&
Men
tor
Pas
sion
Dili
genc
eIn
tegr
ity
Stre
ssM
anag
emen
tC
omm
unit
ySe
rvic
eSe
lfD
evel
opm
ent
AD
JUST
ME
NT
.116
(**)
.107
(**)
.099
(**)
.133
(**)
.146
(**)
.090
(*)
.105
(**)
0.04
9.1
12(*
*).2
20(*
*).0
85(*
).0
90(*
).1
36(*
*)A
MB
ITIO
N.1
36(*
*)-0
.015
.239
(**)
.111
(**)
0.00
20.
059
.207
(**)
0.00
80.
002
.094
(**)
.107
(**)
.112
(**)
.120
(**)
SOC
IAB
ILIT
Y0.
043
-0.0
250.
071
-0.0
22-0
.028
-0.0
740.
059
-.13
6(**
)-0
.070
-0.0
05.1
11(*
*)-0
.013
-0.0
51IN
TE
RP
ER
SON
AL
.082
(*)
.132
(**)
.133
(**)
.134
(**)
.177
(**)
.171
(**)
.152
(**)
0.02
90.
062
0.06
8.1
79(*
*).0
85(*
).1
07(*
*)P
RU
DE
NC
E0.
042
.094
(**)
0.01
9.0
79(*
).1
66(*
*).1
59(*
*)0.
030
.189
(**)
0.06
3.0
84(*
)0.
055
.096
(**)
.126
(**)
INQ
USI
TIV
E-0
.030
0.01
40.
001
-0.0
21-0
.029
0.01
80.
049
-.07
4(*)
-0.0
460.
000
0.03
00.
026
-0.0
10L
EA
RN
ING
AP
PR
OA
CH
0.04
70.
037
-0.0
02-0
.014
-0.0
520.
020
-0.0
100.
040
-0.0
250.
002
0.00
70.
032
0.05
2
*C
orre
lati
onis
sign
ifica
ntat
the
0.05
leve
l(2-
taile
d).
**C
orre
lati
onis
sign
ifica
ntat
the
0.01
leve
l(2-
taile
d).
Predicting Lawyer Effectiveness 645
(r = .24) and Passion (r = .21) effectiveness factors. Interpersonal Sensitivity correlatedwith 12 effectiveness factors, ranging from .08 to .18; the strongest correlations werewith Developing Relationships (r = .18), Evaluating, Mentoring, and Developing (r =.17), and Community Service (r = .18) effectiveness factors. Finally, Prudence corre-lated with 18 effectiveness factors, ranging from .07 to .20; the strongest correlationswere with Managing Self (r = .20), Managing Others (r = .17), Developing Relation-ships (r = .17), and Diligence (r = .19) effectiveness factors. These most highlycorrelated HPI subscales (Adjustment, Ambition, Prudence, and Interpersonal Sensi-tivity) also did not show a pattern of highly significant correlations with three of thelawyering effectiveness factors that the LSAT aims to assess—Analysis and Reasoning,Researching the Law, and Writing. In sum, the HPI subscales correlate with moreeffectiveness factors than the LSAC measures, they correlate at somewhat higher levels,and in general, the subscales correlate with factors not measured by LSAT scores.
Hogan Development Survey (HDS)
The Excitable subscale of the HDS showed some promise, correlating with 18 ofthe 26 effectiveness factors with coefficients ranging from -.12 to -.32. This subscalereflects being overly enthusiastic about people/projects and then becoming disap-pointed with them. High scorers seem to lack persistence. However, this scale alsocorrelated -.72 with Adjustment on the HPI, suggesting that the Adjustment andExcitable scales were measuring opposite characteristics. The other HDS subscale thatshowed some promise is Reserved. This scale correlated with 8 effectiveness factors withcoefficients ranging from -.13 to -.25. This subscale reflects being remote, detached,and lacking awareness of feelings of others; it suggests a lack of communication skillsrequired for high effectiveness on factors such as Questioning and Interviewing, Net-working, and Community Service, where awareness of others’ feelings is critical forstrong performance. The Reserved subscale, however, was correlated (r = -.56) with theHPI Interpersonal Sensitivity subscale, again suggesting overlap in what is being mea-sured by the HPI and HDS scales. These patterns raise an issue as to whether to employthe two HDS scales of Reserved and Excitable or to rely mainly on the HPI subscales,which covered more of the effectiveness factors than these two HDS subscales.11
Motives, Values, Preferences Inventory (MVPI)
Overall, the pattern of correlations between the MVPI scales and the 26 effec-tiveness factors was less comprehensive and weaker than the HPI or the HDS correla-tions. The Altruistic subscale correlated with 7 effectiveness factors (Creativity,Researching the Law, Able to See the World Through the Eyes of Others, AdvisingClients, Passion, Integrity, and Community Service). The correlations ranged from .16to .25; the highest correlation was with Community Service. Given its limited number
11. A full correlation matrix of HDS scales and effectiveness factors is available from the authors.
LAW & SOCIAL INQUIRY646

of correlations with the lawyer effectiveness factors and its weaker coefficients ascompared to the HPI, further research on the MVPI may be unwarranted.12
Dispositional Optimism
OPT correlated positively with 10 of the effectiveness factors (see Table 5); coef-ficients ranged from .09 to .15. Most notable are the correlations with Speaking,Networking, Passion, Stress Management, and Community Service effectivenessfactors. OPT also correlated in the high .4’s with the HPI Adjustment and Ambitionsubscales. Consequently, use of OPT disposition and HPI subscales might be duplica-tive, or by the same token, OPT disposition might be useful if the HPI were for somereason not pursued.
Self Monitoring Scale (SMS) and Emotion Recognition (ER) Tests
We examined two other tests—the SMS and ER (Table 5). These two measuresdid not show results that would suggest continuing pursuit at least in the same formwe used.
Incremental Validity
A particular goal of the research was to determine whether we could develop abattery of tests that would explain variance in ratings of actual lawyer performance andwhether the tests identified/developed for the project could explain variance above andbeyond the LSAT, UGPA and Index scores. However, because the LSAT, UGPA, andIndex scores correlated with a very limited set of effectiveness factors, and generally atlevels lower than the other tests examined in this research, we conducted step-wiseregression analysis in which the order of entry into the analysis was determined bystatistical relationships among the predictors and their correlations with the partici-pants’ performance evaluations.13
Results show that a combination of two tests, and in some instances three tests, canproduce multiple correlations with the effectiveness factors (and with the average of theset of effectiveness ratings (Global Average) for performance) in the range of the mid.20’s to the low .30’s. For 15 of the 26 effectiveness factors, both SJT and BIO wereidentified as the best predictive battery; by contrast, LSAT was identified as importantin only three batteries. The LSAT and the Index did not demonstrate much value alongwith or in addition to the other potential tests in predicting lawyering performance.Taken as a whole, the data suggest that SJT, BIO, HPI scales, and OPT disposition havethe best potential to predict lawyer performance effectiveness.
12. A correlation matrix is available from the authors.13. Results of these analyses are available from the authors.
Predicting Lawyer Effectiveness 647

New Measures and the Reduction of Adverse Impact
We had particular interest in whether these noncognitive measures produced anyvariation across racial/ethnic or gender subgroups. To determine whether there wasdifferential validity for any participant subgroup, we examined the relationship betweenthe separate predictors of tests where the zero-order correlations showed the mostpotential—HPI (7 scales), BIO, SJT, and OPT disposition—and each of the 26effectiveness factors of lawyer performance through moderated regression.14 Resultsindicated few instances of significant differential variance due to race or gender. Wheresignificance existed, the amount of variance was negligible (approximately 1 percentdifferential variance).
Note also that although about 180 participants from underrepresented minoritygroups (15.7 percent) participated in the sample, our findings on moderator variablesare limited by those comparatively small numbers, which consequently limited thestatistical power of our analyses. The sample sizes for minority groups in this study weresmall from a statistical perspective, but they are reasonably representative of theirproportions in the law schools in the years studied. Nevertheless, the finding of nopractical demographic differences is consistent with the employment literature (Clev-enger et al. 2001), which has reported few if any differences between gender andrace/ethnic groups on the types of predictors studied in this project. Future researchwith larger and more representative samples should further examine moderated variableeffects. Below, we present specific results for the most promising predictors and for theperformance measures to further illustrate results for ethnic and gender differences:
BIO and SJT
Average scores on the BIO test yielded similar findings for females and males, andfor Whites and Asian/Pacific Islanders (Table 7). African-Americans scored highest onthe BIO, and Latinos scored lowest, although the differences among the four groups arenot statistically significant. Table 7 also shows no real differences among the subgroupsfor the SJT, except that Latinos scored higher than other ethnic groups (r2 = .01). Ingeneral, the results show no practical differences for SJT and BIO based on gender orethnicity.
Hogan Personality Inventory (HPI)
Table 7 shows the HPI results for the various subgroups. Although females scoredlower on three subscales (Adjustment, Sociability, and Inquisitive) and Whites scoredslightly higher on one measure (Learning Approach), in general, there was little genderor racial variation across the subgroups.15
14. Results of these analyses are available from the authors.15. The variance only ranged between .01 to .04.
LAW & SOCIAL INQUIRY648
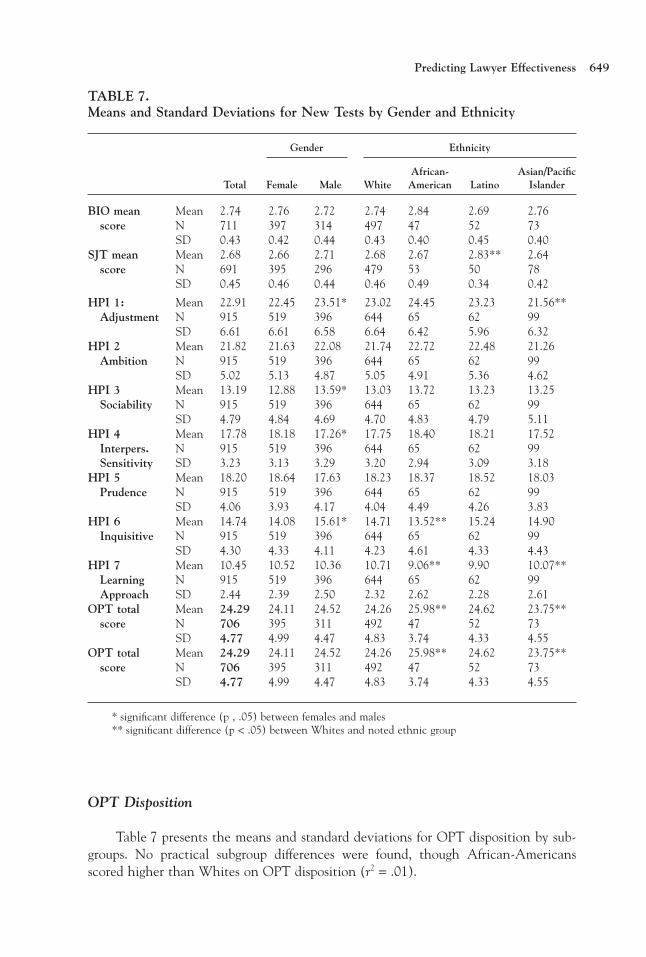
OPT Disposition
Table 7 presents the means and standard deviations for OPT disposition by sub-groups. No practical subgroup differences were found, though African-Americansscored higher than Whites on OPT disposition (r2 = .01).
TABLE 7.Means and Standard Deviations for New Tests by Gender and Ethnicity
Total
Gender Ethnicity
Female Male WhiteAfrican-
American LatinoAsian/Pacific
Islander
BIO meanscore
Mean 2.74 2.76 2.72 2.74 2.84 2.69 2.76N 711 397 314 497 47 52 73SD 0.43 0.42 0.44 0.43 0.40 0.45 0.40
SJT meanscore
Mean 2.68 2.66 2.71 2.68 2.67 2.83** 2.64N 691 395 296 479 53 50 78SD 0.45 0.46 0.44 0.46 0.49 0.34 0.42
HPI 1:Adjustment
Mean 22.91 22.45 23.51* 23.02 24.45 23.23 21.56**N 915 519 396 644 65 62 99SD 6.61 6.61 6.58 6.64 6.42 5.96 6.32
HPI 2Ambition
Mean 21.82 21.63 22.08 21.74 22.72 22.48 21.26N 915 519 396 644 65 62 99SD 5.02 5.13 4.87 5.05 4.91 5.36 4.62
HPI 3Sociability
Mean 13.19 12.88 13.59* 13.03 13.72 13.23 13.25N 915 519 396 644 65 62 99SD 4.79 4.84 4.69 4.70 4.83 4.79 5.11
HPI 4Interpers.Sensitivity
Mean 17.78 18.18 17.26* 17.75 18.40 18.21 17.52N 915 519 396 644 65 62 99SD 3.23 3.13 3.29 3.20 2.94 3.09 3.18
HPI 5Prudence
Mean 18.20 18.64 17.63 18.23 18.37 18.52 18.03N 915 519 396 644 65 62 99SD 4.06 3.93 4.17 4.04 4.49 4.26 3.83
HPI 6Inquisitive
Mean 14.74 14.08 15.61* 14.71 13.52** 15.24 14.90N 915 519 396 644 65 62 99SD 4.30 4.33 4.11 4.23 4.61 4.33 4.43
HPI 7LearningApproach
Mean 10.45 10.52 10.36 10.71 9.06** 9.90 10.07**N 915 519 396 644 65 62 99SD 2.44 2.39 2.50 2.32 2.62 2.28 2.61
OPT totalscore
Mean 24.29 24.11 24.52 24.26 25.98** 24.62 23.75**N 706 395 311 492 47 52 73SD 4.77 4.99 4.47 4.83 3.74 4.33 4.55
OPT totalscore
Mean 24.29 24.11 24.52 24.26 25.98** 24.62 23.75**N 706 395 311 492 47 52 73SD 4.77 4.99 4.47 4.83 3.74 4.33 4.55
* significant difference (p , .05) between females and males** significant difference (p < .05) between Whites and noted ethnic group
Predicting Lawyer Effectiveness 649

Performance Appraisals of Lawyer Effectiveness
We also examined demographic subgroup differences in the ratings of participants’lawyering performance. Table 8 presents results of the other category of appraisals(combined average ratings by peers and supervisors). Results showed significant differ-ences between males and females on nine of the effectiveness factors, where males wereevaluated more highly on Analysis and Reasoning, Creativity/Innovation, ProblemSolving, Researching the Law, Influencing and Advocating, Writing, Speaking, Nego-tiation Skills, and Stress Management; females were rated more highly on CommunityInvolvement and Service. (The greater number of effectiveness factors on which themales were rated higher could suggest bias or stereotyping that should be examined infuture research.) Ethnic differences were found mainly between Whites and Asians,where the latter were evaluated lower on 11 of the effectiveness factors. An additionalanalysis, in which the average rating was determined across all 26 effectiveness factors,showed no gender difference and a slightly lower rating for Asians when compared toWhites.
In general, although the results show some statistically significant differences,effect sizes for gender and race were relatively small, and the means for all subgroupswere generally above a value of “4” on the five-point scale.
Limitations of Sample
The research reported here has several limitations related to the sample. First, theresults are based on graduates of only two law schools. Second, results reflect a restrictedsample in that (1) all participants in the alumni sample were admitted to and graduatedfrom law school; (2) all were law graduates practicing law or performing law-relatedjobs, which assumes they were reasonably successful—unsuccessful lawyers were notlikely to participate in the study; (3) all were volunteer participants; and (4) perfor-mance evaluators were identified by participants. These limitations may restrict vari-ance in the measures studied and used, and could tend to underestimate correlationsamong the measures. Despite these limitations, the obtained correlations are sufficientlystrong as to be quite important and to cause us to urge additional research with an eyeto adding projections of lawyering competence to admission decision making in thenear future.
CONCLUSION
Primary Findings
This project sought to explore additional types of law school admission measuresthat can predict actual lawyering performance. Our research results suggest thefollowing:
• BIO, SJT, several HPI subscales, and OPT disposition showed the strongest correla-tion with lawyering effectiveness. For example, BIO showed significant correlations
LAW & SOCIAL INQUIRY650

TA
BL
E8.
Com
bine
dP
eer
and
Supe
rvis
orA
ppra
isal
sby
Gen
der
and
Eth
nici
ty
Tot
al
Gen
der
Eth
nici
ty
Fem
ale
Mal
eW
hite
Afr
.A
mer
.L
atin
oA
sian
Ave
rage
Acr
oss
All
Oth
erA
ppra
isal
sM
ean
4.28
54.
268
4.30
74.
296
4.29
24.
326
4.20
4**
N98
156
741
468
172
7210
7SD
0.37
70.
367
0.39
00.
348
0.39
20.
431
0.46
9
Inte
llect
ual
and
Cog
niti
veA
naly
sis
and
Rea
soni
ngM
ean
4.34
94.
308
4.40
6*4.
381
4.26
94.
309
4.25
2**
N97
356
041
367
771
7210
6SD
0.48
80.
470
0.50
60.
442
0.62
00.
599
0.57
6C
reat
ivit
y/In
nova
tion
Mea
n4.
273
4.23
04.
330*
4.31
14.
236
4.24
14.
089*
*N
923
528
395
647
6469
96SD
0.57
40.
571
0.57
50.
511
0.66
00.
765
0.68
5Pr
oble
mSo
lvin
gM
ean
4.34
54.
301
4.40
3*4.
363
4.34
44.
366
4.24
1**
N96
755
741
067
269
7110
6SD
0.46
00.
466
0.44
60.
422
0.53
70.
466
0.57
1Pr
acti
calJ
udgm
ent
Mea
n4.
274
4.25
74.
297
4.27
64.
335
4.29
94.
182
N96
355
540
867
568
6910
3SD
0.54
10.
519
0.56
90.
519
0.50
10.
629
0.64
7
Res
earc
h&
Info
rmat
ion
Gat
heri
ng
Res
earc
hing
the
Law
Mea
n4.
310
4.28
04.
351*
4.33
44.
220
4.32
64.
208*
*N
958
551
407
672
6769
105
SD0.
502
0.48
90.
515
0.47
70.
461
0.55
50.
650
Fact
Find
ing
Mea
n4.
363
4.34
04.
395
4.37
94.
336
4.39
14.
291
N95
655
140
566
667
7010
5SD
0.45
70.
461
0.45
10.
432
0.48
50.
553
0.51
1Q
uest
ioni
ngan
dIn
terv
iew
ing
Mea
n4.
223
4.21
24.
238
4.22
74.
261
4.30
74.
130
N90
351
838
562
966
6410
0SD
0.49
00.
480
0.50
40.
454
0.54
50.
494
0.65
5
Com
mun
icat
ions
Influ
enci
ngan
dA
dvoc
atin
gM
ean
4.28
44.
256
4.32
0*4.
301
4.28
34.
359
4.13
0**
N96
455
341
167
169
7110
4SD
0.49
10.
492
0.48
70.
457
0.51
10.
527
0.59
6
Predicting Lawyer Effectiveness 651

TA
BL
E8.
(Con
tinu
ed)
Tot
al
Gen
der
Eth
nici
ty
Fem
ale
Mal
eW
hite
Afr
.A
mer
.L
atin
oA
sian
Wri
ting
Mea
n4.
282
4.24
34.
335*
4.31
94.
194
4.21
94.
185*
*N
952
550
402
667
6769
103
SD0.
551
0.55
70.
540
0.51
40.
560
0.63
50.
648
Spea
king
Mea
n4.
261
4.20
94.
333*
4.26
84.
302
4.34
74.
189
N96
355
840
567
172
6810
3SD
0.53
20.
534
0.52
20.
497
0.59
50.
617
0.59
0Li
sten
ing
Mea
n4.
311
4.29
94.
326
4.30
54.
411
4.37
14.
277
N95
755
040
766
869
6910
3SD
0.46
50.
452
0.48
10.
451
0.44
90.
534
0.52
7
Pla
nnin
gan
dO
rgan
izin
gSt
rate
gic
Plan
ning
Mea
n4.
273
4.25
84.
292
4.28
94.
246
4.40
54.
134*
*N
932
533
399
653
6866
100
SD0.
482
0.44
50.
526
0.45
30.
526
0.50
40.
571
Org
aniz
ing
and
Man
agin
gO
ne’s
Ow
nW
ork
Mea
n4.
263
4.27
44.
247
4.28
44.
202
4.19
84.
248
N96
155
840
366
970
6910
5SD
0.59
10.
586
0.59
70.
549
0.50
30.
756
0.70
0O
rgan
izin
gan
dM
anag
ing
Oth
ers
Mea
n4.
288
4.30
14.
270
4.29
34.
258
4.20
64.
328
N87
550
437
161
363
6293
SD0.
583
0.58
10.
585
0.56
10.
623
0.81
70.
478
Con
flict
Res
olut
ion
Neg
otia
tion
Skill
sM
ean
4.24
34.
201
4.29
8*4.
229
4.32
34.
286
4.26
8N
879
496
383
615
6763
89SD
0.48
70.
457
0.51
90.
481
0.41
50.
592
0.52
7A
ble
toSe
eth
eW
orld
Thr
ough
the
Eyes
ofO
ther
sM
ean
4.27
94.
278
4.28
14.
263
4.41
2**
4.30
64.
294
N95
855
440
467
067
6910
3SD
0.46
30.
456
0.47
30.
459
0.36
80.
508
0.49
3
LAW & SOCIAL INQUIRY652

Clie
nt&
Bus
ines
sR
elat
ions
Net
wor
king
and
Bus
ines
sD
evel
opm
ent
Mea
n4.
157
4.12
44.
203
4.14
24.
207
4.30
54.
158
N87
850
637
261
464
5798
SD0.
653
0.67
00.
627
0.66
00.
649
0.66
60.
589
Adv
isin
gC
lient
sM
ean
4.40
64.
408
4.40
34.
395
4.47
54.
452
4.37
8N
921
523
398
644
6567
100
SD0.
439
0.41
40.
471
0.44
20.
365
0.41
90.
491
Wor
king
wit
hO
ther
sD
evel
opin
gR
elat
ions
hips
wit
hin
the
Lega
lPro
fess
ion
Mea
n4.
374
4.38
14.
365
4.34
84.
522*
*4.
404
4.42
9N
969
557
412
677
6969
105
SD0.
516
0.48
50.
556
0.52
70.
366
0.62
50.
487
Eval
uati
on,D
evel
opm
ent,
and
Men
tori
ngM
ean
4.24
44.
254
4.23
14.
238
4.34
24.
231
4.26
2N
817
469
348
565
6459
87SD
0.56
00.
540
0.58
60.
548
0.61
00.
625
0.53
4
Cha
ract
erPa
ssio
nan
dEn
gage
men
tM
ean
4.33
74.
333
4.34
34.
341
4.37
54.
505*
*4.
205*
*N
971
562
409
673
7172
106
SD0.
563
0.57
40.
547
0.54
00.
616
0.46
30.
634
Dili
genc
eM
ean
4.30
54.
313
4.29
54.
329
4.29
74.
282
4.22
1**
N95
855
140
766
569
7110
5SD
0.51
00.
500
0.52
40.
472
0.44
80.
649
0.61
8In
tegr
ity/
Hon
esty
Mea
n4.
659
4.64
14.
684
4.68
74.
664
4.62
14.
525*
*N
963
556
407
671
7070
104
SD0.
384
0.38
70.
379
0.35
50.
435
0.42
50.
494
Stre
ssM
anag
emen
tM
ean
4.15
04.
114
4.20
0*4.
143
4.21
14.
181
4.10
6N
954
553
401
664
6869
105
SD0.
534
0.53
40.
531
0.53
00.
482
0.54
50.
620
Com
mun
ity
Invo
lvem
ent
and
Serv
ice
Mea
n4.
253
4.30
34.
184*
4.20
14.
392*
*4.
494*
*4.
308
N87
250
936
360
065
6310
1SD
0.67
80.
652
0.70
90.
712
0.53
50.
556
0.59
8Se
lf-D
evel
opm
ent
Mea
n4.
157
4.14
94.
168
4.14
94.
183
4.24
84.
155
N94
754
839
965
769
6910
4SD
0.53
30.
512
0.56
20.
531
0.52
30.
546
0.52
8
*si
gnifi
cant
diffe
renc
e(p
,.05
)be
twee
nfe
mal
esan
dm
ales
**si
gnifi
cant
diffe
renc
e(p
<.0
5)be
twee
nW
hite
san
dno
ted
ethn
icgr
oup
Predicting Lawyer Effectiveness 653
with 24 of 26 lawyer performance factors, SJT with 23, four HPI subscales with 22,18, 14 and 12, respectively, and OPT disposition significantly correlated with 10factors. By contrast, most of the 26 factors identified by attorneys as important tolawyer performance were not well predicted by the LSAT, UGPA, or Index score.
• Noncognitive constructs explored in this project correlated at a higher level ofsignificance with lawyer performance factors than did LSAT, UGPA, or Index evenwhen a performance factor, such as Analysis and Reasoning, is a primary competencetargeted by those academic measures. Of course, the LSAC indicators assess analyticreasoning skills, as reflected in school grades, while the nonacademic tests addressanalytic reasoning in professional work.
• Unlike the LSAT, our noncognitive measures showed few racial or gender subgroupdifferences, creating the potential to reduce adverse impact through use of new tests.
Potential Diversity Gains with a New Test Battery
Table 9 draws from the alumni sample studied in this research to illustrate thepotential to increase diversity by including these tests in admission decisions. If theLSAT were the only admission test, and if it were used in a top-down fashion—wherethe scores are presented in rank order—selection of the top 10 percent of the samplestudied in this research project would yield 116 admits, 54.3 percent of whom would befemale and 85.3 percent of whom would be White, .9 percent African American, 4.3percent Latino, and 6.9 percent Asian/Pacific Islander. In another example, if the Indexscore were the only determinant of admission, and were used in a top-down fashion toselect 10 percent of this sample for admission, the chosen applicants would be 52.7percent female and 87.5 percent White, 0 percent African-American, 4.5 percentLatino, and 6.3 percent Asian/Pacific Islander. By contrast, if the SJT were the onlydeterminant of selection,16 50 percent of the top 10 percent would be female and 68.8percent White, with 7.5 percent being African American, 7.5 percent being Latino and11.3 percent being Asian/Pacific Islander. The remaining rows of Table 9 show resultsfor different selection percentages and for different test combinations. For example,combining the BIO and SJT tests, and using supervisor assessments of participants’lawyering effectiveness yields a group of sixty-four admits in the top 20 percent of scores,where 53.1 percent are female, 65.6 percent are White, 9.4 percent are African Ameri-can, 10.9 percent are Latino, and 10.9 percent are Asian/Pacific Islander. Theseexamples suggest what Christopher Jencks (1988) called “selection system bias” in lawschool admission: where multiple factors are important to a decision, overemphasis onpredictors where Whites do better than underrepresented minorities combined withunderutilization of predictors where racial groups perform in substantially equal waysunfairly diminishes the admission of minority group applicants.
If further research confirms the predictive validity of these noncognitive,performance-predictive tests, measures of this new type would open up an array ofvaluable options in admission practices. Tests have typically been used in a largelytop-down fashion, where the students with the highest scores are selected first. Other
16. N = 80 rather than 116 because not all in the sample took the SJT.
LAW & SOCIAL INQUIRY654

TABLE 9.Estimates of Admitted Law Classes by Admissions Tests for Gender and Ethnicity
Total
Gender Ethnicity
Female Male WhiteAfrican-
American LatinoAsian/Pacific
Islander
LSAT Top 10% 116 63 53 99 1 5 8(54.3%) (45.7%) (85.3%) (.9%) (4.3%) (6.9%)
Top 20% 225 115 110 195 1 7 15(51.1%) (48.9%) (86.7%) (.4%) (3.1%) (6.7%)
Top 30% 348 180 168 302 2 8 25(51.7%) (48.3%) (86.8%) (.6%) (2.3%) (7.2%)
Index(50/50)
Top 10% 112 59 53 98 0 5 7(52.7%) (47.3%) (87.5%) (0%) (4.5%) (6.3%)
Top 20% 225 124 101 192 0 6 21(55.1%) (44.9%) (85.3%) (0%) (2.7%) (9.3%)
Top 30% 334 184 150 285 0 7 33(55.1%) (44.9%) (85.3%) (0%) (2.1%) (9.9%)
BIO Top 10% 72 44 28 49 5 4 10(61.1%) (38.9%) (68.1%) (6.9%) (5.6%) (13.9%)
Top 20% 140 84 56 96 13 9 13(60.0%) (40.0%) (68.6%) (9.3%) (6.4%) (9.3%)
Top 30% 213 119 94 143 17 16 23(55.9%) (44.1%) (67.1%) (8.0%) (7.5%) (10.8%)
SJT Top 10% 80 40 40 55 6 6 9(50.0%) (50.0%) (68.8%) (7.5%) (7.5%) (11.3%)
Top 20% 205 114 91 141 17 19 22(55.6%) (44.4%) (68.8%) (8.3%) (9.3%) (10.7%)
Top 30% 242 135 107 165 19 23 29(55.8%) (44.2%) (68.2%) (7.9%) (9.5%) (12.0%)
HPI Ambition Top 10% 173 89 84 118 12 19 13(51.4%) (48.6%) (68.2%) (6.9%) (11.0%) (7.5%)
Top 20% 256 138 118 168 23 28 20(53.9%) (46.1%) (65.6%) (9.0%) (10.9%) (7.8%)
Top 30% 330 179 151 225 29 29 29(54.2%) (45.8%) (68.2%) (8.8%) (8.8%) (8.8%)
HPI Learningapproach
Top 10% 201 116 85 156 6 6 21(57.7%) (42.3%) (77.6%) (3.0%) (3.0%) (10.4%)
Top 20% 343 205 138 262 15 15 31(59.8%) (40.2%) (76.4%) (4.4%) (4.4%) (9.0%)
Top 30% 515 300 215 387 23 29 51(58.3%) (41.7%) (75.1%) (4.5%) (5.6%) (9.9%)
Optimism(OPT)
Top 10% 131 73 58 94 13 9 8(55.7%) (44.3%) (71.8%) (9.9%) (6.9%) (6.1%)
Top 20% 217 124 93 152 18 16 18(57.1%) (42.9%) (70.0%) (8.3%) (7.4%) (8.3%)
Top 30% 285 161 124 204 26 19 23(56.5%) (43.5%) (71.6%) (9.1%) (6.7%) (8.1%)
Predicting Lawyer Effectiveness 655

alternatives could be explored. Member schools might, for example, use the LSATand/or Index score to set an academic floor and then use the new predictor scores torank applicants who surpass that floor. This could involve establishing a statistical band(Cascio, Outtz, Zedeck and Goldstein 1991), which would identify a pool of relativelyequivalent LSAT scorers and from which selections would be based on other predictors.Or, a school might use the LSAT to identify the top 20 percent (in terms of academicpotential) and then combine the LSAT score with one or several of the new test scoresinto a new type of composite to admit additional applicants. Or, a school might wish tocombine the Index score and new test scores from the beginning in order to assure thatit has selected its student body on the basis of relevant academic and performance-predictive factors, and has increased diversity compared to admission policies thatpredominately emphasize LSAT scores. Or, a school might establish minimum scores foreach of multiple test instruments and require that an applicant achieve that minimumscore on each to gain admission. These are some of the ways schools might make gooduse of the additional information supplied by scores on new predictors like thoseresearched in this study. Future research should investigate some of these approaches,using a broad sample, and taking into account issues such as test time administration,cost, and other factors that impact the contribution of testing.
The new tests used in conjunction with the LSAT, UGPA, or Index scores, couldextend admission consideration beyond prediction of grades to include predictions ofprofessional effectiveness in law and law-related jobs. These tests could ameliorate
TABLE 9.(Continued)
Total
Gender Ethnicity
Female Male WhiteAfrican-
American LatinoAsian/Pacific
Islander
HPI Ambitionand BIOcombo (selfweightings)
Top 10% 61 36 25 43 5 4 4(59.0%) (41.0%) (70.5%) (8.2%) (6.6%) (6.6%)
Top 20% 126 67 59 88 10 9 12(53.2%) (46.8%) (69.8%) (7.9%) (7.1%) (9.5%)
Top 30% 183 104 79 122 17 14 20(56.8%) (43.2%) (66.7%) (9.3%) (7.7%) (10.9%)
BIO andSJT (peerweightings)
Top 10% 32 19 13 21 2 4 3(59.4%) (40.6%) (65.6%) (6.3%) (12.5%) (9.4%)
Top 20% 66 36 30 43 6 7 8(54.5%) (45.5%) (65.2%) (9.1%) (10.6%) (12.1%)
Top 30% 94 50 44 64 8 7 12(53.2%) (46.8%) (68.1%) (8.5%) (7.4%) (12.8%)
BIO and SJT(supervisorweightings)
Top 10% 33 19 14 23 3 3 2(57.6%) (42.4%) (69.7%) (9.1%) (9.1%) (6.1%)
Top 20% 64 34 30 42 6 7 7(53.1%) (46.9%) (65.6%) (9.4%) (10.9%) (10.9%)
Top 30% 95 51 44 65 8 7 12(53.7%) (46.3%) (68.4%) (8.4%) (7.4%) (12.6%)
LAW & SOCIAL INQUIRY656
problems that have long been a focus of critical commentary on law admission practice.Adding this component to selection among applicants could strengthen the connec-tions between legal education and the profession. It could significantly increase diver-sity over what will likely be achieved when academic indicators dominate the process.The new methods could also provide applicants, career placement officials, and employ-ers with more information when considering applicants’ strengths. Most importantly,inclusion of tests to predict lawyer performance would, in our view, be justified by theactual role and mandate of law schools as professional schools and by the profession’smandate in society (e.g., serving clients, guiding behavior, aiding in resolution ofdisputes and contributing to justice).
REFERENCES
Allport, Gordon W. 1937. Personality: A Psychological Interpretation. New York: Holt.American Bar Association, Report of The Task Force on Law Schools and the Profession: Narrowing
the Gap, Section of Legal Education and Admissions to the Bar. 1992. Legal Education andProfessional Development: An Educational Continuum [“MacCrate Report”]. Chicago: AmericanBar Association.
Anthony, Lisa C., Vincent F. Harris, and Peter J. Pashley. 1999. Predictive Validity of the LSAT: ANational Summary of the 1995–96 Correlation Studies. Law School Admission Council LSATTechnical Research Report TR-97-01. Newtown, PA: Law School Admission Services.
Anthony, Lisa C., and Mei Liu. 2000. Analysis of Differential Prediction of Law School Performance byRacial/Ethnic Subgroups Based on the 1996–1998 Entering Law School Classes. Law School Admis-sion Council Technical Research Report TR-00-02. Newton, PA: Law School AdmissionServices.
Aspinwall, Lisa G., and Shelley E. Taylor. 1992. Individual Differences, Coping, and PsychologicalAdjustment: A Longitudinal Study of College Adjustment and Performance. Journal of Personalityand Social Psychology 63:989–1003.
Baird, Leonard L., Alfred B. Carlson, Richard R. Reilly, and Ramon J. Powell. 1979. DefiningCompetence in Legal Practice: The Evaluation of Lawyers in Large Firms and Organizations. LawSchool Admission Council Report No. LSAC-79-1. Newtown, PA: Law School AdmissionServices.
Barrett, Paul. 2008. Some Analyses of Personality, Academic, and Performance Rating Data from Alumniand Students with the Faculty of Law, University of California, Berkeley. Tulsa, OK: HoganAssessment Systems.
Barrick, Murray R., and Mount K. Mount. 1991. The Big Five Personality Dimensions and JobPerformance: A Meta Analysis. Personnel Psychology 4:1–26.
Bentz, V. Jon. 1985. A View from the Top: A Thirty Year Perspective of Research Devoted toDiscovery, Description, and Prediction of Executive Behavior. Paper presented at the 93rdAnnual Convention of the American Psychological Association, August 1985, in Los Angeles,California.
Brissette, Ian, Michael F. Scheier, and Charles S. Carver. 2002. The Role of Optimism in SocialNetwork Development, Coping, and Psychological Adjustment during a Life Transition. Journalof Personality and Social Psychology 82 (1): 102–11.
Caldwell, David F., and Charles A. O’Reilly. 1982. Boundary Spanning and Individual Performance:The Impact of Self-Monitoring. Journal of Applied Psychology 67:124–27.
Caligiuri, Paula M., and David V. Day. 2000. Effects of Self-Monitoring on Technical, Contextual, andAssignment-Specific Performance. Group & Organization Management 25:154–74.
Camara, Wayne. 2006. January 9, Personal communication.Carver, Charles S., and Michael F. Scheier. 1981. Attention and Self-Regulation: A Control-Theory
Approach to Human Behavior. New York: Springer-Verlag.
Predicting Lawyer Effectiveness 657
——. 2002. Optimism. In Handbook of Positive Psychology, ed. C. R. Snyder and Shane J. Lopez,231–43. New York: Oxford University Press.
Cascio, Wayne F., James Outtz, Sheldon Zedeck, and Irwin L. Goldstein. 1991. Statistical Implicationsof Six Methods of Test Score Use in Personnel Selection. Human Performance 4:233–64.
Chan, David, and Neal Schmitt. 2002. Situational Judgment and Job Performance. Human Perfor-mance 15 (3): 233–54.
Chatman, Jennifer. 1991. Matching People and Organizations: Selection and Socialization in PublicAccounting Firms. Administrative Science Quarterly 36:459–84.
Clevenger, James, Gloria M. Pereira, Darin Wiechmann, Neal Schmitt, and Veronica Harvey-Schmidt. 2001. Incremental Validity of Situational Judgment Tests. Journal of Applied Psychology86:410–17.
Dalessandro, Susan P., Lisa A. Stilwell, and Lynda M. Reese. 2005. LSAT Performance with Regional,Gender, and Racial/ethnic Breakdowns: 1993–1994 through 1999–2000 Testing Years. Law SchoolAdmission Council Research Report TR-00-01. Newton, PA: Law School AdmissionServices.
Diaz, Rolando J., Carol R. Glass, Diane B. Ankoff, and Marian Tanofsky-Kraff. 2001. Cognition,Anxiety, and Prediction of Performance in 1st-year Law Students. Journal of Educational Psychol-ogy 93:420–49.
Edwards, Harry T. 1992. The Growing Disjunction between Legal Education and the Legal Profession.Michigan Law Review 91:34–78.
Evans, Franklin R. 1984. Recent Trends in Law School Validity Studies. Law School Admission CouncilReport 82-1. Newtown, PA: Law School Admission Services.
Ekman, Paul. 2004. Emotions Revealed: Recognizing Faces and Feelings to Improve Communication andEmotional Life. New York: Macmillan.
Goldhaber, Michael D. 1999. Is the Promised Land Heav’n or Hell? National Law Journal, July 5.Goleman, Daniel. 1995. Emotional Intelligence. New York: Bantam Books.Guion, Robert. 1987. Changing Views for Personnel Selection Research. Personnel Psychology 40:199–
213.Henderson, William D. 2004. The LSAT, Law School Exams, and Meritocracy: The Surprising and
Undertheorized Role of Test Taking Speed. Texas Law Review 82:975–1051.Heinz, John P., Kathleen E. Hull, and Ava Harter. 1999. Lawyers and Their Discontents: Findings from
a Survey of the Chicago Bar. Indiana Law Journal 74:735–58.Hobfoll, Stevan E. 2002. Social and Psychological Resources and Adaptation. Review of General
Psychology 6:307–24.Hogan, Joyce, and Robert Hogan. 1991. Levels of Analysis in Big Five Theory: The Structure of
Self-Description. Paper presented at the Sixth Annual Conference of the Society for Industrialand Organizational Psychology, April 12, in St. Louis, MO.
——. 1996. Motives, Values, Preferences Inventory Manual. Tulsa, OK: Hogan AssessmentSystems.
——. 1997. Hogan Development Survey Manual. Tulsa, OK: Hogan Assessment Systems.——. 2007. Hogan Personality Inventory Manual. 3rd ed. Tulsa, OK: Hogan Assessment Systems.Hogan, Robert, Joyce Hogan, and Brent W. Roberts. 1996. Personality Measurement and Employment
Decisions: Questions and Answers. American Psychologist 51:469–77.Hogan, Robert, Joyce Hogan, and Rodney Warrenfeltz. 2007. The Hogan Guide: Interpretation and Use
of Hogan Inventories. Tulsa, OK: Hogan Assessment Systems.Hough, Leatta M. 1984. Development and Evaluation of the “Accomplishment Record” Method of
Selecting and Promoting Professionals. Journal of Applied Psychology 69:135–46.Hough, Leatta M., Frederick L. Oswald, and Robert E. Ployhart. 2001. Determinants, Detection, and
Amelioration of Adverse Impact in Personnel Selection Procedures: Issues, Evidence, andLessons Learned. International Journal of Selection and Assessment 9:152–94.
Hunter, John, and Rhonda Hunter. 1984. Validity and Utility of Alternative Predictors of JobPerformance. Psychological Bulletin 96 (1): 72–98.
Hurtz, Gregory M., and John J. Donovan. 2000. Personality and Job Performance: The Big FiveRevisited. Journal of Applied Psychology 85:869–79.
LAW & SOCIAL INQUIRY658

Jencks, Christopher. 1988. Racial Bias in Testing. In The Black-White Test Score Gap, ed. ChristopherJencks and Meredith Phillips, 55–85. Washington, DC: Brookings Institution Press.
Keltner, Dacher. 2006. Personal communication, April 5, 2006.Kidder, William C. 2000. The Rise of the Testocracy: An Essay on the LSAT: Conventional Wisdom,
and the Dismantling of Diversity. Texas Journal of Women and the Law 9:167–217.——. 2001. Does the LSAT Mirror or Magnify Racial and Ethnic Differences in Educational Attain-
ment?: A Study of Equally Achieving “Elite” Law Students. California Law Review 89:1055–1124.——. 2003. Law and Education: Affirmative Action Under Attack: The Struggle for Access from
Sweatt to Grutter: A History of African American, Latino and American Indian Law SchoolAdmissions, 1950–2000. Harvard Blackletter Journal 19:1–35.
Kilduff, Martin, and David V. Day 1994. Do Chameleons Get Ahead? The Effects of Self-Monitoringon Managerial Careers. Academy of Management Journal 37:1047–60.
Kristof, Amy L. 1996. Person-Organization Fit: An Integrative Review of Its Conceptualizations,Measurement, and Implications. Personnel Psychology 49:1–49.
La Piana, William P. 1998. A History of the LSAC and the LSAT. http://lsac.org/LSACResources/Publications/PDFs/history-lsac-lsat.pdf (accessed April 9, 2011).
Lam, Laura T., and Susan L. Kirby. 2002. Is Emotional Intelligence an Advantage? An Exploration ofthe Impact of Emotional and General Intelligence on Individual Performance. Journal of SocialPsychology 142 (1): 133–43.
Law, Kenneth S., Chi-Sum Wong, and Lynda J. Song. 2004. The Construct and Criterion Validity ofEmotional Intelligence and Its Potential Utility for Management Studies. Journal of AppliedPsychology. 89:483–96.
Law School Admission Council. 1999. LSAT/LSDAS Registration & Information Book. Newtown, PA:Law School Admission Services.
Lempert, Richard O., David L. Chambers, and Terry K. Adams. 2000. From the Trenches and Towers:Law School Affirmative Action: An Empirical Study of Michigan’s Minority Graduates inPractice: The River Runs through Law School. Law & Social Inquiry 25:395–504.
Linn, Robert L., and C. Nicholas Hastings. 1983. A Meta Analysis of the Validity of Predictors ofPerformance in Law School. Reports of LSAC Sponsored Research: 1978–1983. Newtown, PA:Law School Admission Services.
Makikangas, Anne, and Ulla Kinnunen. 2003. Psychosocial Work Stressors and Well-Being: Self-Esteem and Optimism as Moderators in a One-Year Longitudinal Sample. Personality and Indi-vidual Differences 35 (3): 537–57.
McDaniel, Michael A., Frederick P. Morgeson, Elizabeth B. Finnegan, Michael A. Campion, and EricP. Braverman. 2001. Predicting Job Performance Using Situational Judgment Tests: A Clarifica-tion of the Literature. Journal of Applied Psychology 86:730–40.
Motowidlo, Steve. 2006. January 9, Personal communication.Mumford, Michael. 1994. Biodata Handbook: Theory, Research, and Use of Biographical Information in
Selection and Performance Prediction. Palo Alto, CA: CPP Books.Norton, Lynne L., Deborah A. Suto, and Lynda M. Reese. 2006. Analysis of Differential Prediction of
Law School Performance by Racial/ethnic Subgroups Based on 2002–2004 Entering Law SchoolClasses. Law School Admission Council Technical Research Report TR-06-01. Newton, PA: LawSchool Admission Services.
Ones, Denis S., Vish C. Viswesvaran, and Frank L. Schmidt. 1993. Comprehensive Meta-Analysis ofIntegrity Test Validities: Findings and Implications for Personnel Selection and Theories of JobPerformance. Journal of Applied Psychology 78:679–703.
Oswald, Frederick L., Neal Schmitt, Brian H. Kim, Lauren J. Ramsay, and Michael A. Gillespie. 2004.Developing a Biodata Measure and Situational Judgment Inventory as Predictors of CollegeStudent Performance. Journal of Applied Psychology 89:187–207.
Powers, Donald E. 1982. Long-Term Predictive and Construct Validity of Two Traditional Predictorsof Law School Performance. Journal of Educational Psychology 74:568–76.
Sackett, Paul R., Matthew J. Borneman, and Brian S. Connelly. 2008. High-Stakes Testing in HigherEducation and Employment: Appraising the Evidence for Validity and Fairness. American Psy-chologist 63:215–27.
Predicting Lawyer Effectiveness 659

Sackett, Paul R., Neal Schmitt, Jill E. Ellingson, and Melissa B. Kabin. 2001. High-Stakes Testing inEmployment, Credentialing, and Higher Education: Prospects in a Post Affirmative-ActionWorld. American Psychologist 56:302–78.
Salgado, Jose F. 1997. The Five Factor Model of Personality and Job Performance in the EuropeanCommunity. Journal of Applied Psychology 82:30–43.
Salovey, Peter, John D. Mayer, Susan L. Goldman, Carolyn Turvey, and Tibor Palfai. 1995. EmotionalAttention, Clarity and Repair: Exploring Emotional Intelligence Using the Trait Meta-MoodScale. In Emotion, Disclosure, and Health, ed. James W. Pennebaker, 125–54. Washington, DC:American Psychological Association.
Saucier, Gerard, and Lewis R. Goldberg. 1998. What Is Beyond the Big Five? Journal of Personality66:495–524.
Scheier, Michael F., and Charles S. Carver. 1985. Optimism, Coping, and Health: Assessment andImplications of Generalized Outcome Expectancies. Health Psychology 4:219–47.
——. 1992. Effects of Optimism on Psychological and Physical Well-Being: Theoretical Overview andEmpirical Update. Cognitive Therapy and Research 16:201–28.
Scheier, Michael F., Charles S. Carver, and Michael W. Bridges. 1994. Distinguishing Optimism fromNeuroticism (and Trait Anxiety, Self-mastery, and Self-esteem): A Reevaluation of the LifeOrientation Test. Journal of Personality and Social Psychology 67:1063–78.
Schiltz, Patrick J. 1999. On Being a Happy, Healthy and Ethical Member of an Unhappy, Unhealthyand Unethical Profession. Vanderbilt Law Review 52:871–951.
Schmidt, Frank L. 2002. The Role of General Cognitive Ability and Job Performance: Why ThereCannot Be a Debate. Human Performance 15:187–210.
Schmidt, Frank L., and John E. Hunter. 1981. Employment Testing: Old Theories and New ResearchFindings. American Psychologist 36:1128–37.
——. 1998. The Validity and Utility of Selection Methods in Personnel Psychology: Practicaland Theoretical Implications of 85 Years of Research Findings. Psychological Bulletin 124:262–74.
Schmitt, Neal, William Rogers, David Chan, Lori Sheppard, and Danielle Jennings. 1997. Adverseimpact and predictive efficiency of various predictor combinations. Journal of Applied Psychology82:719–30.
Schrader, W. B. 1977. Summary of Law School Validity Studies, 1948–1975. Law School AdmissionCouncil Report No. LSAC-76-8. Princeton, NJ: Law School Admission Council.
Shultz, Marjorie, and Sheldon Zedeck. 2008. Final Report: Identification, Development, and Valida-tion of Predictors for Successful Lawyering. Unpublished manuscript, on file with authors.
——. 2003. Phase I Final Report: Identification and Development of Predictors for Successful Law-yering. Unpublished manuscript, on file with authors.
Slaski, Mark, and Susan Cartwright. 2002. Health, Performance and Emotional Intelligence: AnExploratory Study of Retail Managers. Stress and Health 18:63–68.
Smith, Patricia C., and Lorne M. Kendall. 1963. Retranslation of Expectations: An Approach to theConstruction of Unambiguous Anchors for Ratings Scales. Journal of Applied Psychology 47:149–55.
Snyder, Mark. 1974. Self-Monitoring of Expressive Behavior. Journal of Personality and Social Psychol-ogy 30:526–37.
Snyder, Mark, and Steve Gangestad. 1986. On the Nature of Self-Monitoring: Matters of Assessment,Matters of Validity. Journal of Personality and Social Psychology 51:125–39.
Society of American Law Teachers. 2003. SALT on the LSAT. http://www.saltlaw.org/userfiles/file/2003_StatementLSATBrochure.pdf (accessed March 21, 2011).
Stilwell, Lisa A., Susan P. Dalessandro, and Lynda M. Reese. 2003. Predictive Validity of the LSAT: ANational Summary of the 2001–2002 Correlation Studies. Law School Admission Council LSATTechnical Research Report TR-03-01. Newtown, PA: Law School Admission Services.
Stilwell, Lisa A., and Peter J. Pashley. 2003. Analysis of Differential Prediction of Law School Performanceby Racial/ethnic Subgroups Based on 1999–2001 Entering Law School Classes. Law School AdmissionCouncil LSAT Technical Research Report TR-03-03. Newtown, PA: Law School AdmissionServices.
LAW & SOCIAL INQUIRY660
Sturm, Susan, and Lani Guinier. 1996. The Future of Affirmative Action: Reclaiming the InnovativeIdeal. California Law Review 84:953–1036.
Sullivan, William M., Anne Colby, Judith Wegner, Lloyd Bond, and Lee Shulman. 2007. EducatingLawyers: Preparation for the Profession of Law. San Francisco: Jossey-Bass [“Carnegie Report”].
Tett, Robert P, Douglas N. Jackson, and Mitchell Rothstein. 1991. Personality Measures as Predictorsof Job Performance: A Meta-Analytic Review. Personnel Psychology 44:703–42.
Tett, Robert P., Jacquelyn R. Steele, and Russell S. Beauregard. 2003. Broad and Narrow Measures onBoth Sides of the Personality-Job Performance Relationship. Journal of Organizational Behavior24:335–56.
Weekley, Jeff A., and Robert E. Ployhart. 2005. Situational Judgment: Antecedents and Relationshipswith Performance. Human Performance 18:81–104.
Wiggins, Jerry S., and Paul D. Trapnell. 1997. Personality Structure: The Return of the Big Five. InHandbook of Personality Psychology, ed. Robert Hogan, John Johnson, and Stephen Briggs, 737–65. San Diego: Academic Press.
Wightman, Linda F. 1993. Predictive Validity of the LSAT: A National Summary of the 1990–1992Correlation Studies. Law School Admission Council Research Report 93-05. Newtown, PA: LawSchool Admission Services.
——. 1997. The Threat to Diversity in Legal Education: An Empirical Analysis of the Consequencesof Abandoning Race as a Factor in Law School Admission Decisions. New York University LawReview 72 (1): 1–53.
Wightman, Linda F., and David G. Muller. 1990. An Analysis of Differential Validity and DifferentialPrediction for Black, Mexican American, Hispanic, and White Law School Students. Law SchoolAdmission Council Research Report 90-03. Newtown, PA: Law School Admission Services.
Youssef, Carolyn M., and Fred Luthans. 2007. Emerging Positive Organizational Behavior. Journal ofManagement 33 (3): 321–49.
Xanthopoulou, Despoina, Arnold B. Bakker, Evangelia Demerouti, and Wilmer B. Schaufeli. 2007.The Role of Personal Resources in the Job Demands-Resources Model. International Journal ofStress Management 14 (2): 121–41.
Zedeck, Sheldon, Rick Jacobs, and Ditsa Kafry. 1976. Behavioral Expectations: Development ofParallel Forms and Analysis of Scale Assumptions. Journal of Applied Psychology 61:112–15.
Zedeck, Sheldon, Ditsa Kafry, and Rick Jacobs. 1976. Format and Scoring Variations in BehavioralExpectation Evaluations. Organizational Behavior and Human Performance 17:171–84.
CASES CITED
Grutter v. Bollinger, 539 U.S. 306 (2003).
Predicting Lawyer Effectiveness 661


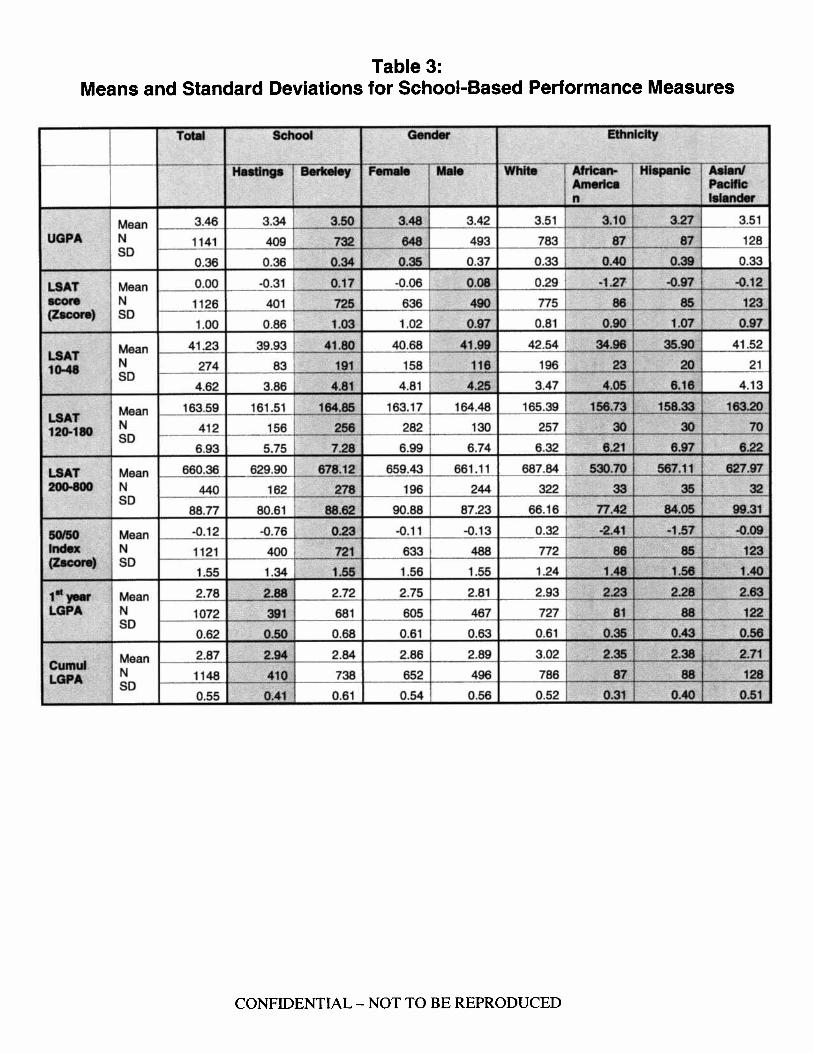


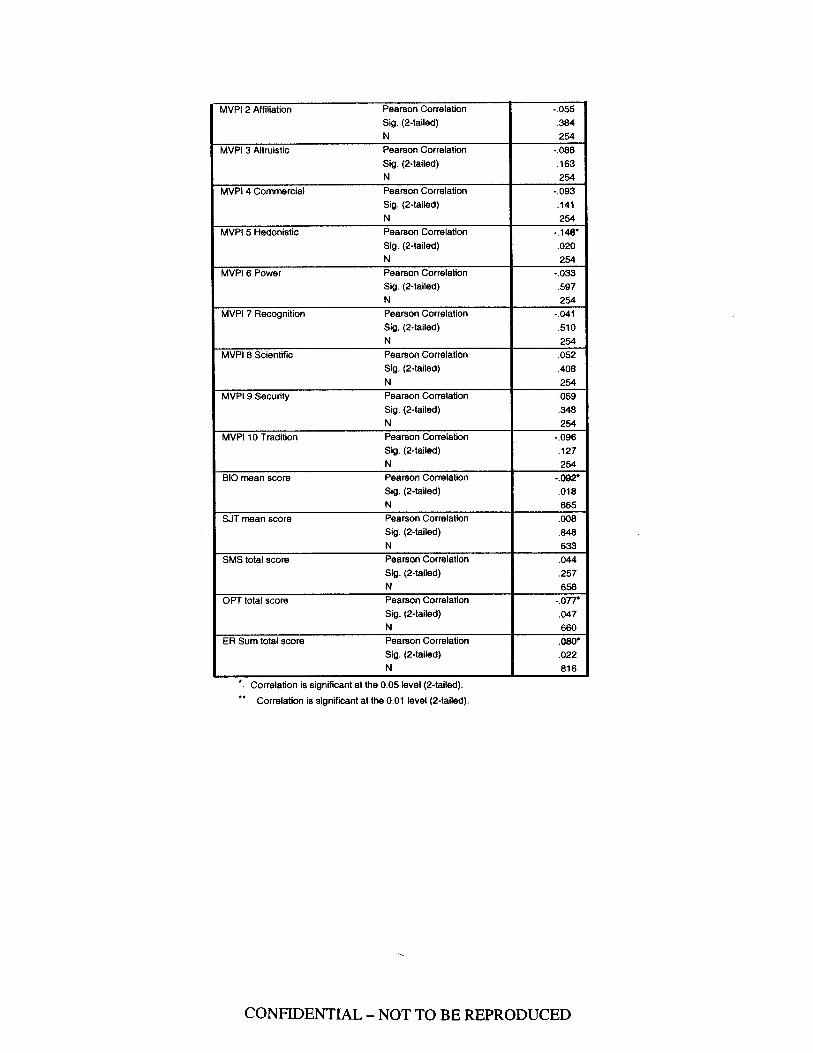


Recommended