Understanding Voting Patterns in Rural West Bengal:Role of Clientelism and Local Public Goods
Pranab BardhanUniversity of California, Berkeley
Sandip MitraIndian Statistical Institute, Kolkata
Dilip MookherjeeBoston University
Anusha NathBoston University
December 2013P. Bardhan, S, Mitra, D. Mookherjee, A. Nath
Voting Patterns in WB

Introduction: Reversal of Fortune
Dramatic change in West Bengal politics in 2011: loss ofmajority in state legislature by Left FrontAfter having won six successive elections, since 1977Reversal of pro-incumbency pattern which had beenunique amongst all Indian statesNotable erosion of support from groups that used to becore, durable supporters of the Left: landless and smalllandowners, scheduled castes and tribes
P. Bardhan, S, Mitra, D. Mookherjee, A. Nath
Voting Patterns in WB
Motivation
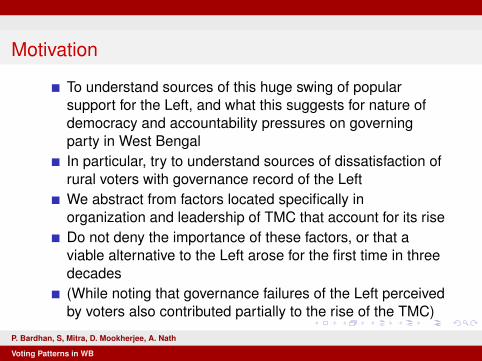
To understand sources of this huge swing of popularsupport for the Left, and what this suggests for nature ofdemocracy and accountability pressures on governingparty in West BengalIn particular, try to understand sources of dissatisfaction ofrural voters with governance record of the LeftWe abstract from factors located specifically inorganization and leadership of TMC that account for its riseDo not deny the importance of these factors, or that aviable alternative to the Left arose for the first time in threedecades(While noting that governance failures of the Left perceivedby voters also contributed partially to the rise of the TMC)
P. Bardhan, S, Mitra, D. Mookherjee, A. Nath
Voting Patterns in WB

Possible Reasons for Reversal of Voter Support
Governance failures perceived by votersChanges in voter characteristics
P. Bardhan, S, Mitra, D. Mookherjee, A. Nath
Voting Patterns in WB
Classification of Governance Failures
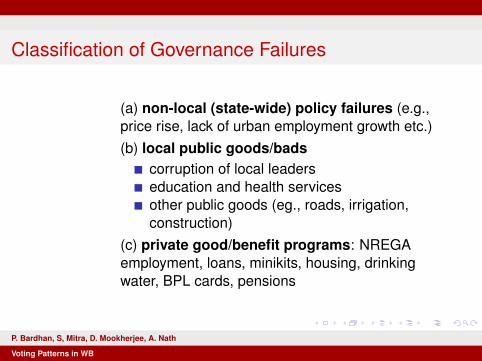
(a) non-local (state-wide) policy failures (e.g.,price rise, lack of urban employment growth etc.)(b) local public goods/bads
corruption of local leaderseducation and health servicesother public goods (eg., roads, irrigation,construction)
(c) private good/benefit programs: NREGAemployment, loans, minikits, housing, drinkingwater, BPL cards, pensions
P. Bardhan, S, Mitra, D. Mookherjee, A. Nath
Voting Patterns in WB

Changes in Voters Characteristics
(d) Younger, more educated, more mobilevoters with higher aspirations and expectations(e) Better informed voters (owing to spread ofmedia)(f) Decline in clientelism (voters may care lessabout benefits disbursed by parties in order to winvotes)
P. Bardhan, S, Mitra, D. Mookherjee, A. Nath
Voting Patterns in WB
Broader Motivation
To what extent does the political transition in West Bengalrepresent higher accountability standards imposed byvoters?Rather than declining quality of governance?Which one is dominant determines whether politicaleconomy factors aid or hinder development process
P. Bardhan, S, Mitra, D. Mookherjee, A. Nath
Voting Patterns in WB

Methodology
Our results are based on surveys of 2400 voters duringSeptember – December 2011, who were surveyedpreviously in 2003-04Stratified random sample from 89 villages drawn from allagricultural districts of WBengalQuestionnaire: household demographics, assets, benefitsreceived from local governments and party workers,political attitudes, awareness, election turnout,participation in gram sabhas, political campaignsFollowed by a secret ballot (different party symbols)Describe preliminary results concerning patterns andcorrelations, rather than underlying causal mechanisms
P. Bardhan, S, Mitra, D. Mookherjee, A. Nath
Voting Patterns in WB

Household profile, circa 2004
Agri Land Ownership in 2004
No. of HH Age HoH % HoH Males
Max Educa?on (in HH)
% SC/ST % Agri Occupa?on
Landless 1214 45 88 6.6 37.4 260-‐1.5 Acres 658 48 88 7.8 38.9 651.5 -‐ 2.5 Acres 95 56 92 10.8 22.4 822.5-‐5 Acres 258 58 93 11.1 27.1 725-‐10 Acres 148 60 89 12.5 26.1 66>10 29 59 100 13.9 30.9 72All 2402 49 89 8 35.4 47
Table 1A: Sample Characteris?cs: Household heads
P. Bardhan, S, Mitra, D. Mookherjee, A. Nath
Voting Patterns in WB
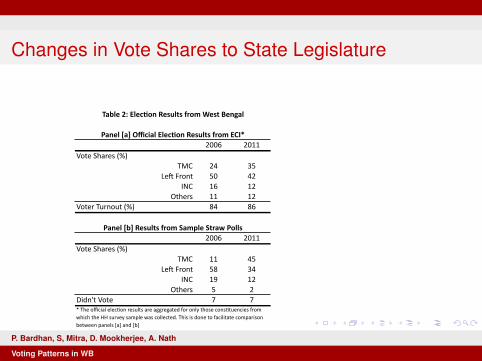
Changes in Vote Shares to State Legislature
2006 2011Vote Shares (%)
TMC 24 35Le9 Front 50 42
INC 16 12Others 11 12
Voter Turnout (%) 84 86
2006 2011Vote Shares (%)
TMC 11 45Le9 Front 58 34
INC 19 12Others 5 2
Didn't Vote 7 7
Panel [b] Results from Sample Straw Polls
Panel [a] Official Elec:on Results from ECI*
Table 2: Elec:on Results from West Bengal
* The official elecKon results are aggregated for only those consKtuencies from which the HH survey sample was collected. This is done to facilitate comparison between panels [a] and [b]
P. Bardhan, S, Mitra, D. Mookherjee, A. Nath
Voting Patterns in WB

Changes in Vote Shares, cont’d
Sharper swing in our straw poll (between 2004-2011),compared with actual vote shares (between 2006-2011)Possible reasons for the difference:
Some of the decline in the Left’s fortunes already set in by2006Set of voters in our poll unchanged between 2004-11,unlike actual set of voters
P. Bardhan, S, Mitra, D. Mookherjee, A. Nath
Voting Patterns in WB
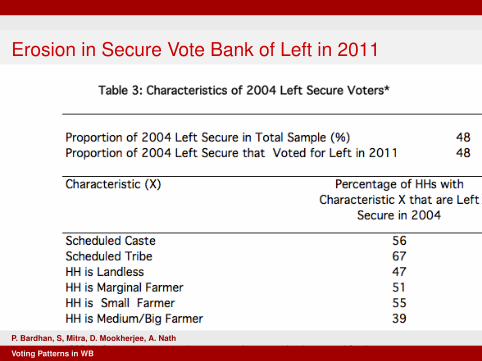
Erosion in Secure Vote Bank for Left
In 2004, we found approximately half of all voters hadreported voted for the Left consistently for the previous 25years: call them Left-secure votersST, SC, landless and less educated household heads weremore likely to be Left-secure votersSignificant erosion in this vote bank in 2011
P. Bardhan, S, Mitra, D. Mookherjee, A. Nath
Voting Patterns in WB
Erosion in Secure Vote Bank of Left in 2011
P. Bardhan, S, Mitra, D. Mookherjee, A. Nath
Voting Patterns in WB

Erosion in Secure Vote Bank of Left in 2011, contd
Number of HH Propor-on HHVo-ng Le2
(2004 Straw Polls)
Propor-on HHVo-ng Le2 (2011
Straw Polls)
All HH 2384 0.58 0.32SC HH 764 0.65 0.37ST HH 83 0.73 0.42Hindu 1902 0.58 0.32Muslim 462 0.57 0.35Landless 1143 0.58 0.32Marginal Land 697 0.64 0.35Small Land 150 0.56 0.31Medium Land 393 0.47 0.26
Table 4: Changes in Propor3on of HH Vo3ng for Le8 by Caste, Religion andLand Ownership
Note: The classifica-on of land holdings uses agriculture land holdings in respec-ve periods:
marginal land: 0<agricultural landholdings <=1.25 acres
small: 1.25<agri land <=2.5 acres
medium and big: agriland> 2.5 acres.P. Bardhan, S, Mitra, D. Mookherjee, A. Nath
Voting Patterns in WB

1. Role of Changing Demographics?
Argued by many that changing demographics of India’svoting population, esp. new voters in their twenties, isloosening traditional identities based on caste, religion orideologyIs there any evidence of this? Do young people votedifferently?Our straw polls are conducted on the same set ofhouseholdsAbout 10% of households experienced a change in headbetween 2004-11, owing most often to death of the 2004headExamine voting patterns across households thatexperience change of heads, and across different agecohorts
P. Bardhan, S, Mitra, D. Mookherjee, A. Nath
Voting Patterns in WB
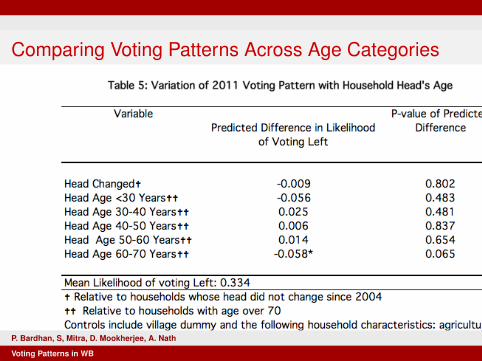
Comparing Voting Patterns Across Age Categories
P. Bardhan, S, Mitra, D. Mookherjee, A. Nath
Voting Patterns in WB
2. Role of Increasing Media Exposure?
No change in proportion of those reading newspapersbetween 2004-2011In contrast, 13% increase in those reporting they watchedTV regularlyEffect of watching TV on likelihood of swing (i.e., the voterswitching from voting for Left in 2004 to voting for TMC in2011) is statistically insignificant, after controlling forhousehold characteristics
P. Bardhan, S, Mitra, D. Mookherjee, A. Nath
Voting Patterns in WB
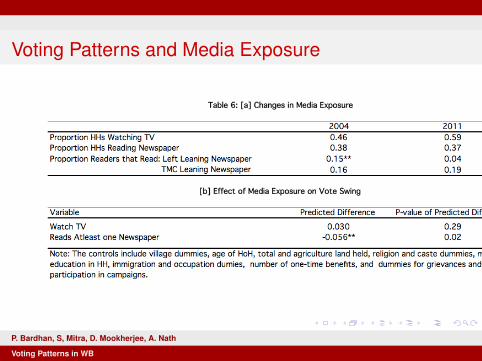
Voting Patterns and Media Exposure
P. Bardhan, S, Mitra, D. Mookherjee, A. Nath
Voting Patterns in WB
3. Decline in Flows or Pro-Poor Targeting of PrivateGood Benefit Programs?
We now examine possible role of changes in flow of privategood benefit programs to rural poorWas there a significant decline in such benefits deliveredby Left Front controlled GPs, compared with thosedelivered by TMC controlled GPs?We do find evidence of a larger decline in per-HH benefitsdelivered by Left controlled GPs, compared with TMCcontrolled GPs
P. Bardhan, S, Mitra, D. Mookherjee, A. Nath
Voting Patterns in WB
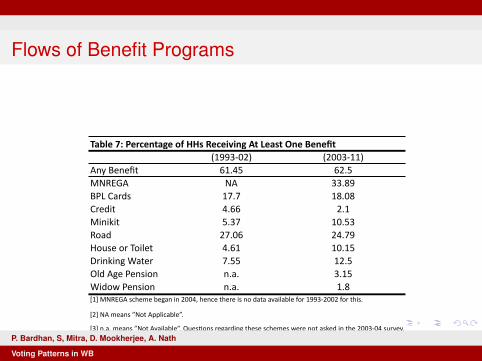
Flows of Benefit Programs
(1993-‐02) (2003-‐11)Any Benefit 61.45 62.5MNREGA NA 33.89BPL Cards 17.7 18.08Credit 4.66 2.1Minikit 5.37 10.53Road 27.06 24.79House or Toilet 4.61 10.15Drinking Water 7.55 12.5Old Age Pension n.a. 3.15Widow Pension n.a. 1.8
[2] NA means ”Not Applicable”.
[3] n.a. means ”Not Available”. QuesXons regarding these schemes were not asked in the 2003-‐04 survey.
Table 7: Percentage of HHs Receiving At Least One Benefit
[1] MNREGA scheme began in 2004, hence there is no data available for 1993-‐2002 for this.
P. Bardhan, S, Mitra, D. Mookherjee, A. Nath
Voting Patterns in WB
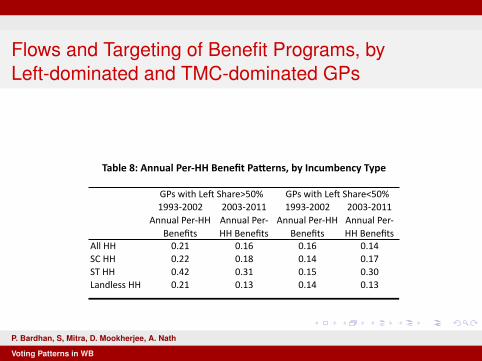
Flows and Targeting of Benefit Programs, byLeft-dominated and TMC-dominated GPs
1993-‐2002 2003-‐2011 1993-‐2002 2003-‐2011Annual Per-‐HH
BenefitsAnnual Per-‐HH Benefits
Annual Per-‐HH Benefits
Annual Per-‐HH Benefits
All HH 0.21 0.16 0.16 0.14SC HH 0.22 0.18 0.14 0.17ST HH 0.42 0.31 0.15 0.30Landless HH 0.21 0.13 0.14 0.13
GPs with LeD Share>50% GPs with LeD Share<50%
Table 8: Annual Per-‐HH Benefit Pa3erns, by Incumbency Type
P. Bardhan, S, Mitra, D. Mookherjee, A. Nath
Voting Patterns in WB

Role of Clientelism: One-Time versus RecurringTransfers
Our earlier work (Bardhan et al (2009)) found strikingasymmetry between receipt of one-time and recurringbenefits and voting patternsOne-time programs: BPL card, road, house/toilet, drinkingwaterRecurring programs: employment, credit, minikitsAnalysis of 2004 voting patterns showed only receipt ofrecurring benefits from Left dominated GPs weresignificantly associated with higher likelihood of voting forLeft
P. Bardhan, S, Mitra, D. Mookherjee, A. Nath
Voting Patterns in WB

Role of Clientelism: One-Time versus RecurringTransfers, contd.
Indicates role of clientelism: implicit trade of votes forbenefits based on long term relationships between partyworkers and votersSo we should look at distribution patterns of recurringbenefits specifically, since 2004Find an increase in recurring benefits distributed by bothparties, especially to the poorBut as in the case of all benefits, the rise in recurringbenefits was larger in TMC controlled areas
P. Bardhan, S, Mitra, D. Mookherjee, A. Nath
Voting Patterns in WB
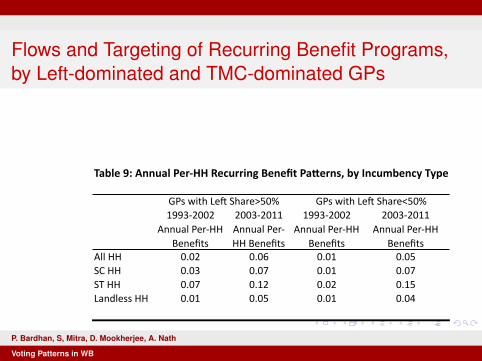
Flows and Targeting of Recurring Benefit Programs,by Left-dominated and TMC-dominated GPs
1993-‐2002 2003-‐2011 1993-‐2002 2003-‐2011Annual Per-‐HH
BenefitsAnnual Per-‐HH Benefits
Annual Per-‐HH Benefits
Annual Per-‐HH Benefits
All HH 0.02 0.06 0.01 0.05SC HH 0.03 0.07 0.01 0.07ST HH 0.07 0.12 0.02 0.15Landless HH 0.01 0.05 0.01 0.04
Table 9: Annual Per-‐HH Recurring Benefit Pa7erns, by Incumbency Type
GPs with LeC Share>50% GPs with LeC Share<50%
P. Bardhan, S, Mitra, D. Mookherjee, A. Nath
Voting Patterns in WB
4. Decline in Clientelism?
Below we shall check effects of changing flows of recurringbenefits on votesMeanwhile, consider a related question: is clientelismweakening as a vote generating factor?Many political scholars have explained how clientelismtends to decline along the process of development, asvoters earn more, become more self-reliant, care moreabout public goods and governance than private benefitsUse the household panel to check whether clientelism hasbeen weakening, by comparing effectiveness of recurringbenefits as a vote generating machine between 1993-2003with 2004-2011
P. Bardhan, S, Mitra, D. Mookherjee, A. Nath
Voting Patterns in WB
Comparative Effectiveness of Clientelism AcrossParties
Theoretical models of clientelism (Bardhan-Mookherjee(2011)) show effectiveness of clientelistic benefits can varyacross parties owing to variations in:
party organization (contact between party workers andvoters needed to sustain reciprocity)voter expectations (regarding which party is likely to win)
Effectiveness of clientelistic transfers is greater for partywith superior party contact with voters, and those thatvoters expect will winSo we shall allow clientelistic effectiveness to vary by partyand across time periods
P. Bardhan, S, Mitra, D. Mookherjee, A. Nath
Voting Patterns in WB
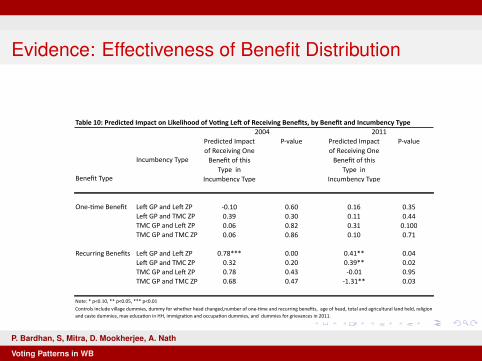
Evidence: Effectiveness of Benefit Distribution
Table 10: Predicted Impact on Likelihood of Vo:ng Le< of Receiving Benefits, by Benefit and Incumbency Type
Benefit Type
Incumbency Type
Predicted Impact of Receiving One Benefit of this
Type in Incumbency Type
P-‐value Predicted Impact of Receiving One Benefit of this
Type in Incumbency Type
P-‐value
One-‐>me Benefit Le@ GP and Le@ ZP -‐0.10 0.60 0.16 0.35Le@ GP and TMC ZP 0.39 0.30 0.11 0.44TMC GP and Le@ ZP 0.06 0.82 0.31 0.100TMC GP and TMC ZP 0.06 0.86 0.10 0.71
Recurring Benefits Le@ GP and Le@ ZP 0.78*** 0.00 0.41** 0.04Le@ GP and TMC ZP 0.32 0.20 0.39** 0.02TMC GP and Le@ ZP 0.78 0.43 -‐0.01 0.95TMC GP and TMC ZP 0.68 0.47 -‐1.31** 0.03
Note: * p<0.10, ** p<0.05, *** p<0.01
2004 2011
Controls include village dummies, dummy for whether head changed,number of one-‐>me and recurring benefits, age of head, total and agricultural land held, religion and caste dummies, max educa>on in HH, immigra>on and occupa>on dummies, and dummies for grievances in 2011.
P. Bardhan, S, Mitra, D. Mookherjee, A. Nath
Voting Patterns in WB
Further Lack of Evidence for Declining Effectivenessof Clientelist Programs
Evidence against general decline in clientelism:effectiveness declined for Left, while it rose for TMCEffectiveness of clientelistic benefits distributed by TMCrose more amongst younger votersTherefore the more likely explanation is that voterexpectations concerning odds of TMC winning were rising,and/or party organization of TMC was improving (relativeto Left)Process of shifting from equilibrium with Left dominance toanother with TMC dominance
P. Bardhan, S, Mitra, D. Mookherjee, A. Nath
Voting Patterns in WB
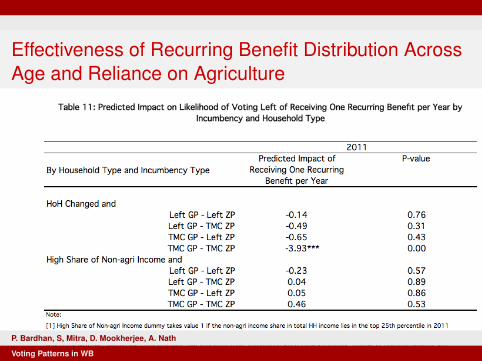
Effectiveness of Recurring Benefit Distribution AcrossAge and Reliance on Agriculture
P. Bardhan, S, Mitra, D. Mookherjee, A. Nath
Voting Patterns in WB

Quantitative Magnitude of Clientelistic Factors inExplaining Decline in Left Front Votes
Endowment CoefficientsEffect Change Effect
One4me Benefits*Le9 GP and Le9 ZP 0.001 -‐0.003(.002) (0.006)
One4me Benefits*Le9 GP and TMC ZP -‐0.001 0.003(0.002) (0.007)
One4me Benefits*TMC GP and Le9 ZP -‐0.004 -‐0.026**(0.004) (0.12)
One4me Benefits*TMC GP and TMC ZP 0.0005 -‐0.003(0.001) (0.002)
Recurring*Le9 GP and Le9 ZP -‐0.010** 0.006(0.004) (0.007)
Recurring*Le9 GP and TMC ZP -‐0.002 0.002(-‐0.002) (0.003)
Recurring*TMC GP and Le9 ZP -‐0.000 -‐0.000(0.004) (0.013)
Recurring*TMC GP and TMC ZP 0.001 0.002(0.001) (0.002)
HH Characteris4cs -‐0.002* 0.054(0.001) (0.11)
Constant 0.23**(0.11)
* p<0.10, ** p<0.05, *** p<0.01; clustered standard errors in parenthesesNotes: [1] Blinder-‐Oaxaca Decomposi4on of Changes in Likelihood of Vo4ng Le9 into changes in one 4me benefits and recurring benefits received by households, interacted with Incumbency type in preceding eight years, changes in household characteris4cs
[2] The mean difference in dependent variable between 2004 and 2011 is 0.25.
Table 12: Decomposi1on of Changes in Likelihood of Vo1ng Le; Between 2004 and 2011
(the endowment effect), and the changes in the regression coefficients of these variables between 2004 and 2011 regression
P. Bardhan, S, Mitra, D. Mookherjee, A. Nath
Voting Patterns in WB

Summary So Far
We see no evidence of role of rise in fraction of youngervotersNor do we see evidence of role of rising media (TV)exposureSome decline in recurring benefits distributed by Left topoor voters, and in effectiveness of clientelism of Left party(relative to TMC)But the quantitative role of this was negligible (around 1%)relative to observed decline in Left vote share (23% in oursample)
P. Bardhan, S, Mitra, D. Mookherjee, A. Nath
Voting Patterns in WB
5. Role of Voter Dissatisfaction with Other Dimensionsof Governance
2011 survey asked each respondent their dissatisfactionon other dimensions of performance of local and non-localleaders, on a 1-5 scale (with 5=maximal dissatisfaction)Such questions were not included in 2004 survey, so wecannot compare responses across the two time periodsFocus only on 2011 cross-sectional patterns of how votingvaried with reported dissatisfaction on different dimensions
P. Bardhan, S, Mitra, D. Mookherjee, A. Nath
Voting Patterns in WB
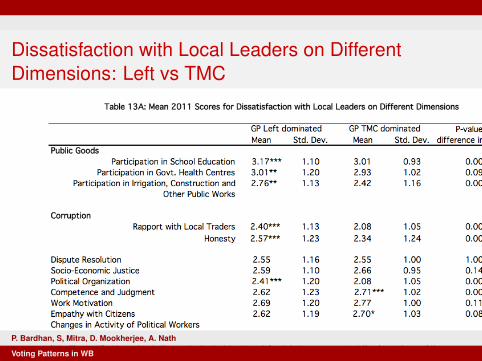
Dissatisfaction with Local Leaders on DifferentDimensions: Left vs TMC
P. Bardhan, S, Mitra, D. Mookherjee, A. Nath
Voting Patterns in WB
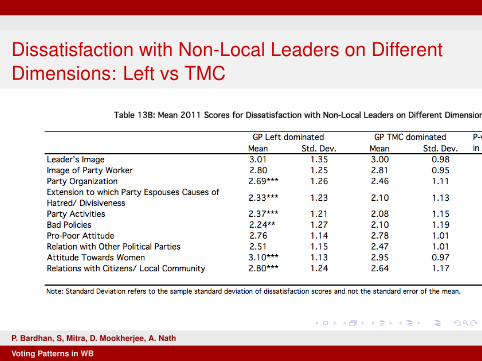
Dissatisfaction with Non-Local Leaders on DifferentDimensions: Left vs TMC
P. Bardhan, S, Mitra, D. Mookherjee, A. Nath
Voting Patterns in WB
Summary of Comparisons of Voter Dissatisfaction withLocal Leaders
Voters were significantly more dissatisfied with local Leftleaders compared with TMC leaders with respect to:
participation in provision of local public goodsindicators of corruptionpolitical organization, esp recent changes
and were less dissatisfied with respect to:competence and judgmentwork motivationempathy with citizens
P. Bardhan, S, Mitra, D. Mookherjee, A. Nath
Voting Patterns in WB
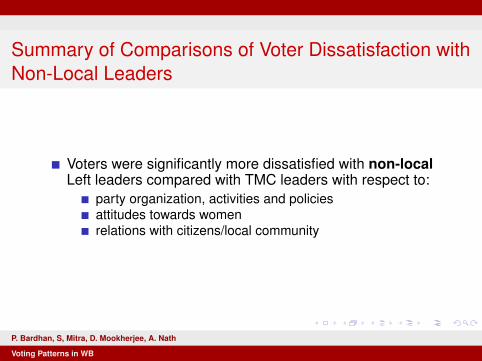
Summary of Comparisons of Voter Dissatisfaction withNon-Local Leaders
Voters were significantly more dissatisfied with non-localLeft leaders compared with TMC leaders with respect to:
party organization, activities and policiesattitudes towards womenrelations with citizens/local community
P. Bardhan, S, Mitra, D. Mookherjee, A. Nath
Voting Patterns in WB
Regression of Voting Patterns on ReportedDissatisfaction
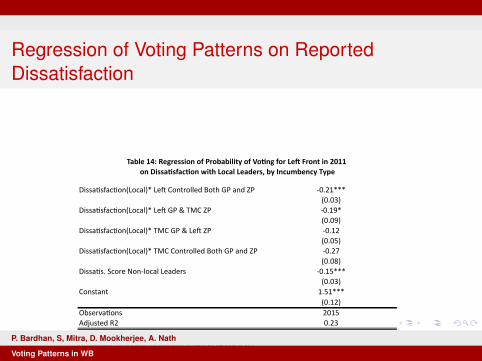
Dissa%sfac%on(Local)* Le1 Controlled Both GP and ZP -‐0.21***(0.03)
Dissa%sfac%on(Local)* Le1 GP & TMC ZP -‐0.19*(0.09)
Dissa%sfac%on(Local)* TMC GP & Le1 ZP -‐0.12(0.05)
Dissa%sfac%on(Local)* TMC Controlled Both GP and ZP -‐0.27(0.08)
Dissa%s. Score Non-‐local Leaders -‐0.15***(0.03)
Constant 1.51***(0.12)
Observa%ons 2015Adjusted R2 0.23
* p<0.10, ** p<0.05, *** p<0.01 Robust standard errors in parentheses, clustered at Mouza level.
[1] Dependent Variable measures probability of vo%ng for le1 front in 2011.
[2] Controls include Village Fixed Effects and HH Characteris%cs: agricultural and other land holdings,
age and age-‐square of HH head, maximum educa%on in HH and dummies for caste, religion, and occupa%on.
Table 14: Regression of Probability of Vo6ng for Le8 Front in 2011 on Dissa6sfac6on with Local Leaders, by Incumbency Type
P. Bardhan, S, Mitra, D. Mookherjee, A. Nath
Voting Patterns in WB
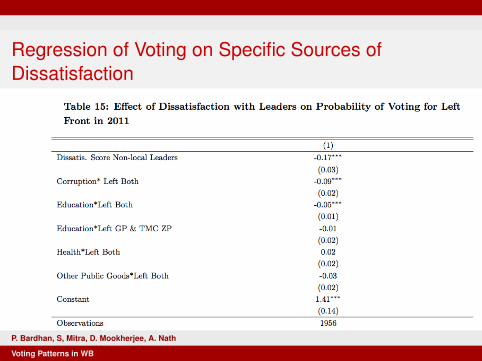
Regression of Voting on Specific Sources ofDissatisfaction
P. Bardhan, S, Mitra, D. Mookherjee, A. Nath
Voting Patterns in WB
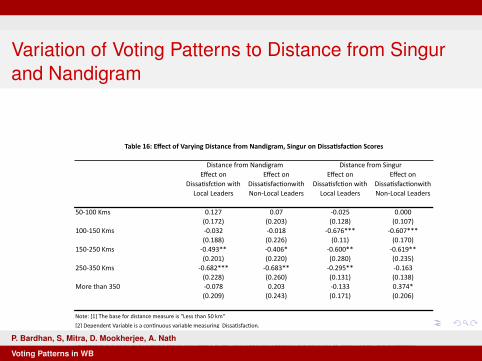
Variation of Voting Patterns to Distance from Singurand Nandigram
Effect on Dissa-sfc-on with Local Leaders
Effect on Dissa-sfac-onwith Non-‐Local Leaders
Effect on Dissa-sfc-on with Local Leaders
Effect on Dissa-sfac-onwith Non-‐Local Leaders
50-‐100 Kms 0.127 0.07 -‐0.025 0.000(0.172) (0.203) (0.128) (0.107)
100-‐150 Kms -‐0.032 -‐0.018 -‐0.676*** -‐0.607***(0.188) (0.226) (0.11) (0.170)
150-‐250 Kms -‐0.493** -‐0.406* -‐0.600** -‐0.619**(0.201) (0.220) (0.280) (0.235)
250-‐350 Kms -‐0.682*** -‐0.683** -‐0.295** -‐0.163(0.228) (0.260) (0.131) (0.138)
More than 350 -‐0.078 0.203 -‐0.133 0.374*(0.209) (0.243) (0.171) (0.206)
Table 16: Effect of Varying Distance from Nandigram, Singur on Dissa>sfac>on Scores
Agricultural and other land holdings, age of Hoh, square of age HoH, maximum educa-on and dummies for caste,religion, and occupa-on.
Distance from Nandigram Distance from Singur
Note: [1] The base for distance measure is "Less than 50 km"
[2] Dependent Variable is a con-nuous variable measuring Dissa-sfac-on.
[3] All Specifica-ons Include HH Characteris-cs: One-me and recurring Benefits, Grievances, dummy for lea majority in GP,P. Bardhan, S, Mitra, D. Mookherjee, A. Nath
Voting Patterns in WB

Summary
We find no evidence that changes in voter characteristics(age, media exposure, clientelistic dependence) played arole in the reversal of support for Left FrontMinor role played by changing pattern of private benefitsdistributed in Left and TMC dominated areas, and risingrelative effectiveness of TMC distributed benefitsKey factor was rising voter dissatisfaction with local Leftleaders with respect to corruption, and education qualitySome role also of non-local factors (such as landacquisition policy) but these were limited to areas within150 Km of Singur and Nandigram
P. Bardhan, S, Mitra, D. Mookherjee, A. Nath
Voting Patterns in WB
Recommended