1

2

3

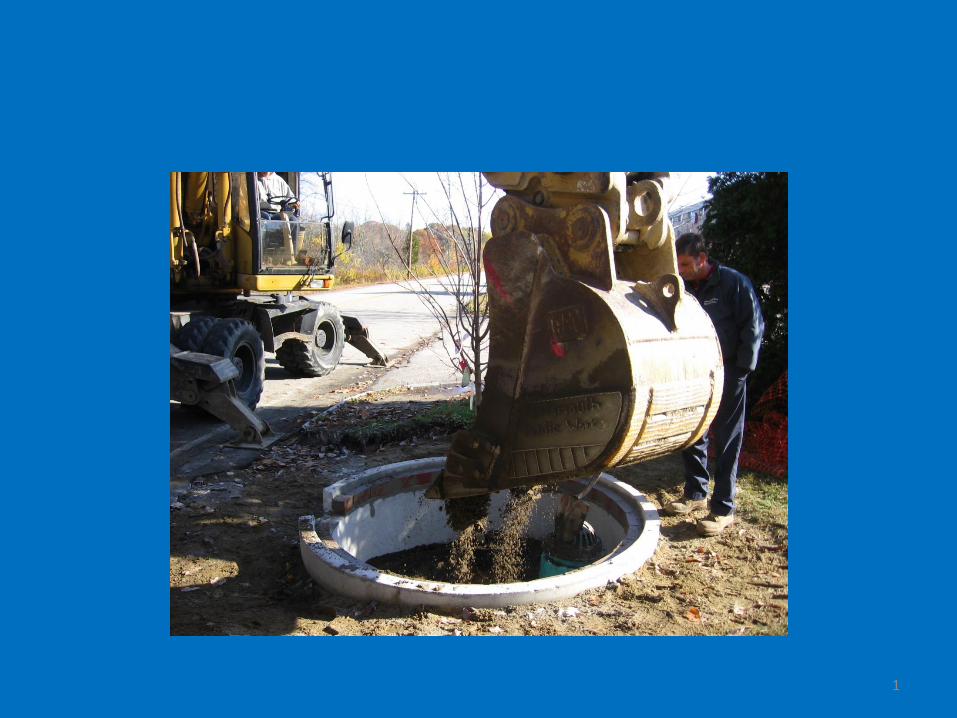
Durham innovative bioretention system, Durham, NH.
4

Capstone Development
5

Horne Street School, Dover NH
6

LID in 2006
7

LID in Now
8

Show me the data!
9

10
BMP Performance Monitoring
Research Field Facility at UNH Tc ~ 19 minutes
Watershed Boundary
Tree Filter
Porous Asphalt
Bioretention Retrofit
UNHSC Research Facility

11

Parallel Performance
Evaluation
•Each system uniformly sized to treat 1” runoff for 1 acre of impervious area
•WQV=3300 cf
•Qwqv=1 cfs
•Uniform contaminant loading
•Uniform storm event characteristics
•Systems lined for mass balance
•Long term record of hydrology and contaminants
12

Hydrodynamic Separator Subsurface Infiltration
Filter Unit
Porous Asphalt Retention Pond Stone Swale
Gravel Wetland Sand Filter Bioretention Unit Tree Filter
Pervious Concrete
Isolator Row
Veg Swale
13

TSS Removal Efficiencies
100
90
80
70
60
50
40
30
20
10
0
TSS
% R
em
ova
l Eff
icie
ncy

DIN Removal Efficiencies
100
90
80
70
60
50
40
30
20
10
0
DIN
% R
em
ova
l Eff
icie
ncy

TP Removal Efficiencies
100
90
80
70
60
50
40
30
20
10
0
TP
% R
em
ova
l Eff
icie
ncy

Online vs. Offline
17

HDS Online vs. Offline Performance
18
Rem
ova
l Eff
icie
ncy

Hydrologic Performance Results
19

Ru
no
ff R
ate
Time
Post-Development
Post-Development Peak Control
Pre-Development
Pre and Post Development Hydrographs
Courtesy Jeff Dennis, ME DEP, and CEI
Same storm < peak, = volume and > duration Same storm < peak and < volume
Storm with large peak and large volume
20

Swale Flow and Volume Attenuation
Average Annual Peak Flow Reduction is 48%
Average Annual Lag Time is 19 min
21

Porous Asphalt Flow and Volume Attenuation
Average Annual Peak Flow Reduction is 68%
Average Annual Lag Time is 790 min
22

23
Lag Time (kL) Peak Reduction (kP)
5 2 1 0.5 0.1
Hydraulic Performance

What Have We Learned?
Rea
ctiv
e
Proactive
25
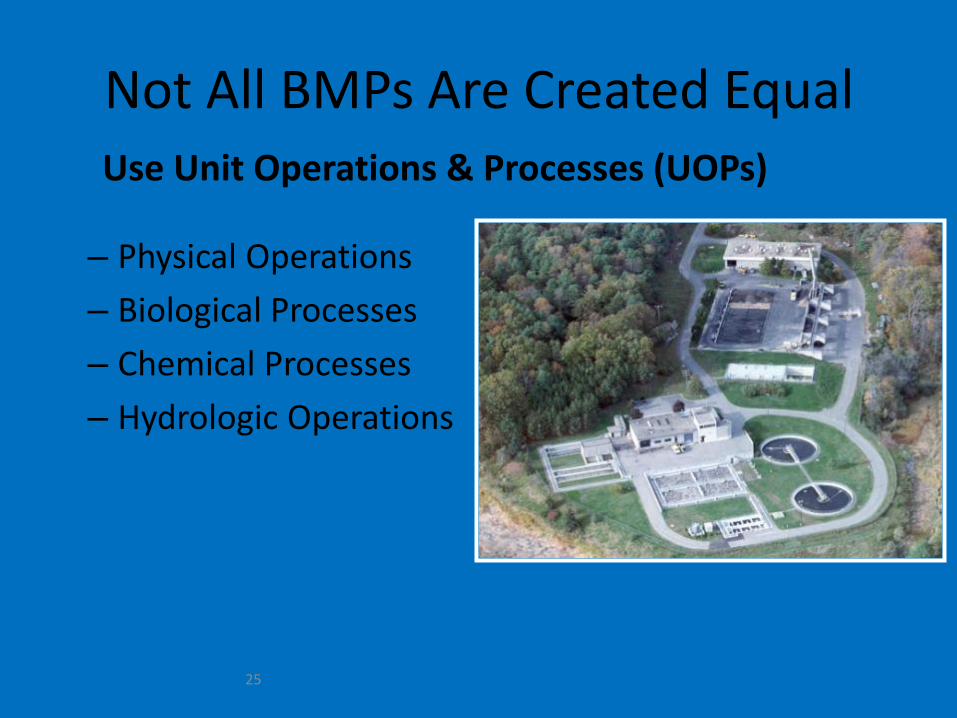
Not All BMPs Are Created Equal
– Physical Operations
– Biological Processes
– Chemical Processes
– Hydrologic Operations
Use Unit Operations & Processes (UOPs)
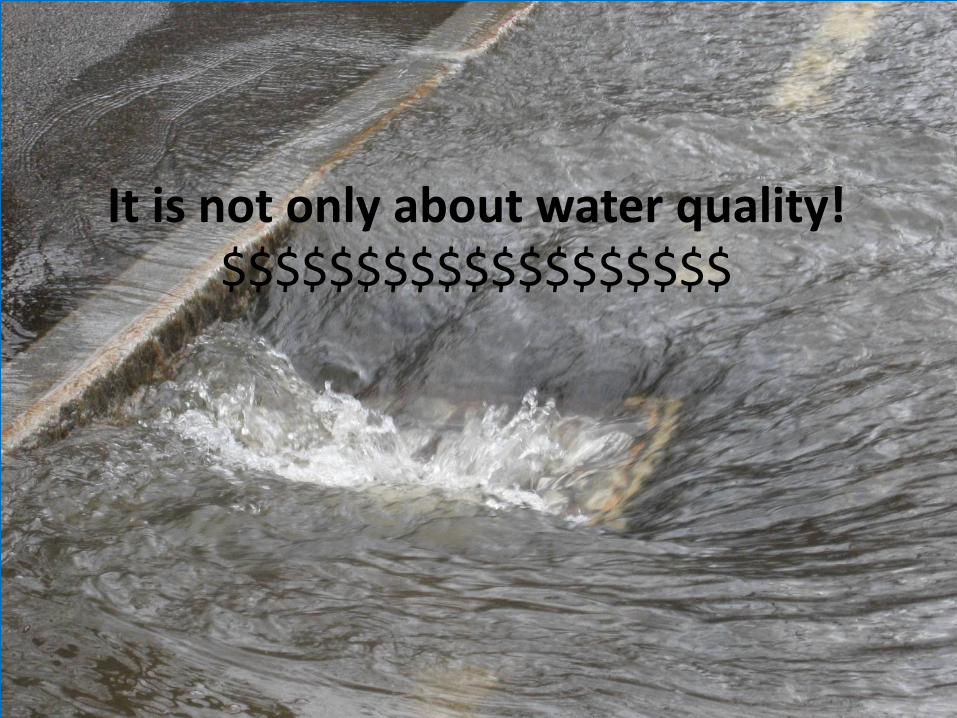
It is not only about water quality! $$$$$$$$$$$$$$$$$$$

Economic impacts of land use change (increased runoff)
1.) Loss of revenue due to impacts to tourism and natural resources
2) Expenses from stress to municipal infrastructure
27

Capital savings ranged from 15-80%
28

Not Just a Pipe Dream
29

30
Greenland Meadows Commercial Development, NH
Recommended


![POROUS ASPHALT PAVEMENTS1].pdf · Porous asphalt is an environmentally friendly tool for stormwater management. POROUS ASPHALT PAVEMENTS In the natural environment, rainfall sinks](https://img.pdfslide.us/doc/110x75/5afff62e7f8b9a54578be0b6/porous-asphalt-1pdfporous-asphalt-is-an-environmentally-friendly-tool-for-stormwater.jpg)