July 2013
SURVEY OVERVIEW
Methodology
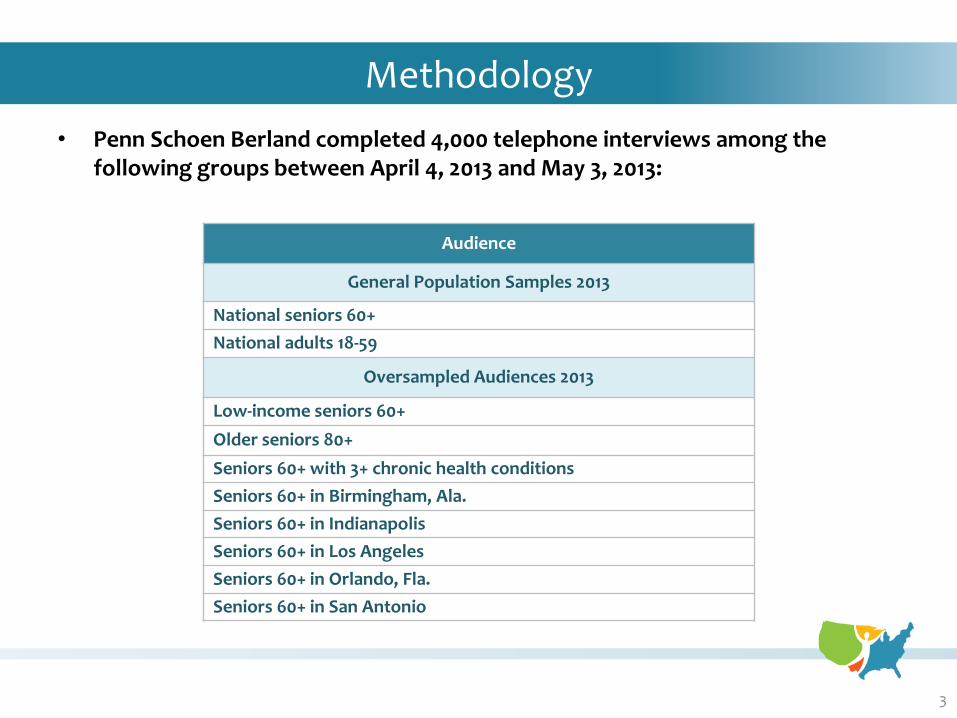
• Penn Schoen Berland completed 4,000 telephone interviews among the following groups between April 4, 2013 and May 3, 2013:
3
Audience
General Population Samples 2013
National seniors 60+
National adults 18-59
Oversampled Audiences 2013
Low-income seniors 60+
Older seniors 80+
Seniors 60+ with 3+ chronic health conditions
Seniors 60+ in Birmingham, Ala.
Seniors 60+ in Indianapolis
Seniors 60+ in Los Angeles
Seniors 60+ in Orlando, Fla.
Seniors 60+ in San Antonio
Methodology
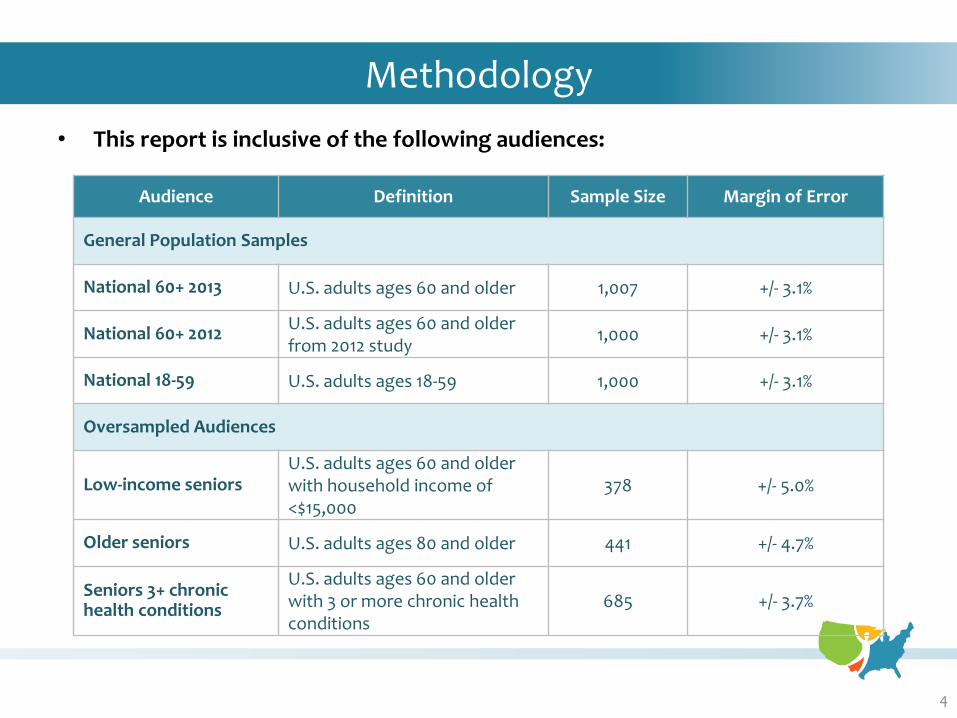
• This report is inclusive of the following audiences:
Audience Definition Sample Size Margin of Error
General Population Samples
National 60+ 2013 U.S. adults ages 60 and older 1,007 +/- 3.1%
National 60+ 2012 U.S. adults ages 60 and older from 2012 study
1,000 +/- 3.1%
National 18-59 U.S. adults ages 18-59 1,000 +/- 3.1%
Oversampled Audiences
Low-income seniors U.S. adults ages 60 and older with household income of <$15,000
378 +/- 5.0%
Older seniors U.S. adults ages 80 and older 441 +/- 4.7%
Seniors 3+ chronic health conditions
U.S. adults ages 60 and older with 3 or more chronic health conditions
685 +/- 3.7%
4
Methodology
• Please note:
– Data from general population samples, the regional oversampled audiences and the oversampled audience of seniors ages 80 and older are weighted to U.S. Census Bureau data. The following demographics are weighted:
• Age
• Gender
• Income
• Marital status
• Race
– Sample sizes under n=75 are not shown, as these sample sizes are too small to be statistically reliable
– All numbers in this report are percentages unless otherwise noted
– N/A indicates that the answer choice was not asked in the 2012 national 60+ survey
5

KEY THEMES
Key Themes
7
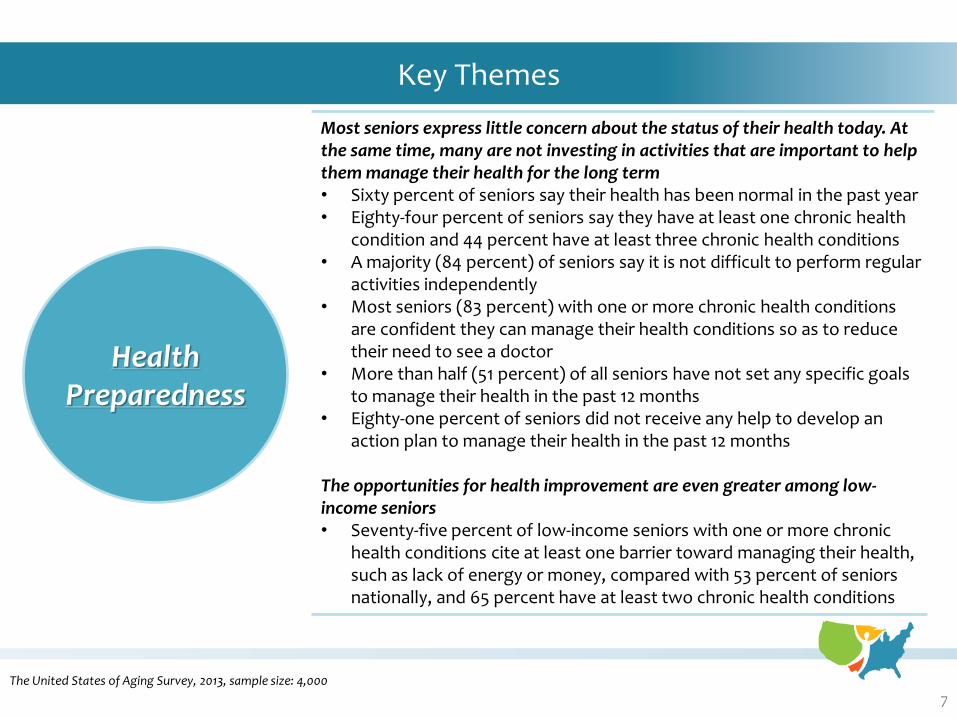
Health Preparedness
Most seniors express little concern about the status of their health today. At the same time, many are not investing in activities that are important to help them manage their health for the long term • Sixty percent of seniors say their health has been normal in the past year • Eighty-four percent of seniors say they have at least one chronic health
condition and 44 percent have at least three chronic health conditions • A majority (84 percent) of seniors say it is not difficult to perform regular
activities independently • Most seniors (83 percent) with one or more chronic health conditions
are confident they can manage their health conditions so as to reduce their need to see a doctor
• More than half (51 percent) of all seniors have not set any specific goals to manage their health in the past 12 months
• Eighty-one percent of seniors did not receive any help to develop an action plan to manage their health in the past 12 months
The opportunities for health improvement are even greater among low-income seniors • Seventy-five percent of low-income seniors with one or more chronic
health conditions cite at least one barrier toward managing their health, such as lack of energy or money, compared with 53 percent of seniors nationally, and 65 percent have at least two chronic health conditions
The United States of Aging Survey, 2013, sample size: 4,000
Key Themes
8
Financial Security
Although most seniors are comfortable with their current financial situation, a majority of seniors express concern about their long-term financial security • A majority (66 percent) of seniors say it is very easy or somewhat easy
to pay monthly living expenses • Nearly 1 in 5 (19 percent) seniors have had to reduce regular spending
to pay a regular monthly bill • Almost one-third (31 percent) of seniors are concerned about being
able to stay in their current home for as long as they would like • More than half (53 percent) of seniors nationally are concerned about
whether their savings and income will be sufficient to last the rest of their life
Older seniors (those ages 80 and older) are less likely to report financial anxieties • Eighty-four percent of older seniors have not had to reduce regular
spending to pay a regular monthly bill • Sixty-nine percent of older seniors say it is easy to pay monthly living
expenses
The United States of Aging Survey, 2013, sample size: 4,000
Key Themes
9
Community Support
While the majority of seniors agree their community is responsive to seniors’ needs, many lack confidence that their community is prepared to the meet the future needs of the growing senior population • Seventy-one percent of seniors say their community is responsive to
their needs • One in 2 seniors believe their community is doing enough to prepare for
the future needs of the growing senior population • Many seniors rate job opportunities, public transportation and
affordable housing options as fair or poor in their community today Adults ages 18-59 are less likely to believe their community is prepared to support the growing aging population • Forty-five percent of adults ages 18-59 do not believe their community is
doing enough to prepare for the future needs of the growing senior population
• Twenty-nine percent of adults ages 18-59 do not think their community is responsive to the needs of seniors
The United States of Aging Survey, 2013, sample size: 4,000
Key Themes
10
Wired Seniors
Comfortable users of technology, a large majority of seniors understand the importance of technology in helping them stay connected to family, friends and the wider world • When asked which technologies they use frequently, 75 percent of
seniors say cell phones, 68 percent say computers, 65 percent say the Internet, and 62 percent say email
• A large majority (83 percent) of seniors say it is important for seniors to use technology
• Almost all seniors say that technology is important in helping them stay in touch with family and friends (87 percent), keep up with the world (84 percent), learn new things (80 percent) and stay mentally sharp (79 percent)
Lack of understanding is a major barrier to seniors using more technology. Cost can be a major barrier too for those with lower incomes • The top reason seniors cite as preventing them from using more
technology is “I don’t understand how to use it” (34 percent) • Among low-income seniors, cost is a major barrier – nearly 1 in 2 say
technology “costs too much”
The United States of Aging Survey, 2013, sample size: 4,000

GENERAL OUTLOOK
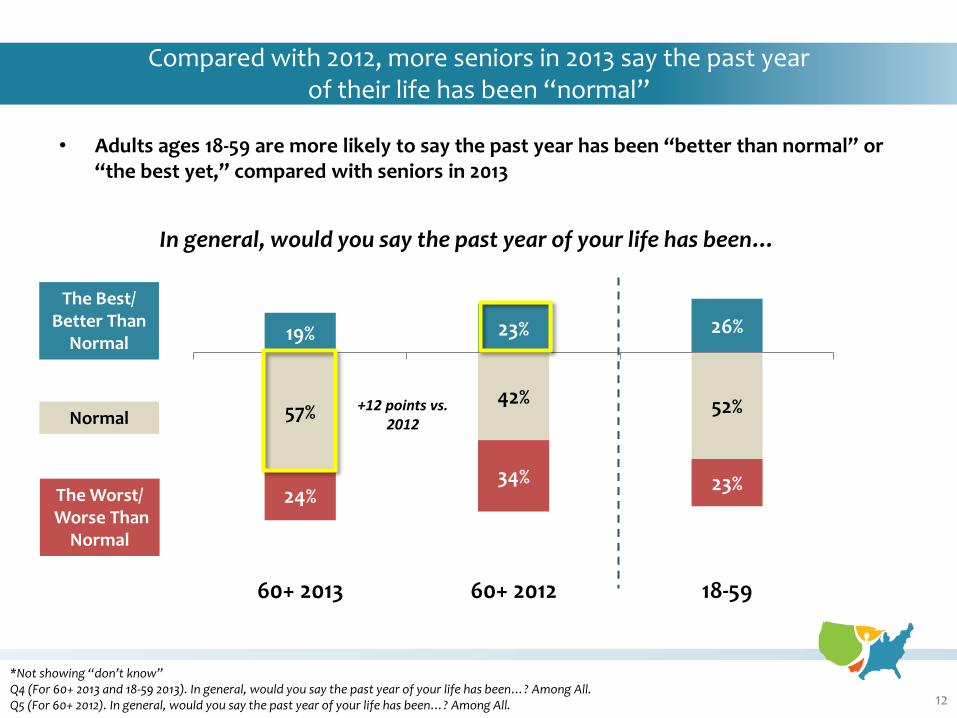
Compared with 2012, more seniors in 2013 say the past year of their life has been “normal”
12
57% 42% 52%
24% 34% 23%
19% 23% 26%
60+ 2013 60+ 2012 18-59
*Not showing “don’t know” Q4 (For 60+ 2013 and 18-59 2013). In general, would you say the past year of your life has been…? Among All. Q5 (For 60+ 2012). In general, would you say the past year of your life has been…? Among All.
In general, would you say the past year of your life has been…
The Best/ Better Than
Normal
The Worst/ Worse Than
Normal
Normal +12 points vs.
2012
• Adults ages 18-59 are more likely to say the past year has been “better than normal” or “the best yet,” compared with seniors in 2013
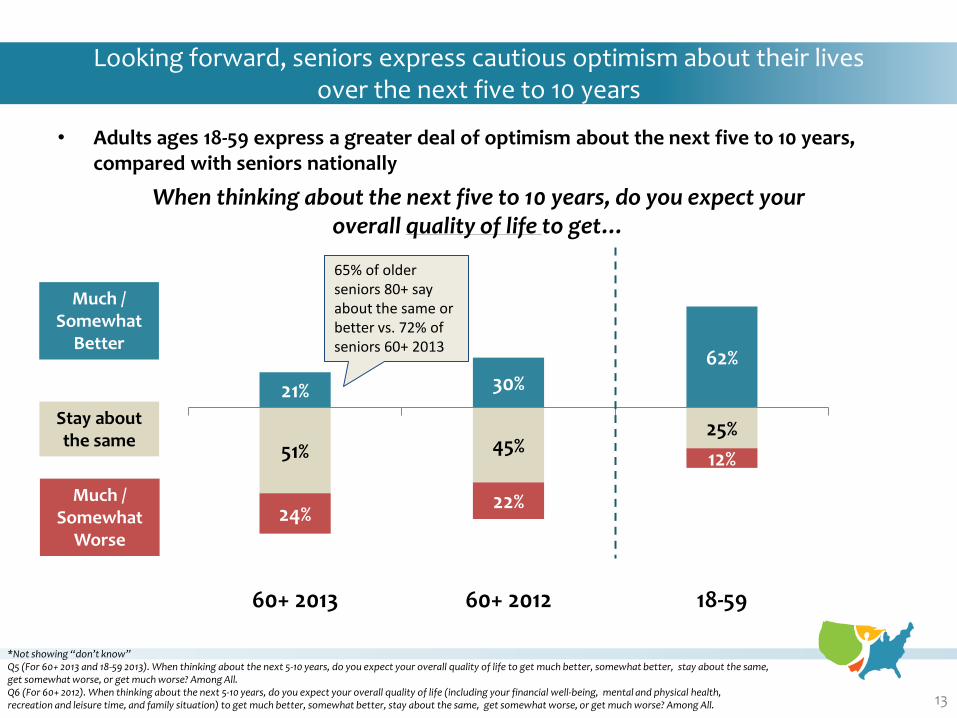
• Adults ages 18-59 express a greater deal of optimism about the next five to 10 years, compared with seniors nationally
Looking forward, seniors express cautious optimism about their lives over the next five to 10 years
13
51% 45% 25%
24% 22%
12%
21% 30% 62%
60+ 2013 60+ 2012 18-59
*Not showing “don’t know” Q5 (For 60+ 2013 and 18-59 2013). When thinking about the next 5-10 years, do you expect your overall quality of life to get much better, somewhat better, stay about the same, get somewhat worse, or get much worse? Among All. Q6 (For 60+ 2012). When thinking about the next 5-10 years, do you expect your overall quality of life (including your financial well-being, mental and physical health, recreation and leisure time, and family situation) to get much better, somewhat better, stay about the same, get somewhat worse, or get much worse? Among All.
When thinking about the next five to 10 years, do you expect your overall quality of life to get…
Much / Somewhat
Better
Much / Somewhat
Worse
Stay about the same
65% of older seniors 80+ say about the same or better vs. 72% of seniors 60+ 2013
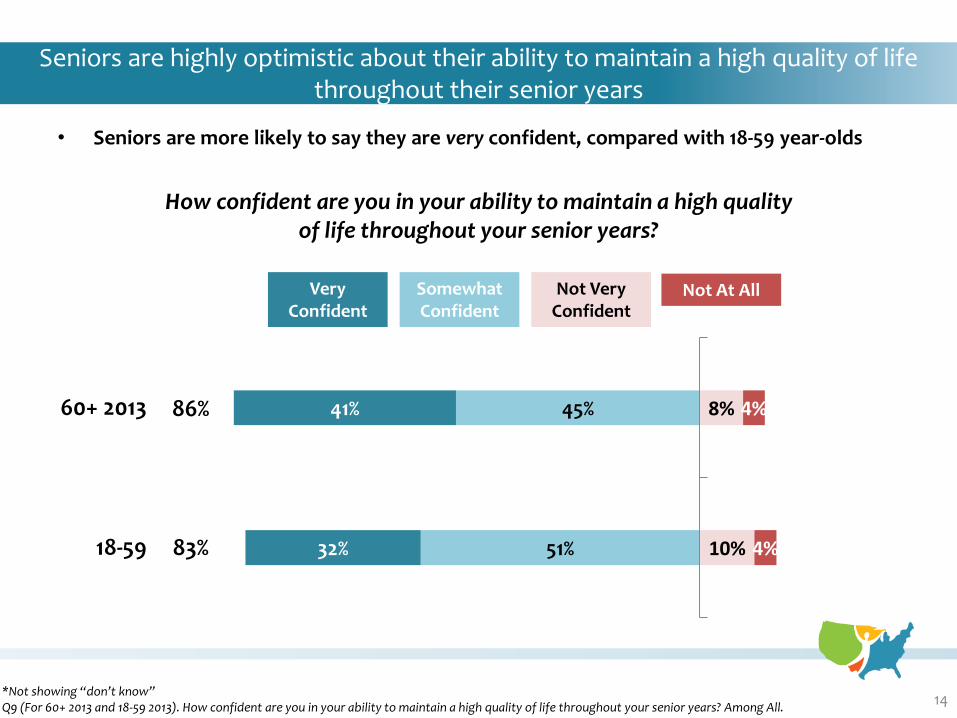
• Seniors are more likely to say they are very confident, compared with 18-59 year-olds
How confident are you in your ability to maintain a high quality of life throughout your senior years?
Seniors are highly optimistic about their ability to maintain a high quality of life throughout their senior years
14 *Not showing “don’t know” Q9 (For 60+ 2013 and 18-59 2013). How confident are you in your ability to maintain a high quality of life throughout your senior years? Among All.
45%
51%
41%
32%
8%
10%
4%
4%
60+ 2013
18-59
Very Confident
Not Very Confident
Somewhat Confident
Not At All
86%
83%
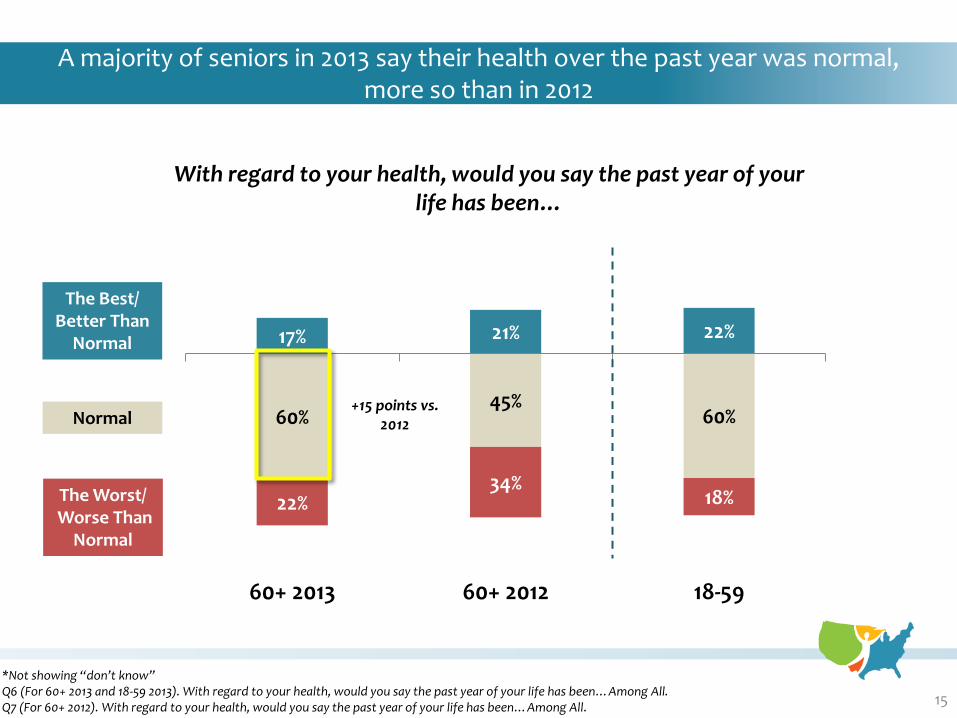
A majority of seniors in 2013 say their health over the past year was normal, more so than in 2012
15
60% 45%
60%
22% 34%
18%
17% 21% 22%
60+ 2013 60+ 2012 18-59
*Not showing “don’t know” Q6 (For 60+ 2013 and 18-59 2013). With regard to your health, would you say the past year of your life has been…Among All. Q7 (For 60+ 2012). With regard to your health, would you say the past year of your life has been…Among All.
With regard to your health, would you say the past year of your life has been…
The Best/ Better Than
Normal
The Worst/ Worse Than
Normal
Normal +15 points vs.
2012
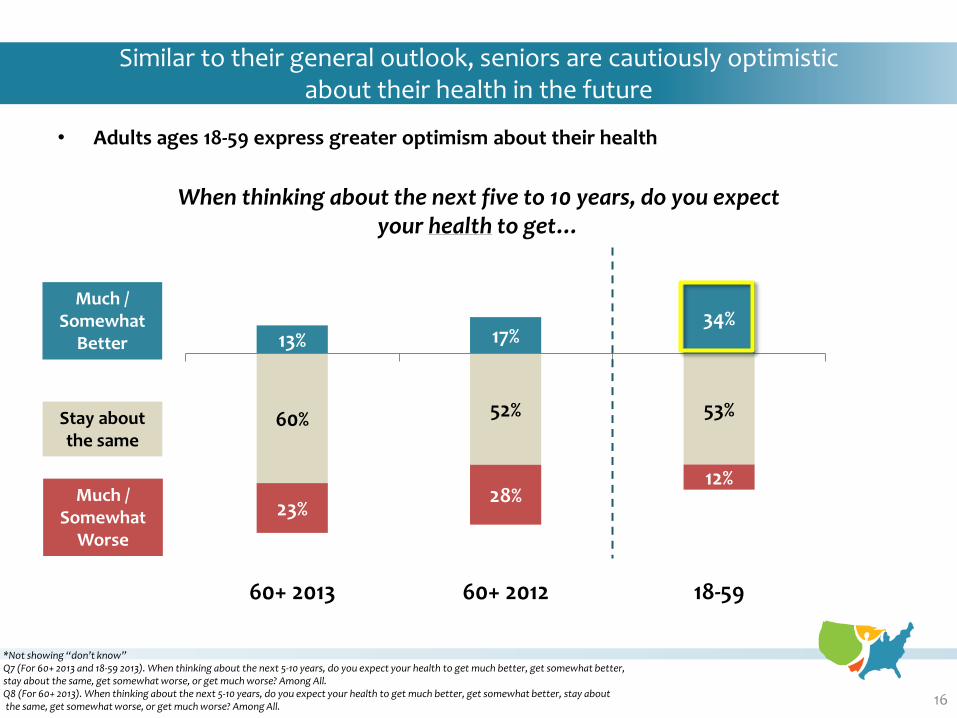
• Adults ages 18-59 express greater optimism about their health
Similar to their general outlook, seniors are cautiously optimistic about their health in the future
16
60% 52% 53%
23% 28%
12%
13% 17% 34%
60+ 2013 60+ 2012 18-59
*Not showing “don’t know” Q7 (For 60+ 2013 and 18-59 2013). When thinking about the next 5-10 years, do you expect your health to get much better, get somewhat better, stay about the same, get somewhat worse, or get much worse? Among All. Q8 (For 60+ 2013). When thinking about the next 5-10 years, do you expect your health to get much better, get somewhat better, stay about the same, get somewhat worse, or get much worse? Among All.
When thinking about the next five to 10 years, do you expect your health to get…
Much / Somewhat
Better
Much / Somewhat
Worse
Stay about the same
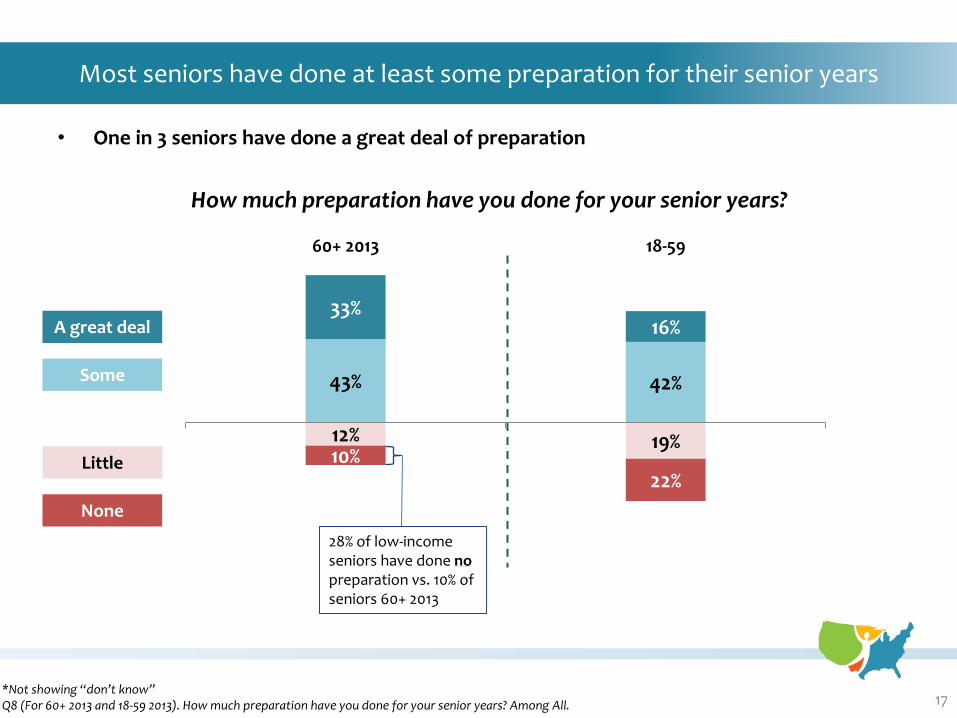
• One in 3 seniors have done a great deal of preparation
How much preparation have you done for your senior years?
Most seniors have done at least some preparation for their senior years
17 *Not showing “don’t know” Q8 (For 60+ 2013 and 18-59 2013). How much preparation have you done for your senior years? Among All.
43% 42%
33% 16%
12% 19% 10%
22%
60+ 2013 18-59
A great deal
Little
Some
None
28% of low-income seniors have done no preparation vs. 10% of seniors 60+ 2013
18
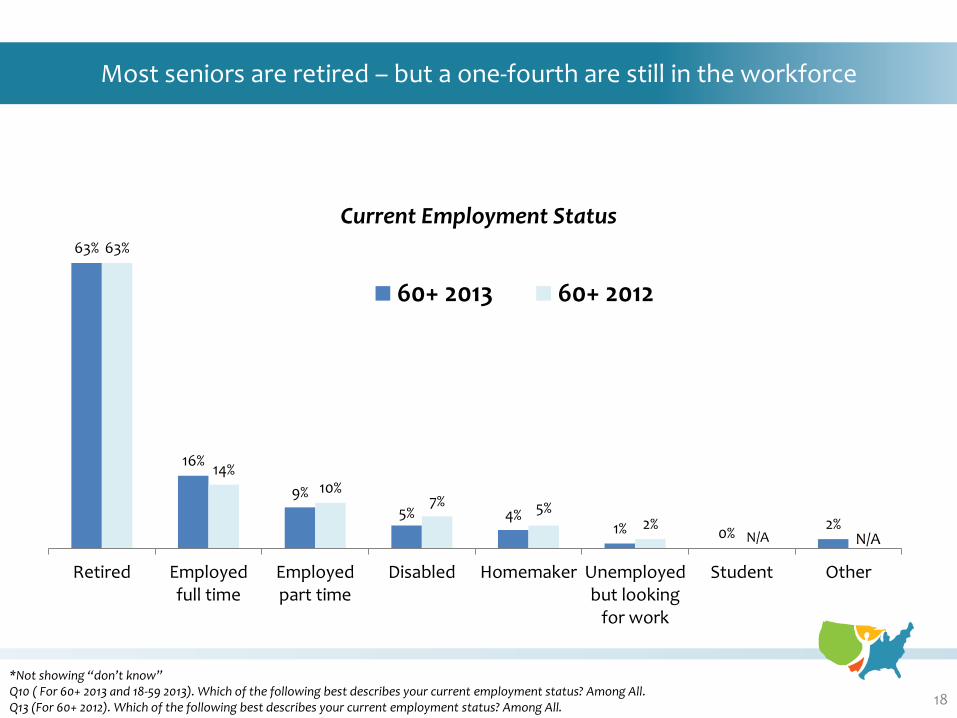
*Not showing “don’t know” Q10 ( For 60+ 2013 and 18-59 2013). Which of the following best describes your current employment status? Among All. Q13 (For 60+ 2012). Which of the following best describes your current employment status? Among All.
Most seniors are retired – but a one-fourth are still in the workforce
63%
16%
9%
5% 4% 1% 0%
2%
63%
14% 10%
7% 5% 2%
Retired Employedfull time
Employedpart time
Disabled Homemaker Unemployedbut looking
for work
Student Other
60+ 2013 60+ 2012
N/A N/A
Current Employment Status
19
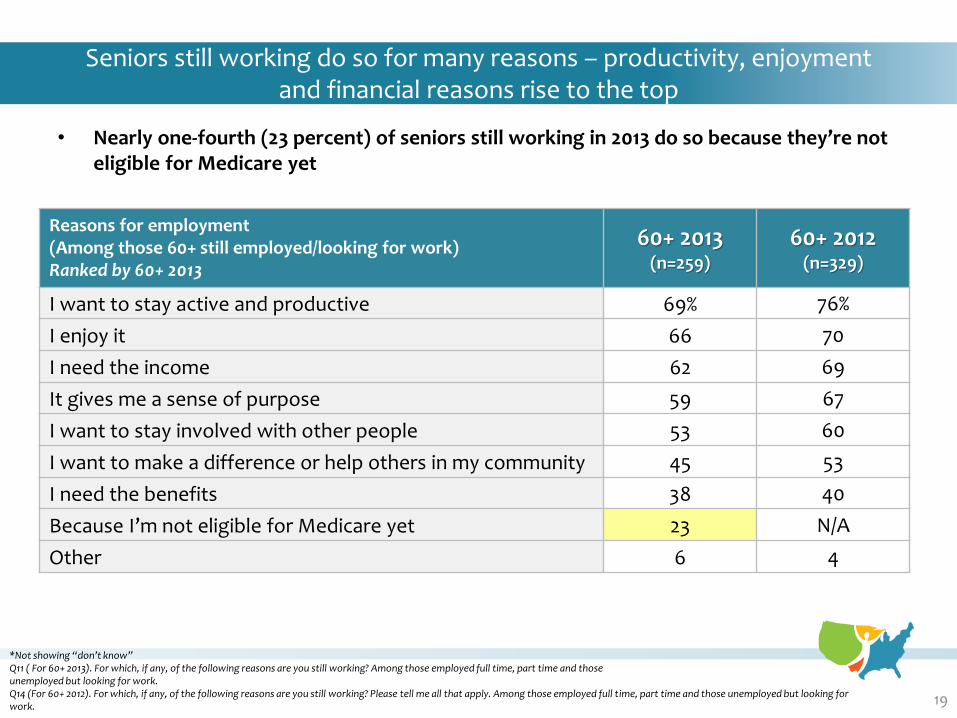
*Not showing “don’t know” Q11 ( For 60+ 2013). For which, if any, of the following reasons are you still working? Among those employed full time, part time and those unemployed but looking for work. Q14 (For 60+ 2012). For which, if any, of the following reasons are you still working? Please tell me all that apply. Among those employed full time, part time and those unemployed but looking for work.
Reasons for employment (Among those 60+ still employed/looking for work) Ranked by 60+ 2013
60+ 2013 (n=259)
60+ 2012 (n=329)
I want to stay active and productive 69% 76%
I enjoy it 66 70
I need the income 62 69
It gives me a sense of purpose 59 67
I want to stay involved with other people 53 60
I want to make a difference or help others in my community 45 53
I need the benefits 38 40
Because I’m not eligible for Medicare yet 23 N/A
Other 6 4
Seniors still working do so for many reasons – productivity, enjoyment and financial reasons rise to the top
• Nearly one-fourth (23 percent) of seniors still working in 2013 do so because they’re not eligible for Medicare yet
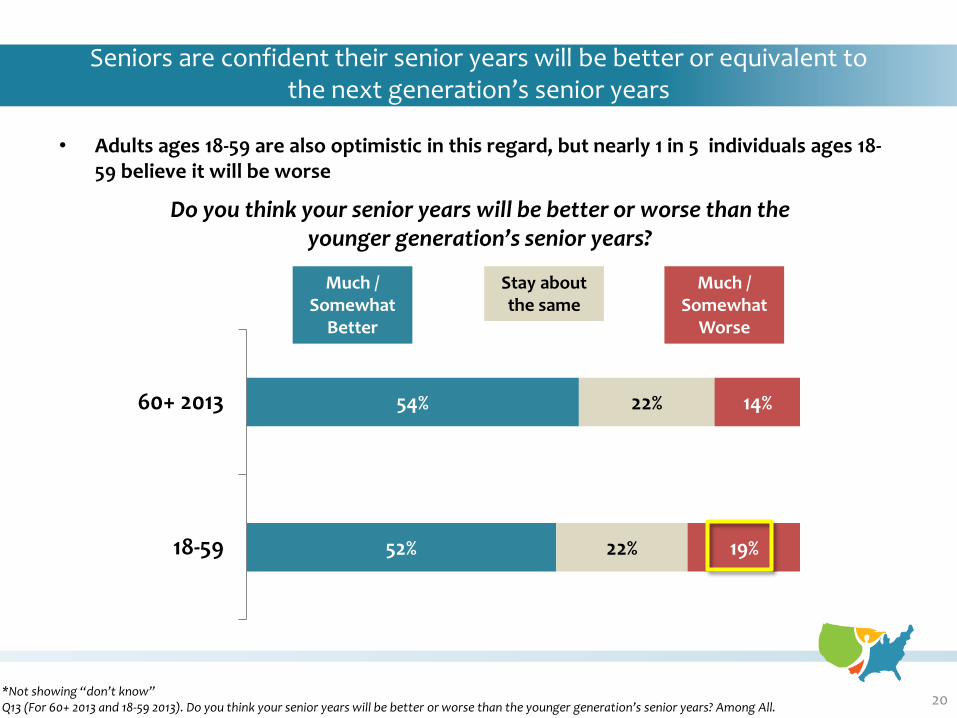
• Adults ages 18-59 are also optimistic in this regard, but nearly 1 in 5 individuals ages 18-59 believe it will be worse
Seniors are confident their senior years will be better or equivalent to the next generation’s senior years
20
54%
52%
22%
22%
14%
19%
60+ 2013
18-59
*Not showing “don’t know” Q13 (For 60+ 2013 and 18-59 2013). Do you think your senior years will be better or worse than the younger generation’s senior years? Among All.
Do you think your senior years will be better or worse than the younger generation’s senior years?
Much / Somewhat
Better
Much / Somewhat
Worse
Stay about the same

ECONOMIC SECURITY
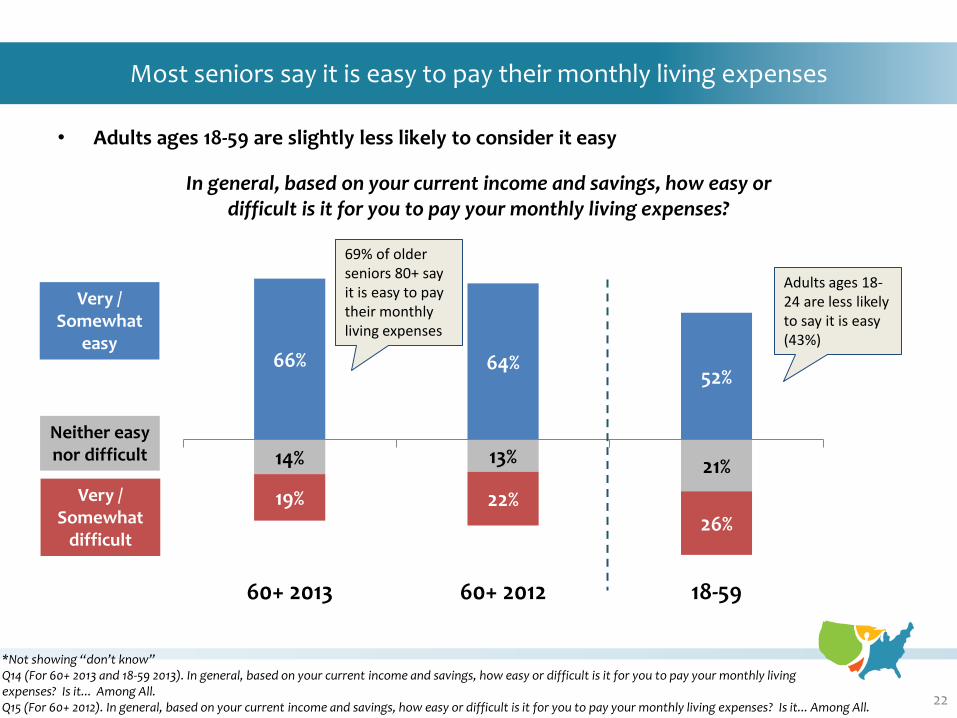
• Adults ages 18-59 are slightly less likely to consider it easy
Most seniors say it is easy to pay their monthly living expenses
22
14% 13% 21%
19% 22% 26%
66% 64% 52%
60+ 2013 60+ 2012 18-59
*Not showing “don’t know” Q14 (For 60+ 2013 and 18-59 2013). In general, based on your current income and savings, how easy or difficult is it for you to pay your monthly living expenses? Is it... Among All. Q15 (For 60+ 2012). In general, based on your current income and savings, how easy or difficult is it for you to pay your monthly living expenses? Is it... Among All.
In general, based on your current income and savings, how easy or difficult is it for you to pay your monthly living expenses?
Very / Somewhat
easy
Very / Somewhat
difficult
Neither easy nor difficult
69% of older seniors 80+ say it is easy to pay their monthly living expenses
Adults ages 18-24 are less likely to say it is easy (43%)
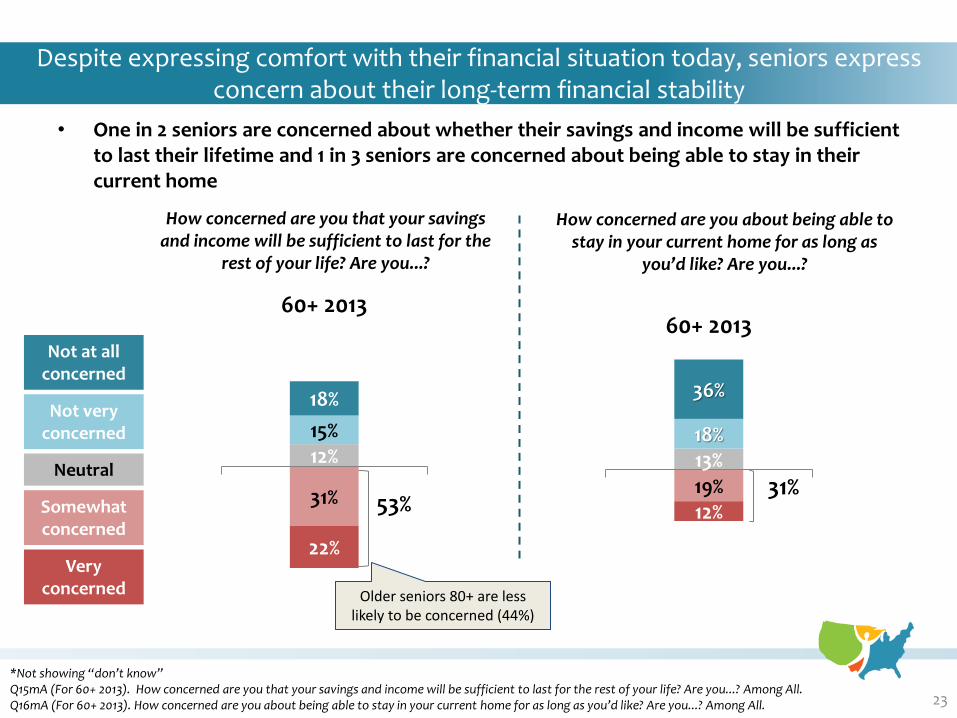
• One in 2 seniors are concerned about whether their savings and income will be sufficient to last their lifetime and 1 in 3 seniors are concerned about being able to stay in their current home
Despite expressing comfort with their financial situation today, seniors express concern about their long-term financial stability
23
31%
22%
12% 15%
18%
60+ 2013
*Not showing “don’t know” Q15mA (For 60+ 2013). How concerned are you that your savings and income will be sufficient to last for the rest of your life? Are you...? Among All. Q16mA (For 60+ 2013). How concerned are you about being able to stay in your current home for as long as you’d like? Are you...? Among All.
How concerned are you that your savings and income will be sufficient to last for the
rest of your life? Are you...?
Very concerned
Not at all concerned
Neutral
How concerned are you about being able to stay in your current home for as long as
you’d like? Are you...?
19% 12%
13% 18%
36%
60+ 2013
Somewhat concerned
Not very concerned
53% 31%
Older seniors 80+ are less likely to be concerned (44%)
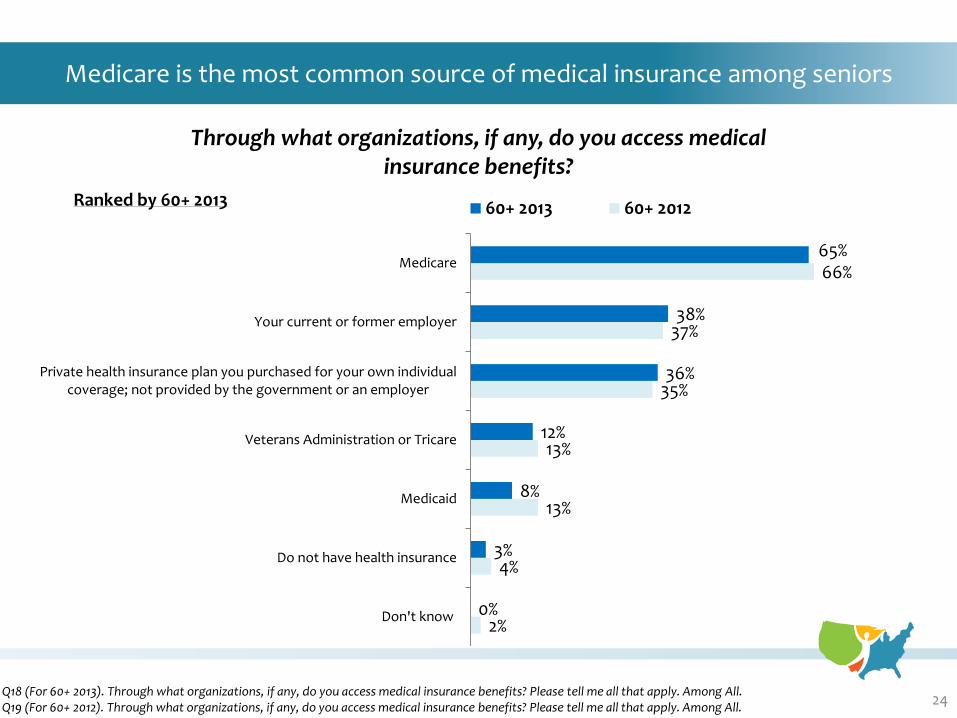
Medicare is the most common source of medical insurance among seniors
24 Q18 (For 60+ 2013). Through what organizations, if any, do you access medical insurance benefits? Please tell me all that apply. Among All. Q19 (For 60+ 2012). Through what organizations, if any, do you access medical insurance benefits? Please tell me all that apply. Among All.
Through what organizations, if any, do you access medical insurance benefits?
2%
4%
13%
13%
35%
37%
66%
0%
3%
8%
12%
36%
38%
65%
Don't know
Do not have health insurance
Medicaid
Veterans Administration or Tricare
Private health insurance plan you purchased for your own individualcoverage; not provided by the government or an employer
Your current or former employer
Medicare
60+ 2013 60+ 2012Ranked by 60+ 2013
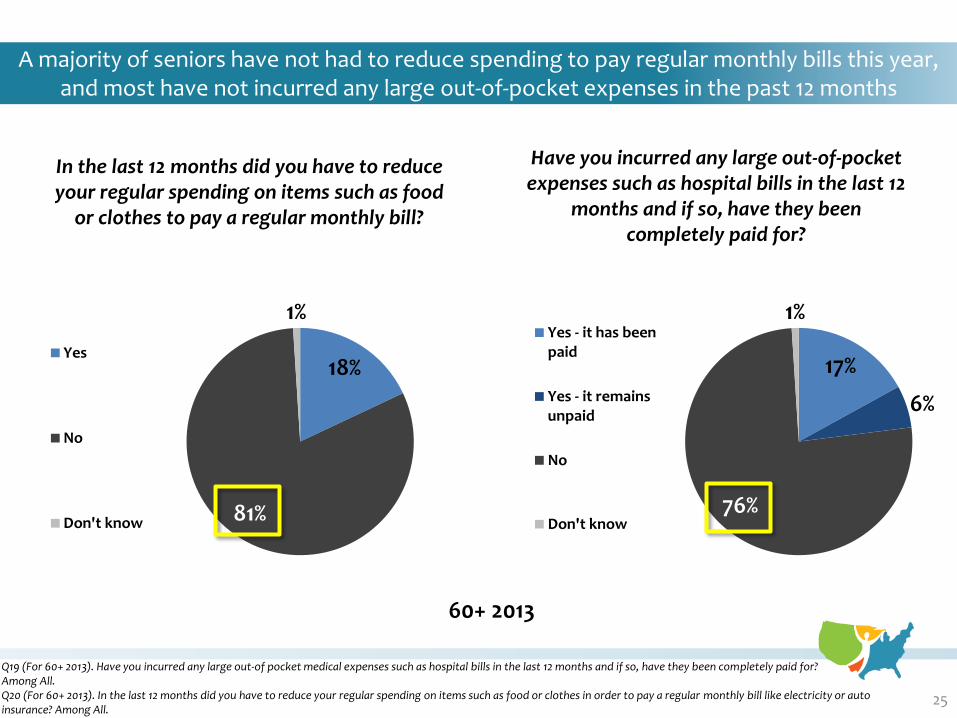
A majority of seniors have not had to reduce spending to pay regular monthly bills this year, and most have not incurred any large out-of-pocket expenses in the past 12 months
25
In the last 12 months did you have to reduce your regular spending on items such as food
or clothes to pay a regular monthly bill?
60+ 2013
Q19 (For 60+ 2013). Have you incurred any large out-of pocket medical expenses such as hospital bills in the last 12 months and if so, have they been completely paid for? Among All. Q20 (For 60+ 2013). In the last 12 months did you have to reduce your regular spending on items such as food or clothes in order to pay a regular monthly bill like electricity or auto insurance? Among All.
Have you incurred any large out-of-pocket expenses such as hospital bills in the last 12
months and if so, have they been completely paid for?
17%
6%
76%
1% Yes - it has beenpaid
Yes - it remainsunpaid
No
Don't know
18%
81%
1%
Yes
No
Don't know
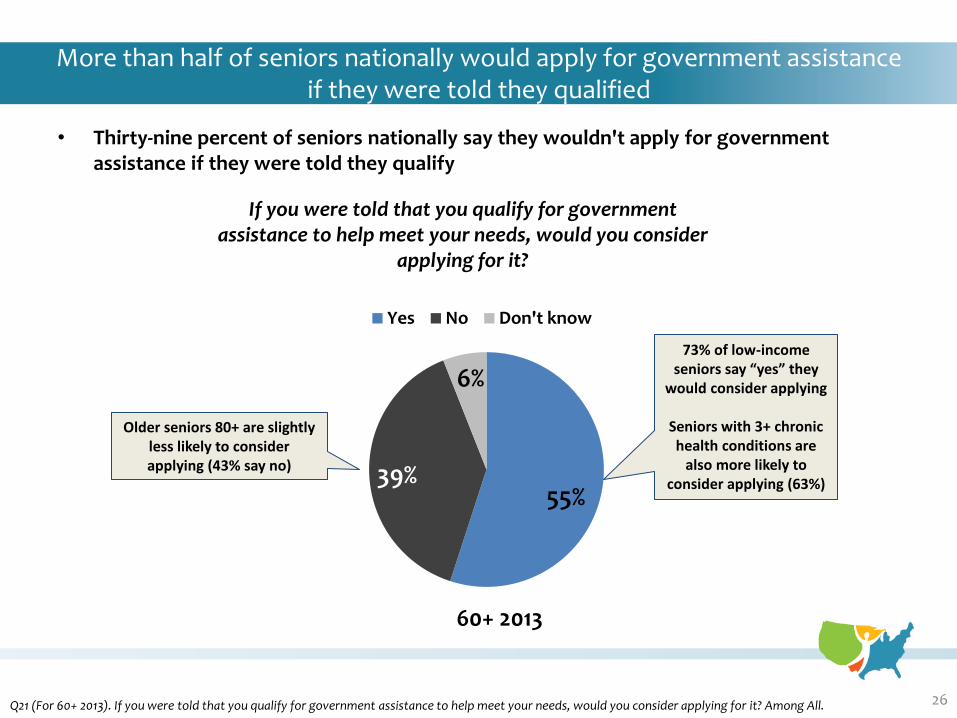
More than half of seniors nationally would apply for government assistance if they were told they qualified
26 Q21 (For 60+ 2013). If you were told that you qualify for government assistance to help meet your needs, would you consider applying for it? Among All.
If you were told that you qualify for government assistance to help meet your needs, would you consider
applying for it?
55% 39%
6%
Yes No Don't know
60+ 2013
• Thirty-nine percent of seniors nationally say they wouldn't apply for government assistance if they were told they qualify
73% of low-income seniors say “yes” they
would consider applying
Seniors with 3+ chronic health conditions are
also more likely to consider applying (63%)
Older seniors 80+ are slightly less likely to consider applying (43% say no)
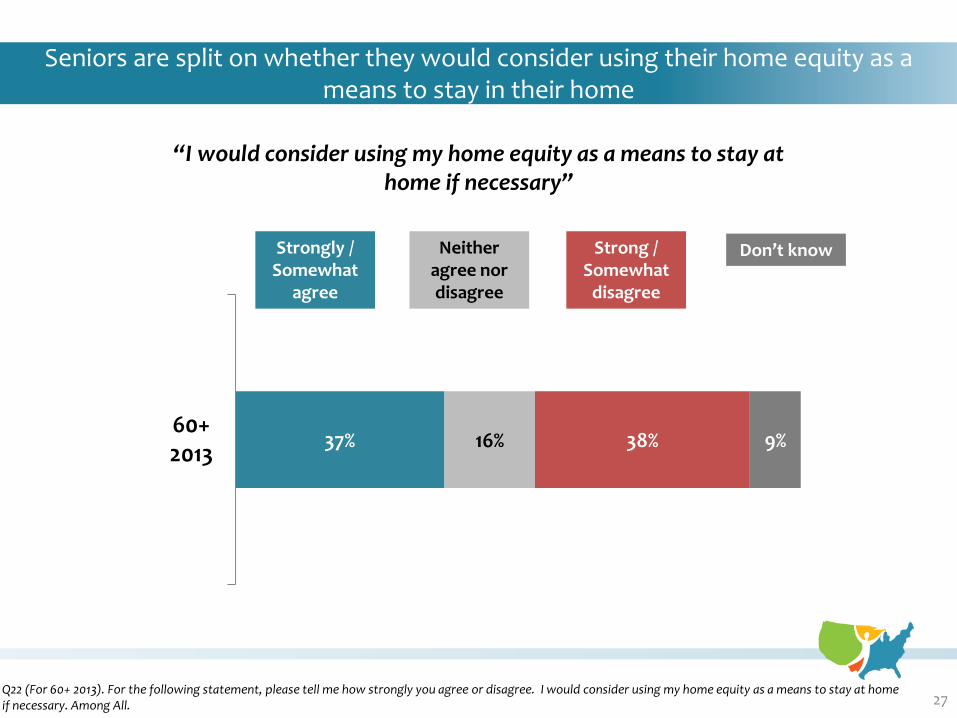
Seniors are split on whether they would consider using their home equity as a means to stay in their home
27
37% 16% 38% 9% 60+2013
Q22 (For 60+ 2013). For the following statement, please tell me how strongly you agree or disagree. I would consider using my home equity as a means to stay at home if necessary. Among All.
“I would consider using my home equity as a means to stay at home if necessary”
Strongly / Somewhat
agree
Strong / Somewhat
disagree
Neither agree nor disagree
Don’t know
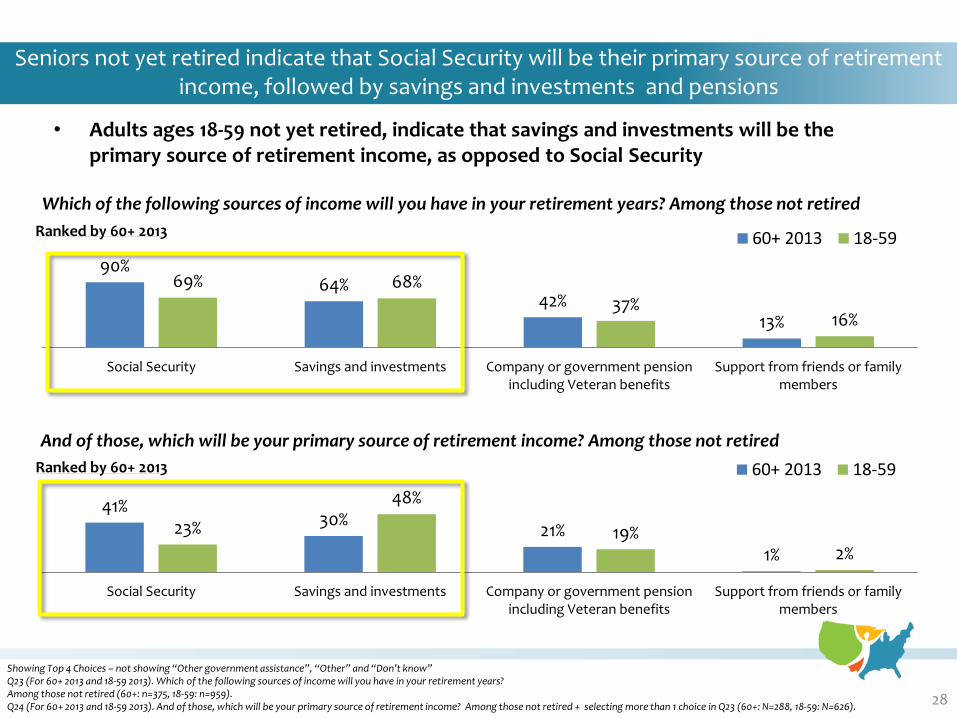
• Adults ages 18-59 not yet retired, indicate that savings and investments will be the primary source of retirement income, as opposed to Social Security
Seniors not yet retired indicate that Social Security will be their primary source of retirement income, followed by savings and investments and pensions
28
Showing Top 4 Choices – not showing “Other government assistance”, “Other” and “Don’t know” Q23 (For 60+ 2013 and 18-59 2013). Which of the following sources of income will you have in your retirement years? Among those not retired (60+: n=375, 18-59: n=959). Q24 (For 60+ 2013 and 18-59 2013). And of those, which will be your primary source of retirement income? Among those not retired + selecting more than 1 choice in Q23 (60+: N=288, 18-59: N=626).
Which of the following sources of income will you have in your retirement years? Among those not retired
90% 64%
42% 13%
69% 68% 37%
16%
Social Security Savings and investments Company or government pensionincluding Veteran benefits
Support from friends or familymembers
60+ 2013 18-59Ranked by 60+ 2013
41% 30%
21%
1%
23%
48%
19% 2%
Social Security Savings and investments Company or government pensionincluding Veteran benefits
Support from friends or familymembers
60+ 2013 18-59
And of those, which will be your primary source of retirement income? Among those not retired
Ranked by 60+ 2013
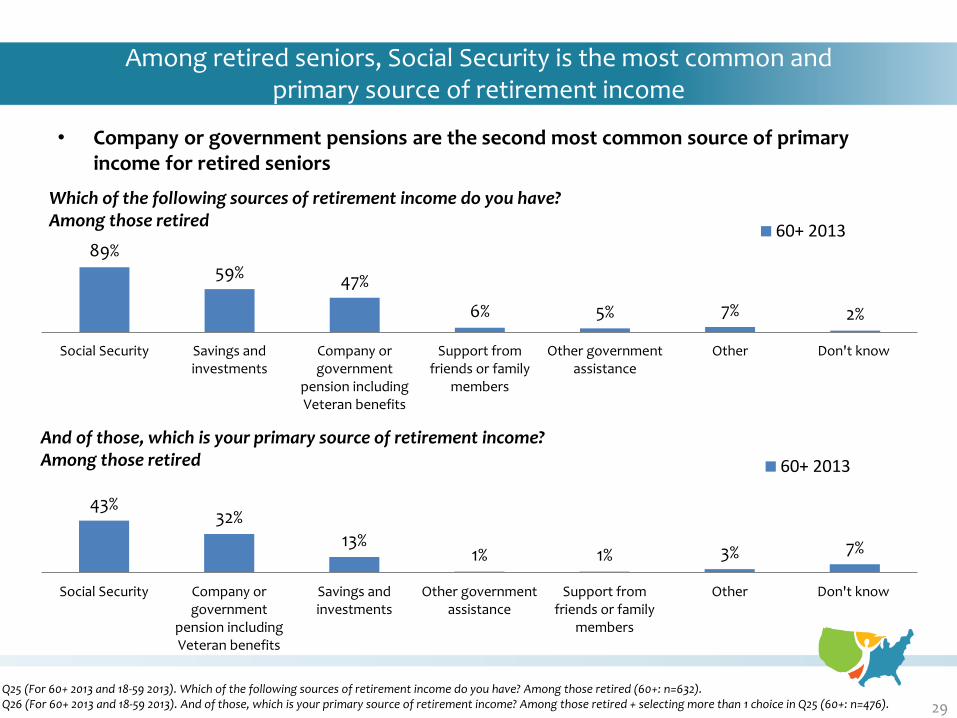
• Company or government pensions are the second most common source of primary income for retired seniors
Among retired seniors, Social Security is the most common and primary source of retirement income
29 Q25 (For 60+ 2013 and 18-59 2013). Which of the following sources of retirement income do you have? Among those retired (60+: n=632). Q26 (For 60+ 2013 and 18-59 2013). And of those, which is your primary source of retirement income? Among those retired + selecting more than 1 choice in Q25 (60+: n=476).
Which of the following sources of retirement income do you have? Among those retired
89% 59% 47%
6% 5% 7% 2%
Social Security Savings andinvestments
Company orgovernment
pension includingVeteran benefits
Support fromfriends or family
members
Other governmentassistance
Other Don't know
60+ 2013
43% 32%
13% 1% 1% 3% 7%
Social Security Company orgovernment
pension includingVeteran benefits
Savings andinvestments
Other governmentassistance
Support fromfriends or family
members
Other Don't know
60+ 2013
And of those, which is your primary source of retirement income? Among those retired
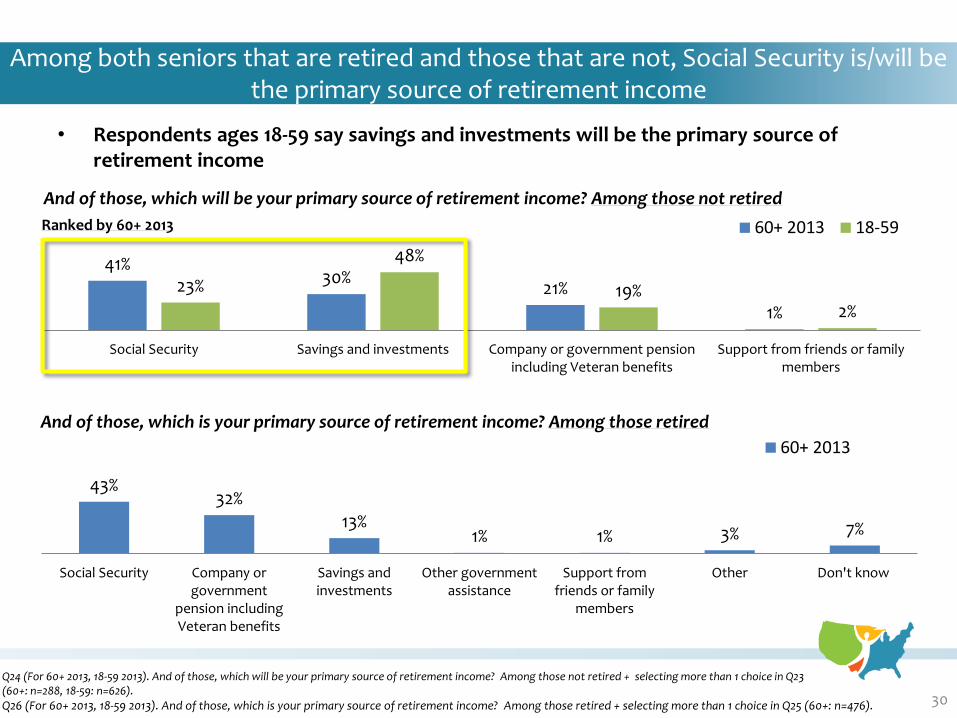
• Respondents ages 18-59 say savings and investments will be the primary source of retirement income
Among both seniors that are retired and those that are not, Social Security is/will be the primary source of retirement income
30
Q24 (For 60+ 2013, 18-59 2013). And of those, which will be your primary source of retirement income? Among those not retired + selecting more than 1 choice in Q23 (60+: n=288, 18-59: n=626).
Q26 (For 60+ 2013, 18-59 2013). And of those, which is your primary source of retirement income? Among those retired + selecting more than 1 choice in Q25 (60+: n=476).
43% 32%
13% 1% 1% 3% 7%
Social Security Company orgovernment
pension includingVeteran benefits
Savings andinvestments
Other governmentassistance
Support fromfriends or family
members
Other Don't know
60+ 2013
And of those, which is your primary source of retirement income? Among those retired
41% 30%
21%
1%
23%
48%
19% 2%
Social Security Savings and investments Company or government pensionincluding Veteran benefits
Support from friends or familymembers
60+ 2013 18-59
And of those, which will be your primary source of retirement income? Among those not retired
Ranked by 60+ 2013
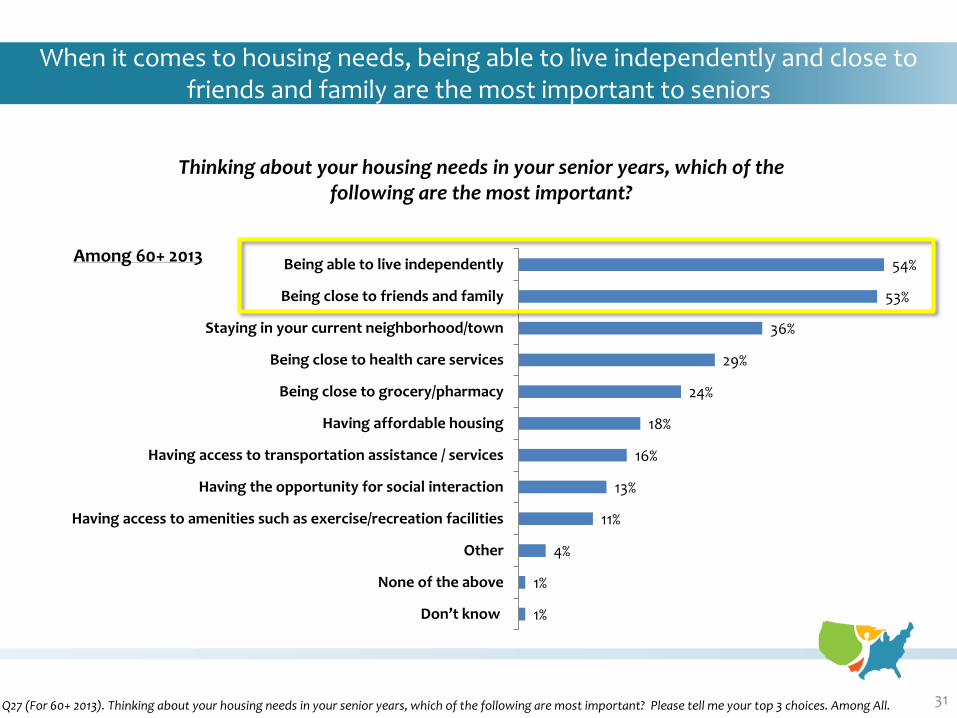
When it comes to housing needs, being able to live independently and close to friends and family are the most important to seniors
31 Q27 (For 60+ 2013). Thinking about your housing needs in your senior years, which of the following are most important? Please tell me your top 3 choices. Among All.
Thinking about your housing needs in your senior years, which of the following are the most important?
54%
53%
36%
29%
24%
18%
16%
13%
11%
4%
1%
1%
Being able to live independently
Being close to friends and family
Staying in your current neighborhood/town
Being close to health care services
Being close to grocery/pharmacy
Having affordable housing
Having access to transportation assistance / services
Having the opportunity for social interaction
Having access to amenities such as exercise/recreation facilities
Other
None of the above
Don’t know
Among 60+ 2013
HEALTH AND WELLNESS
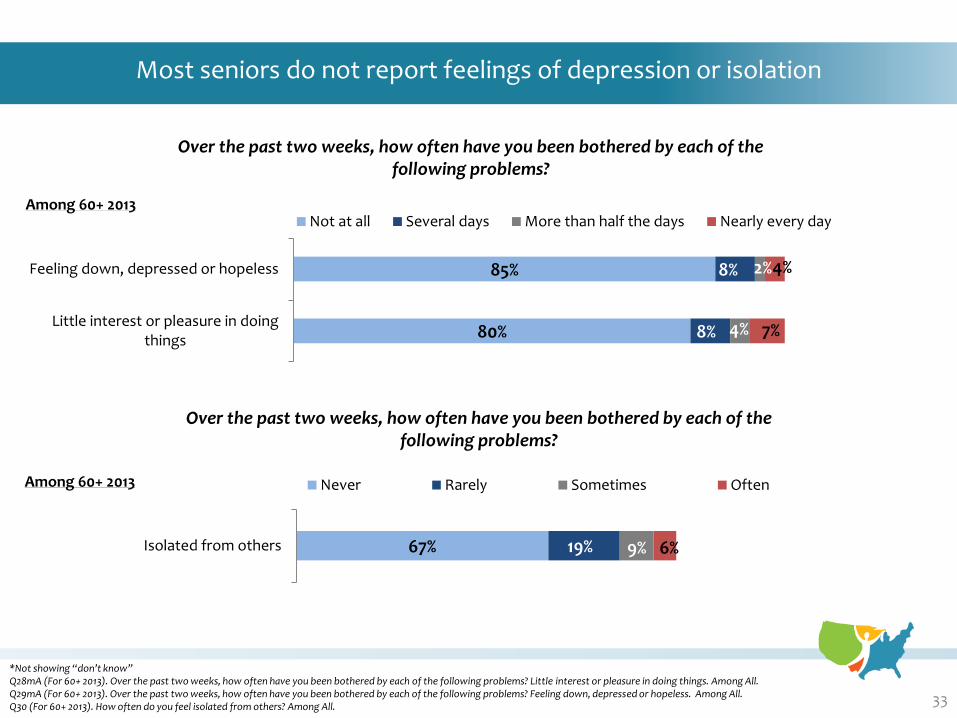
Most seniors do not report feelings of depression or isolation
33
*Not showing “don’t know” Q28mA (For 60+ 2013). Over the past two weeks, how often have you been bothered by each of the following problems? Little interest or pleasure in doing things. Among All. Q29mA (For 60+ 2013). Over the past two weeks, how often have you been bothered by each of the following problems? Feeling down, depressed or hopeless. Among All. Q30 (For 60+ 2013). How often do you feel isolated from others? Among All.
Over the past two weeks, how often have you been bothered by each of the following problems?
%
80%
85%
8%
8%
4%
2%
7%
4%
Little interest or pleasure in doingthings
Feeling down, depressed or hopeless
Not at all Several days More than half the days Nearly every dayAmong 60+ 2013
67% 19% 9% 6% Isolated from others
Never Rarely Sometimes Often
Over the past two weeks, how often have you been bothered by each of the following problems?
Among 60+ 2013
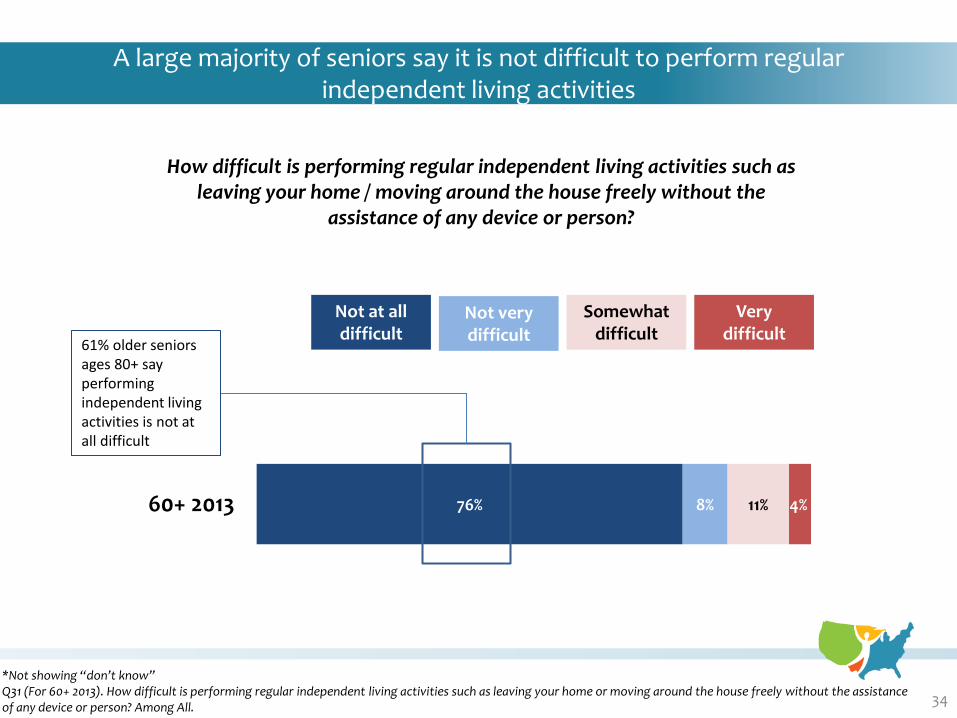
A large majority of seniors say it is not difficult to perform regular independent living activities
34
4% 11% 8% 76% 60+ 2013
*Not showing “don’t know” Q31 (For 60+ 2013). How difficult is performing regular independent living activities such as leaving your home or moving around the house freely without the assistance of any device or person? Among All.
How difficult is performing regular independent living activities such as leaving your home / moving around the house freely without the
assistance of any device or person?
Very difficult
Not very difficult
Somewhat difficult
Not at all difficult
61% older seniors ages 80+ say performing independent living activities is not at all difficult
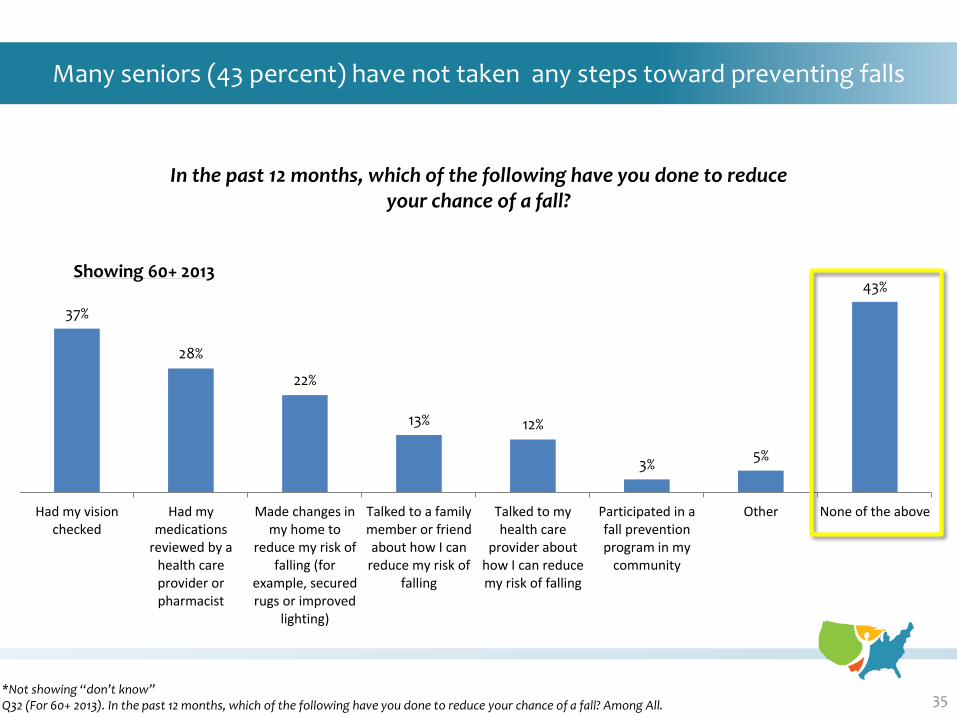
Many seniors (43 percent) have not taken any steps toward preventing falls
35 *Not showing “don’t know” Q32 (For 60+ 2013). In the past 12 months, which of the following have you done to reduce your chance of a fall? Among All.
In the past 12 months, which of the following have you done to reduce your chance of a fall?
37%
28%
22%
13% 12%
3% 5%
43%
Had my visionchecked
Had mymedications
reviewed by ahealth careprovider orpharmacist
Made changes inmy home to
reduce my risk offalling (for
example, securedrugs or improved
lighting)
Talked to a familymember or friendabout how I can
reduce my risk offalling
Talked to myhealth care
provider abouthow I can reducemy risk of falling
Participated in afall preventionprogram in my
community
Other None of the above
Showing 60+ 2013
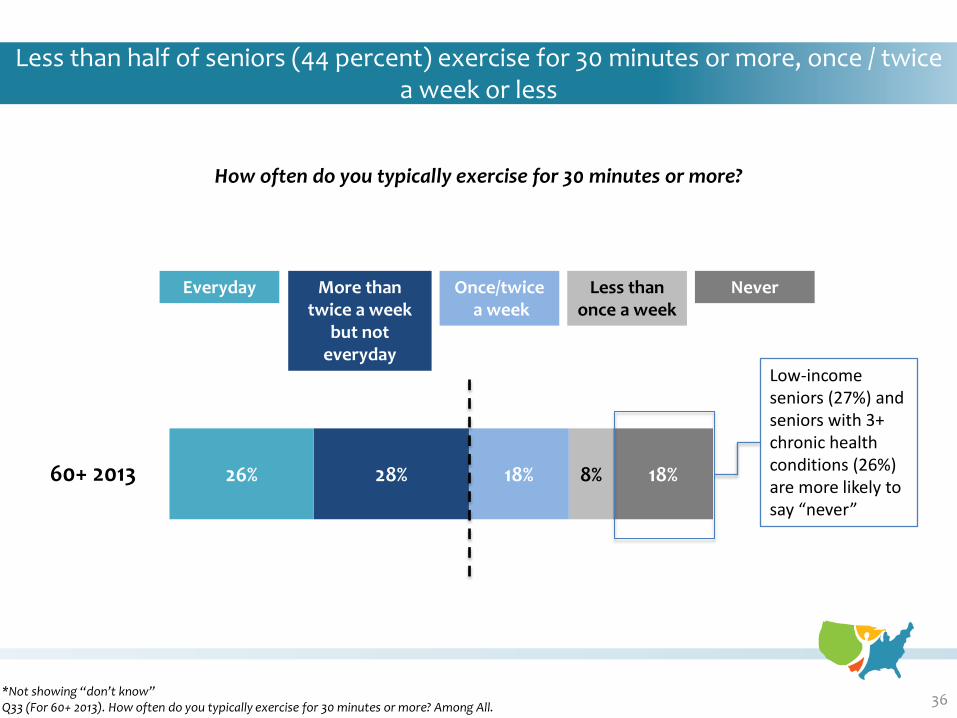
Less than half of seniors (44 percent) exercise for 30 minutes or more, once / twice a week or less
36
18% 8% 18% 28% 26% 60+ 2013
*Not showing “don’t know” Q33 (For 60+ 2013). How often do you typically exercise for 30 minutes or more? Among All.
How often do you typically exercise for 30 minutes or more?
Never Once/twice a week
Less than once a week
More than twice a week
but not everyday
Everyday
Low-income seniors (27%) and seniors with 3+ chronic health conditions (26%) are more likely to say “never”
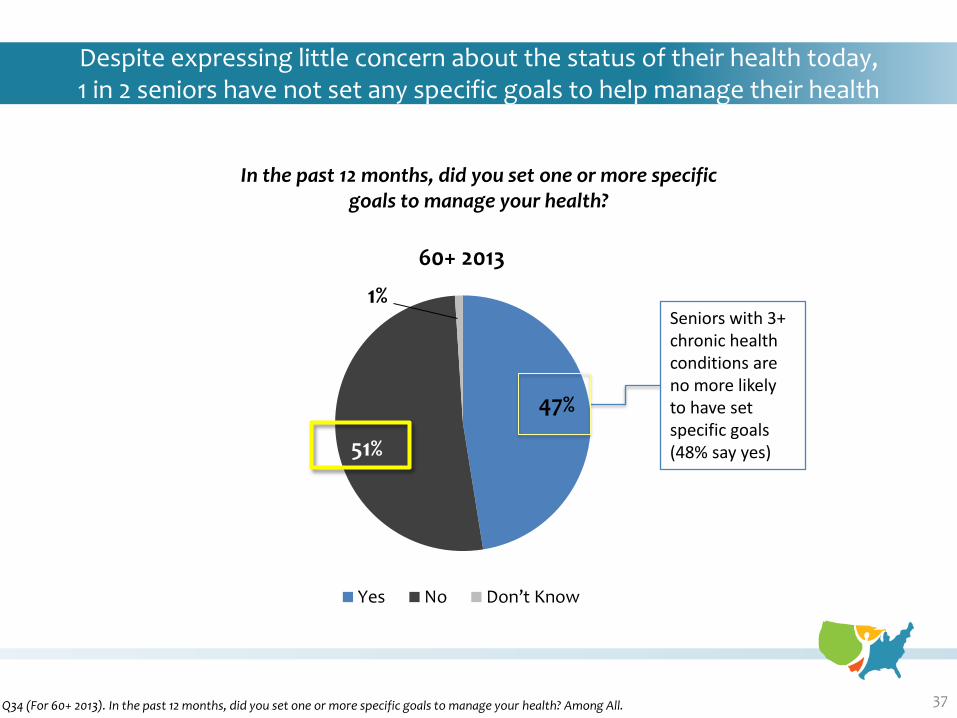
Despite expressing little concern about the status of their health today, 1 in 2 seniors have not set any specific goals to help manage their health
37 Q34 (For 60+ 2013). In the past 12 months, did you set one or more specific goals to manage your health? Among All.
47%
51%
1%
60+ 2013
Yes No Don’t Know
In the past 12 months, did you set one or more specific goals to manage your health?
Seniors with 3+ chronic health conditions are no more likely to have set specific goals (48% say yes)
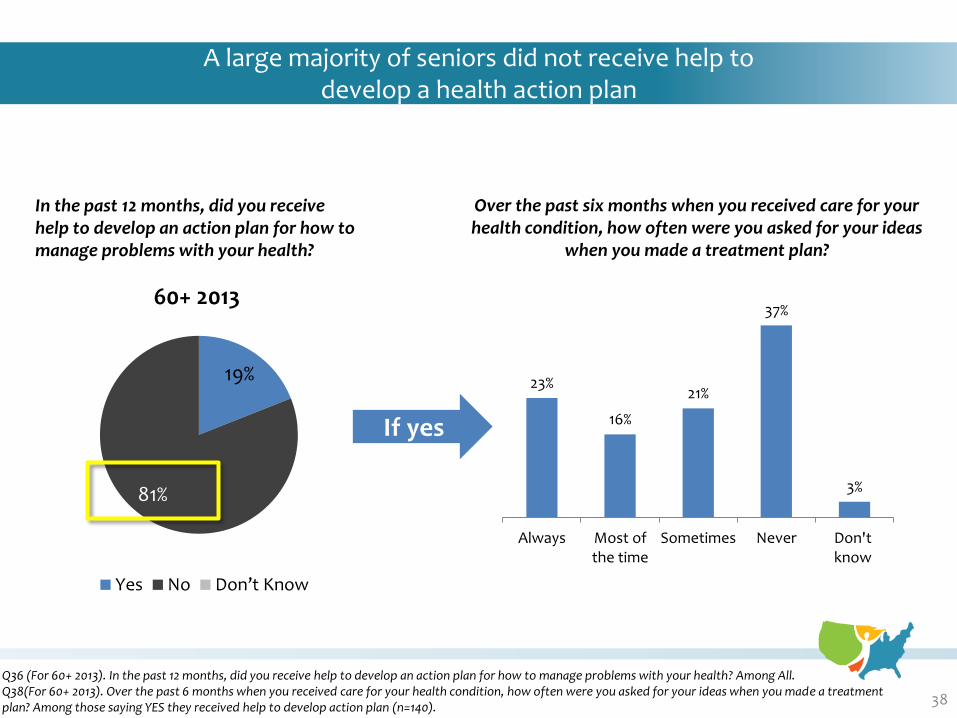
• Among those that did receive help, many were not asked for their input
A large majority of seniors did not receive help to develop a health action plan
38
Q36 (For 60+ 2013). In the past 12 months, did you receive help to develop an action plan for how to manage problems with your health? Among All. Q38(For 60+ 2013). Over the past 6 months when you received care for your health condition, how often were you asked for your ideas when you made a treatment plan? Among those saying YES they received help to develop action plan (n=140).
In the past 12 months, did you receive help to develop an action plan for how to manage problems with your health?
19%
81%
60+ 2013
Yes No Don’t Know
23%
16%
21%
37%
3%
Always Most ofthe time
Sometimes Never Don'tknow
Over the past six months when you received care for your health condition, how often were you asked for your ideas
when you made a treatment plan?
If yes
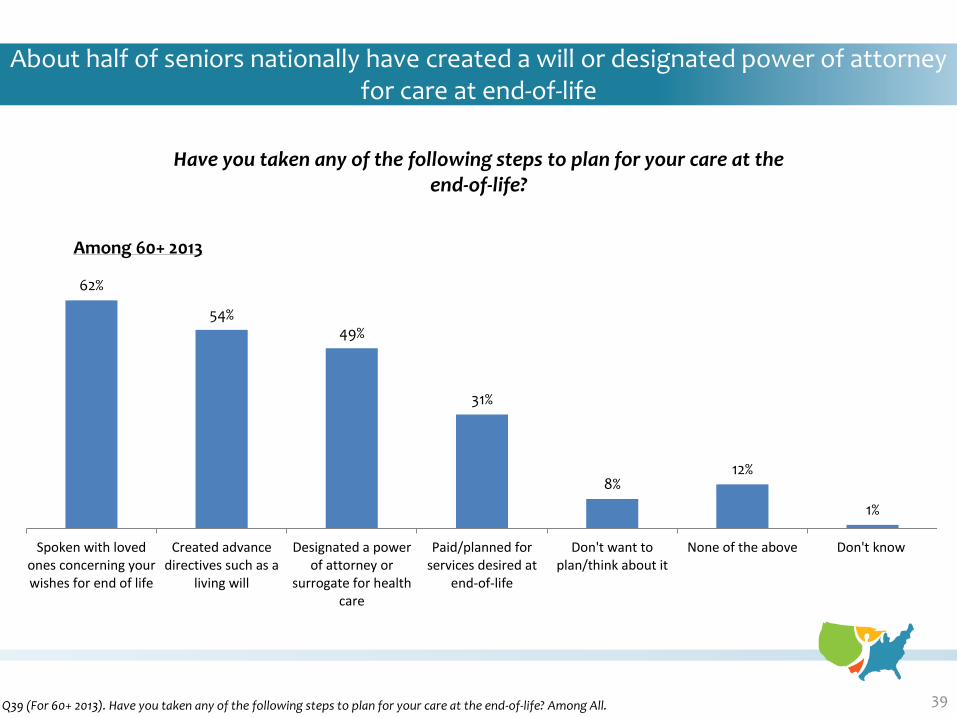
About half of seniors nationally have created a will or designated power of attorney for care at end-of-life
39 Q39 (For 60+ 2013). Have you taken any of the following steps to plan for your care at the end-of-life? Among All.
Have you taken any of the following steps to plan for your care at the end-of-life?
62%
54% 49%
31%
8% 12%
1%
Spoken with lovedones concerning yourwishes for end of life
Created advancedirectives such as a
living will
Designated a powerof attorney or
surrogate for healthcare
Paid/planned forservices desired at
end-of-life
Don't want toplan/think about it
None of the above Don't know
Among 60+ 2013
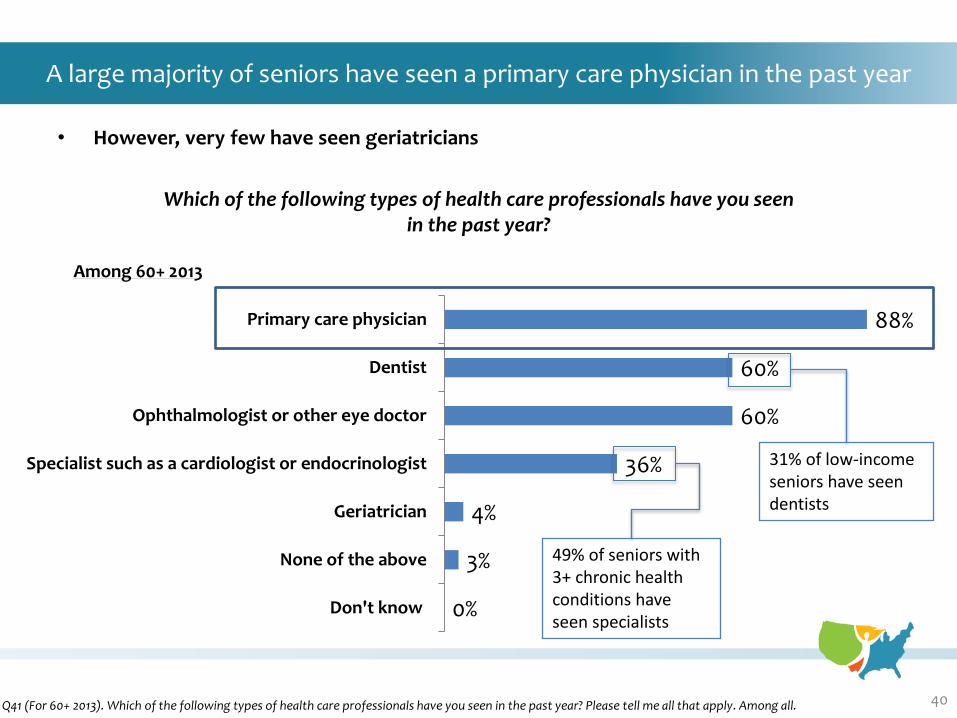
• However, very few have seen geriatricians
A large majority of seniors have seen a primary care physician in the past year
40 Q41 (For 60+ 2013). Which of the following types of health care professionals have you seen in the past year? Please tell me all that apply. Among all.
Which of the following types of health care professionals have you seen in the past year?
88%
60%
60%
36%
4%
3%
0%
Primary care physician
Dentist
Ophthalmologist or other eye doctor
Specialist such as a cardiologist or endocrinologist
Geriatrician
None of the above
Don't know
Among 60+ 2013
31% of low-income seniors have seen dentists
49% of seniors with 3+ chronic health conditions have seen specialists
41
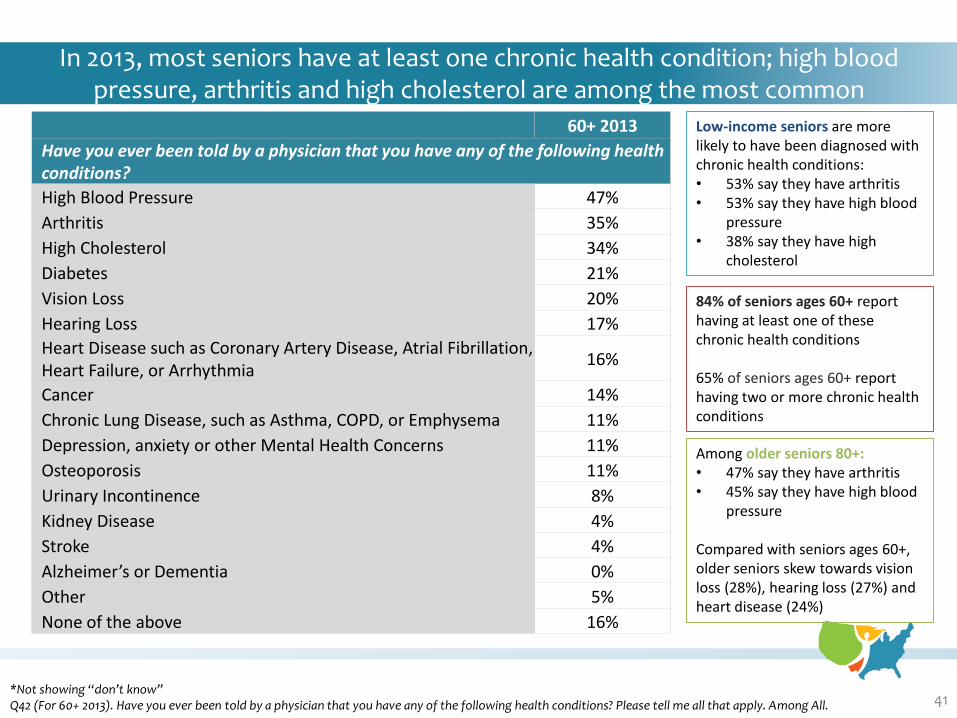
60+ 2013
Have you ever been told by a physician that you have any of the following health conditions?
High Blood Pressure 47%
Arthritis 35%
High Cholesterol 34%
Diabetes 21%
Vision Loss 20%
Hearing Loss 17%
Heart Disease such as Coronary Artery Disease, Atrial Fibrillation, Heart Failure, or Arrhythmia
16%
Cancer 14%
Chronic Lung Disease, such as Asthma, COPD, or Emphysema 11%
Depression, anxiety or other Mental Health Concerns 11%
Osteoporosis 11%
Urinary Incontinence 8%
Kidney Disease 4%
Stroke 4%
Alzheimer’s or Dementia 0%
Other 5%
None of the above 16%
*Not showing “don’t know” Q42 (For 60+ 2013). Have you ever been told by a physician that you have any of the following health conditions? Please tell me all that apply. Among All.
In 2013, most seniors have at least one chronic health condition; high blood pressure, arthritis and high cholesterol are among the most common
Low-income seniors are more likely to have been diagnosed with chronic health conditions: • 53% say they have arthritis • 53% say they have high blood
pressure • 38% say they have high
cholesterol
Among older seniors 80+: • 47% say they have arthritis • 45% say they have high blood
pressure Compared with seniors ages 60+, older seniors skew towards vision loss (28%), hearing loss (27%) and heart disease (24%)
84% of seniors ages 60+ report having at least one of these chronic health conditions 65% of seniors ages 60+ report having two or more chronic health conditions
CHRONIC HEALTH CONDITIONS
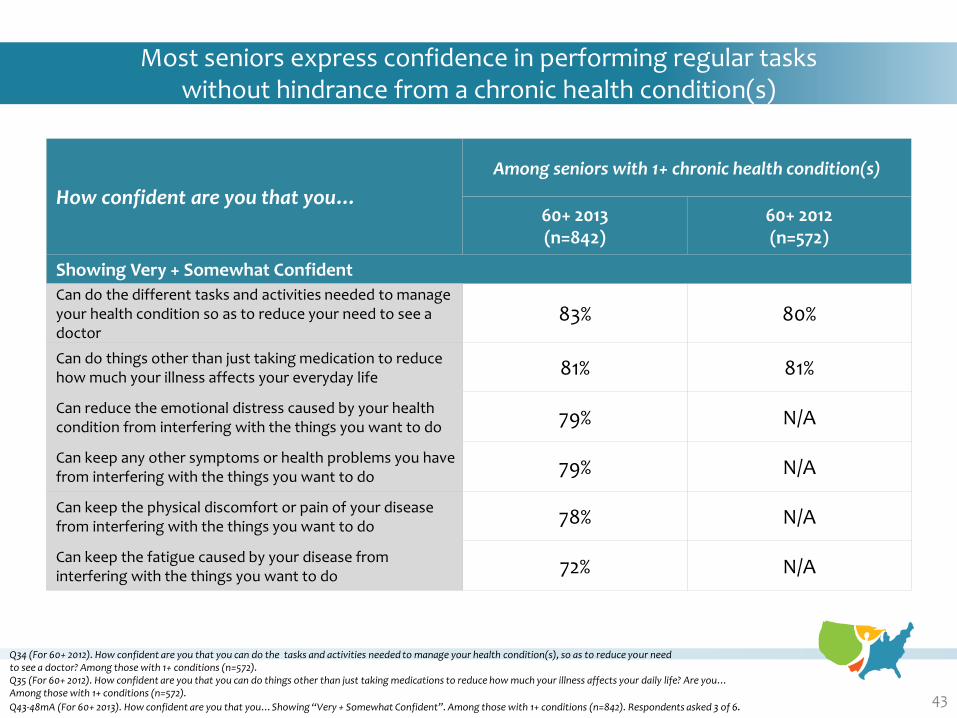
Most seniors express confidence in performing regular tasks without hindrance from a chronic health condition(s)
43
Q34 (For 60+ 2012). How confident are you that you can do the tasks and activities needed to manage your health condition(s), so as to reduce your need to see a doctor? Among those with 1+ conditions (n=572). Q35 (For 60+ 2012). How confident are you that you can do things other than just taking medications to reduce how much your illness affects your daily life? Are you… Among those with 1+ conditions (n=572).
Q43-48mA (For 60+ 2013). How confident are you that you…Showing “Very + Somewhat Confident”. Among those with 1+ conditions (n=842). Respondents asked 3 of 6.
How confident are you that you…
Among seniors with 1+ chronic health condition(s)
60+ 2013 (n=842)
60+ 2012 (n=572)
Showing Very + Somewhat Confident
Can do the different tasks and activities needed to manage your health condition so as to reduce your need to see a doctor
83% 80%
Can do things other than just taking medication to reduce how much your illness affects your everyday life 81% 81%
Can reduce the emotional distress caused by your health condition from interfering with the things you want to do 79% N/A
Can keep any other symptoms or health problems you have from interfering with the things you want to do 79% N/A
Can keep the physical discomfort or pain of your disease from interfering with the things you want to do 78% N/A
Can keep the fatigue caused by your disease from interfering with the things you want to do 72% N/A
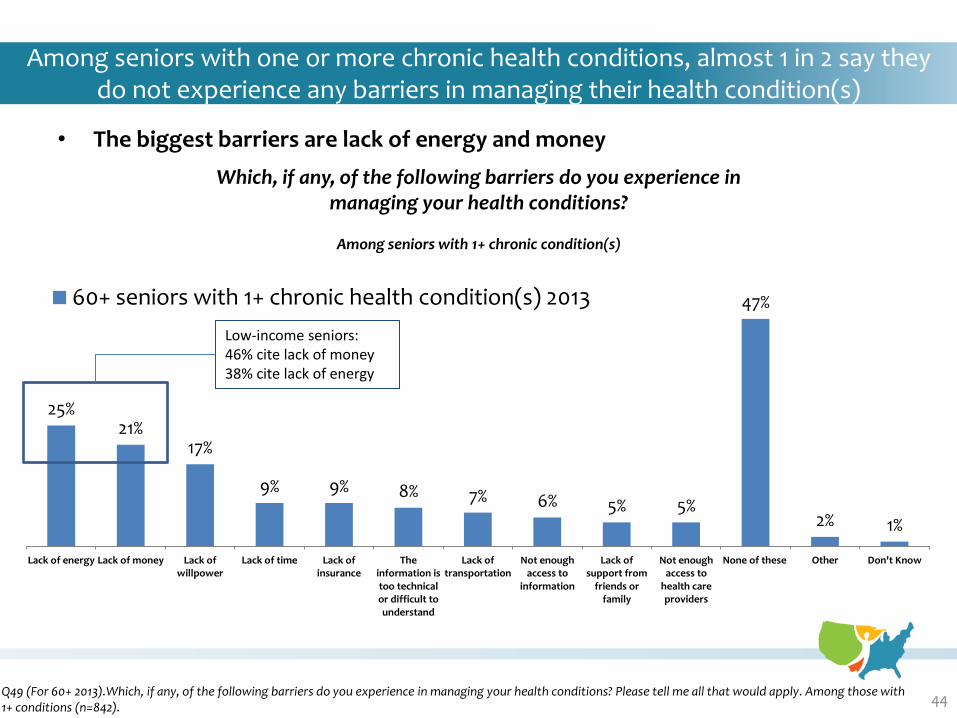
• The biggest barriers are lack of energy and money
Among seniors with one or more chronic health conditions, almost 1 in 2 say they do not experience any barriers in managing their health condition(s)
44 Q49 (For 60+ 2013).Which, if any, of the following barriers do you experience in managing your health conditions? Please tell me all that would apply. Among those with 1+ conditions (n=842).
1% 2%
47%
5% 5% 6% 7% 8% 9% 9%
17% 21%
25%
Don't KnowOtherNone of theseNot enoughaccess to
health careproviders
Lack ofsupport from
friends orfamily
Not enoughaccess to
information
Lack oftransportation
Theinformation istoo technicalor difficult tounderstand
Lack ofinsurance
Lack of timeLack ofwillpower
Lack of moneyLack of energy
60+ seniors with 1+ chronic health condition(s) 2013
Which, if any, of the following barriers do you experience in managing your health conditions?
Among seniors with 1+ chronic condition(s)
Low-income seniors: 46% cite lack of money 38% cite lack of energy
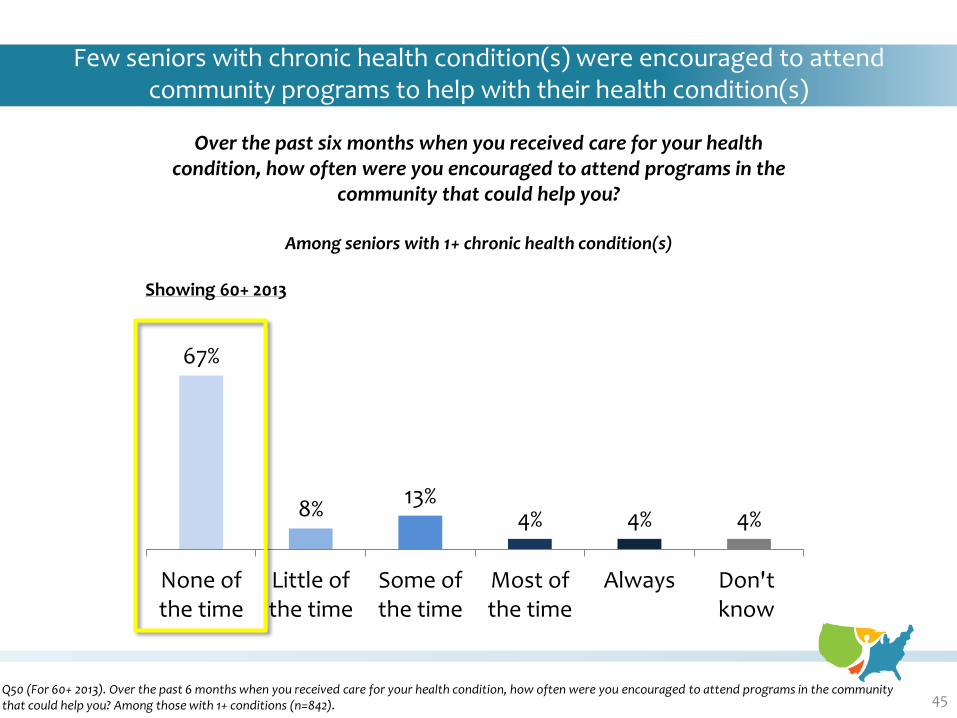
Few seniors with chronic health condition(s) were encouraged to attend community programs to help with their health condition(s)
45 Q50 (For 60+ 2013). Over the past 6 months when you received care for your health condition, how often were you encouraged to attend programs in the community that could help you? Among those with 1+ conditions (n=842).
Over the past six months when you received care for your health condition, how often were you encouraged to attend programs in the
community that could help you?
Among seniors with 1+ chronic health condition(s)
Showing 60+ 2013
67%
8% 13%
4% 4% 4%
None ofthe time
Little ofthe time
Some ofthe time
Most ofthe time
Always Don'tknow
COMMUNITY PREPAREDNESS
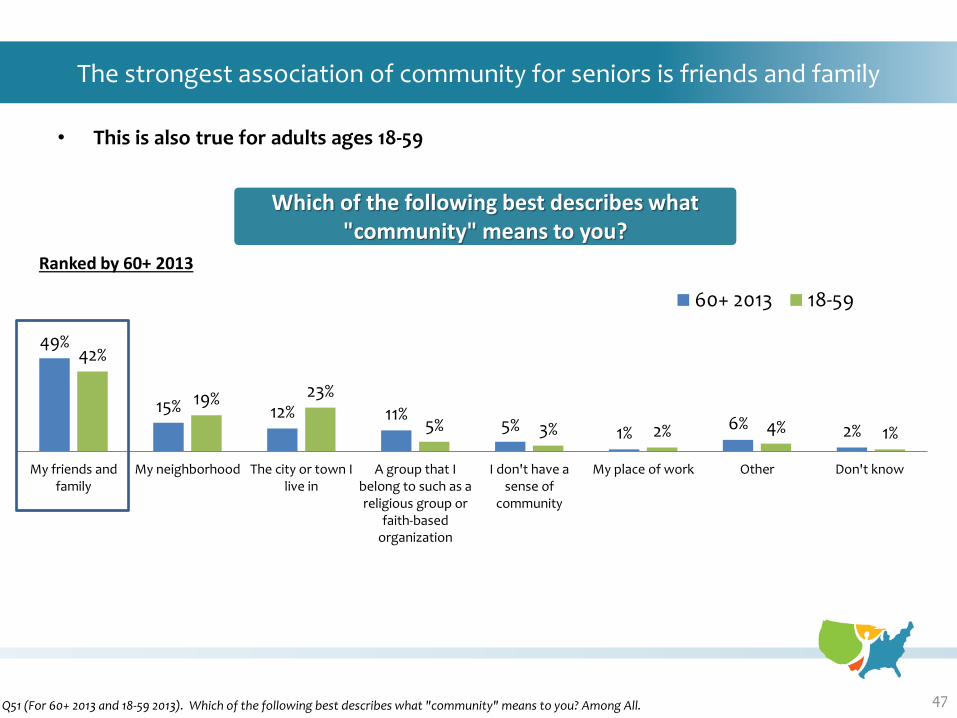
• This is also true for adults ages 18-59
The strongest association of community for seniors is friends and family
47 Q51 (For 60+ 2013 and 18-59 2013). Which of the following best describes what "community" means to you? Among All.
49%
15% 12% 11% 5% 1%
6% 2%
42%
19% 23%
5% 3% 2% 4% 1%
My friends andfamily
My neighborhood The city or town Ilive in
A group that Ibelong to such as areligious group or
faith-basedorganization
I don't have asense of
community
My place of work Other Don't know
60+ 2013 18-59
Ranked by 60+ 2013
Which of the following best describes what "community" means to you?
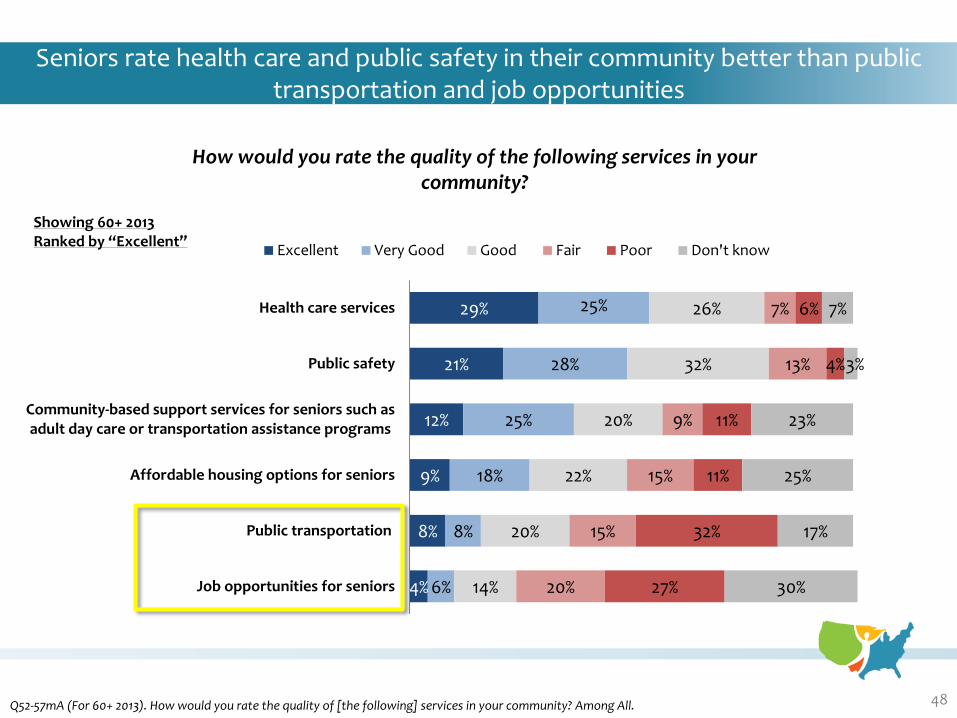
Seniors rate health care and public safety in their community better than public transportation and job opportunities
48 Q52-57mA (For 60+ 2013). How would you rate the quality of [the following] services in your community? Among All.
Showing 60+ 2013 Ranked by “Excellent”
How would you rate the quality of the following services in your community?
4%
8%
9%
12%
21%
29%
6%
8%
18%
25%
28%
25%
14%
20%
22%
20%
32%
26%
20%
15%
15%
9%
13%
7%
27%
32%
11%
11%
4%
6%
30%
17%
25%
23%
3%
7%
Job opportunities for seniors
Public transportation
Affordable housing options for seniors
Community-based support services for seniors such asadult day care or transportation assistance programs
Public safety
Health care services
Excellent Very Good Good Fair Poor Don't know
41%
45%
2013 18-59
Yes No
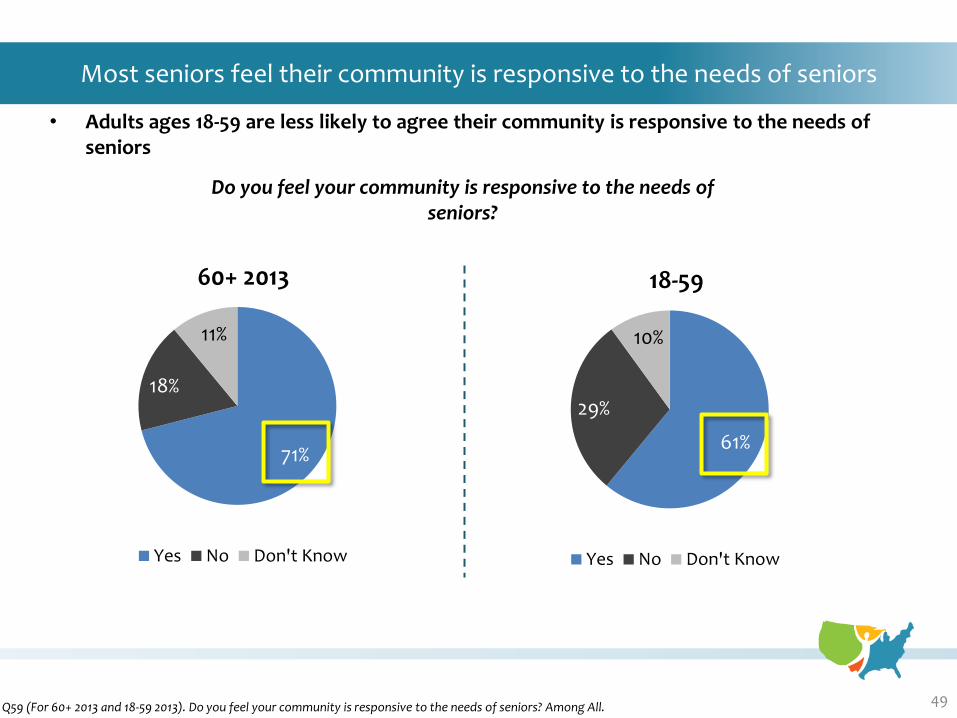
• Adults ages 18-59 are less likely to agree their community is responsive to the needs of seniors
Most seniors feel their community is responsive to the needs of seniors
49 Q59 (For 60+ 2013 and 18-59 2013). Do you feel your community is responsive to the needs of seniors? Among All.
Do you feel your community is responsive to the needs of seniors?
71%
18%
11%
60+ 2013
Yes No Don't Know
61%
29%
10%
18-59
Yes No Don't Know
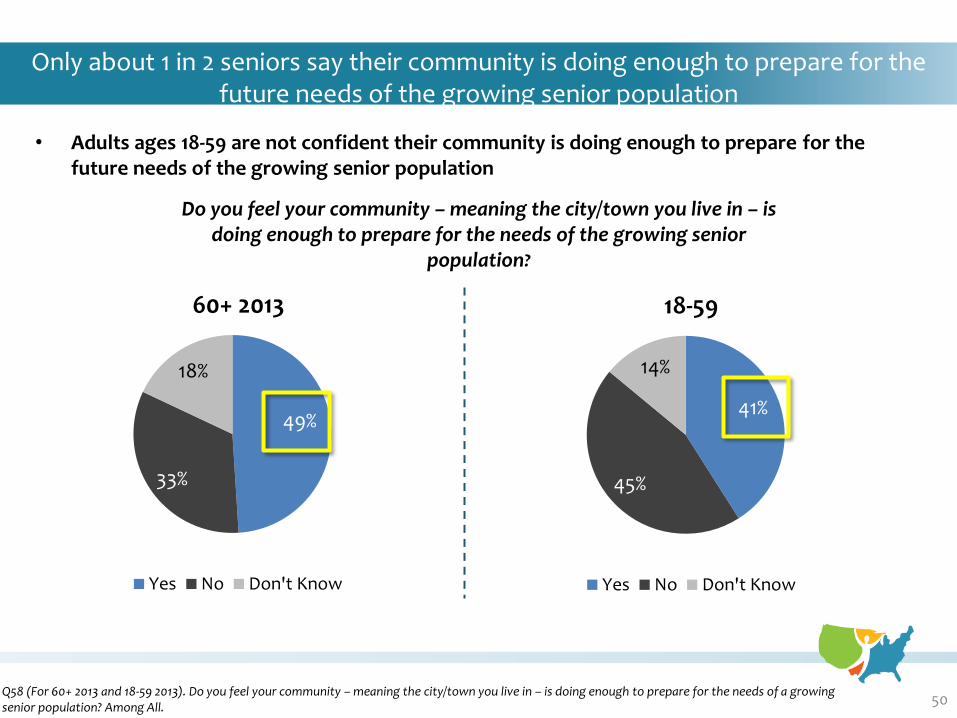
• Adults ages 18-59 are not confident their community is doing enough to prepare for the future needs of the growing senior population population
Only about 1 in 2 seniors say their community is doing enough to prepare for the future needs of the growing senior population
50 Q58 (For 60+ 2013 and 18-59 2013). Do you feel your community – meaning the city/town you live in – is doing enough to prepare for the needs of a growing senior population? Among All.
49%
33%
18%
60+ 2013
Yes No Don't Know
41%
45%
14%
18-59
Yes No Don't Know
Do you feel your community – meaning the city/town you live in – is doing enough to prepare for the needs of the growing senior
population?
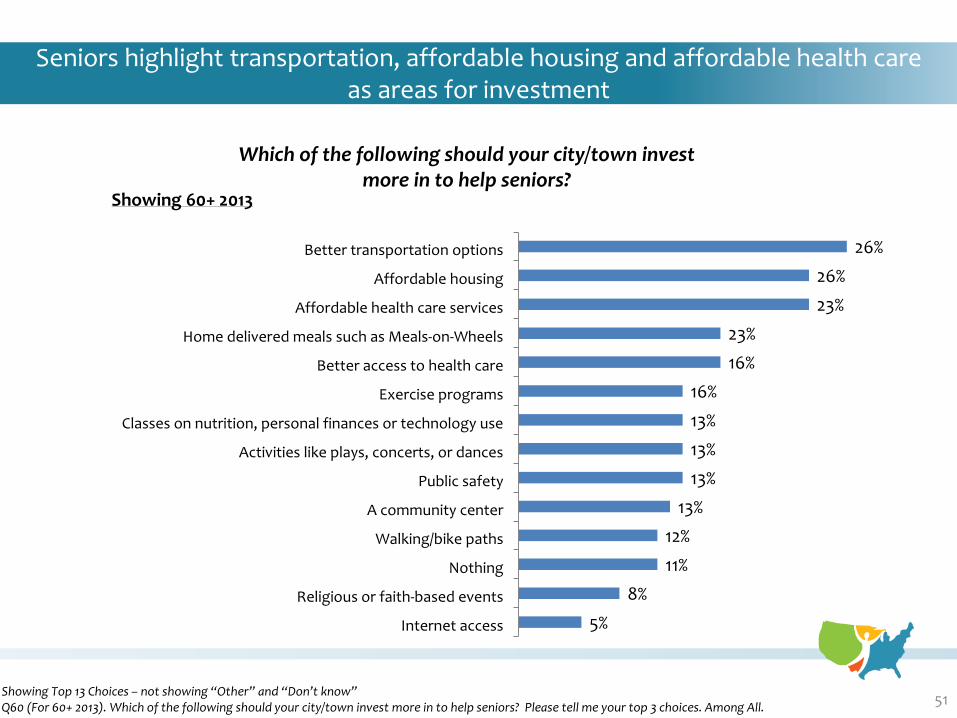
Seniors highlight transportation, affordable housing and affordable health care as areas for investment
51 Showing Top 13 Choices – not showing “Other” and “Don’t know” Q60 (For 60+ 2013). Which of the following should your city/town invest more in to help seniors? Please tell me your top 3 choices. Among All.
Which of the following should your city/town invest more in to help seniors?
%
5%
8%
11%
12%
13%
13%
13%
13%
16%
16%
23%
23%
26%
26%
Internet access
Religious or faith-based events
Nothing
Walking/bike paths
A community center
Public safety
Activities like plays, concerts, or dances
Classes on nutrition, personal finances or technology use
Exercise programs
Better access to health care
Home delivered meals such as Meals-on-Wheels
Affordable health care services
Affordable housing
Better transportation options
Showing 60+ 2013

ROLE OF TECHNOLOGY
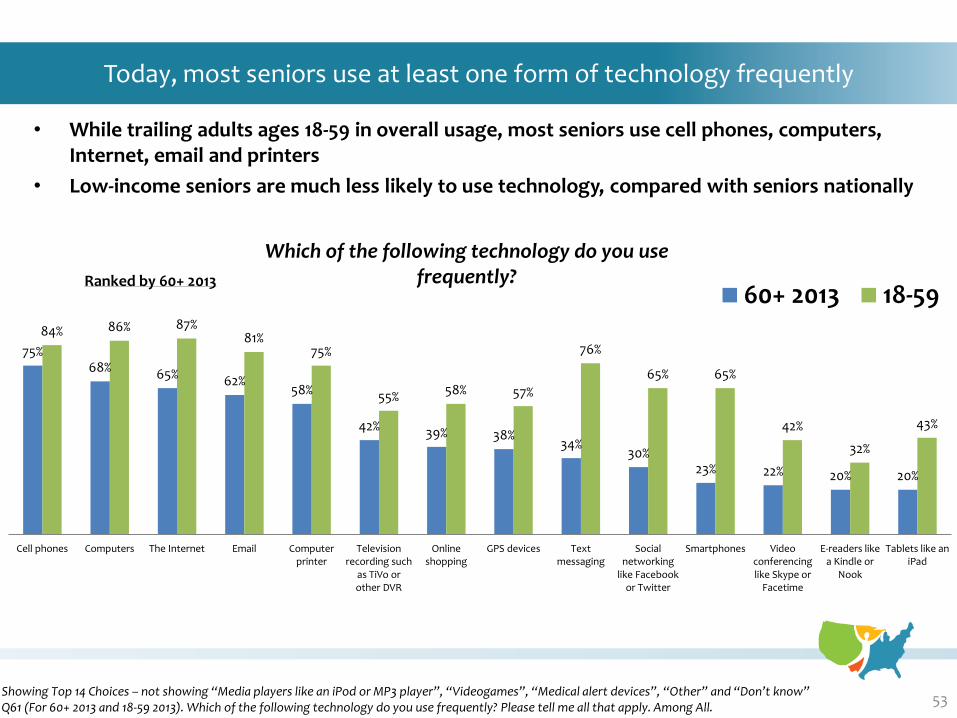
• While trailing adults ages 18-59 in overall usage, most seniors use cell phones, computers, Internet, email and printers
• Low-income seniors are much less likely to use technology, compared with seniors nationally
Today, most seniors use at least one form of technology frequently
53 Showing Top 14 Choices – not showing “Media players like an iPod or MP3 player”, “Videogames”, “Medical alert devices”, “Other” and “Don’t know” Q61 (For 60+ 2013 and 18-59 2013). Which of the following technology do you use frequently? Please tell me all that apply. Among All.
Which of the following technology do you use frequently?
% 75%
68% 65% 62% 58%
42% 39% 38% 34%
30% 23% 22% 20% 20%
84% 86% 87% 81%
75%
55% 58% 57%
76%
65% 65%
42%
32%
43%
Cell phones Computers The Internet Email Computerprinter
Televisionrecording such
as TiVo orother DVR
Onlineshopping
GPS devices Textmessaging
Socialnetworking
like Facebookor Twitter
Smartphones Videoconferencinglike Skype or
Facetime
E-readers likea Kindle or
Nook
Tablets like aniPad
60+ 2013 18-59Ranked by 60+ 2013
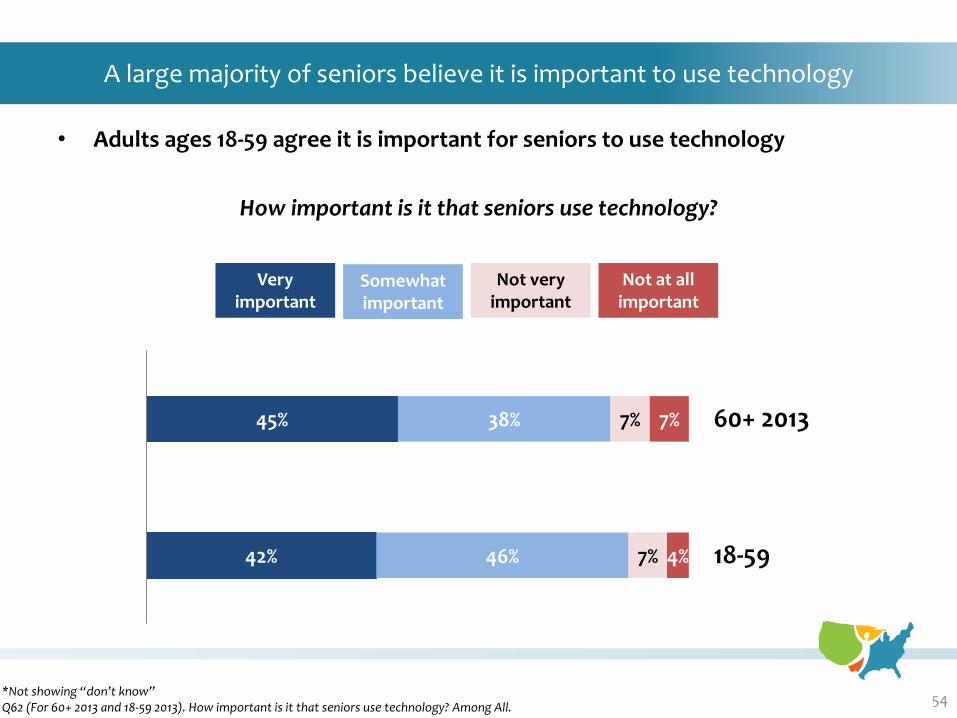
• Adults ages 18-59 agree it is important for seniors to use technology
A large majority of seniors believe it is important to use technology
54 *Not showing “don’t know” Q62 (For 60+ 2013 and 18-59 2013). How important is it that seniors use technology? Among All.
How important is it that seniors use technology?
45%
42%
38%
46%
7%
7%
7%
4%
60+ 2013
18-59
Not at all important
Somewhat important
Not very important
Very important
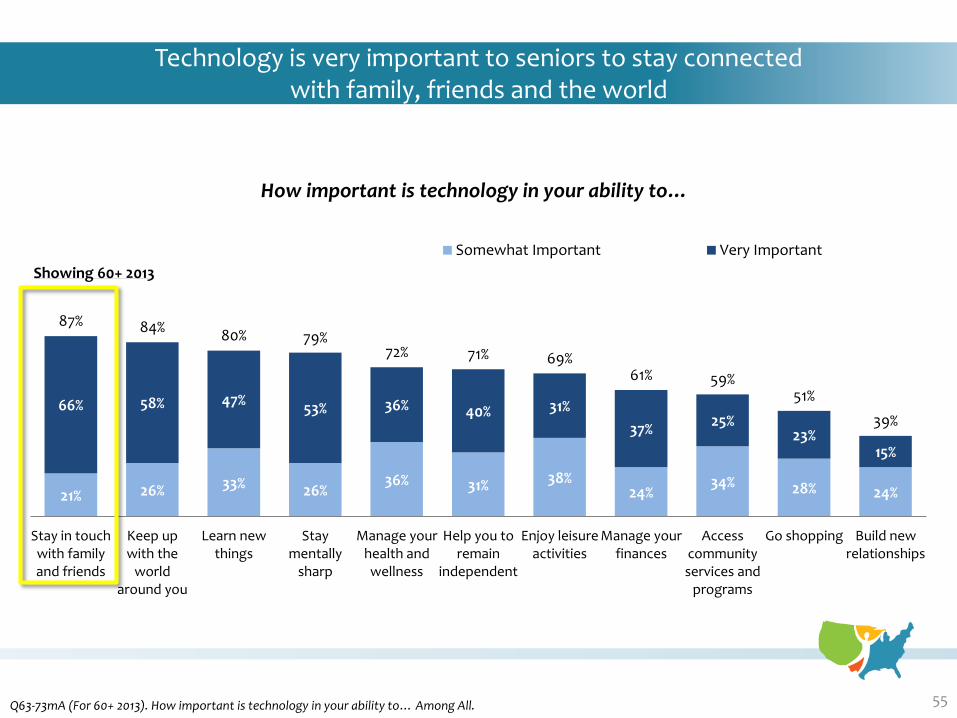
Technology is very important to seniors to stay connected with family, friends and the world
55 Q63-73mA (For 60+ 2013). How important is technology in your ability to… Among All.
21% 26% 33% 26% 36% 31% 38%
24% 34% 28% 24%
66% 58% 47% 53% 36% 40% 31%
37% 25%
23% 15%
87% 84% 80% 79%
72% 71% 69% 61% 59%
51%
39%
Stay in touchwith familyand friends
Keep upwith the
worldaround you
Learn newthings
Staymentally
sharp
Manage yourhealth andwellness
Help you toremain
independent
Enjoy leisureactivities
Manage yourfinances
Accesscommunityservices and
programs
Go shopping Build newrelationships
Somewhat Important Very Important
Showing 60+ 2013
How important is technology in your ability to…
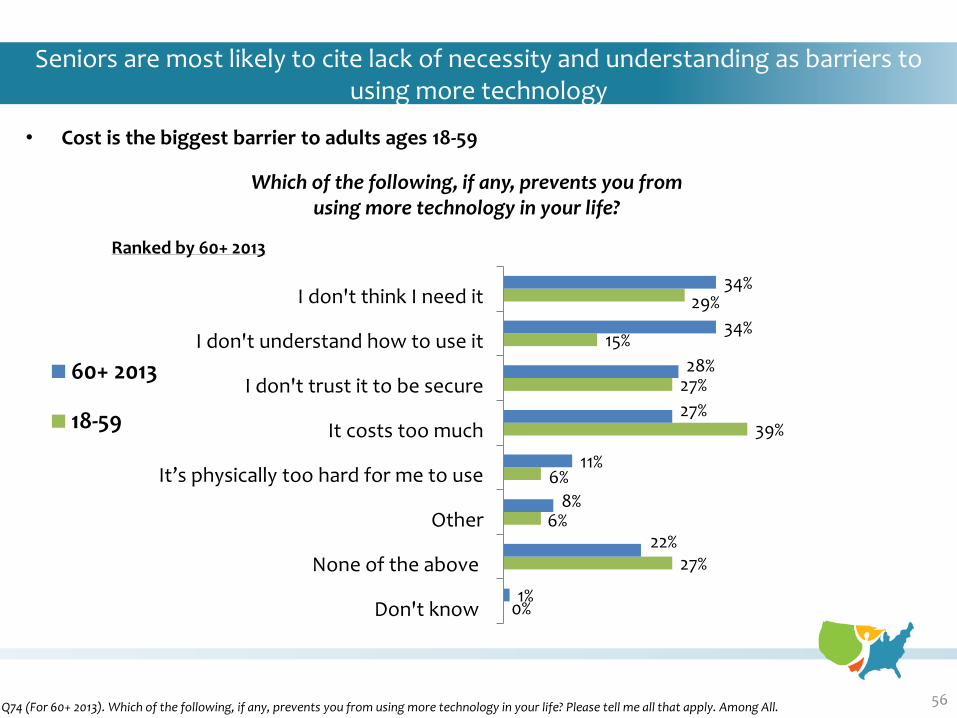
• Cost is the biggest barrier to adults ages 18-59
Seniors are most likely to cite lack of necessity and understanding as barriers to using more technology
56 Q74 (For 60+ 2013). Which of the following, if any, prevents you from using more technology in your life? Please tell me all that apply. Among All.
Which of the following, if any, prevents you from using more technology in your life?
0%
27%
6%
6%
39%
27%
15%
29%
1%
22%
8%
11%
27%
28%
34%
34%
Don't know
None of the above
Other
It’s physically too hard for me to use
It costs too much
I don't trust it to be secure
I don't understand how to use it
I don't think I need it
60+ 2013
18-59
Ranked by 60+ 2013
DEFINING OLD AGE
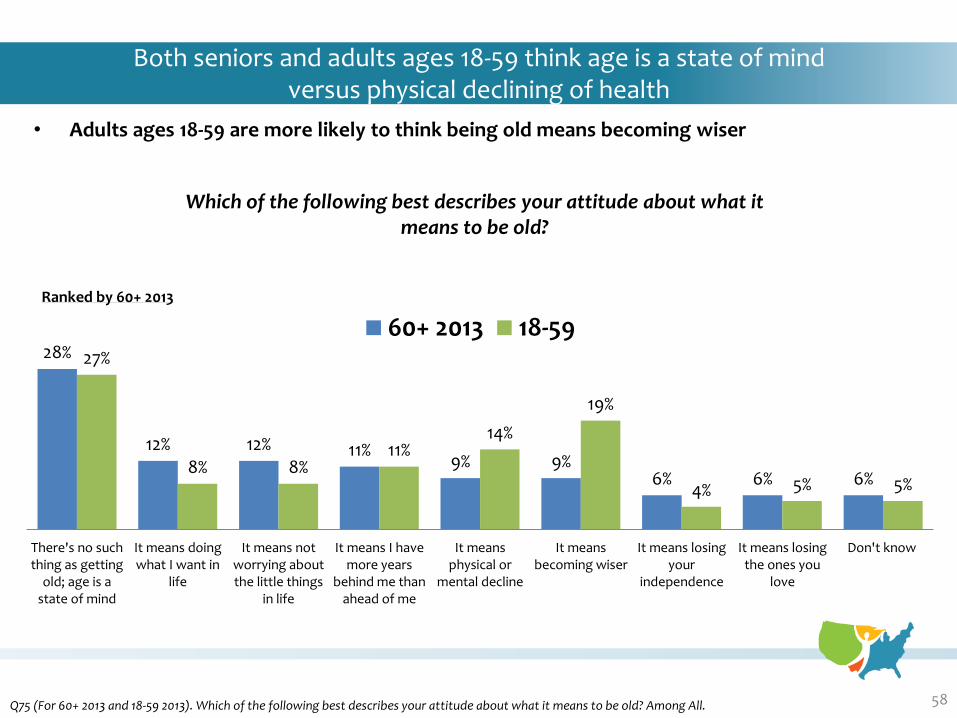
• Adults ages 18-59 are more likely to think being old means becoming wiser
Both seniors and adults ages 18-59 think age is a state of mind versus physical declining of health
58 Q75 (For 60+ 2013 and 18-59 2013). Which of the following best describes your attitude about what it means to be old? Among All.
Ranked by 60+ 2013
Which of the following best describes your attitude about what it means to be old?
28%
12% 12% 11% 9% 9%
6% 6% 6%
27%
8% 8% 11%
14%
19%
4% 5% 5%
There's no suchthing as getting
old; age is astate of mind
It means doingwhat I want in
life
It means notworrying aboutthe little things
in life
It means I havemore years
behind me thanahead of me
It meansphysical or
mental decline
It meansbecoming wiser
It means losingyour
independence
It means losingthe ones you
love
Don't know
60+ 2013 18-59
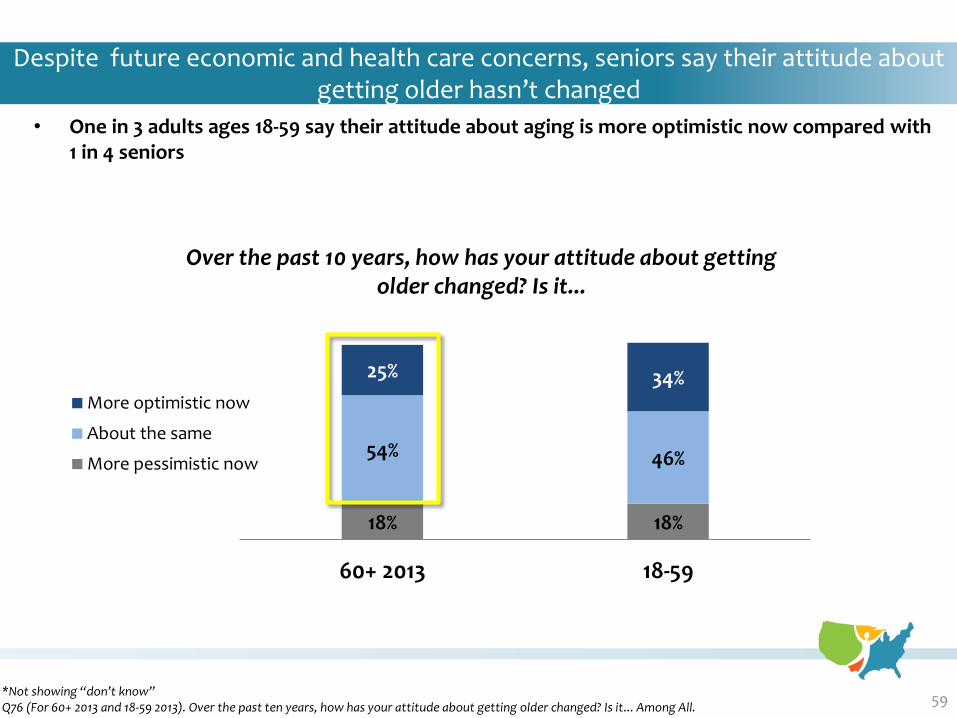
Despite future economic and health care concerns, seniors say their attitude about getting older hasn’t changed
59 *Not showing “don’t know” Q76 (For 60+ 2013 and 18-59 2013). Over the past ten years, how has your attitude about getting older changed? Is it... Among All.
Over the past 10 years, how has your attitude about getting older changed? Is it...
18% 18%
54% 46%
25% 34%
60+ 2013 18-59
More optimistic now
About the same
More pessimistic now
• One in 3 adults ages 18-59 say their attitude about aging is more optimistic now compared with 1 in 4 seniors
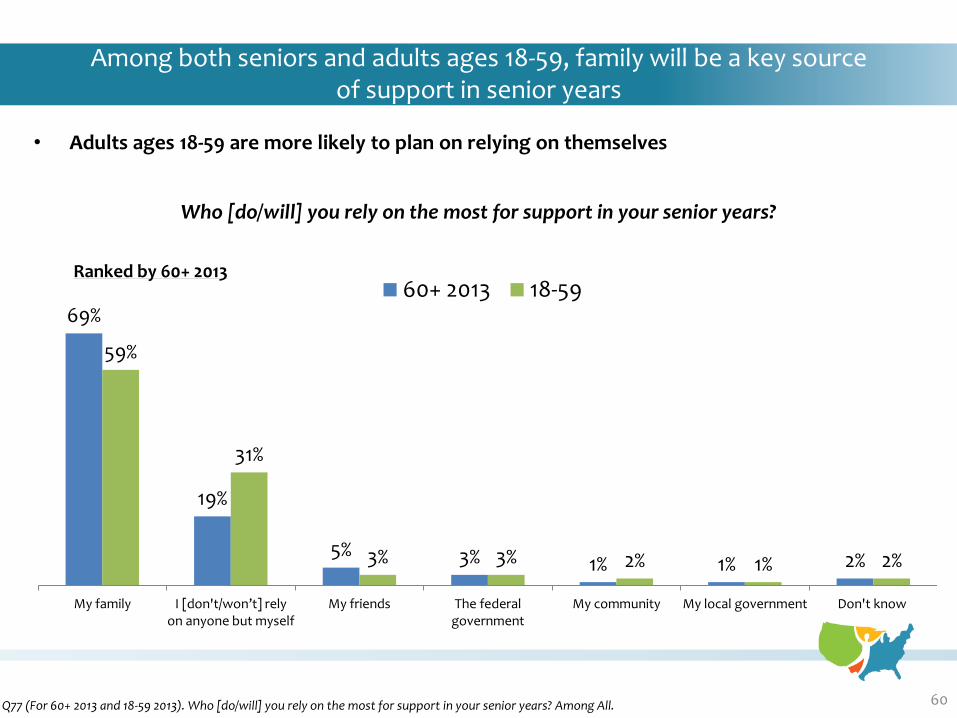
• Adults ages 18-59 are more likely to plan on relying on themselves
Among both seniors and adults ages 18-59, family will be a key source of support in senior years
60 Q77 (For 60+ 2013 and 18-59 2013). Who [do/will] you rely on the most for support in your senior years? Among All.
Who [do/will] you rely on the most for support in your senior years?
69%
19%
5% 3% 1% 1% 2%
59%
31%
3% 3% 2% 1% 2%
My family I [don't/won’t] rely on anyone but myself
My friends The federalgovernment
My community My local government Don't know
60+ 2013 18-59Ranked by 60+ 2013
41%
45%
2013 18-59
Yes No
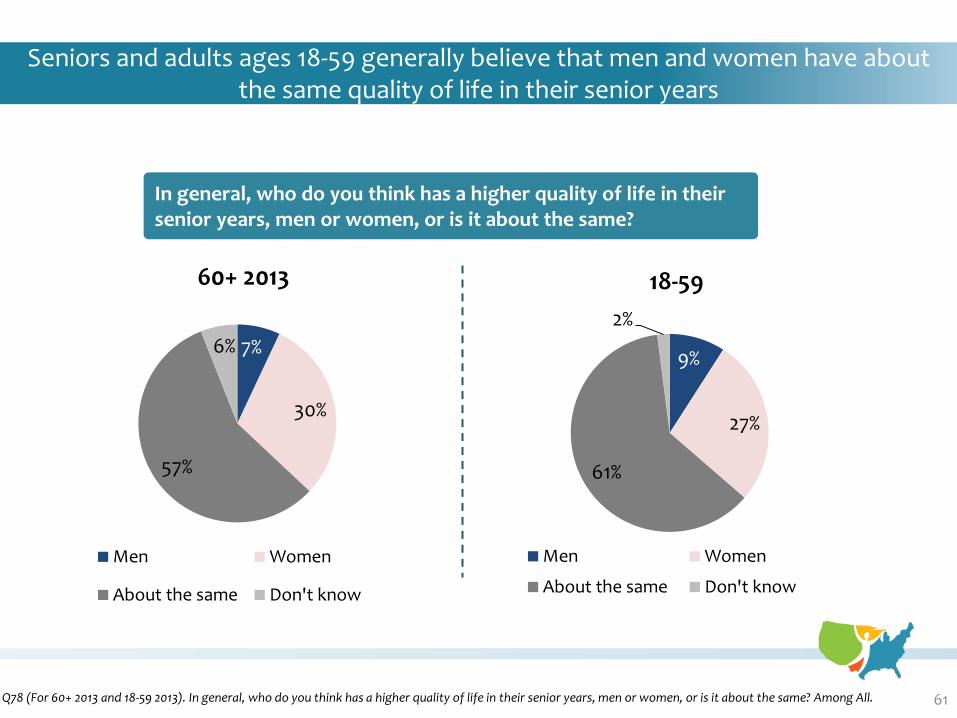
Seniors and adults ages 18-59 generally believe that men and women have about the same quality of life in their senior years
61 Q78 (For 60+ 2013 and 18-59 2013). In general, who do you think has a higher quality of life in their senior years, men or women, or is it about the same? Among All.
In general, who do you think has a higher quality of life in their senior years, men or women, or is it about the same?
7%
30%
57%
6%
60+ 2013
Men Women
About the same Don't know
9%
27%
61%
2%
18-59
Men Women
About the same Don't know
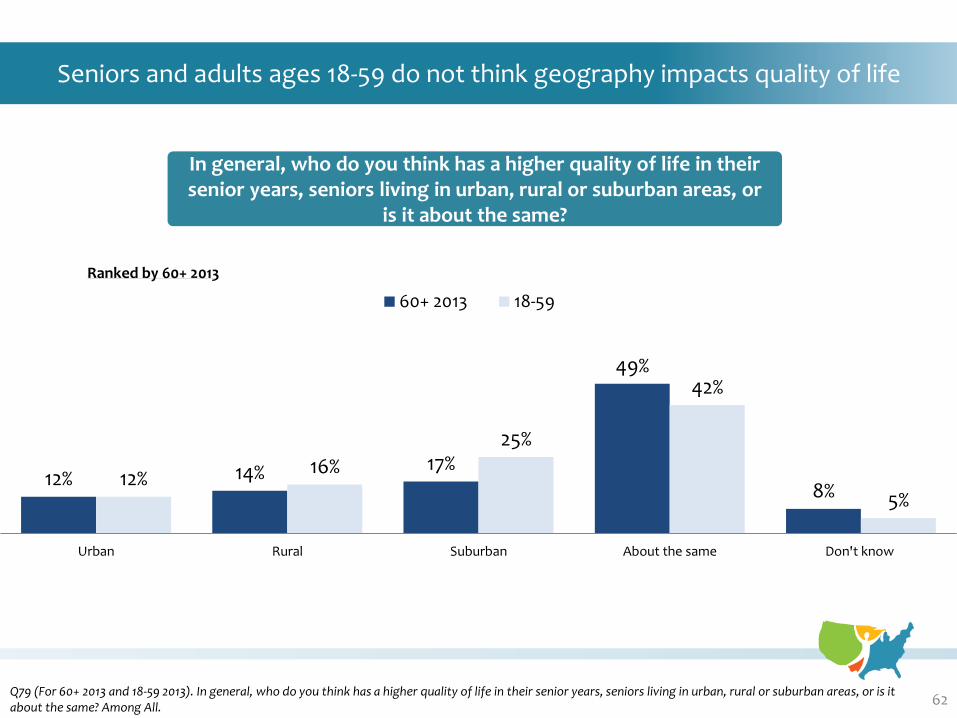
Seniors and adults ages 18-59 do not think geography impacts quality of life
62 Q79 (For 60+ 2013 and 18-59 2013). In general, who do you think has a higher quality of life in their senior years, seniors living in urban, rural or suburban areas, or is it about the same? Among All.
Ranked by 60+ 2013
In general, who do you think has a higher quality of life in their senior years, seniors living in urban, rural or suburban areas, or
is it about the same?
12% 14% 17%
49%
8% 12%
16%
25%
42%
5%
Urban Rural Suburban About the same Don't know
60+ 2013 18-59
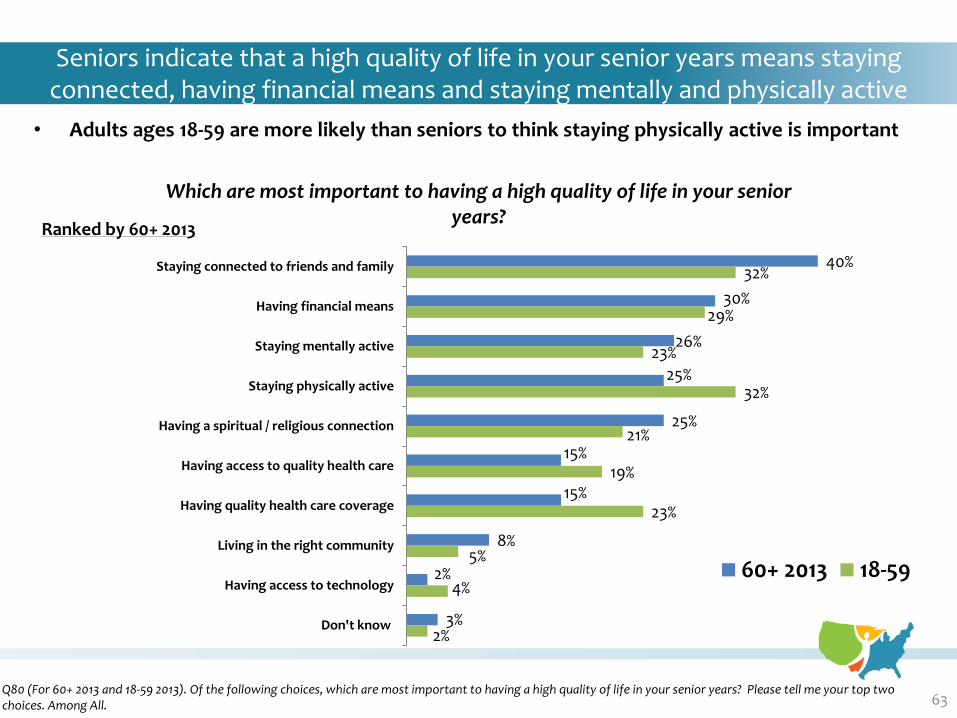
Seniors indicate that a high quality of life in your senior years means staying connected, having financial means and staying mentally and physically active
63 Q80 (For 60+ 2013 and 18-59 2013). Of the following choices, which are most important to having a high quality of life in your senior years? Please tell me your top two choices. Among All.
Which are most important to having a high quality of life in your senior years?
40%
30%
26%
25%
25%
15%
15%
8%
2%
3%
32%
29%
23%
32%
21%
19%
23%
5%
4%
2%
Staying connected to friends and family
Having financial means
Staying mentally active
Staying physically active
Having a spiritual / religious connection
Having access to quality health care
Having quality health care coverage
Living in the right community
Having access to technology
Don't know
60+ 2013 18-59
Ranked by 60+ 2013
• Adults ages 18-59 are more likely than seniors to think staying physically active is important
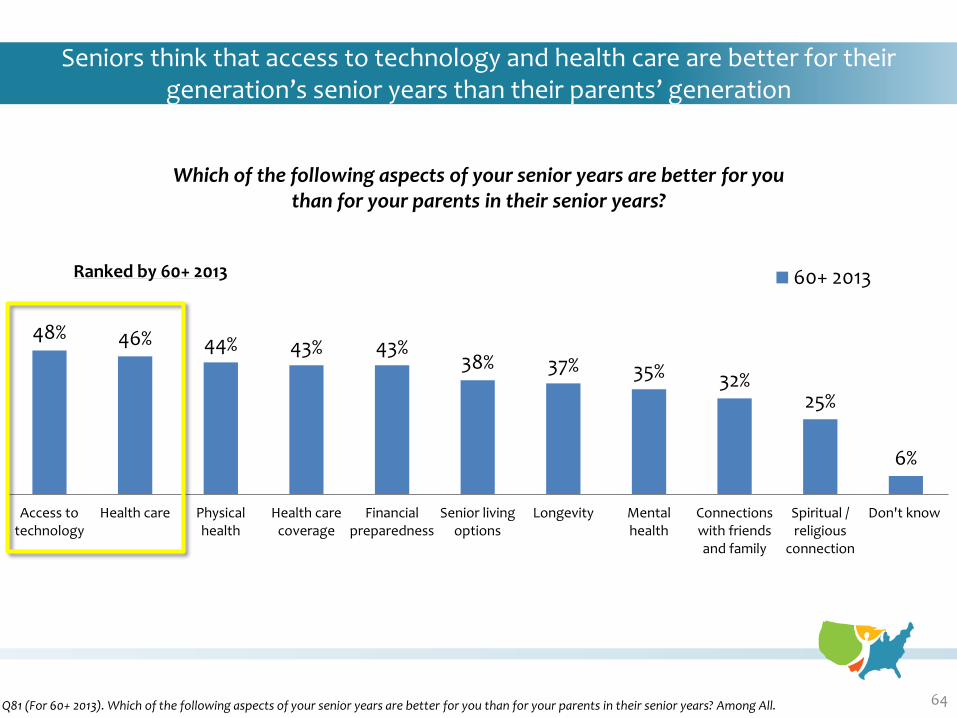
Seniors think that access to technology and health care are better for their generation’s senior years than their parents’ generation
64 Q81 (For 60+ 2013). Which of the following aspects of your senior years are better for you than for your parents in their senior years? Among All.
Which of the following aspects of your senior years are better for you than for your parents in their senior years?
Ranked by 60+ 2013
48% 46% 44% 43% 43% 38% 37% 35% 32%
25%
6%
Access totechnology
Health care Physicalhealth
Health carecoverage
Financialpreparedness
Senior livingoptions
Longevity Mentalhealth
Connectionswith friendsand family
Spiritual /religious
connection
Don't know
60+ 2013
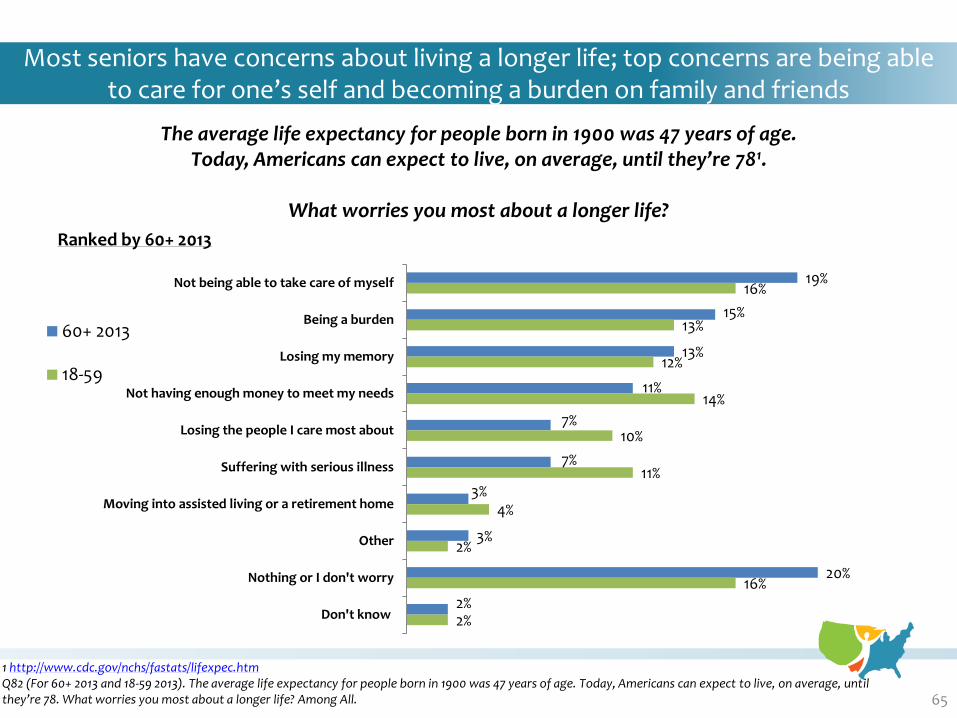
Most seniors have concerns about living a longer life; top concerns are being able to care for one’s self and becoming a burden on family and friends
65
1 http://www.cdc.gov/nchs/fastats/lifexpec.htm Q82 (For 60+ 2013 and 18-59 2013). The average life expectancy for people born in 1900 was 47 years of age. Today, Americans can expect to live, on average, until they’re 78. What worries you most about a longer life? Among All.
The average life expectancy for people born in 1900 was 47 years of age. Today, Americans can expect to live, on average, until they’re 781.
What worries you most about a longer life?
19%
15%
13%
11%
7%
7%
3%
3%
20%
2%
16%
13%
12%
14%
10%
11%
4%
2%
16%
2%
Not being able to take care of myself
Being a burden
Losing my memory
Not having enough money to meet my needs
Losing the people I care most about
Suffering with serious illness
Moving into assisted living or a retirement home
Other
Nothing or I don't worry
Don't know
60+ 2013
18-59
Ranked by 60+ 2013
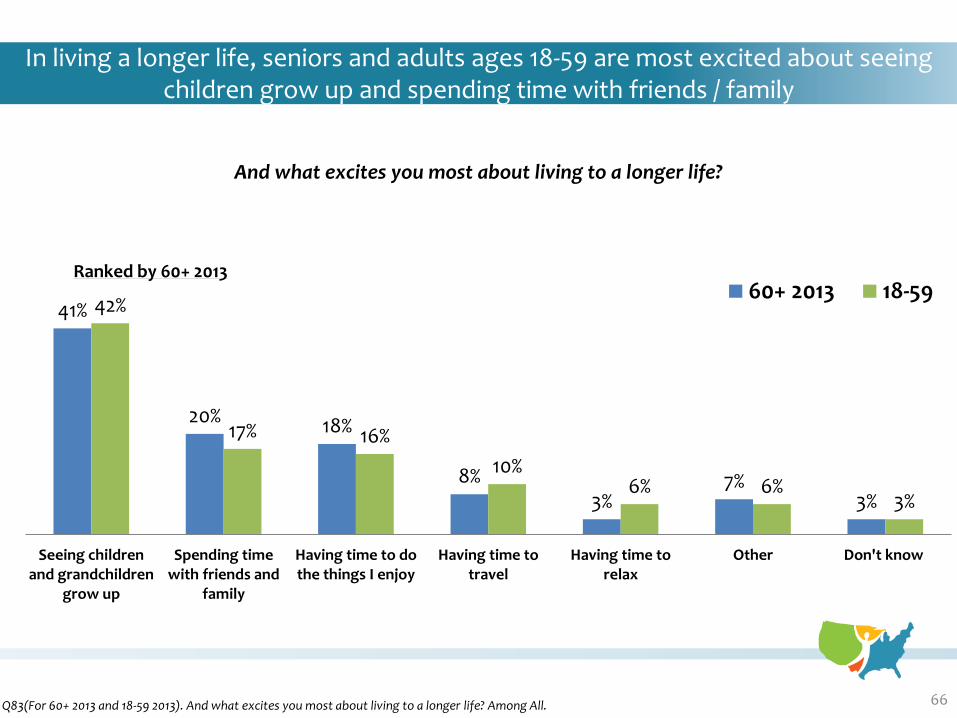
In living a longer life, seniors and adults ages 18-59 are most excited about seeing children grow up and spending time with friends / family
66 Q83(For 60+ 2013 and 18-59 2013). And what excites you most about living to a longer life? Among All.
And what excites you most about living to a longer life?
Ranked by 60+ 2013
41%
20% 18%
8% 3%
7% 3%
42%
17% 16%
10% 6% 6%
3%
Seeing childrenand grandchildren
grow up
Spending timewith friends and
family
Having time to dothe things I enjoy
Having time totravel
Having time torelax
Other Don't know
60+ 2013 18-59

DEMOGRAPHICS
• xx
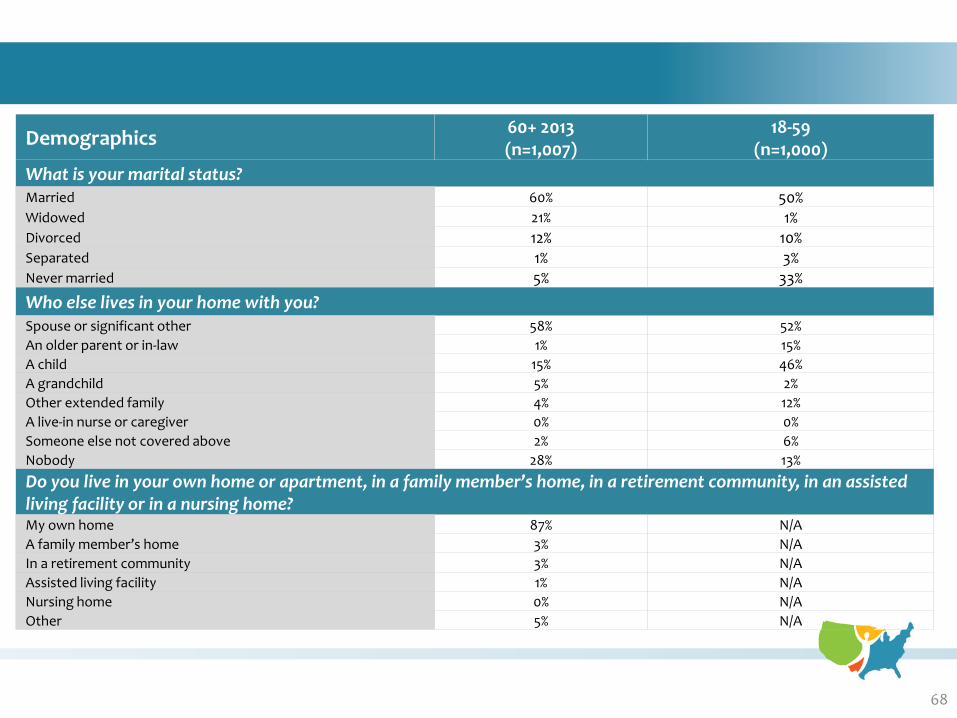
68
Demographics 60+ 2013 (n=1,007)
18-59 (n=1,000)
What is your marital status? Married 60% 50% Widowed 21% 1% Divorced 12% 10% Separated 1% 3% Never married 5% 33%
Who else lives in your home with you? Spouse or significant other 58% 52%
An older parent or in-law 1% 15%
A child 15% 46%
A grandchild 5% 2%
Other extended family 4% 12%
A live-in nurse or caregiver 0% 0%
Someone else not covered above 2% 6%
Nobody 28% 13%
Do you live in your own home or apartment, in a family member’s home, in a retirement community, in an assisted living facility or in a nursing home? My own home 87% N/A
A family member’s home 3% N/A
In a retirement community 3% N/A
Assisted living facility 1% N/A
Nursing home 0% N/A
Other 5% N/A
• xx
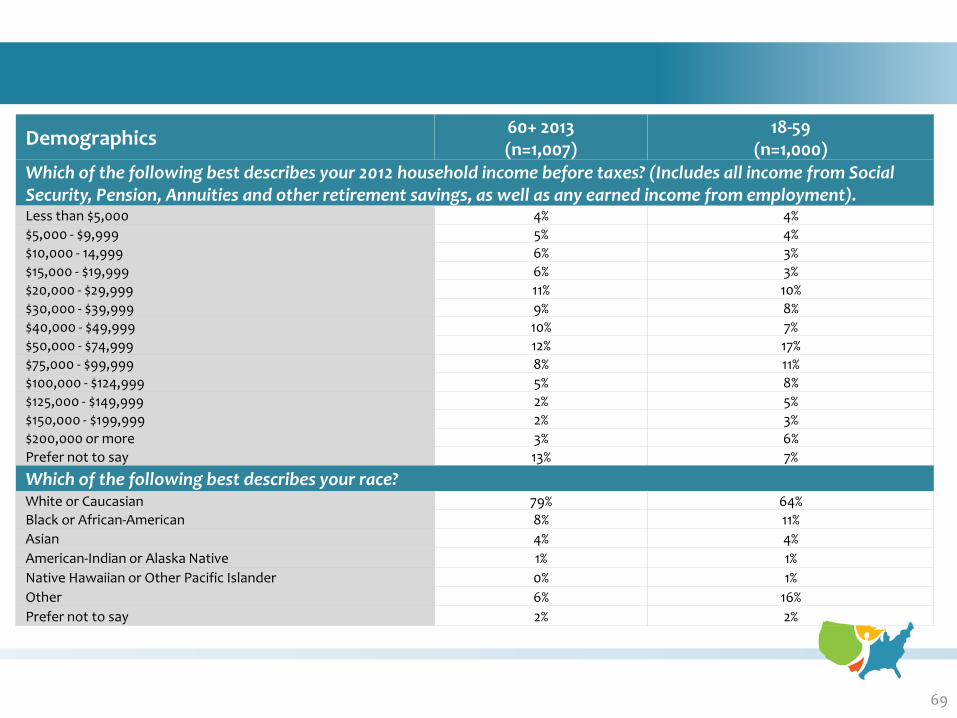
69
Demographics 60+ 2013 (n=1,007)
18-59 (n=1,000)
Which of the following best describes your 2012 household income before taxes? (Includes all income from Social Security, Pension, Annuities and other retirement savings, as well as any earned income from employment). Less than $5,000 4% 4%
$5,000 - $9,999 5% 4%
$10,000 - 14,999 6% 3%
$15,000 - $19,999 6% 3%
$20,000 - $29,999 11% 10%
$30,000 - $39,999 9% 8%
$40,000 - $49,999 10% 7%
$50,000 - $74,999 12% 17%
$75,000 - $99,999 8% 11%
$100,000 - $124,999 5% 8%
$125,000 - $149,999 2% 5%
$150,000 - $199,999 2% 3%
$200,000 or more 3% 6%
Prefer not to say 13% 7%
Which of the following best describes your race? White or Caucasian 79% 64%
Black or African-American 8% 11%
Asian 4% 4%
American-Indian or Alaska Native 1% 1%
Native Hawaiian or Other Pacific Islander 0% 1%
Other 6% 16%
Prefer not to say 2% 2%
• xx
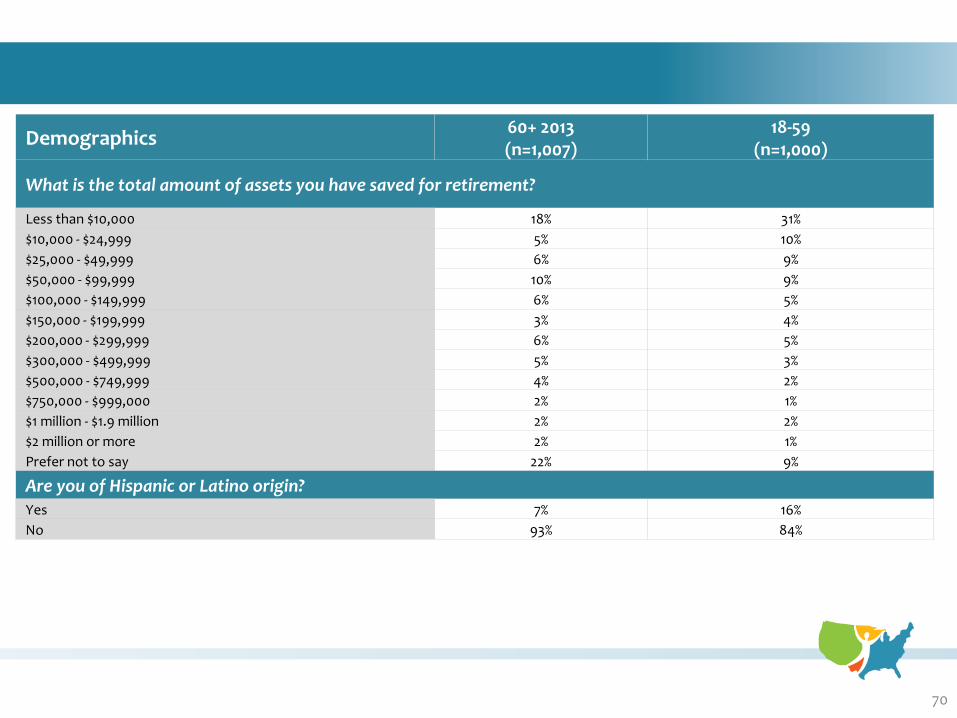
70
Demographics 60+ 2013 (n=1,007)
18-59 (n=1,000)
What is the total amount of assets you have saved for retirement?
Less than $10,000 18% 31%
$10,000 - $24,999 5% 10%
$25,000 - $49,999 6% 9%
$50,000 - $99,999 10% 9%
$100,000 - $149,999 6% 5%
$150,000 - $199,999 3% 4%
$200,000 - $299,999 6% 5%
$300,000 - $499,999 5% 3%
$500,000 - $749,999 4% 2%
$750,000 - $999,000 2% 1%
$1 million - $1.9 million 2% 2%
$2 million or more 2% 1%
Prefer not to say 22% 9%
Are you of Hispanic or Latino origin? Yes 7% 16%
No 93% 84%
• xx
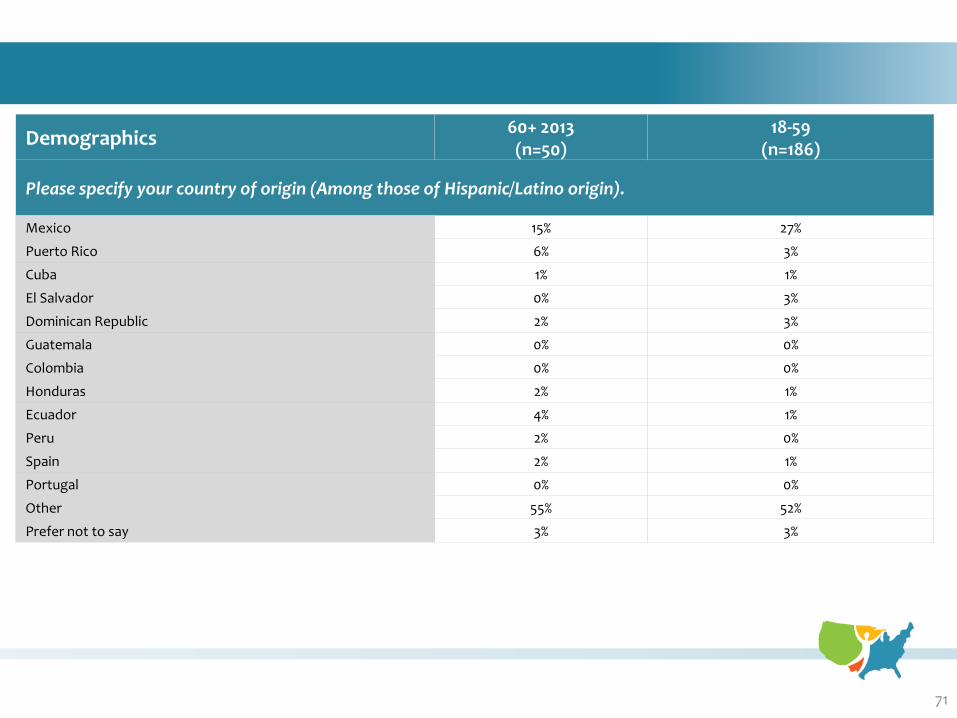
71
Demographics 60+ 2013 (n=50)
18-59 (n=186)
Please specify your country of origin (Among those of Hispanic/Latino origin).
Mexico 15% 27%
Puerto Rico 6% 3%
Cuba 1% 1%
El Salvador 0% 3%
Dominican Republic 2% 3%
Guatemala 0% 0%
Colombia 0% 0%
Honduras 2% 1%
Ecuador 4% 1%
Peru 2% 0%
Spain 2% 1%
Portugal 0% 0%
Other 55% 52%
Prefer not to say 3% 3%
Recommended