


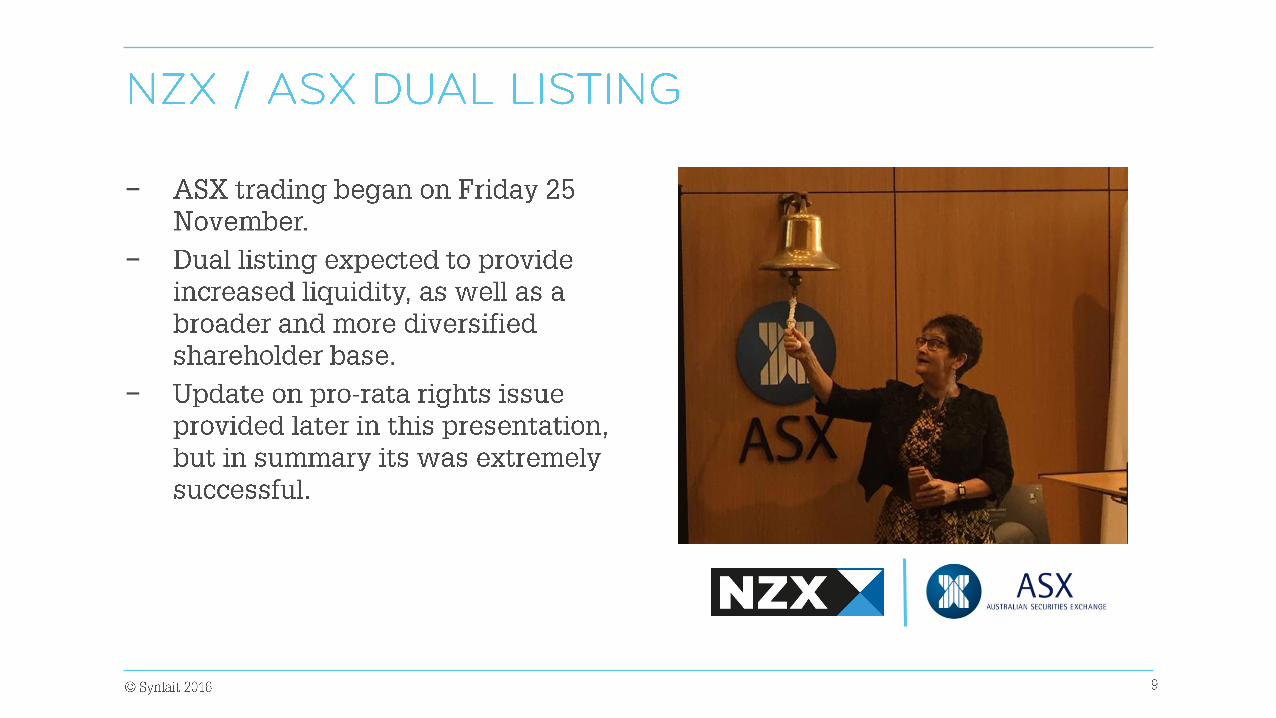
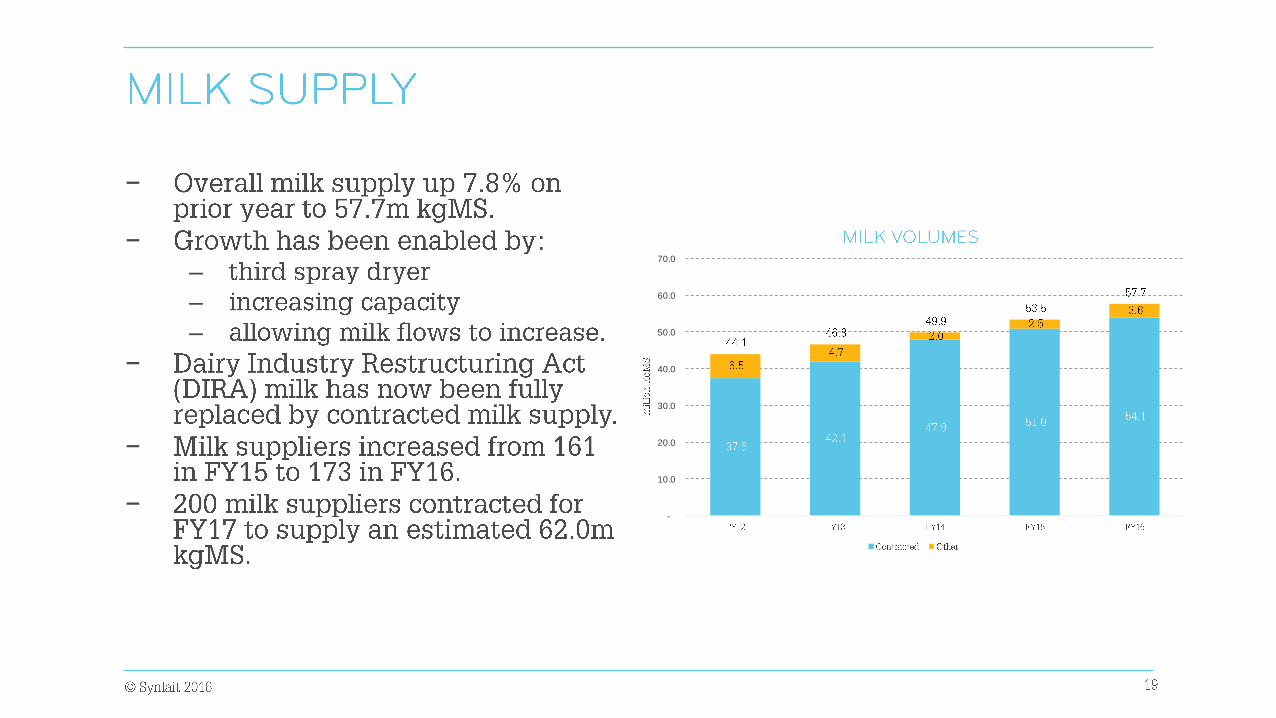
−
−
−
−
−


−
−
−

−
−
–
–
–

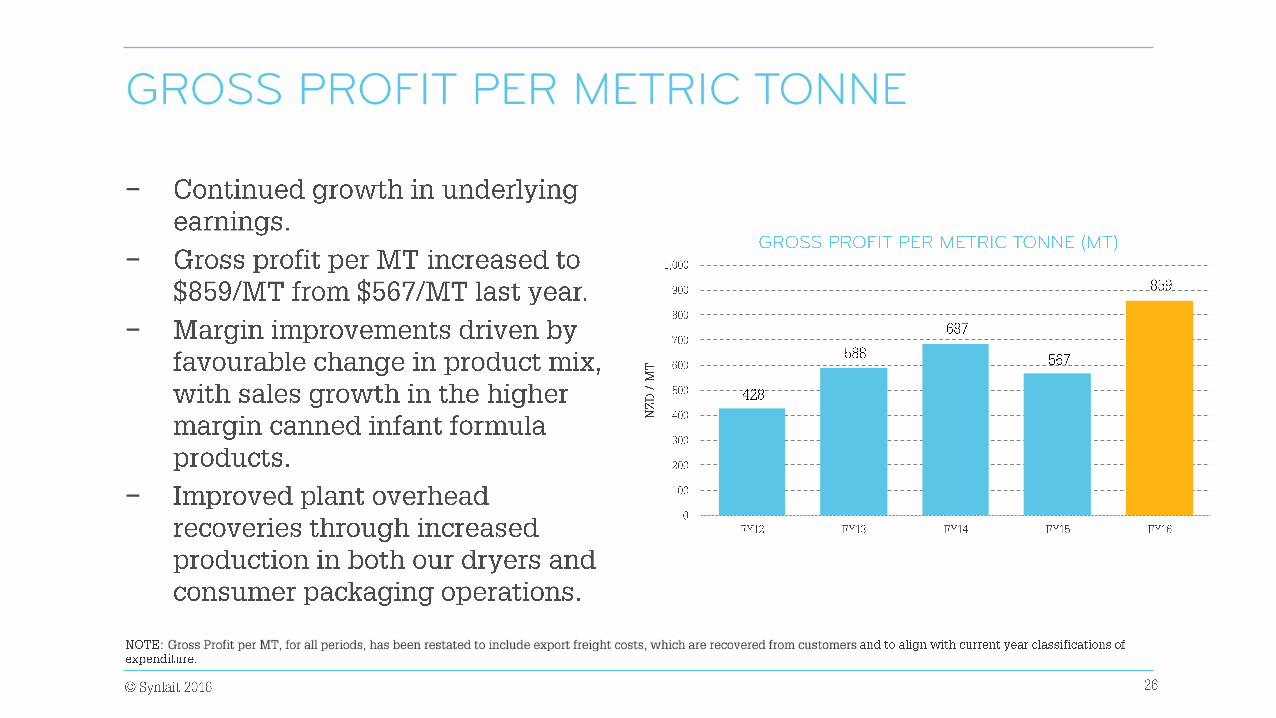
−
−
−

−
−

−
−
−
−
−


−
−
–
–
–
−

−
−
−
–
–
−
MT
−
−
−
−

−
−
−
−
−

−
−
–
–
−

−
−
−
−
−
−
−–
–
–
−
−
− -
10.0
20.0
30.0
40.0
50.0
60.0
70.0

−
−
−
−0.00
1.00
2.00
3.00
4.00
5.00
6.00
7.00
8.00
9.00
10.00
Base Synlait milk price Average premium

−
−
−
−
−
−
–
–
−

−
−–
–
–
−
−
−


−
−
−
−
−
−
−
−

−
−
−

−
−
−
ROCE

−
−
−
0
20
40
60
80
100
120
140

−
−
−
0.0
1.0
2.0
3.0
4.0
5.0
6.0
7.0
Debt / EBITDA

−
−
−
0.0%
10.0%
20.0%
30.0%
40.0%
50.0%
60.0%
70.0%
Gearing


−
−
−
−

−
−
−
−

−
−
−

−
−
–
–
−
−

−
−
−
–
–
−
−
MT

−
−
−–
–
−
−
−
−–
–
–
–

39%
16%
15%
8%
5%
3%
5%
9%Cayman Islands
New Zealand
Australia
Netherlands
Japan
Rest of Europe
Rest of World
Unanalysed
Total Shares by Geography


−
−
−
−
−
−
−
–
–

−
−
−
−
−


−
−–
–
–
–
–
−
−
−
−

−

−
−
−
−
−
Recommended