Licensed to:

Power System Analysis and Design,
Fifth Edition
J. Duncan Glover, Mulukutla S. Sarma,
and Thomas J. Overbye
Publisher, Global Engineering:
Christopher M. Shortt
Acquisitions Editor: Swati Meherishi
Senior Developmental Editor: Hilda Gowans
Editorial Assistant: Tanya Altieri
Team Assistant: Carly Rizzo
Marketing Manager: Lauren Betsos
Media Editor: Chris Valentine
Content Project Manager: Jennifer Ziegler
Production Service: RPK Editorial Services
Copyeditor: Shelly Gerger-Knechtl
Proofreader: Becky Taylor
Indexer: Glyph International
Compositor: Glyph International
Senior Art Director: Michelle Kunkler
Internal Designer: Carmela Periera
Cover Designer: Andrew Adams
Cover Image: �c Josemaria
Toscano/Shutterstock; Irina
Korshunova/Shutterstock; Racheal
Grazias/Shutterstock; Vadim
Ponomarenko/Shutterstock
Senior Rights Acquisitions Specialists:
Mardell Glinski-Schultz and John Hill
Text and Image Permissions Researcher:
Kristiina Paul
First Print Buyer: Arethea L. Thomas
�c 2012, 2008 Cengage Learning
ALL RIGHTS RESERVED. No part of this work covered by the copyright
herein may be reproduced, transmitted, stored, or used in any form or
by any means graphic, electronic, or mechanical, including but not limited
to photocopying, recording, scanning, digitizing, taping, Web distribution,
information networks, or information storage and retrieval systems,
except as permitted under Section 107 or 108 of the 1976 United States
Copyright Act, without the prior written permission of the publisher.
Library of Congress Control Number: 2010941462
ISBN-13: 978-1-111-42577-7
ISBN-10: 1-111-42577-9
Cengage Learning
200 First Stamford Place, Suite 400
Stamford, CT 06902
USA
Cengage Learning is a leading provider of customized learning solutions
with office locations around the globe, including Singapore, the United
Kingdom, Australia, Mexico, Brazil, and Japan. Locate your local office at
international.cengage.com/region.
Cengage Learning products are represented in Canada by
Nelson Education, Ltd.
For your course and learning solutions, visit
www.cengage.com/engineering.
Purchase any of our products at your local college store or at our
preferred online store www.cengagebrain.com.
Printed in the United States of America
1 2 3 4 5 6 7 13 12 11 10
For product information and technology assistance, contact us atCengage Learning Customer & Sales Support, 1-800-354-9706.
For permission to use material from this text or product,submit all requests online at cengage.com/permissions.
Further permissions questions can be e-mailed [email protected].
((AutoPDF V7 10/12 12:05) Thomson-U (7.375x9.25") Tmath&GillSans J-1711 Glover AC3:(CKN)16/4/2007 pp. i–xvi 25795_00_fm_pi-xx (p. iv)
Copyright 2010 Cengage Learning. All Rights Reserved. May not be copied, scanned, or duplicated, in whole or in part. Due to electronic rights, some third party content may be suppressed from the eBook and/or eChapter(s).Editorial review has deemed that any suppressed content does not materially affect the overall learning experience. Cengage Learning reserves the right to remove additional content at any time if subsequent rights restrictions require it.
Licensed to:
1INTRODUCTION
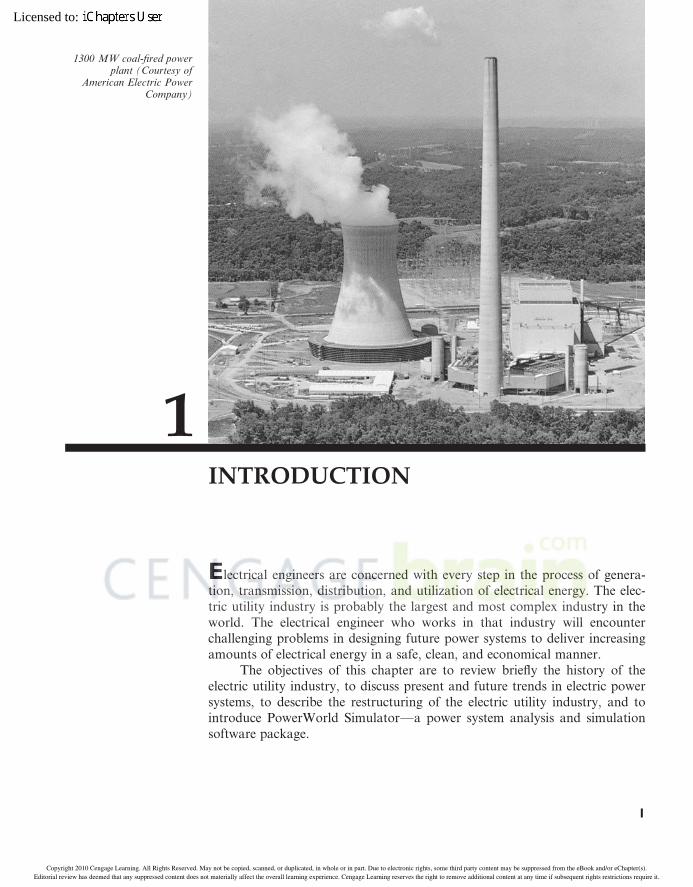
Electrical engineers are concerned with every step in the process of genera-tion, transmission, distribution, and utilization of electrical energy. The elec-tric utility industry is probably the largest and most complex industry in theworld. The electrical engineer who works in that industry will encounterchallenging problems in designing future power systems to deliver increasingamounts of electrical energy in a safe, clean, and economical manner.
The objectives of this chapter are to review briefly the history of theelectric utility industry, to discuss present and future trends in electric powersystems, to describe the restructuring of the electric utility industry, and tointroduce PowerWorld Simulator—a power system analysis and simulationsoftware package.
1
1300 MW coal-fired powerplant (Courtesy of
American Electric PowerCompany)
(AutoPDF V7 10/12 12:22) Thomson-U (7.375x9.25") Tmath&GillSans J-1711 Glover AC1:(CKN)3/4/2007 pp. 1–30 25795_01_ch01_p001-030 (p. 1)
Copyright 2010 Cengage Learning. All Rights Reserved. May not be copied, scanned, or duplicated, in whole or in part. Due to electronic rights, some third party content may be suppressed from the eBook and/or eChapter(s).Editorial review has deemed that any suppressed content does not materially affect the overall learning experience. Cengage Learning reserves the right to remove additional content at any time if subsequent rights restrictions require it.
Licensed to:
C A S E S T U DY The following article describes the restructuring of the electric utility industry that hasbeen taking place in the United States and the impacts on an aging transmissioninfrastructure. Independent power producers, increased competition in the generationsector, and open access for generators to the U.S. transmission system have changed theway the transmission system is utilized. The need for investment in new transmission andtransmission technologies, for further refinements in restructuring, and for training andeducation systems to replenish the workforce are discussed [8].
The Future Beckons: Will the ElectricPower Industry Heed the Call?
CHRISTOPHER E. ROOT
Over the last four decades, the U.S. electric power
industry has undergone unprecedented change. In
the 1960s, regulated utilities generated and deliv-
ered power within a localized service area. The
decade was marked by high load growth and mod-
est price stability. This stood in sharp contrast to
the wild increases in the price of fuel oil, focus on
energy conservation, and slow growth of the 1970s.
Utilities quickly put the brakes on generation ex-
pansion projects, switched to coal or other nonoil
fuel sources, and significantly cut back on the ex-
pansion of their networks as load growth slowed to
a crawl. During the 1980s, the economy in many
regions of the country began to rebound. The
1980s also brought the emergence of independent
power producers and the deregulation of the natu-
ral gas wholesale markets and pipelines. These de-
velopments resulted in a significant increase in nat-
ural gas transmission into the northeastern United
States and in the use of natural gas as the preferred
fuel for new generating plants.
During the last ten years, the industry in many
areas of the United States has seen increased com-
petition in the generation sector and a fundamental
shift in the role of the nation’s electric transmission
system, with the 1996 enactment of the Federal
Energy Regulatory Commission (FERC) Order No.
888, which mandated open access for generators to
the nation’s transmission system. And while prices
for distribution and transmission of electricity re-
mained regulated, unregulated energy commodity
markets have developed in several regions. FERC
has supported these changes with rulings leading
to the formation of independent system oper-
ators (ISOs) and regional transmission organ-
izations (RTOs) to administer the electricity mar-
kets in several regions of the United States,
including New England, New York, the Mid-Atlantic,
the Midwest, and California.
The transmission system originally was built to
deliver power from a utility’s generator across town
to its distribution company. Today, the transmission
system is being used to deliver power across states
or entire regions. As market forces increasingly
determine the location of generation sources, the
transmission grid is being asked to play an even
more important role in markets and the reliability
of the system. In areas where markets have been
restructured, customers have begun to see signifi-
cant benefits. But full delivery of restructuring’s
benefits is being impeded by an inadequate, under-
invested transmission system.
If the last 30 years are any indication, the struc-
ture of the industry and the increasing demands
placed on the nation’s transmission infrastructure
and the people who operate and manage it are
likely to continue unabated. In order to meet
the challenges of the future, to continue to maintain
the stable, reliable, and efficient system we have
known for more than a century and to support the
(‘‘The Future Beckons,’’ Christopher E. Root. > 2006 IEEE.
Reprinted, with permission, from Supplement to IEEE Power
& Energy (May/June 2006) pg. 58–65)
2 CHAPTER 1 INTRODUCTION
(AutoPDF V7 10/12 12:22) Thomson-U (7.375x9.25") Tmath&GillSans J-1711 Glover AC1:(CKN)3/4/2007 pp. 1–30 25795_01_ch01_p001-030 (p. 2)
Copyright 2010 Cengage Learning. All Rights Reserved. May not be copied, scanned, or duplicated, in whole or in part. Due to electronic rights, some third party content may be suppressed from the eBook and/or eChapter(s).Editorial review has deemed that any suppressed content does not materially affect the overall learning experience. Cengage Learning reserves the right to remove additional content at any time if subsequent rights restrictions require it.
Licensed to:
continued development of efficient competitive
markets, U.S. industry leaders must address three
significant issues:
. an aging transmission system suffering from
substantial underinvestment, which is exacer-
bated by an out-of-date industry structure. the need for a regulatory framework that will
spur independent investment, ownership, and
management of the nation’s grid. an aging workforce and the need for a suc-
cession plan to ensure the existence of the
next generation of technical expertise in the
industry.
ARE WE SPENDING ENOUGH?
In areas that have restructured power markets,
substantial benefits have been delivered to customers
in the form of lower prices, greater supplier choice,
and environmental benefits, largely due to the de-
velopment and operation of new, cleaner genera-
tion. There is, however, a growing recognition that
the delivery of the full value of restructuring to cus-
tomers has been stalled by an inadequate transmis-
sion system that was not designed for the new de-
mands being placed on it. In fact, investment in the
nation’s electricity infrastructure has been declining
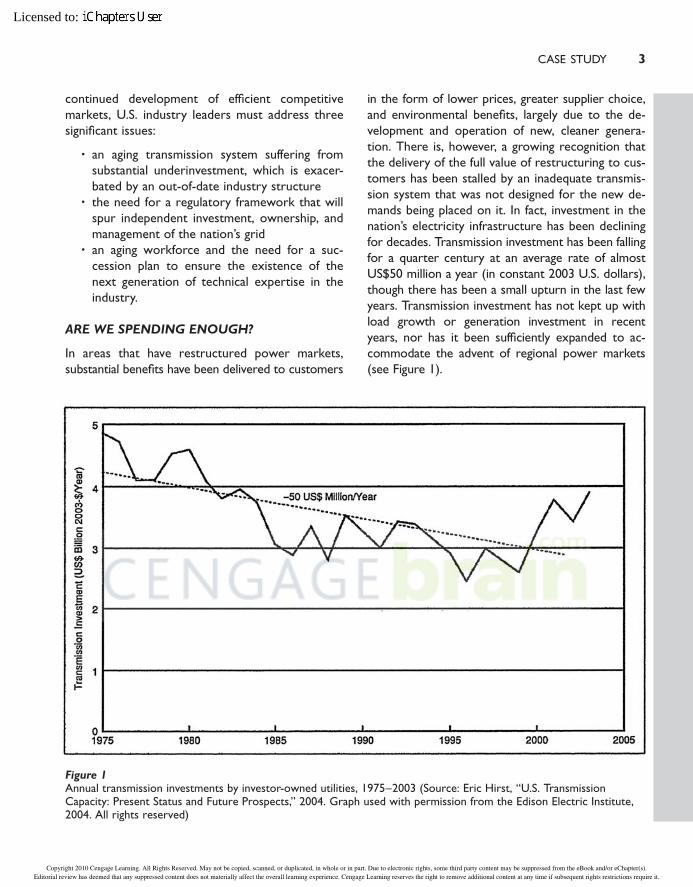
for decades. Transmission investment has been falling
for a quarter century at an average rate of almost
US$50 million a year (in constant 2003 U.S. dollars),
though there has been a small upturn in the last few
years. Transmission investment has not kept up with
load growth or generation investment in recent
years, nor has it been sufficiently expanded to ac-
commodate the advent of regional power markets
(see Figure 1).
CASE STUDY 3
Figure 1Annual transmission investments by investor-owned utilities, 1975–2003 (Source: Eric Hirst, ‘‘U.S. TransmissionCapacity: Present Status and Future Prospects,’’ 2004. Graph used with permission from the Edison Electric Institute,2004. All rights reserved)
(AutoPDF V7 10/12 12:22) Thomson-U (7.375x9.25") Tmath&GillSans J-1711 Glover AC1:(CKN)3/4/2007 pp. 1–30 25795_01_ch01_p001-030 (p. 3)
Copyright 2010 Cengage Learning. All Rights Reserved. May not be copied, scanned, or duplicated, in whole or in part. Due to electronic rights, some third party content may be suppressed from the eBook and/or eChapter(s).Editorial review has deemed that any suppressed content does not materially affect the overall learning experience. Cengage Learning reserves the right to remove additional content at any time if subsequent rights restrictions require it.
Licensed to:
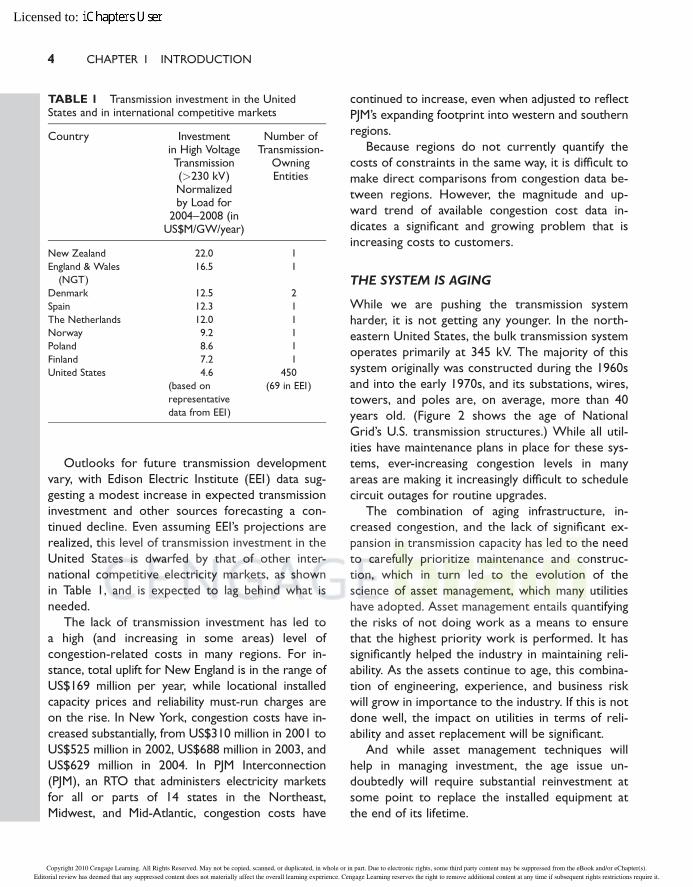
Outlooks for future transmission development
vary, with Edison Electric Institute (EEI) data sug-
gesting a modest increase in expected transmission
investment and other sources forecasting a con-
tinued decline. Even assuming EEI’s projections are
realized, this level of transmission investment in the
United States is dwarfed by that of other inter-
national competitive electricity markets, as shown
in Table 1, and is expected to lag behind what is
needed.
The lack of transmission investment has led to
a high (and increasing in some areas) level of
congestion-related costs in many regions. For in-
stance, total uplift for New England is in the range of
US$169 million per year, while locational installed
capacity prices and reliability must-run charges are
on the rise. In New York, congestion costs have in-
creased substantially, from US$310 million in 2001 to
US$525 million in 2002, US$688 million in 2003, and
US$629 million in 2004. In PJM Interconnection
(PJM), an RTO that administers electricity markets
for all or parts of 14 states in the Northeast,
Midwest, and Mid-Atlantic, congestion costs have
continued to increase, even when adjusted to reflect
PJM’s expanding footprint into western and southern
regions.
Because regions do not currently quantify the
costs of constraints in the same way, it is difficult to
make direct comparisons from congestion data be-
tween regions. However, the magnitude and up-
ward trend of available congestion cost data in-
dicates a significant and growing problem that is
increasing costs to customers.
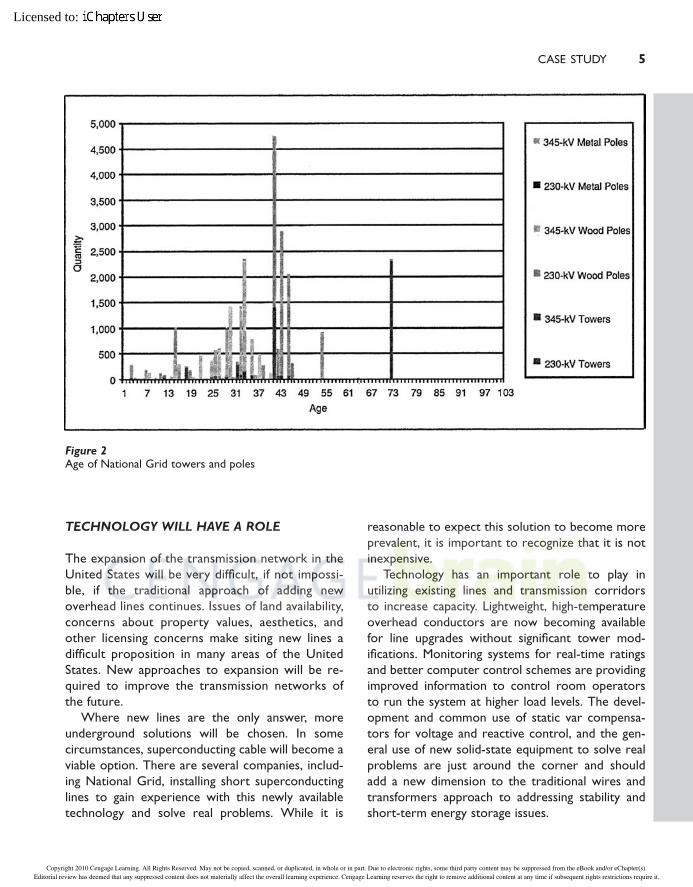
THE SYSTEM IS AGING
While we are pushing the transmission system
harder, it is not getting any younger. In the north-
eastern United States, the bulk transmission system
operates primarily at 345 kV. The majority of this
system originally was constructed during the 1960s
and into the early 1970s, and its substations, wires,
towers, and poles are, on average, more than 40
years old. (Figure 2 shows the age of National
Grid’s U.S. transmission structures.) While all util-
ities have maintenance plans in place for these sys-
tems, ever-increasing congestion levels in many
areas are making it increasingly difficult to schedule
circuit outages for routine upgrades.
The combination of aging infrastructure, in-
creased congestion, and the lack of significant ex-
pansion in transmission capacity has led to the need
to carefully prioritize maintenance and construc-
tion, which in turn led to the evolution of the
science of asset management, which many utilities
have adopted. Asset management entails quantifying
the risks of not doing work as a means to ensure
that the highest priority work is performed. It has
significantly helped the industry in maintaining reli-
ability. As the assets continue to age, this combina-
tion of engineering, experience, and business risk
will grow in importance to the industry. If this is not
done well, the impact on utilities in terms of reli-
ability and asset replacement will be significant.
And while asset management techniques will
help in managing investment, the age issue un-
doubtedly will require substantial reinvestment at
some point to replace the installed equipment at
the end of its lifetime.
4 CHAPTER 1 INTRODUCTION
TABLE 1 Transmission investment in the UnitedStates and in international competitive markets
Country Investmentin High VoltageTransmission(>230 kV)Normalizedby Load for
2004–2008 (inUS$M/GW/year)
Number ofTransmission-
OwningEntities
New Zealand 22.0 1
England & Wales
(NGT)
16.5 1
Denmark 12.5 2
Spain 12.3 1
The Netherlands 12.0 1
Norway 9.2 1
Poland 8.6 1
Finland 7.2 1
United States 4.6 450
(based on
representative
data from EEI)
(69 in EEI)
(AutoPDF V7 10/12 12:22) Thomson-U (7.375x9.25") Tmath&GillSans J-1711 Glover AC1:(CKN)3/4/2007 pp. 1–30 25795_01_ch01_p001-030 (p. 4)
Copyright 2010 Cengage Learning. All Rights Reserved. May not be copied, scanned, or duplicated, in whole or in part. Due to electronic rights, some third party content may be suppressed from the eBook and/or eChapter(s).Editorial review has deemed that any suppressed content does not materially affect the overall learning experience. Cengage Learning reserves the right to remove additional content at any time if subsequent rights restrictions require it.
Licensed to:
TECHNOLOGY WILL HAVE A ROLE
The expansion of the transmission network in the
United States will be very difficult, if not impossi-
ble, if the traditional approach of adding new
overhead lines continues. Issues of land availability,
concerns about property values, aesthetics, and
other licensing concerns make siting new lines a
difficult proposition in many areas of the United
States. New approaches to expansion will be re-
quired to improve the transmission networks of
the future.
Where new lines are the only answer, more
underground solutions will be chosen. In some
circumstances, superconducting cable will become a
viable option. There are several companies, includ-
ing National Grid, installing short superconducting
lines to gain experience with this newly available
technology and solve real problems. While it is
reasonable to expect this solution to become more
prevalent, it is important to recognize that it is not
inexpensive.
Technology has an important role to play in
utilizing existing lines and transmission corridors
to increase capacity. Lightweight, high-temperature
overhead conductors are now becoming available
for line upgrades without significant tower mod-
ifications. Monitoring systems for real-time ratings
and better computer control schemes are providing
improved information to control room operators
to run the system at higher load levels. The devel-
opment and common use of static var compensa-
tors for voltage and reactive control, and the gen-
eral use of new solid-state equipment to solve real
problems are just around the corner and should
add a new dimension to the traditional wires and
transformers approach to addressing stability and
short-term energy storage issues.
CASE STUDY 5
Figure 2Age of National Grid towers and poles
(AutoPDF V7 10/12 12:22) Thomson-U (7.375x9.25") Tmath&GillSans J-1711 Glover AC1:(CKN)3/4/2007 pp. 1–30 25795_01_ch01_p001-030 (p. 5)
Copyright 2010 Cengage Learning. All Rights Reserved. May not be copied, scanned, or duplicated, in whole or in part. Due to electronic rights, some third party content may be suppressed from the eBook and/or eChapter(s).Editorial review has deemed that any suppressed content does not materially affect the overall learning experience. Cengage Learning reserves the right to remove additional content at any time if subsequent rights restrictions require it.
Licensed to:
These are just a few examples of some of the ex-
citing new technologies that will be tools for the fu-
ture. It is encouraging that the development of new
and innovative solutions to existing problems con-
tinues. In the future, innovation must take a leading
role in developing solutions to transmission prob-
lems, and it will be important for the regulators to
encourage the use of new techniques and tech-
nologies. Most of these new technologies have
a higher cost than traditional solutions, which will
place increasing pressure on capital investment. It will
be important to ensure that appropriate cost recov-
ery mechanisms are developed to address this issue.
INDUSTRY STRUCTURE
Another factor contributing to underinvestment
in the transmission system is the tremendous frag-
mentation that exists in the U.S. electricity industry.
There are literally hundreds of entities that own
and operate transmission. The United States has
more than 100 separate control areas and more
than 50 regulators that oversee the nation’s grid.
The patchwork of ownership and operation lies in
stark contrast to the interregional delivery de-
mands that are being placed on the nation’s trans-
mission infrastructure.
Federal policymakers continue to encourage
transmission owners across the nation to
join RTOs. Indeed, RTO/ISO formation was in-
tended to occupy a central role in carrying forward
FERC’s vision of restructuring, and an extraordinary
amount of effort has been expended in making this
model work. While RTOs/ISOs take a step toward
an independent, coordinated transmission system, it
remains unclear whether they are the best long-
term solution to deliver efficient transmission sys-
tem operation while ensuring reliability and deliver-
ing value to customers.
Broad regional markets require policies that fa-
cilitate and encourage active grid planning, manage-
ment, and the construction of transmission up-
grades both for reliability and economic needs. A
strong transmission infrastructure or network plat-
form would allow greater fuel diversity, more stable
and competitive energy prices, and the relaxation
(and perhaps ultimate removal) of administrative
mechanisms to mitigate market power. This would
also allow for common asset management ap-
proaches to the transmission system. The creation
of independent transmission companies (ITCs), i.e.,
companies that focus on the investment in and op-
eration of transmission independent of generation
interests, would be a key institutional step toward
an industry structure that appropriately views
transmission as a facilitator of robust competitive
electricity markets. ITCs recognize transmission as
an enabler of competitive electricity markets. Poli-
cies that provide a more prominent role for such
companies would align the interests of transmission
owners/operators with those of customers, permit-
ting the development of well-designed and enduring
power markets that perform the function of any
market, namely, to drive the efficient allocation of
resources for the benefit of customers. In its policy
statement released in June 2005, FERC reiterated its
commitment to ITC formation to support improving
the performance and efficiency of the grid.
Having no interest in financial outcomes within
a power market, the ITC’s goal is to deliver maxi-
mum value to customers through transmission
operation and investment. With appropriate in-
centives, ITCs will pursue opportunities to leverage
relatively small expenditures on transmission con-
struction and management to create a healthy mar-
ket and provide larger savings in the supply portion
of customer’s bills. They also offer benefits over
nonprofit RTO/ISO models, where the incentives
for efficient operation and investment may be less
focused.
An ideal industry structure would permit ITCs
to own, operate, and manage transmission assets
over a wide area. This would allow ITCs to access
economies of scale in asset investment, planning, and
operations to increase throughout and enhance reli-
ability in the most cost-effective manner. This struc-
ture would also avoid ownership fragmentation
within a single market, which is a key obstacle to
the introduction of performance-based rates that
benefit customers by aligning the interests of trans-
mission companies and customers in reducing con-
gestion. This approach to ‘‘horizontal integration’’ of
6 CHAPTER 1 INTRODUCTION
(AutoPDF V7 10/12 12:22) Thomson-U (7.375x9.25") Tmath&GillSans J-1711 Glover AC1:(CKN)3/4/2007 pp. 1–30 25795_01_ch01_p001-030 (p. 6)
Copyright 2010 Cengage Learning. All Rights Reserved. May not be copied, scanned, or duplicated, in whole or in part. Due to electronic rights, some third party content may be suppressed from the eBook and/or eChapter(s).Editorial review has deemed that any suppressed content does not materially affect the overall learning experience. Cengage Learning reserves the right to remove additional content at any time if subsequent rights restrictions require it.
Licensed to:
the transmission sector under a single regulated
for-profit entity is key to establishing an industry
structure that recognizes the transmission system
as a market enabler and provider of infrastructure
to support effective competitive markets. Market
administration would be contracted out to another
(potentially nonprofit) entity while generators, other
suppliers, demand response providers, and load
serving entities (LSEs) would all compete and in-
novate in fully functioning markets, delivering still-
increased efficiency and more choices for customers.
REGULATORY ISSUES
The industry clearly shoulders much of the respon-
sibility for determining its own future and for taking
the steps necessary to ensure the robustness of the
nation’s transmission system. However, the industry
also operates within an environment governed by
substantial regulatory controls. Therefore, policy-
makers also will have a significant role in helping
to remove the obstacles to the delivery of the full
benefits of industry restructuring to customers. In
order to ensure adequate transmission investment
and the expansion of the system as appropriate, the
following policy issues must be addressed:
. Regional planning: Because the transmission sys-
tem is an integrated network, planning for sys-
tem needs should occur on a regional basis.
Regional planning recognizes that transmission
investment and the benefits transmission can
deliver to customers are regional in nature
rather than bounded by state or service area
lines. Meaningful regional planning processes
also take into account the fact that transmission
provides both reliability and economic benefits.
Comprehensive planning processes provide for
mechanisms to pursue regulated transmission
solutions for reliability and economic needs in
the event that the market fails to respond or is
identified as unlikely to respond to these needs
in a timely manner. In areas where regional
system planning processes have been im-
plemented, such as New England and PJM,
progress is being made towards identifying and
building transmission projects that will address
regional needs and do so in a way that is cost
effective for customers.. Cost recovery and allocation: Comprehensive re-
gional planning processes that identify needed
transmission projects must be accompanied by
cost recovery and allocation mechanisms that
recognize the broad benefits of transmission
and its role in supporting and enabling regional
electricity markets. Mechanisms that allocate
the costs of transmission investment broadly
view transmission as the regional market en-
abler it is and should be, provide greater cer-
tainty and reduce delays in cost recovery, and,
thus, remove obstacles to provide further
incentives for the owners and operators of
transmission to make such investment.. Certainty of rate recovery and state cooperation: It
is critical that transmission owners are assured
certain and adequate rate recovery under a
regional planning process. Independent admin-
istration of the planning processes will assure
that transmission enhancements required for
reliability and market efficiency do not unduly
burden retail customers with additional costs.
FERC and the states must work together to
provide for certainty in rate recovery from
ultimate customers through federal and state
jurisdictional rates.. Incentives to encourage transmission investment,
independence, and consolidation: At a time when
a significant increase in transmission investment
is needed to ensure reliability, produce an ade-
quate platform for competitive power markets
and regional electricity commerce, and to pro-
mote fuel diversity and renewable sources of
supply, incentives not only for investment but
also for independence and consolidation of
transmission are needed and warranted. In-
centives should be designed to promote trans-
mission organizations that acknowledge the
benefits to customers of varying degrees of
transmission independence and reward that in-
dependence accordingly. These incentives may
take the form of enhanced rates of return or
other financial incentives for assets managed,
operated, and/or owned by an ITC.
CASE STUDY 7
(AutoPDF V7 10/12 12:22) Thomson-U (7.375x9.25") Tmath&GillSans J-1711 Glover AC1:(CKN)3/4/2007 pp. 1–30 25795_01_ch01_p001-030 (p. 7)
Copyright 2010 Cengage Learning. All Rights Reserved. May not be copied, scanned, or duplicated, in whole or in part. Due to electronic rights, some third party content may be suppressed from the eBook and/or eChapter(s).Editorial review has deemed that any suppressed content does not materially affect the overall learning experience. Cengage Learning reserves the right to remove additional content at any time if subsequent rights restrictions require it.
Licensed to:
The debate about transmission regulation will
continue. Ultimately, having the correct mixture of
incentives and reliability standards will be a critical
factor that will determine whether or not the na-
tion’s grid can successfully tie markets together and
improve the overall reliability of the bulk transmis-
sion system in the United States. The future trans-
mission system must be able to meet the needs of
customers reliably and support competitive markets
that provide them with electricity efficiently. Failure
to invest in the transmission system now will mean
an increased likelihood of reduced reliability and
higher costs to customers in the future.
WORKFORCE OF THE FUTURE
Clearly, the nation’s transmission system will need
considerable investment and physical work due to
age, growth of the use of electricity, changing mar-
kets, and how the networks are used. As previously
noted, this will lead to a required significant in-
crease in capital spending. But another critical re-
source is beginning to become a concern to many in
the industry, specifically the continued availability of
qualified power system engineers.
Utility executives polled by the Electric Power
Research Institute in 2003 estimated that 50% of
the technical workforce will reach retirement in the
next 5–10 years. This puts the average age near 50,
with many utilities still hiring just a few college
graduates each year. Looking a few years ahead, at
the same time when a significant number of power
engineers will be considering retirement, the need
for them will be significantly increasing. The supply
of power engineers will have to be great enough to
replace the large numbers of those retiring in addi-
tion to the number required to respond to the an-
ticipated increase in transmission capital spending.
Today, the number of universities offering power
engineering programs has decreased. Some uni-
versities, such as Rensselaer Polytechnic Institute,
no longer have separate power system engineering
departments. According to the IEEE, the number of
power system engineering graduates has dropped
from approximately 2,000 per year in the 1980s
to 500 today. Overall, the number of engineering
graduates has dropped 50% in the last 15 years.
Turning this situation around will require a long-
term effort by many groups working together,
including utilities, consultants, manufacturers, uni-
versities, and groups such as the IEEE Power En-
gineering Society (PES).
Part of the challenge is that utilities are compet-
ing for engineering students against other in-
dustries, such as telecommunications or computer
software development, that are perceived as being
more glamorous or more hip than the power in-
dustry and have no problem attracting large num-
bers of new engineers.
For the most part, the power industry has not
done a great job of selling itself. Too often, headlines
focus on negatives such as rate increases, power
outages, and community relations issues related to a
proposed new generation plant or transmission line.
To a large extent, the industry also has become a
victim of its own success by delivering electricity so
reliably that the public generally takes it for granted,
which makes the good news more difficult to tell. It
is incumbent upon the industry to take a much more
proactive role in helping its public—including tal-
ented engineering students—understand the ded-
ication, commitment, ingenuity, and innovation that is
required to keep the nation’s electricity system
humming. PES can play an important role in this.
On a related note, as the industry continues to
develop new, innovative technologies, they should
be documented and showcased to help generate
excitement about the industry among college-age
engineers and help attract them to power system
engineering.
The utilities, consultants, and manufacturers must
strengthen their relationships with strong technical
institutions to continue increasing support for elec-
trical engineering departments to offer power sys-
tems classes at the undergraduate level. In some
cases, this may even require underwriting a class.
Experience at National Grid has shown that when
support for a class is guaranteed, the number of
students who sign up typically is greater than ex-
pected. The industry needs to further support these
8 CHAPTER 1 INTRODUCTION
(AutoPDF V7 10/12 12:22) Thomson-U (7.375x9.25") Tmath&GillSans J-1711 Glover AC1:(CKN)3/4/2007 pp. 1–30 25795_01_ch01_p001-030 (p. 8)
Copyright 2010 Cengage Learning. All Rights Reserved. May not be copied, scanned, or duplicated, in whole or in part. Due to electronic rights, some third party content may be suppressed from the eBook and/or eChapter(s).Editorial review has deemed that any suppressed content does not materially affect the overall learning experience. Cengage Learning reserves the right to remove additional content at any time if subsequent rights restrictions require it.
Licensed to:
efforts by offering presentations to students on the
complexity of the power system, real problems that
need to be solved, and the impact that a reliable,
cost-efficient power system has on society. Sponsor-
ing more student internships and research projects
will introduce additional students and faculty to the
unique challenges of the industry. In the future, the
industry will have to hire more nonpower engineers
and train them in the specifics of power system en-
gineering or rely on hiring from overseas.
Finally, the industry needs to cultivate relation-
ships with universities to assist in developing pro-
fessors who are knowledgeable about the industry.
This can take the form of research work, consult-
ing, and teaching custom programs for the industry.
National Grid has developed relationships with
several northeastern U.S. institutions that are of-
fering courses for graduate engineers who may not
have power backgrounds. The courses can be of-
fered online, at the university, or on site at the utility.
This problem will only get worse if industry
leaders do not work together to resolve it. The in-
dustry’s future depends on its ability to anticipate
what lies ahead and the development of the neces-
sary human resources to meet the challenges.
CONCLUSIONS
The electric transmission system plays a critical role
in the lives of the people of the United States. It is
an ever-changing system both in physical terms and
how it is operated and regulated. These changes
must be recognized and actions developed accord-
ingly. Since the industry is made up of many orga-
nizations that share the system, it can be difficult to
agree on action plans.
There are a few points on which all can agree.
The first is that the transmission assets continue to
get older and investment is not keeping up with
needs when looking over a future horizon. The is-
sue will only get worse as more lines and sub-
stations exceed the 50-year age mark. Technology
development and application undoubtedly will in-
crease as engineers look for new and creative ways
to combat the congestion issues and increased
electrical demand—and new overhead transmission
lines will be only one of the solutions considered.
The second is that it will be important for fur-
ther refinement in the restructuring of the industry
to occur. The changes made since the late 1990s
have delivered benefits to customers in the North-
east in the form of lower energy costs and access
to greater competitive electric markets. Regulators
and policymakers should recognize that in-
dependently owned, operated, managed, and widely
planned networks are important to solving future
problems most efficiently. Having a reliable, re-
gional, uncongested transmission system will enable
a healthy competitive marketplace.
The last, but certainly not least, concern is with
the industry’s future workforce. Over the last year,
there has been significant discussion of the issue,
but it will take a considerable effort by many to
guide the future workforce into a position of ap-
preciating the electricity industry and desiring to
enter it and to ensure that the training and educa-
tion systems are in place to develop the new en-
gineers who will be required to upgrade and main-
tain the electric power system.
The industry has many challenges, but it also has
great resources and a good reputation. Through the
efforts of many and by working together through
organizations such as PES, the industry can move
forward to the benefit of the public and the United
States as a whole.
ACKNOWLEDGMENTS
The following National Grid staff members con-
tributed to this article: Jackie Barry, manager,
transmission communications; Janet Gail Besser,
vice president, regulatory affairs, U.S. Transmission;
Mary Ellen Paravalos, director, regulatory policy,
U.S. Transmission; Joseph Rossignoli, principal ana-
lyst, regulatory policy, U.S. Transmission.
FOR FURTHER READING
National Grid, ‘‘Transmission: The critical link. De-
livering the promise of industry restructuring to
CASE STUDY 9
(AutoPDF V7 10/12 12:22) Thomson-U (7.375x9.25") Tmath&GillSans J-1711 Glover AC1:(CKN)3/4/2007 pp. 1–30 25795_01_ch01_p001-030 (p. 9)
Copyright 2010 Cengage Learning. All Rights Reserved. May not be copied, scanned, or duplicated, in whole or in part. Due to electronic rights, some third party content may be suppressed from the eBook and/or eChapter(s).Editorial review has deemed that any suppressed content does not materially affect the overall learning experience. Cengage Learning reserves the right to remove additional content at any time if subsequent rights restrictions require it.
Licensed to:
customers,’’ June 2005 [Online]. Available: http://
www.nationalgridus.com/transmission_the_critical_
link/
E. Hirst, ‘‘U.S. transmission capacity: Present
status and future prospects,’’ Edison Electric Inst.
and U.S. Dept. Energy, Aug. 2004.
Consumer Energy Council of America, ‘‘Keep-
ing the power flowing: Ensuring a strong trans-
mission system to support consumer needs for
cost-effectiveness, security and reliability,’’ Jan. 2005
[Online]. Available: http://www.cecarf.org
‘‘Electricity sector framework for the future,’’
Electric Power Res. Inst., Aug. 2003.
J. R. Borland, ‘‘A shortage of talent,’’ Transmission
Distribution World, Sep. 1, 2002.
BIOGRAPHY
Christopher E. Root is senior vice president of
Transmission and Distribution (T&D) Technical Ser-
vices of National Grid’s U.S. business. He oversees
the T&D technical services organization in New
England and New York. He received a B.S. in elec-
trical engineering from Northeastern University,
Massachusetts, and a master’s in engineering from
Rensselaer Polytechnic Institute, New York. In
1997, he completed the Program for Management
Development from the Harvard University Gradu-
ate School of Business. He is a registered Profes-
sional Engineer in the states of Massachusetts and
Rhode Island and is a Senior Member of the IEEE.
1.1
HISTORY OF ELECTRIC POWER SYSTEMS
In 1878, Thomas A. Edison began work on the electric light and formulatedthe concept of a centrally located power station with distributed lightingserving a surrounding area. He perfected his light by October 1879, and theopening of his historic Pearl Street Station in New York City on September4, 1882, marked the beginning of the electric utility industry (see Figure 1.1).At Pearl Street, dc generators, then called dynamos, were driven by steamengines to supply an initial load of 30 kW for 110-V incandescent lighting to59 customers in a one-square-mile area. From this beginning in 1882 through1972, the electric utility industry grew at a remarkable pace—a growth basedon continuous reductions in the price of electricity due primarily to techno-logical acomplishment and creative engineering.
The introduction of the practical dc motor by Sprague Electric, aswell as the growth of incandescent lighting, promoted the expansion ofEdison’s dc systems. The development of three-wire 220-V dc systems al-lowed load to increase somewhat, but as transmission distances and loadscontinued to increase, voltage problems were encountered. These limi-tations of maximum distance and load were overcome in 1885 by WilliamStanley’s development of a commercially practical transformer. Stanleyinstalled an ac distribution system in Great Barrington, Massachusetts, tosupply 150 lamps. With the transformer, the ability to transmit power athigh voltage with corresponding lower current and lower line-voltagedrops made ac more attractive than dc. The first single-phase ac line inthe United States operated in 1889 in Oregon, between Oregon City andPortland—21 km at 4 kV.
(AutoPDF V7 10/12 12:22) Thomson-U (7.375x9.25") Tmath&GillSans J-1711 Glover AC1:(CKN)3/4/2007 pp. 1–30 25795_01_ch01_p001-030 (p. 10)
10 CHAPTER 1 INTRODUCTION
Copyright 2010 Cengage Learning. All Rights Reserved. May not be copied, scanned, or duplicated, in whole or in part. Due to electronic rights, some third party content may be suppressed from the eBook and/or eChapter(s).Editorial review has deemed that any suppressed content does not materially affect the overall learning experience. Cengage Learning reserves the right to remove additional content at any time if subsequent rights restrictions require it.
Licensed to:
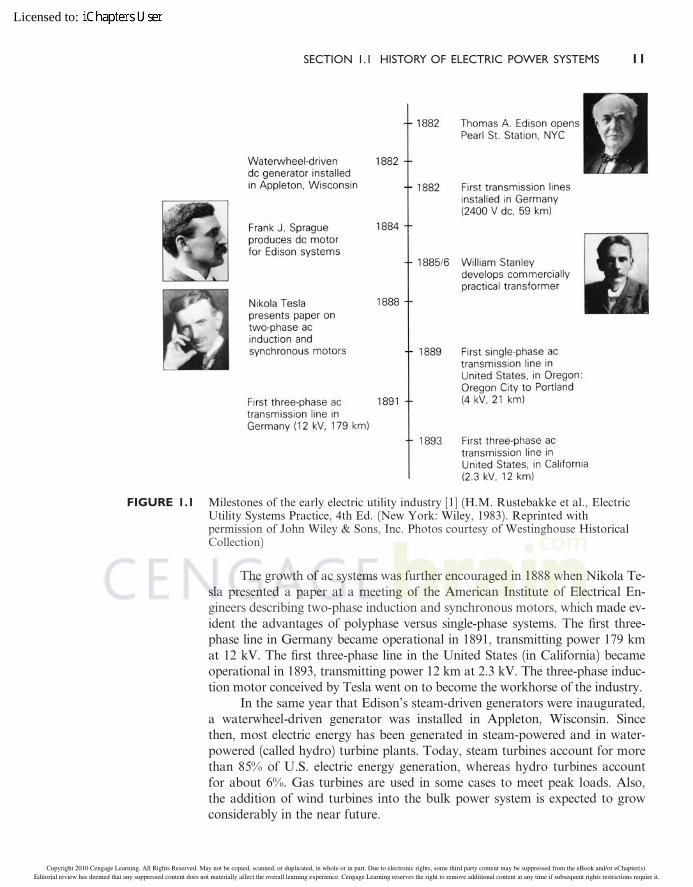
The growth of ac systems was further encouraged in 1888 when Nikola Te-sla presented a paper at a meeting of the American Institute of Electrical En-gineers describing two-phase induction and synchronous motors, which made ev-ident the advantages of polyphase versus single-phase systems. The first three-phase line in Germany became operational in 1891, transmitting power 179 kmat 12 kV. The first three-phase line in the United States (in California) becameoperational in 1893, transmitting power 12 km at 2.3 kV. The three-phase induc-tion motor conceived by Tesla went on to become the workhorse of the industry.
In the same year that Edison’s steam-driven generators were inaugurated,a waterwheel-driven generator was installed in Appleton, Wisconsin. Sincethen, most electric energy has been generated in steam-powered and in water-powered (called hydro) turbine plants. Today, steam turbines account for morethan 85% of U.S. electric energy generation, whereas hydro turbines accountfor about 6%. Gas turbines are used in some cases to meet peak loads. Also,the addition of wind turbines into the bulk power system is expected to growconsiderably in the near future.
FIGURE 1.1 Milestones of the early electric utility industry [1] (H.M. Rustebakke et al., ElectricUtility Systems Practice, 4th Ed. (New York: Wiley, 1983). Reprinted withpermission of John Wiley & Sons, Inc. Photos courtesy of Westinghouse HistoricalCollection)
(AutoPDF V7 10/12 12:22) Thomson-U (7.375x9.25") Tmath&GillSans J-1711 Glover AC1:(CKN)3/4/2007 pp. 1–30 25795_01_ch01_p001-030 (p. 11)
SECTION 1.1 HISTORY OF ELECTRIC POWER SYSTEMS 11
Copyright 2010 Cengage Learning. All Rights Reserved. May not be copied, scanned, or duplicated, in whole or in part. Due to electronic rights, some third party content may be suppressed from the eBook and/or eChapter(s).Editorial review has deemed that any suppressed content does not materially affect the overall learning experience. Cengage Learning reserves the right to remove additional content at any time if subsequent rights restrictions require it.
Licensed to:

Steam plants are fueled primarily by coal, gas, oil, and uranium. Ofthese, coal is the most widely used fuel in the United States due to its abun-dance in the country. Although many of these coal-fueled power plants wereconverted to oil during the early 1970s, that trend has been reversed back tocoal since the 1973–74 oil embargo, which caused an oil shortage and createda national desire to reduce dependency on foreign oil. In 2008, approximately48% of electricity in the United States was generated from coal [2].
In 1957, nuclear units with 90-MW steam-turbine capacity, fueledby uranium, were installed, and today nuclear units with 1312-MW steam-turbine capacity are in service. In 2008, approximately 20% of electricity inthe United States was generated from uranium from 104 nuclear powerplants. However, the growth of nuclear capacity in the United States hasbeen halted by rising construction costs, licensing delays, and public opinion.Although there are no emissions associated with nuclear power generation,there are safety issues and environmental issues, such as the disposal of usednuclear fuel and the impact of heated cooling-tower water on aquatic hab-itats. Future technologies for nuclear power are concentrated on safety andenvironmental issues [2, 3].
Starting in the 1990s, the choice of fuel for new power plants in theUnited States has been natural gas due to its availability and low cost as wellas the higher e‰ciency, lower emissions, shorter construction-lead times,safety, and lack of controversy associated with power plants that use naturalgas. Natural gas is used to generate electricity by the following processes:(1) gas combustion turbines use natural gas directly to fire the turbine;(2) steam turbines burn natural gas to create steam in a boiler, which is thenrun through the steam turbine; (3) combined cycle units use a gas combustionturbine by burning natural gas, and the hot exhaust gases from the combus-tion turbine are used to boil water that operates a steam turbine; and (4) fuelcells powered by natural gas generate electricity using electrochemical re-actions by passing streams of natural gas and oxidants over electrodes thatare separated by an electrolyte. In 2008, approximately 21% of electricity inthe United States was generated from natural gas [2, 3].
In 2008, in the United States, approximately 9% of electricity was gen-erated by renewable sources and 1% by oil [2, 3]. Renewable sources includeconventional hydroelectric (water power), geothermal, wood, wood waste, allmunicipal waste, landfill gas, other biomass, solar, and wind power. Renew-able sources of energy cannot be ignored, but they are not expected to supplya large percentage of the world’s future energy needs. On the other hand, nu-clear fusion energy just may. Substantial research e¤orts have shown nuclearfusion energy to be a promising technology for producing safe, pollution-free,and economical electric energy later in the 21st century and beyond. The fuelconsumed in a nuclear fusion reaction is deuterium, of which a virtually in-exhaustible supply is present in seawater.
The early ac systems operated at various frequencies including 25, 50,60, and 133 Hz. In 1891, it was proposed that 60 Hz be the standard fre-quency in the United States. In 1893, 25-Hz systems were introduced with the
(AutoPDF V7 10/12 12:22) Thomson-U (7.375x9.25") Tmath&GillSans J-1711 Glover AC1:(CKN)3/4/2007 pp. 1–30 25795_01_ch01_p001-030 (p. 12)
12 CHAPTER 1 INTRODUCTION
Copyright 2010 Cengage Learning. All Rights Reserved. May not be copied, scanned, or duplicated, in whole or in part. Due to electronic rights, some third party content may be suppressed from the eBook and/or eChapter(s).Editorial review has deemed that any suppressed content does not materially affect the overall learning experience. Cengage Learning reserves the right to remove additional content at any time if subsequent rights restrictions require it.
Licensed to:
synchronous converter. However, these systems were used primarily for rail-road electrification (and many are now retired) because they had the dis-advantage of causing incandescent lights to flicker. In California, the LosAngeles Department of Power and Water operated at 50 Hz, but convertedto 60 Hz when power from the Hoover Dam became operational in 1937. In1949, Southern California Edison also converted from 50 to 60 Hz. Today,the two standard frequencies for generation, transmission, and distribution ofelectric power in the world are 60 Hz (in the United States, Canada, Japan,Brazil) and 50 Hz (in Europe, the former Soviet republics, South Americaexcept Brazil, and India). The advantage of 60-Hz systems is that generators,motors, and transformers in these systems are generally smaller than 50-Hzequipment with the same ratings. The advantage of 50-Hz systems is thattransmission lines and transformers have smaller reactances at 50 Hz than at60 Hz.
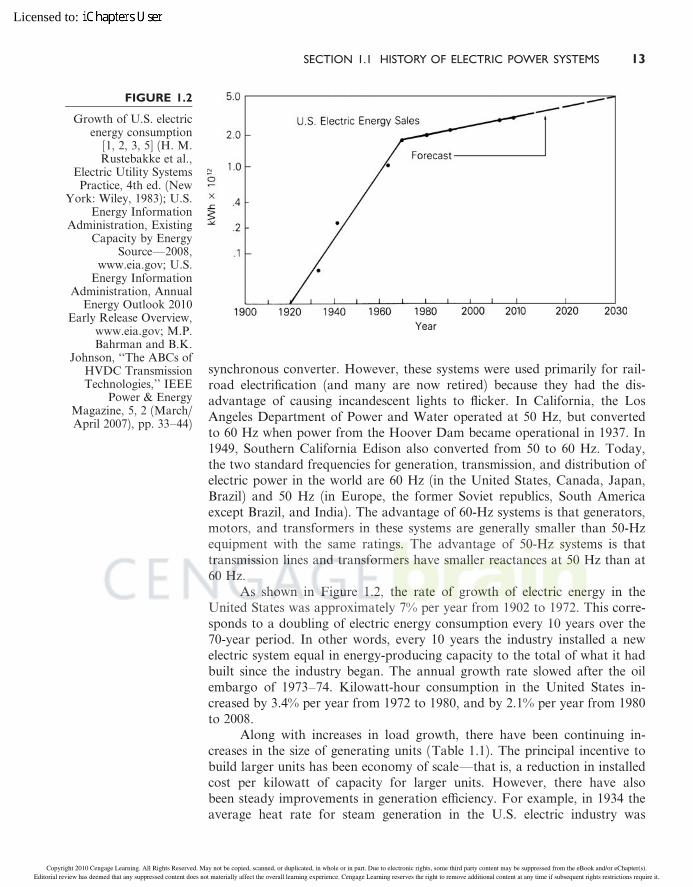
As shown in Figure 1.2, the rate of growth of electric energy in theUnited States was approximately 7% per year from 1902 to 1972. This corre-sponds to a doubling of electric energy consumption every 10 years over the70-year period. In other words, every 10 years the industry installed a newelectric system equal in energy-producing capacity to the total of what it hadbuilt since the industry began. The annual growth rate slowed after the oilembargo of 1973–74. Kilowatt-hour consumption in the United States in-creased by 3.4% per year from 1972 to 1980, and by 2.1% per year from 1980to 2008.
Along with increases in load growth, there have been continuing in-creases in the size of generating units (Table 1.1). The principal incentive tobuild larger units has been economy of scale—that is, a reduction in installedcost per kilowatt of capacity for larger units. However, there have alsobeen steady improvements in generation e‰ciency. For example, in 1934 theaverage heat rate for steam generation in the U.S. electric industry was
FIGURE 1.2
Growth of U.S. electricenergy consumption
[1, 2, 3, 5] (H. M.Rustebakke et al.,
Electric Utility SystemsPractice, 4th ed. (New
York: Wiley, 1983); U.S.Energy Information
Administration, ExistingCapacity by Energy
Source—2008,www.eia.gov; U.S.
Energy InformationAdministration, Annual
Energy Outlook 2010Early Release Overview,
www.eia.gov; M.P.Bahrman and B.K.
Johnson, ‘‘The ABCs ofHVDC TransmissionTechnologies,’’ IEEE
Power & EnergyMagazine, 5, 2 (March/April 2007), pp. 33–44)
(AutoPDF V7 10/12 12:22) Thomson-U (7.375x9.25") Tmath&GillSans J-1711 Glover AC1:(CKN)3/4/2007 pp. 1–30 25795_01_ch01_p001-030 (p. 13)
SECTION 1.1 HISTORY OF ELECTRIC POWER SYSTEMS 13
Copyright 2010 Cengage Learning. All Rights Reserved. May not be copied, scanned, or duplicated, in whole or in part. Due to electronic rights, some third party content may be suppressed from the eBook and/or eChapter(s).Editorial review has deemed that any suppressed content does not materially affect the overall learning experience. Cengage Learning reserves the right to remove additional content at any time if subsequent rights restrictions require it.
Licensed to:
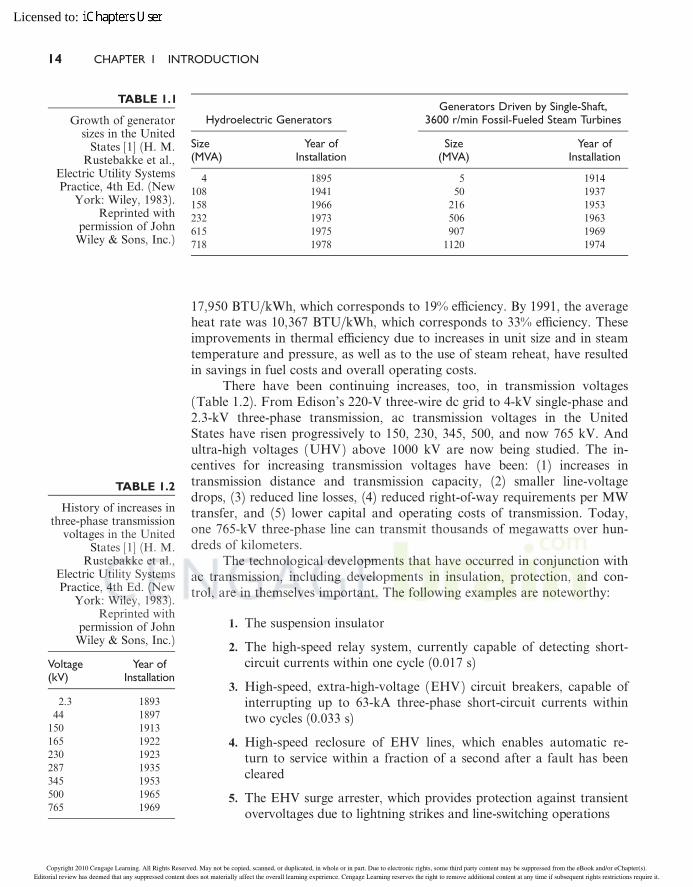
17,950 BTU/kWh, which corresponds to 19% e‰ciency. By 1991, the averageheat rate was 10,367 BTU/kWh, which corresponds to 33% e‰ciency. Theseimprovements in thermal e‰ciency due to increases in unit size and in steamtemperature and pressure, as well as to the use of steam reheat, have resultedin savings in fuel costs and overall operating costs.
There have been continuing increases, too, in transmission voltages(Table 1.2). From Edison’s 220-V three-wire dc grid to 4-kV single-phase and2.3-kV three-phase transmission, ac transmission voltages in the UnitedStates have risen progressively to 150, 230, 345, 500, and now 765 kV. Andultra-high voltages (UHV) above 1000 kV are now being studied. The in-centives for increasing transmission voltages have been: (1) increases intransmission distance and transmission capacity, (2) smaller line-voltagedrops, (3) reduced line losses, (4) reduced right-of-way requirements per MWtransfer, and (5) lower capital and operating costs of transmission. Today,one 765-kV three-phase line can transmit thousands of megawatts over hun-dreds of kilometers.
The technological developments that have occurred in conjunction withac transmission, including developments in insulation, protection, and con-trol, are in themselves important. The following examples are noteworthy:
1. The suspension insulator
2. The high-speed relay system, currently capable of detecting short-circuit currents within one cycle (0.017 s)
3. High-speed, extra-high-voltage (EHV) circuit breakers, capable ofinterrupting up to 63-kA three-phase short-circuit currents withintwo cycles (0.033 s)
4. High-speed reclosure of EHV lines, which enables automatic re-turn to service within a fraction of a second after a fault has beencleared
5. The EHV surge arrester, which provides protection against transientovervoltages due to lightning strikes and line-switching operations
TABLE 1.2
History of increases inthree-phase transmission
voltages in the UnitedStates [1] (H. M.
Rustebakke et al.,Electric Utility SystemsPractice, 4th Ed. (New
York: Wiley, 1983).Reprinted with
permission of JohnWiley & Sons, Inc.)
Voltage(kV)
Year ofInstallation
2.3 1893
44 1897
150 1913
165 1922
230 1923
287 1935
345 1953
500 1965
765 1969
TABLE 1.1
Growth of generatorsizes in the United
States [1] (H. M.Rustebakke et al.,
Electric Utility SystemsPractice, 4th Ed. (New
York: Wiley, 1983).Reprinted with
permission of JohnWiley & Sons, Inc.)
Hydroelectric GeneratorsGenerators Driven by Single-Shaft,
3600 r/min Fossil-Fueled Steam Turbines
Size(MVA)
Year ofInstallation
Size(MVA)
Year ofInstallation
4 1895 5 1914
108 1941 50 1937
158 1966 216 1953
232 1973 506 1963
615 1975 907 1969
718 1978 1120 1974
(AutoPDF V7 10/12 12:22) Thomson-U (7.375x9.25") Tmath&GillSans J-1711 Glover AC1:(CKN)3/4/2007 pp. 1–30 25795_01_ch01_p001-030 (p. 14)
14 CHAPTER 1 INTRODUCTION
Copyright 2010 Cengage Learning. All Rights Reserved. May not be copied, scanned, or duplicated, in whole or in part. Due to electronic rights, some third party content may be suppressed from the eBook and/or eChapter(s).Editorial review has deemed that any suppressed content does not materially affect the overall learning experience. Cengage Learning reserves the right to remove additional content at any time if subsequent rights restrictions require it.
Licensed to:
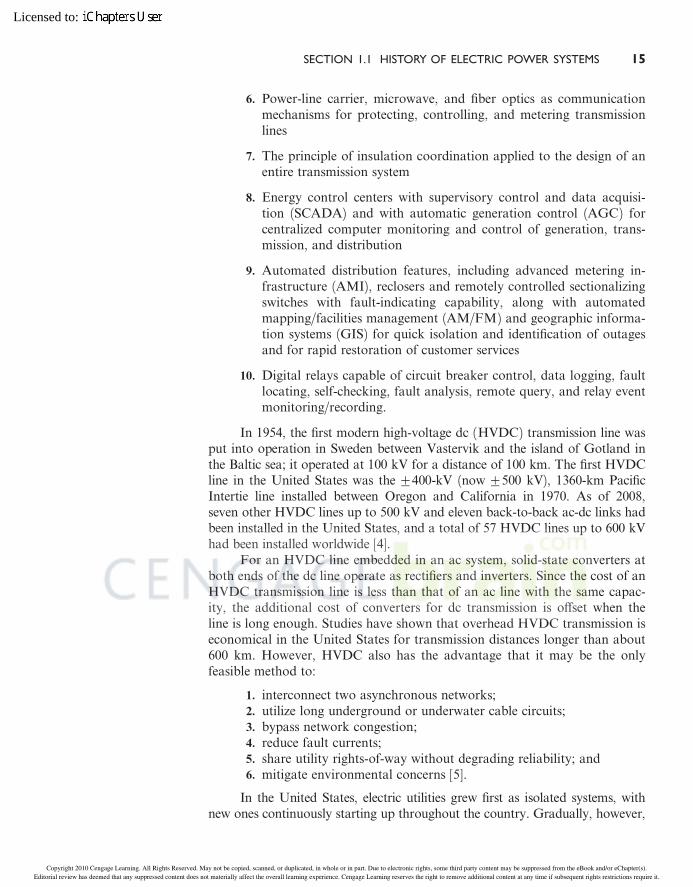
6. Power-line carrier, microwave, and fiber optics as communicationmechanisms for protecting, controlling, and metering transmissionlines
7. The principle of insulation coordination applied to the design of anentire transmission system
8. Energy control centers with supervisory control and data acquisi-tion (SCADA) and with automatic generation control (AGC) forcentralized computer monitoring and control of generation, trans-mission, and distribution
9. Automated distribution features, including advanced metering in-frastructure (AMI), reclosers and remotely controlled sectionalizingswitches with fault-indicating capability, along with automatedmapping/facilities management (AM/FM) and geographic informa-tion systems (GIS) for quick isolation and identification of outagesand for rapid restoration of customer services
10. Digital relays capable of circuit breaker control, data logging, faultlocating, self-checking, fault analysis, remote query, and relay eventmonitoring/recording.
In 1954, the first modern high-voltage dc (HVDC) transmission line wasput into operation in Sweden between Vastervik and the island of Gotland inthe Baltic sea; it operated at 100 kV for a distance of 100 km. The first HVDCline in the United States was the G400-kV (now G500 kV), 1360-km PacificIntertie line installed between Oregon and California in 1970. As of 2008,seven other HVDC lines up to 500 kV and eleven back-to-back ac-dc links hadbeen installed in the United States, and a total of 57 HVDC lines up to 600 kVhad been installed worldwide [4].
For an HVDC line embedded in an ac system, solid-state converters atboth ends of the dc line operate as rectifiers and inverters. Since the cost of anHVDC transmission line is less than that of an ac line with the same capac-ity, the additional cost of converters for dc transmission is o¤set when theline is long enough. Studies have shown that overhead HVDC transmission iseconomical in the United States for transmission distances longer than about600 km. However, HVDC also has the advantage that it may be the onlyfeasible method to:
1. interconnect two asynchronous networks;2. utilize long underground or underwater cable circuits;3. bypass network congestion;4. reduce fault currents;5. share utility rights-of-way without degrading reliability; and6. mitigate environmental concerns [5].
In the United States, electric utilities grew first as isolated systems, withnew ones continuously starting up throughout the country. Gradually, however,
(AutoPDF V7 10/12 12:22) Thomson-U (7.375x9.25") Tmath&GillSans J-1711 Glover AC1:(CKN)3/4/2007 pp. 1–30 25795_01_ch01_p001-030 (p. 15)
SECTION 1.1 HISTORY OF ELECTRIC POWER SYSTEMS 15
Copyright 2010 Cengage Learning. All Rights Reserved. May not be copied, scanned, or duplicated, in whole or in part. Due to electronic rights, some third party content may be suppressed from the eBook and/or eChapter(s).Editorial review has deemed that any suppressed content does not materially affect the overall learning experience. Cengage Learning reserves the right to remove additional content at any time if subsequent rights restrictions require it.
Licensed to:
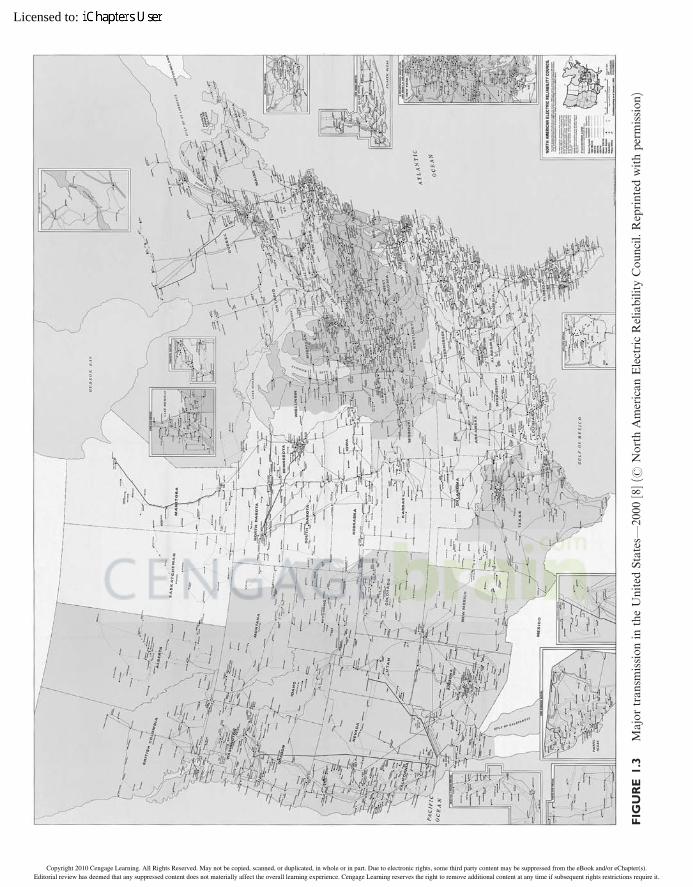
FIG
UR
E1.3
Ma
jor
tra
nsm
issi
on
inth
eU
nit
edS
tate
s—2
00
0[8
]((
No
rth
Am
eric
an
Ele
ctri
cR
elia
bil
ity
Co
un
cil.
Rep
rin
ted
wit
hp
erm
issi
on
)
(AutoPDF V7 10/12 12:22) Thomson-U (7.375x9.25") Tmath&GillSans J-1711 Glover AC1:(CKN)3/4/2007 pp. 1–30 25795_01_ch01_p001-030 (p. 16)
Copyright 2010 Cengage Learning. All Rights Reserved. May not be copied, scanned, or duplicated, in whole or in part. Due to electronic rights, some third party content may be suppressed from the eBook and/or eChapter(s).Editorial review has deemed that any suppressed content does not materially affect the overall learning experience. Cengage Learning reserves the right to remove additional content at any time if subsequent rights restrictions require it.
Licensed to:

neighboring electric utilities began to interconnect, to operate in parallel. Thisimproved both reliability and economy. Figure 1.3 shows major 230-kV andhigher-voltage, interconnected transmission in the United States in 2000. An in-terconnected system has many advantages. An interconnected utility can drawupon another’s rotating generator reserves during a time of need (such as asudden generator outage or load increase), thereby maintaining continuity ofservice, increasing reliability, and reducing the total number of generators thatneed to be kept running under no-load conditions. Also, interconnected utilitiescan schedule power transfers during normal periods to take advantage ofenergy-cost di¤erences in respective areas, load diversity, time zone di¤erences,and seasonal conditions. For example, utilities whose generation is primarilyhydro can supply low-cost power during high-water periods in spring/summer,and can receive power from the interconnection during low-water periods infall/winter. Interconnections also allow shared ownership of larger, more e‰-cient generating units.
While sharing the benefits of interconnected operation, each utility isobligated to help neighbors who are in trouble, to maintain scheduled in-tertie transfers during normal periods, and to participate in system frequencyregulation.
In addition to the benefits/obligations of interconnected operation,there are disadvantages. Interconnections, for example, have increased faultcurrents that occur during short circuits, thus requiring the use of circuitbreakers with higher interrupting capability. Furthermore, although overallsystem reliability and economy have improved dramatically through inter-connection, there is a remote possibility that an initial disturbance may leadto a regional blackout, such as the one that occurred in August 2003 in thenortheastern United States and Canada.
1.2
PRESENT AND FUTURE TRENDS
Present trends indicate that the United States is becoming more electrifiedas it shifts away from a dependence on the direct use of fossil fuels. The elec-tric power industry advances economic growth, promotes business develop-ment and expansion, provides solid employment opportunities, enhances thequality of life for its users, and powers the world. Increasing electrification inthe United States is evidenced in part by the ongoing digital revolution. To-day the United States electric power industry is a robust, $342-billion-plusindustry that employs nearly 400,000 workers. In the United States economy,the industry represents 3% of real gross domestic product (GDP) [6].
As shown in Figure 1.2, the growth rate in the use of electricity in theUnited States is projected to increase by about 1% per year from 2008 to2030 [2]. Although electricity forecasts for the next ten years are based on
(AutoPDF V7 10/12 12:22) Thomson-U (7.375x9.25") Tmath&GillSans J-1711 Glover AC1:(CKN)3/4/2007 pp. 1–30 25795_01_ch01_p001-030 (p. 17)
SECTION 1.2 PRESENT AND FUTURE TRENDS 17
Copyright 2010 Cengage Learning. All Rights Reserved. May not be copied, scanned, or duplicated, in whole or in part. Due to electronic rights, some third party content may be suppressed from the eBook and/or eChapter(s).Editorial review has deemed that any suppressed content does not materially affect the overall learning experience. Cengage Learning reserves the right to remove additional content at any time if subsequent rights restrictions require it.
Licensed to:
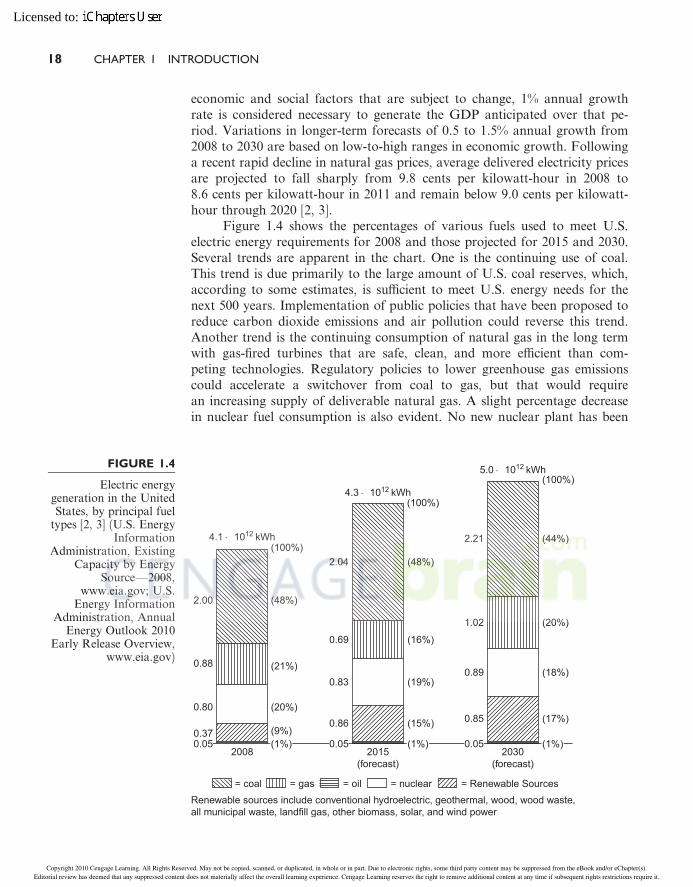
economic and social factors that are subject to change, 1% annual growthrate is considered necessary to generate the GDP anticipated over that pe-riod. Variations in longer-term forecasts of 0.5 to 1.5% annual growth from2008 to 2030 are based on low-to-high ranges in economic growth. Followinga recent rapid decline in natural gas prices, average delivered electricity pricesare projected to fall sharply from 9.8 cents per kilowatt-hour in 2008 to8.6 cents per kilowatt-hour in 2011 and remain below 9.0 cents per kilowatt-hour through 2020 [2, 3].
Figure 1.4 shows the percentages of various fuels used to meet U.S.electric energy requirements for 2008 and those projected for 2015 and 2030.Several trends are apparent in the chart. One is the continuing use of coal.This trend is due primarily to the large amount of U.S. coal reserves, which,according to some estimates, is su‰cient to meet U.S. energy needs for thenext 500 years. Implementation of public policies that have been proposed toreduce carbon dioxide emissions and air pollution could reverse this trend.Another trend is the continuing consumption of natural gas in the long termwith gas-fired turbines that are safe, clean, and more e‰cient than com-peting technologies. Regulatory policies to lower greenhouse gas emissionscould accelerate a switchover from coal to gas, but that would requirean increasing supply of deliverable natural gas. A slight percentage decreasein nuclear fuel consumption is also evident. No new nuclear plant has been
(1%)2008
= coal = gas = oil = nuclear = Renewable Sources
2015(forecast)
2030(forecast)
(9%)
(20%)
(21%)
(48%)
(1%)
(15%)
(19%)
(16%)
(48%)(100%)
(100%)
(1%)
(17%)
(18%)
(20%)
(44%)
(100%)
4.1 × 10¹² kWh
4.3 × 10¹² kWh
5.0 × 10¹² kWh
2.00
0.88
0.80
0.370.05
2.04
0.69
0.83
0.86
0.05
2.21
1.02
0.89
0.85
0.05
Renewable sources include conventional hydroelectric, geothermal, wood, wood waste,all municipal waste, landfill gas, other biomass, solar, and wind power
FIGURE 1.4
Electric energygeneration in the UnitedStates, by principal fuel
types [2, 3] (U.S. EnergyInformation
Administration, ExistingCapacity by Energy
Source—2008,www.eia.gov; U.S.
Energy InformationAdministration, Annual
Energy Outlook 2010Early Release Overview,
www.eia.gov)
(AutoPDF V7 10/12 12:22) Thomson-U (7.375x9.25") Tmath&GillSans J-1711 Glover AC1:(CKN)3/4/2007 pp. 1–30 25795_01_ch01_p001-030 (p. 18)
18 CHAPTER 1 INTRODUCTION
Copyright 2010 Cengage Learning. All Rights Reserved. May not be copied, scanned, or duplicated, in whole or in part. Due to electronic rights, some third party content may be suppressed from the eBook and/or eChapter(s).Editorial review has deemed that any suppressed content does not materially affect the overall learning experience. Cengage Learning reserves the right to remove additional content at any time if subsequent rights restrictions require it.
Licensed to:
ordered in the United States for more than 30 years. The projected growthfrom 0:80� 1012 kWh in 2008 to 0:89� 1012 kWh in 2030 in nuclear genera-tion is based on uprates at existing plants and some new nuclear capacity thatis cost competitive. Safety concerns will require passive or inherently safe re-actor designs with standardized, modular construction of nuclear units. Alsoshown in Figure 1.4 is an accelerating increase in electricity generation fromrenewable resources in response to federal subsidies supported by many staterequirements for renewable generation.
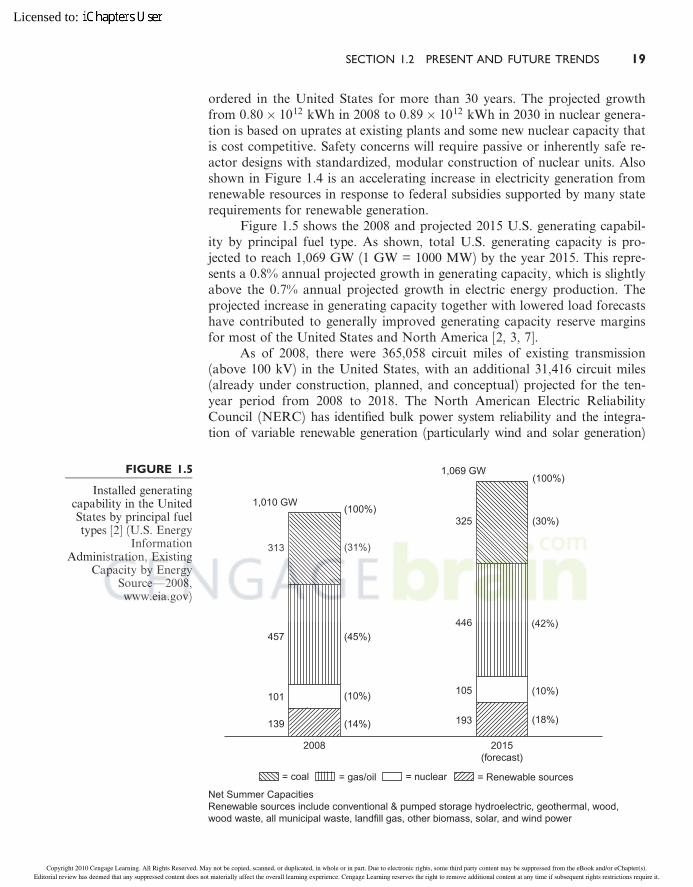
Figure 1.5 shows the 2008 and projected 2015 U.S. generating capabil-ity by principal fuel type. As shown, total U.S. generating capacity is pro-jected to reach 1,069 GW (1 GW = 1000 MW) by the year 2015. This repre-sents a 0.8% annual projected growth in generating capacity, which is slightlyabove the 0.7% annual projected growth in electric energy production. Theprojected increase in generating capacity together with lowered load forecastshave contributed to generally improved generating capacity reserve marginsfor most of the United States and North America [2, 3, 7].
As of 2008, there were 365,058 circuit miles of existing transmission(above 100 kV) in the United States, with an additional 31,416 circuit miles(already under construction, planned, and conceptual) projected for the ten-year period from 2008 to 2018. The North American Electric ReliabilityCouncil (NERC) has identified bulk power system reliability and the integra-tion of variable renewable generation (particularly wind and solar generation)
1,010 GW
1,069 GW
313
325
446
105
193
457
101
139
(100%)
(31%)
(45%)
(10%)
(14%)
(100%)
(30%)
(42%)
(10%)
(18%)
2008 2015(forecast)
= Renewable sources= nuclear= gas/oil= coal
Net Summer CapacitiesRenewable sources include conventional & pumped storage hydroelectric, geothermal, wood,wood waste, all municipal waste, landfill gas, other biomass, solar, and wind power
FIGURE 1.5
Installed generatingcapability in the UnitedStates by principal fueltypes [2] (U.S. Energy
InformationAdministration, Existing
Capacity by EnergySource—2008,www.eia.gov)
(AutoPDF V7 10/12 12:22) Thomson-U (7.375x9.25") Tmath&GillSans J-1711 Glover AC1:(CKN)3/4/2007 pp. 1–30 25795_01_ch01_p001-030 (p. 19)
SECTION 1.2 PRESENT AND FUTURE TRENDS 19
Copyright 2010 Cengage Learning. All Rights Reserved. May not be copied, scanned, or duplicated, in whole or in part. Due to electronic rights, some third party content may be suppressed from the eBook and/or eChapter(s).Editorial review has deemed that any suppressed content does not materially affect the overall learning experience. Cengage Learning reserves the right to remove additional content at any time if subsequent rights restrictions require it.
Licensed to:
as the predominant reasons for projected transmission additions and up-grades. NERC has concluded that while recent progress has been made in thedevelopment of transmission, much work will be required to ensure thatplanned and conceptual transmission is sited and built. NERC also concludesthat significant transmission will be required to ‘‘unlock’’ projected renewablegeneration resources. Without this transmission, the integration of variablegeneration resources could be limited [7].
Siting of new bulk power transmission lines has unique challenges dueto their high visibility, their span through multiple states, and potentially theamount of coordination and cooperation required among multiple regulatingagencies and authorities. A recent court decision to limit the Federal EnergyRegulatory Commission’s (FERC’s) siting authority will lengthen the permitissuing process and cause new transmission projects, particularly multiple-state or regional projects from moving forward in timely manner. This cre-ates a potential transmission congestion issue and challenges the economicviability of new generation projects [7].
Growth in distribution construction roughly correlates with growth inelectric energy construction. During the last two decades, many U.S. utilitiesconverted older 2.4-, 4.1-, and 5-kV primary distribution systems to 12 or15 kV. The 15-kV voltage class is widely preferred by U.S. utilities for newinstallations; 25 kV, 34.5 kV, and higher primary distribution voltages arealso utilized. Secondary distribution reduces the voltage for utilizationby commercial and residential customers. Common secondary distributionvoltages in the United States are 240/120 V, single-phase, three-wire; 208Y/120 V, three-phase, four-wire; and 480Y/277 V, three-phase, four-wire.
Transmission and distribution grids in the United States as well as otherindustrialized countries are aging and being stressed by operational un-certainties and challenges never envisioned when they were developed manydecades ago. There is a growing consensus in the power industry and amongmany governments that smart grid technology is the answer to the uncertaintiesand challenges. A smart grid is characterized by the follolwing attributes:
1. Self-healing from power system disturbances;2. Enables active participation by consumers in demand response;3. Operates resiliently against both physical and cyber attacks;4. Provides quality power that meets 21st century needs;5. Accommodates all generation and energy storage technologies;6. Enables new products, services, and markets; and7. Optimizes asset utilization and operating e‰ciency.
The objective of a smart grid is to provide reliable, high-quality electricpower to digital societies in an environmentally friendly and sustainablemanner [9].
Utility executives polled by the Electric Power Research Institute (EPRI)in 2003 estimated that 50% of the electric-utility technical workforce in theUnited States will reach retirement in the next five to ten years. And accordingto the Institute of Electrical and Electronics Engineers (IEEE), the number of
(AutoPDF V7 10/12 12:22) Thomson-U (7.375x9.25") Tmath&GillSans J-1711 Glover AC1:(CKN)3/4/2007 pp. 1–30 25795_01_ch01_p001-030 (p. 20)
20 CHAPTER 1 INTRODUCTION
Copyright 2010 Cengage Learning. All Rights Reserved. May not be copied, scanned, or duplicated, in whole or in part. Due to electronic rights, some third party content may be suppressed from the eBook and/or eChapter(s).Editorial review has deemed that any suppressed content does not materially affect the overall learning experience. Cengage Learning reserves the right to remove additional content at any time if subsequent rights restrictions require it.
Licensed to:
U.S. power system engineering graduates has dropped from approximately2,000 per year in the 1980s to 500 in 2006. The continuing availability of quali-fied power system engineers is a critical resource to ensure that transmission anddistribution systems are maintained and operated e‰ciently and reliably [8].
1.3
ELECTRIC UTILITY INDUSTRY STRUCTURE
The case study at the beginning of this chapter describes the restructuring ofthe electric utility industry that has been ongoing in the United States. Theprevious structure of large, vertically integrated monopolies that existed untilthe last decade of the twentieth century is being replaced by a horizontalstructure with generating companies, transmission companies, and distribu-tion companies as separate business facilities.
In 1992, the United States Congress passed the Energy Policy Act,which has shifted and continues to further shift regulatory power from thestate level to the federal level. The 1992 Energy Policy Act mandates theFederal Energy Regulatory Commission (FERC) to ensure that adequatetransmission and distribution access is available to Exempt Wholesale Gen-erators (EWGs) and nonutility generation (NUG). In 1996, FERC issued the‘‘MegaRule,’’ which regulates Transmission Open Access (TOA).
TOA was mandated in order to facilitate competition in wholesale gen-eration. As a result, a broad range of Independent Power Producers (IPPs)and cogenerators now submit bids and compete in energy markets to matchelectric energy supply and demand. In the future, the retail structure of powerdistribution may resemble the existing structure of the telephone industry;that is, consumers would choose which generator to buy power from. Also,with demand-side metering, consumers would know the retail price of electricenergy at any given time and choose when to purchase it.
Overall system reliability has become a major concern as the electricutility industry adapts to the new horizontal structure. The North AmericanElectric Reliability Council (NERC), which was created after the 1965 North-east blackout, is responsible for maintaining system standards and reliability.NERC coordinates its e¤orts with FERC and other organizations such as theEdison Electric Institute (EEI) [10].
As shown in Figure 1.3, the transmission system in North America isinterconnected in a large power grid known as the North American PowerSystems Interconnection. NERC divides this grid into ten geographic regionsknown as coordinating councils (such as WSCC, the Western Systems Coor-dinating Council) or power pools (such as MAPP, the Mid-Continent AreaPower Pool). The councils or pools consist of several neighboring utilitycompanies that jointly perform regional planning studies and operate jointlyto schedule generation.
(AutoPDF V7 10/12 12:22) Thomson-U (7.375x9.25") Tmath&GillSans J-1711 Glover AC1:(CKN)3/4/2007 pp. 1–30 25795_01_ch01_p001-030 (p. 21)
SECTION 1.3 ELECTRIC UTILITY INDUSTRY STRUCTURE 21
Copyright 2010 Cengage Learning. All Rights Reserved. May not be copied, scanned, or duplicated, in whole or in part. Due to electronic rights, some third party content may be suppressed from the eBook and/or eChapter(s).Editorial review has deemed that any suppressed content does not materially affect the overall learning experience. Cengage Learning reserves the right to remove additional content at any time if subsequent rights restrictions require it.
Licensed to:
The basic premise of TOA is that transmission owners treat all trans-mission users on a nondiscriminatory and comparable basis. In December1999, FERC issued Order 2000, which calls for companies owning trans-mission systems to put transmission systems under the control of RegionalTransmission Organizations (RTOs). Several of the NERC regions haveeither established Independent System Operators (ISOs) or planned for ISOsto operate the transmission system and facilitate transmission services.Maintenance of the transmission system remains the responsibility of thetransmission owners.
At the time of the August 14, 2003 blackout in the northeastern UnitedStates and Canada, NERC reliability standards were voluntary. In August2005, the U.S. Federal government passed the Energy Policy Act of 2005,which authorizes the creation of an electric reliability organization (ERO)with the statutory authority to enforce compliance with reliability standardsamong all market participants. As of June 18, 2007, FERC granted NERCthe legal authority to enforce reliability standards with all users, owners, andoperators of the bulk power system in the United States, and made compliancewith those standards mandatory and enforceable. Reliability standards are alsomandatory and enforceable in Ontario and New Brunswick, and NERC isseeking to achieve comparable results in the other Canadian provinces.
The objectives of electric utility restructuring are to increase competi-tion, decrease regulation, and in the long run lower consumer prices. There isa concern that the benefits from breaking up the old vertically integratedutilities will be unrealized if the new unbundled generation and transmissioncompanies are able to exert market power. Market power refers to the abilityof one seller or group of sellers to maintain prices above competitive levelsfor a significant period of time, which could be done via collusion or by takingadvantage of operational anomalies that create and exploit transmission con-gestion. Market power can be eliminated by independent supervision of gener-ation and transmission companies, by ensuring that there are an ample numberof generation companies, by eliminating transmission congestion, and by cre-ating a truly competitive market, where the spot price at each node (bus) in thetransmission system equals the marginal cost of providing energy at that node,where the energy provider is any generator bidding into the system [11].
1.4
COMPUTERS IN POWER SYSTEM ENGINEERING
As electric utilities have grown in size and the number of interconnections hasincreased, planning for future expansion has become increasingly complex.The increasing cost of additions and modifications has made it imperativethat utilities consider a range of design options, and perform detailed studies ofthe e¤ects on the system of each option, based on a number of assumptions:
(AutoPDF V7 10/12 12:22) Thomson-U (7.375x9.25") Tmath&GillSans J-1711 Glover AC1:(CKN)3/4/2007 pp. 1–30 25795_01_ch01_p001-030 (p. 22)
22 CHAPTER 1 INTRODUCTION
Copyright 2010 Cengage Learning. All Rights Reserved. May not be copied, scanned, or duplicated, in whole or in part. Due to electronic rights, some third party content may be suppressed from the eBook and/or eChapter(s).Editorial review has deemed that any suppressed content does not materially affect the overall learning experience. Cengage Learning reserves the right to remove additional content at any time if subsequent rights restrictions require it.
Licensed to:
normal and abnormal operating conditions, peak and o¤-peak loadings, andpresent and future years of operation. A large volume of network data mustalso be collected and accurately handled. To assist the engineer in this powersystem planning, digital computers and highly developed computer programsare used. Such programs include power-flow, stability, short-circuit, and tran-sients programs.
Power-flow programs compute the voltage magnitudes, phase angles, andtransmission-line power flows for a network under steady-state operating con-ditions. Other results, including transformer tap settings and generator reactivepower outputs, are also computed. Today’s computers have su‰cient storageand speed to e‰ciently compute power-flow solutions for networks with100,000 buses and 150,000 transmission lines. High-speed printers then printout the complete solution in tabular form for analysis by the planning engi-neer. Also available are interactive power-flow programs, whereby power-flowresults are displayed on computer screens in the form of single-line diagrams;the engineer uses these to modify the network with a mouse or from a key-board and can readily visualize the results. The computer’s large storage andhigh-speed capabilities allow the engineer to run the many di¤erent cases nec-essary to analyze and design transmission and generation-expansion options.
Stability programs are used to study power systems under disturbanceconditions to determine whether synchronous generators and motors remainin synchronism. System disturbances can be caused by the sudden loss of agenerator or transmission line, by sudden load increases or decreases, and byshort circuits and switching operations. The stability program combinespower-flow equations and machine-dynamic equations to compute the angu-lar swings of machines during disturbances. The program also computes crit-ical clearing times for network faults, and allows the engineer to investigatethe e¤ects of various machine parameters, network modifications, distur-bance types, and control schemes.
Short-circuits programs are used to compute three-phase and line-to-ground faults in power system networks in order to select circuit breakers forfault interruption, select relays that detect faults and control circuit breakers,and determine relay settings. Short-circuit currents are computed for eachrelay and circuit-breaker location, and for various system-operating con-ditions such as lines or generating units out of service, in order to determineminimum and maximum fault currents.
Transients programs compute the magnitudes and shapes of transient over-voltages and currents that result from lightning strikes and line-switching oper-ations. The planning engineer uses the results of a transients program to deter-mine insulation requirements for lines, transformers, and other equipment, and toselect surge arresters that protect equipment against transient overvoltages.
Other computer programs for power system planning include relay-coordination programs and distribution-circuits programs. Computer pro-grams for generation-expansion planning include reliability analysis andloss-of-load probability (LOLP) programs, production cost programs, andinvestment cost programs.
(AutoPDF V7 10/12 12:22) Thomson-U (7.375x9.25") Tmath&GillSans J-1711 Glover AC1:(CKN)3/4/2007 pp. 1–30 25795_01_ch01_p001-030 (p. 23)
SECTION 1.4 COMPUTERS IN POWER SYSTEM ENGINEERING 23
Copyright 2010 Cengage Learning. All Rights Reserved. May not be copied, scanned, or duplicated, in whole or in part. Due to electronic rights, some third party content may be suppressed from the eBook and/or eChapter(s).Editorial review has deemed that any suppressed content does not materially affect the overall learning experience. Cengage Learning reserves the right to remove additional content at any time if subsequent rights restrictions require it.
Licensed to:
1.5
POWERWORLD SIMULATOR
PowerWorld Simulator (PowerWorld) version 15 is a commercial-grade powersystem analysis and simulation package that accompanies this text. The purposesof integrating PowerWorld with the text are to provide computer solutions to ex-amples in the text, to extend the examples, to demonstrate topics covered in thetext, to provide a software tool for more realistic design projects, and to providethe readers with experience using a commercial grade power system analysispackage. To use this software package, you must first install PowerWorld, alongwith all of the necessary case files onto your computer. The PowerWorld soft-ware and case files can be downloaded by going to the www.powerworld.com/GloverSarmaOverbye webpage, and clicking on the DownLoad PowerWorldSoftware and Cases for the 5th Edition button. The remainder of this section pro-vides the necessary details to get up and running with PowerWorld.
EXAMPLE 1.1 Introduction to PowerWorld Simulator
After installing PowerWorld, double-click on the PW icon to start the pro-gram. Power system analysis requires, of course, that the user provide the pro-gram with a model of the power system. With PowerWorld, you can eitherbuild a new case (model) from scratch or start from an existing case. Initially,we’ll start from an existing case. PowerWorld uses the common Ribbon userinterface in which common commands, such as opening or saving a case, areavailable by clicking on the blue and white PowerWorld icon in the upper left-hand corner. So to open a case click on the icon and select Open Case. Thisdisplays the Open Dialog. Select the Example 1.1 case in the Chapter 1 direc-tory, and then click Open. The display should look similar to Figure 1.6.
For users familiar with electric circuit schematics it is readily apparentthat Figure 1.6 does NOT look like a traditional schematic. This is becausethe system is drawn in what is called one-line diagram form. A brief explana-tion is in order. Electric power systems range in size from small dc systemswith peak power demands of perhaps a few milliwatts (mW) to large continent-spanning interconnected ac systems with peak demands of hundreds of Giga-watts (GW) of demand (1 GW ¼ 1� 109 Watt). The subject of this book andalso PowerWorld are the high voltage, high power, interconnected ac sys-tems. Almost without exception these systems operate using three-phase acpower at either 50 or 60 Hz. As discussed in Chapter 2, a full analysis of anarbitrary three-phase system requires consideration of each of the three phases.Drawing such systems in full schematic form quickly gets excessively compli-cated. Thankfully, during normal operation three-phase systems are usuallybalanced. This permits the system to be accurately modeled as an equivalentsingle-phase system (the details are discussed in Chapter 8, Symmetrical Com-
ponents). Most power system analysis packages, including PowerWorld,
(AutoPDF V7 10/12 12:22) Thomson-U (7.375x9.25") Tmath&GillSans J-1711 Glover AC1:(CKN)3/4/2007 pp. 1–30 25795_01_ch01_p001-030 (p. 24)
24 CHAPTER 1 INTRODUCTION
Copyright 2010 Cengage Learning. All Rights Reserved. May not be copied, scanned, or duplicated, in whole or in part. Due to electronic rights, some third party content may be suppressed from the eBook and/or eChapter(s).Editorial review has deemed that any suppressed content does not materially affect the overall learning experience. Cengage Learning reserves the right to remove additional content at any time if subsequent rights restrictions require it.
Licensed to:
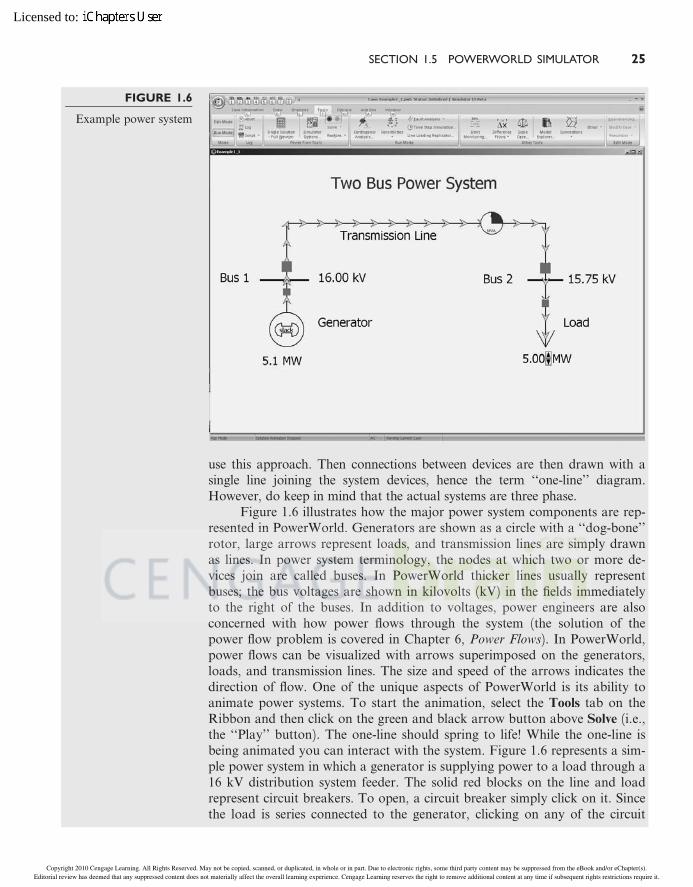
use this approach. Then connections between devices are then drawn with asingle line joining the system devices, hence the term ‘‘one-line’’ diagram.However, do keep in mind that the actual systems are three phase.
Figure 1.6 illustrates how the major power system components are rep-resented in PowerWorld. Generators are shown as a circle with a ‘‘dog-bone’’rotor, large arrows represent loads, and transmission lines are simply drawnas lines. In power system terminology, the nodes at which two or more de-vices join are called buses. In PowerWorld thicker lines usually representbuses; the bus voltages are shown in kilovolts (kV) in the fields immediatelyto the right of the buses. In addition to voltages, power engineers are alsoconcerned with how power flows through the system (the solution of thepower flow problem is covered in Chapter 6, Power Flows). In PowerWorld,power flows can be visualized with arrows superimposed on the generators,loads, and transmission lines. The size and speed of the arrows indicates thedirection of flow. One of the unique aspects of PowerWorld is its ability toanimate power systems. To start the animation, select the Tools tab on theRibbon and then click on the green and black arrow button above Solve (i.e.,the ‘‘Play’’ button). The one-line should spring to life! While the one-line isbeing animated you can interact with the system. Figure 1.6 represents a sim-ple power system in which a generator is supplying power to a load through a16 kV distribution system feeder. The solid red blocks on the line and loadrepresent circuit breakers. To open, a circuit breaker simply click on it. Sincethe load is series connected to the generator, clicking on any of the circuit
FIGURE 1.6
Example power system
(AutoPDF V7 10/12 12:22) Thomson-U (7.375x9.25") Tmath&GillSans J-1711 Glover AC1:(CKN)3/4/2007 pp. 1–30 25795_01_ch01_p001-030 (p. 25)
SECTION 1.5 POWERWORLD SIMULATOR 25
Copyright 2010 Cengage Learning. All Rights Reserved. May not be copied, scanned, or duplicated, in whole or in part. Due to electronic rights, some third party content may be suppressed from the eBook and/or eChapter(s).Editorial review has deemed that any suppressed content does not materially affect the overall learning experience. Cengage Learning reserves the right to remove additional content at any time if subsequent rights restrictions require it.
Licensed to:
breakers isolates the load from the generator resulting in a blackout. To re-store the system click again on the circuit breaker to close it and then againselect the button on the Tools ribbon. To vary the load click on the up ordown arrows between the load value and the ‘‘MW’’ field. Note that becauseof the impedance of the line, the load’s voltage drops as its value is increased.
You can view additional information about most of the elements on theone-line by right-clicking on them. For example right-clicking on the generatorsymbol brings up a local menu of additional information about the generator,while right-clicking on the transmission line brings up local menu of informationabout the line. The meaning of many of these fields will become clearer as youprogress through the book. To modify the display itself simply right-click on ablank area of the one-line. This displays the one-line local menu. Select Oneline
Display Options to display the Oneline Display Options Dialog. From this dia-log you can customize many of the display features. For example, to change theanimated flow arrow color select the ‘‘Animated Flows’’ from the options shownon the left side of the dialog. Then click on the green colored box next to the‘‘Actual MW’’ field (towards the bottom of the dialog) to change its color.
There are several techniques for panning and/or zooming on the one-line. One method to pan is to first click in an empty portion of the displayand then press the keyboard arrow keys in the direction you would like tomove. To zoom just hold down the Ctrl key while pressing the up arrow tozoom in, or the down arrow to zoom out. Alternatively you can drag theone-line by clicking and holding the left mouse button down and then mov-ing the mouse–the one-line should follow. To go to a favorite view from theone-line local menu select the Go To View to view a list of saved views.
If you would like to retain your changes after you exit PowerWorld youneed to save the results. To do this, select the PowerWorld icon in the upper leftportion of the Ribbon and then Save Case As; enter a di¤erent file name so asto not overwrite the initial case. One important note: PowerWorld actuallysaves the information associated with the power system model itself in a di¤er-ent file from the information associated with the one-line. The power systemmodel is stored in *.pwb files (PowerWorld binary file) while the one-line dis-play information is stored in *.pwd files (PowerWorld display file). For all thecases discussed in this book, the names of both files should be the same (exceptthe di¤erent extensions). The reason for the dual file system is to provide flexi-bility. With large system models, it is quite common for a system to be dis-played using multiple one-line diagrams. Furthermore, a single one-line diagrammight be used at di¤erent times to display information about di¤erent cases. 9
EXAMPLE 1.2 PowerWorld Simulator—Edit Mode
PowerWorld has two major modes of operations. The Run Mode, which wasjust introduced, is used for running simulations and performing analysis. TheEdit Mode, which is used for modifying existing cases and building newcases, is introduced in this example. To switch to the Edit Mode click on the
(AutoPDF V7 10/12 12:22) Thomson-U (7.375x9.25") Tmath&GillSans J-1711 Glover AC1:(CKN)3/4/2007 pp. 1–30 25795_01_ch01_p001-030 (p. 26)
26 CHAPTER 1 INTRODUCTION
Copyright 2010 Cengage Learning. All Rights Reserved. May not be copied, scanned, or duplicated, in whole or in part. Due to electronic rights, some third party content may be suppressed from the eBook and/or eChapter(s).Editorial review has deemed that any suppressed content does not materially affect the overall learning experience. Cengage Learning reserves the right to remove additional content at any time if subsequent rights restrictions require it.
Licensed to:
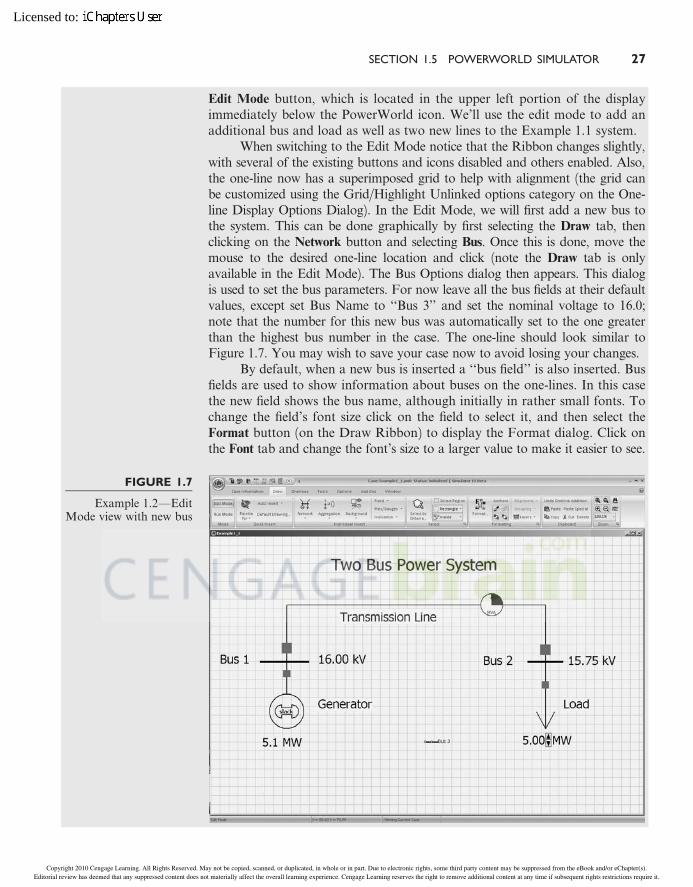
Edit Mode button, which is located in the upper left portion of the displayimmediately below the PowerWorld icon. We’ll use the edit mode to add anadditional bus and load as well as two new lines to the Example 1.1 system.
When switching to the Edit Mode notice that the Ribbon changes slightly,with several of the existing buttons and icons disabled and others enabled. Also,the one-line now has a superimposed grid to help with alignment (the grid canbe customized using the Grid/Highlight Unlinked options category on the One-line Display Options Dialog). In the Edit Mode, we will first add a new bus tothe system. This can be done graphically by first selecting the Draw tab, thenclicking on the Network button and selecting Bus. Once this is done, move themouse to the desired one-line location and click (note the Draw tab is onlyavailable in the Edit Mode). The Bus Options dialog then appears. This dialogis used to set the bus parameters. For now leave all the bus fields at their defaultvalues, except set Bus Name to ‘‘Bus 3’’ and set the nominal voltage to 16.0;note that the number for this new bus was automatically set to the one greaterthan the highest bus number in the case. The one-line should look similar toFigure 1.7. You may wish to save your case now to avoid losing your changes.
By default, when a new bus is inserted a ‘‘bus field’’ is also inserted. Busfields are used to show information about buses on the one-lines. In this casethe new field shows the bus name, although initially in rather small fonts. Tochange the field’s font size click on the field to select it, and then select theFormat button (on the Draw Ribbon) to display the Format dialog. Click onthe Font tab and change the font’s size to a larger value to make it easier to see.
FIGURE 1.7
Example 1.2—EditMode view with new bus
(AutoPDF V7 10/12 12:22) Thomson-U (7.375x9.25") Tmath&GillSans J-1711 Glover AC1:(CKN)3/4/2007 pp. 1–30 25795_01_ch01_p001-030 (p. 27)
SECTION 1.5 POWERWORLD SIMULATOR 27
Copyright 2010 Cengage Learning. All Rights Reserved. May not be copied, scanned, or duplicated, in whole or in part. Due to electronic rights, some third party content may be suppressed from the eBook and/or eChapter(s).Editorial review has deemed that any suppressed content does not materially affect the overall learning experience. Cengage Learning reserves the right to remove additional content at any time if subsequent rights restrictions require it.
Licensed to:
You can also change the size of the bus itself using the Format dialog, Display/Size tab. Since we would also like to see the bus voltage magnitude, we need toadd an additional bus field. On the Draw ribbon select Field, Bus Field, andthen click near bus 3. This displays the Bus Field Options dialog. Make sure thebus number is set to 3, and that the ‘‘Type of Field’’ is Bus Voltage. Again, re-size with the Format, Font dialog.
Next, we’ll insert some load at bus 3. This can be done graphically byselecting Network, Load, and then clicking on bus 3. The Load Options dia-log appears, allowing you to set the load parameters. Note that the load wasautomatically assigned to bus 3. Leave all the fields at their default values,except set the orientation to ‘‘Down,’’ and enter 10.0 in the Constant Powercolumn MW Value field. As the name implies, a constant power load treatsthe load power as being independent of bus voltage; constant power loadmodels are commonly used in power system analysis. By default PowerWorld‘‘anchors’’ each load symbol to its bus. This is a handy feature when chang-ing a drawing since when you drag the bus the load and all associated fieldsmove as well. Note that two fields showing the load’s real (MW) and reactive(Mvar) power were also auto-inserted with the load. Since we won’t be need-ing the reactive field right now, select this field and then select click Delete
(located towards the right side of the Tools Ribbon) to remove it. You shouldalso resize the MW field using the Format, Font command.
Now we need to join the bus 3 load to the rest of the system. We’ll dothis by adding a line from bus 2 to bus 3. Select Network, Transmission Line
and then click on bus 2. This begins the line drawing. During line drawingPowerWorld adds a new line segment for each mouse click. After addingseveral segments place the cursor on bus 3 and double-click. The Transmis-sion Line/Transformer Options dialog appears allowing you to set the lineparameters. Note that PowerWorld should have automatically set the ‘‘from’’and ‘‘to’’ bus numbers based upon the starting and ending buses (buses 2and 3). If these values have not been set automatically then you probably didnot click exactly on bus 2 or bus 3; manually enter the values. Next, set theline’s Series Resistance (R) field to 0.3, the Series Reactance (X) field to 0.6,and the MVA Limits Limit (A) field to 20 (the details of transformer andtransmission line modeling is covered in Chapters 3 through 5). Select OK toclose the dialog. Note that Simulator also auto-inserted two circuit breakersand a round ‘‘pie chart’’ symbol. The pie charts are used to show the per-centage loading of the line. You can change the display size for these objectsby right-clicking on them to display their option dialogs. 9
EXAMPLE 1.3 PowerWorld Simulator—Run Mode
Next, we need to switch back to Run Mode to animate the new system de-veloped in Example 1.2. Click on the Run Mode button (immediately belowthe Edit Mode button), select the Tools on the ribbon and then click the greenand black button above Solve to start the simulation. You should see the
(AutoPDF V7 10/12 12:22) Thomson-U (7.375x9.25") Tmath&GillSans J-1711 Glover AC1:(CKN)3/4/2007 pp. 1–30 25795_01_ch01_p001-030 (p. 28)
28 CHAPTER 1 INTRODUCTION
Copyright 2010 Cengage Learning. All Rights Reserved. May not be copied, scanned, or duplicated, in whole or in part. Due to electronic rights, some third party content may be suppressed from the eBook and/or eChapter(s).Editorial review has deemed that any suppressed content does not materially affect the overall learning experience. Cengage Learning reserves the right to remove additional content at any time if subsequent rights restrictions require it.
Licensed to:
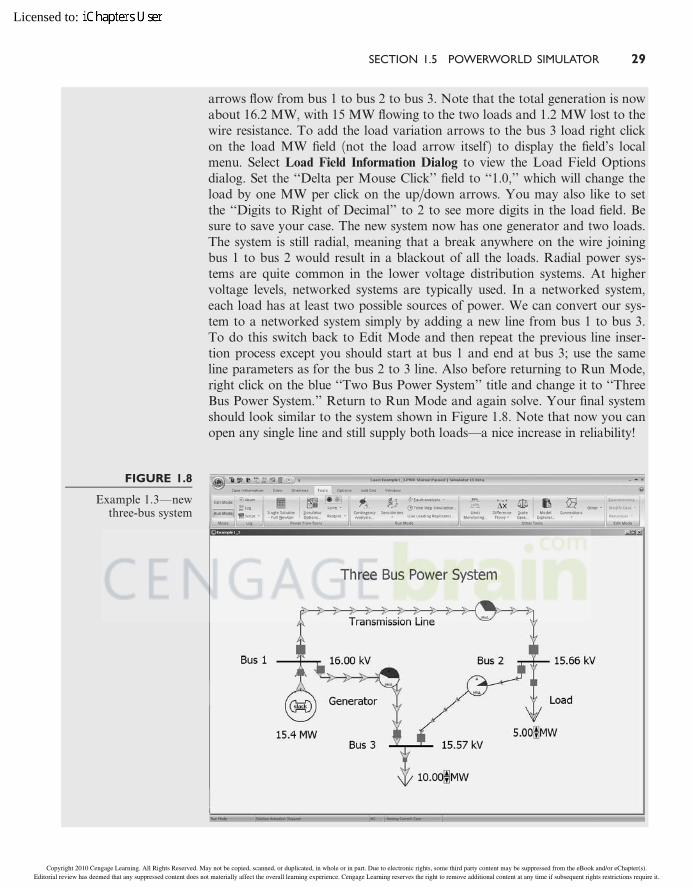
arrows flow from bus 1 to bus 2 to bus 3. Note that the total generation is nowabout 16.2 MW, with 15 MW flowing to the two loads and 1.2 MW lost to thewire resistance. To add the load variation arrows to the bus 3 load right clickon the load MW field (not the load arrow itself) to display the field’s localmenu. Select Load Field Information Dialog to view the Load Field Optionsdialog. Set the ‘‘Delta per Mouse Click’’ field to ‘‘1.0,’’ which will change theload by one MW per click on the up/down arrows. You may also like to setthe ‘‘Digits to Right of Decimal’’ to 2 to see more digits in the load field. Besure to save your case. The new system now has one generator and two loads.The system is still radial, meaning that a break anywhere on the wire joiningbus 1 to bus 2 would result in a blackout of all the loads. Radial power sys-tems are quite common in the lower voltage distribution systems. At highervoltage levels, networked systems are typically used. In a networked system,each load has at least two possible sources of power. We can convert our sys-tem to a networked system simply by adding a new line from bus 1 to bus 3.To do this switch back to Edit Mode and then repeat the previous line inser-tion process except you should start at bus 1 and end at bus 3; use the sameline parameters as for the bus 2 to 3 line. Also before returning to Run Mode,right click on the blue ‘‘Two Bus Power System’’ title and change it to ‘‘ThreeBus Power System.’’ Return to Run Mode and again solve. Your final systemshould look similar to the system shown in Figure 1.8. Note that now you canopen any single line and still supply both loads—a nice increase in reliability!
FIGURE 1.8
Example 1.3—newthree-bus system
(AutoPDF V7 10/12 12:22) Thomson-U (7.375x9.25") Tmath&GillSans J-1711 Glover AC1:(CKN)3/4/2007 pp. 1–30 25795_01_ch01_p001-030 (p. 29)
SECTION 1.5 POWERWORLD SIMULATOR 29
Copyright 2010 Cengage Learning. All Rights Reserved. May not be copied, scanned, or duplicated, in whole or in part. Due to electronic rights, some third party content may be suppressed from the eBook and/or eChapter(s).Editorial review has deemed that any suppressed content does not materially affect the overall learning experience. Cengage Learning reserves the right to remove additional content at any time if subsequent rights restrictions require it.
Licensed to:
With this introduction you now have the skills necessary to begin usingPowerWorld to interactively learn about power systems. If you’d like to takea look at some of the larger systems you’ll be studying, open PowerWorldcase Example 6.13. This case models a power system with 37 buses. Noticethat when you open any line in the system the flow of power immediately re-distributes to continue to meet the total load demand. 9
R E F E R E N C E S
1. H. M. Rustebakke et al., Electric Utility Systems Practice, 4th ed. (New York: Wiley,1983). Photos courtesy of Westinghouse Historical Collection.
2. U.S. Energy Information Administration, Existing Capacity by Energy Source—2008,www.eia.gov.
3. U.S. Energy Information Administration, Annual Energy Outlook 2010 Early Release
Overview, www.eia.gov.
4. Wikipedia Encyclopedia, List of HVDC Projects, en.wikipedia.org.
5. M.P. Bahrman and B.K. Johnson, ‘‘The ABCs of HVDC Transmission Tech-nologies,’’ IEEE Power & Energy Magazine, 5,2 (March/April 2007), pp. 33–44.
6. Edison Electric Institute, About the Industry, www.eei.org.
7. North American Electric Reliability Council (NERC), 2009 Long-Term Reliability
Assessment (Princeton, NJ: www.nerc.com, October 2009).
8. C.E. Root, ‘‘The Future Beckons,’’ Supplement to IEEE Power & Energy Magazine,4,3 (May/June 2006), pp. 58–65.
9. E. Santacana, G. Rackli¤e, L. Tang & X. Feng, ‘‘Getting Smart,’’ IEEE Power &
Energy Magazine, 8,2 (March/April 2010), pp. 41–48.
10. North American Electric Reliability Council (NERC), About NERC (Princeton, NJ:www.nerc.com).
11. T.J. Overbye and J. Weber, ‘‘Visualizing the Electric Grid’’, IEEE Spectrum, 38,2(February 2001), pp. 52–58.
(AutoPDF V7 10/12 12:22) Thomson-U (7.375x9.25") Tmath&GillSans J-1711 Glover AC1:(CKN)3/4/2007 pp. 1–30 25795_01_ch01_p001-030 (p. 30)
30 CHAPTER 1 INTRODUCTION
Copyright 2010 Cengage Learning. All Rights Reserved. May not be copied, scanned, or duplicated, in whole or in part. Due to electronic rights, some third party content may be suppressed from the eBook and/or eChapter(s).Editorial review has deemed that any suppressed content does not materially affect the overall learning experience. Cengage Learning reserves the right to remove additional content at any time if subsequent rights restrictions require it.
Recommended


![Sarma Customer Service Surveys]](https://img.pdfslide.us/doc/110x75/58a3ad4d1a28ab9e6a8b6017/sarma-customer-service-surveys.jpg)