Potential Impact of Consumer Behaviour and Fossil Fuelled
Hydrogen Generation on National y gEnergy Policy of New Zealand
Jonathan Leaver MS(Stanford) PhD (Auckland)
Dept of Civil Engineering, Unitec NZp g g,
Luke Leaver BE(Hons) MS(Stanford)Asia Pacific Energy Research Centre

AcknowledgementsResearchers• Kenneth Gillingham, AB (Dartmouth), MS (Stanford), MA (Auckland)
• Andrew Baglino BS(Hons)(Stanford)d e ag o S( o s)(S a o d)
Adviser and Dedication• Dr Paul Kruger (Stanford) (deceased)
Project PartnersProject Partners• Dr Tony Clemens (deceased) – CRL Energy
• Alister Gardner - Industrial Research Ltd
Outline
U.S. U.S. –– N.Z. National Energy ProfilesN.Z. National Energy ProfilesUniSyDUniSyD ModelModelScenario ResultsScenario Resultsa o ua o uConclusionsConclusions
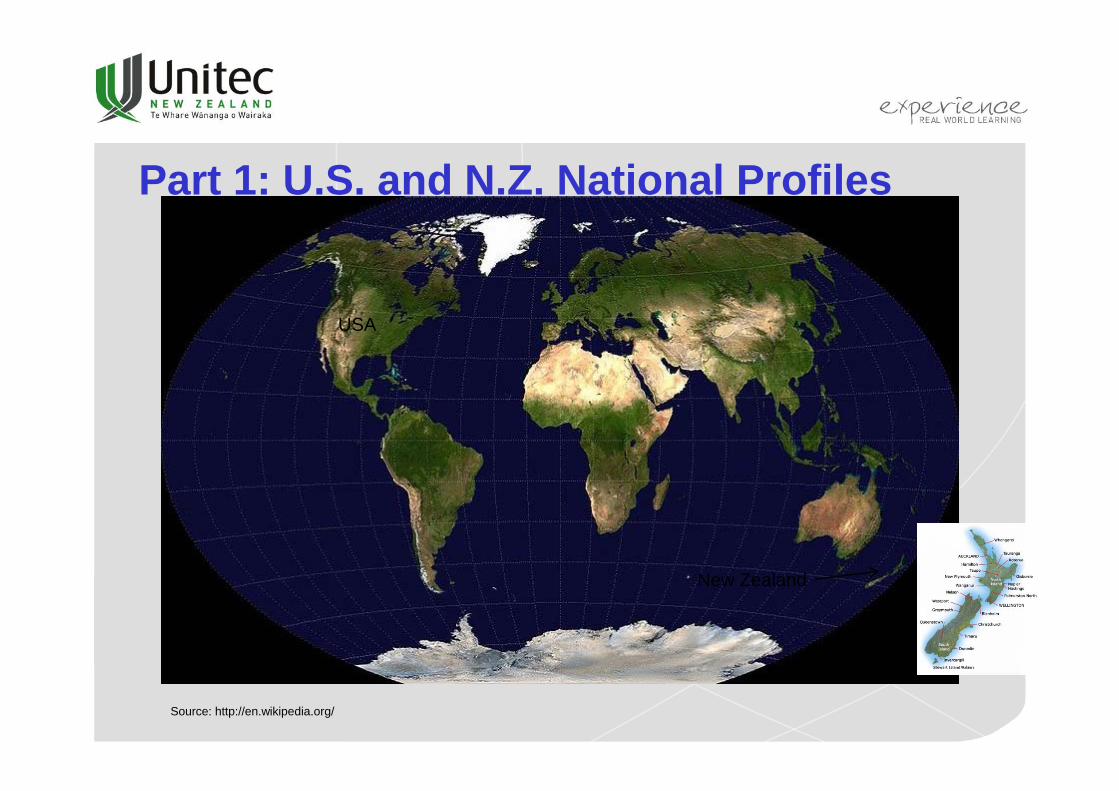
Part 1: U.S. and N.Z. National Profiles
USA
N Z l dNew Zealand
Source: http://en.wikipedia.org/

U.S. – N.Z. Economy 2009
52.9
46.4
US New Zealand
33.529.3
27.4
9.36.2
15.8
-1.6 -2.6
% Econ.Growth % Unemployment % Public debt/GDP
GDP/Cap (US$1000)
Pop density (ca/sq. km)
Source: CIA – The World Factbook

Selected Resource Potential40
p-20
10)
U.S. New Zealand
119
30
tion
(MW
h/ca
20
dded
Gen
erat
US - 2010 = 13.8
10
Pot
entia
l Ad NZ - 2010 = 10.2
0Coal* Wind CSP* Nuclear Geothermal Hydro Solar hot
water
Note: *Coal based on 100 years of generation. CSP=concentrated solar power.Sources: NZ: MED EHMS 2005, MED Energy Outlook 2009
U.S.: MIT Update of MIT Future of Nuclear Power 2009, NREL Estimates of Wind Resource Potential 2010, The Future of Geothermal Energy MIT/DOE 2006, NREL Potential of Solar Water Heating NREL/TP-640-41157 2007, U.S. Hydropower Resources INEEL/EXT-03-00662, BP Statistical Review of World Energy.

Part 2: UNISYD Model
Models NZ’s Energy-Economic System• Detailed technological specificity and resource • Detailed technological specificity and resource
modelling– 1100 primary variables, 7000 lines of code
• Simulates in biweekly time steps• Simulates in biweekly time steps.• 13 NZ regions
Primary SectorsPrimary Sectors• Electricity Market • Hydrogen Market• Lignocellulose market• Vehicle Fleet Market
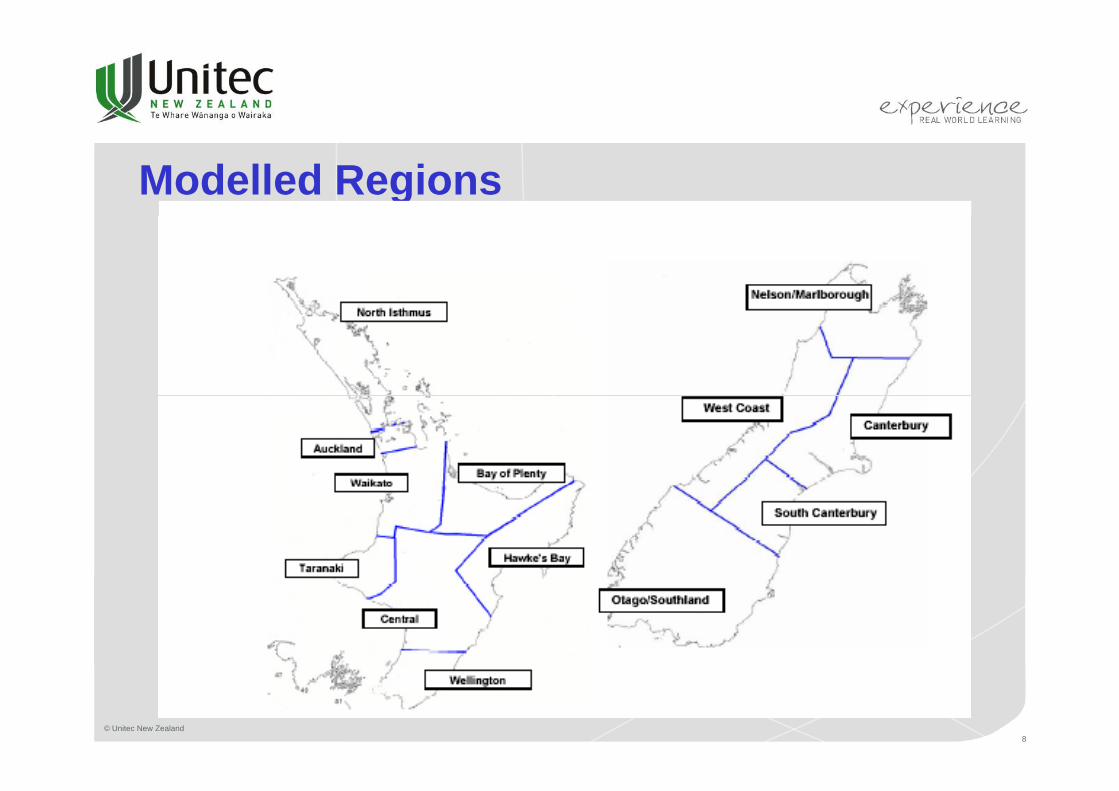
Modelled Regions
© Unitec New Zealand8
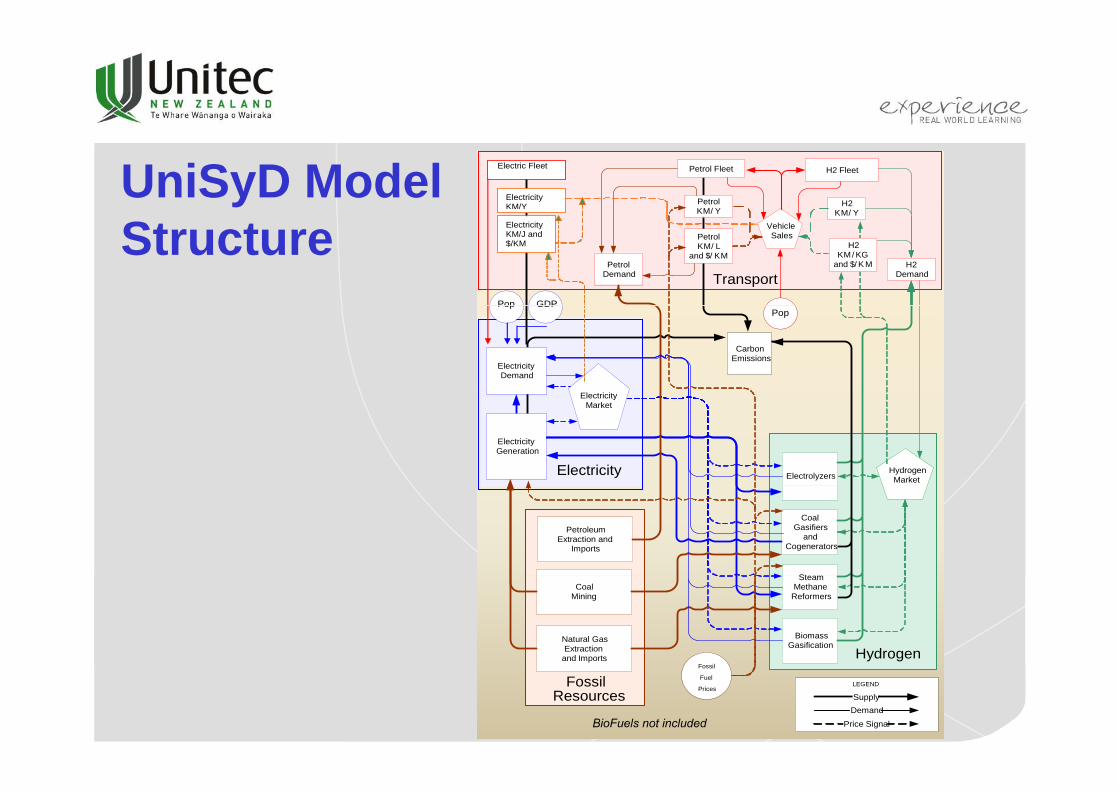
UniSyD Model
Petrol Fleet
H2KM/ Y
PetrolKM/ Y
H2 FleetElectric Fleet
Electricity KM/Y
Structure PetrolKM/ L
and $/ KMH2
DemandPetrol
Demand Transport
VehicleSales
H2KM/ KG
and $/ K M
GDPPop
Electricity KM/J and $/KM
Pop
Electricity Demand
Electricity
Carbon Emissions
GDPPop
Electrolyzers
Electricity Generation
Electricity
ElectricityMarket
HydrogenMarket
St
Coal Gasifiers
and Cogenerators
PetroleumExtraction and
Imports
Natural GasExtraction
and Imports
CoalMining
Steam Methane
Reformers
BiomassGasification
HydrogenF il
FossilResources
LEGEND
SupplyDemand
Price Signal
Fossil
Fuel
Prices
BioFuels not included

Electricity Market - Overview
• DemandExogenous demand growth– Exogenous demand growth
– Dynamic interaction with price signals• Supply: generation options (+sequestration option)
– Coal– Natural gas– Hydro– Geothermal– e-/H2 Cogeneration– Biomass
S l PV– Solar PV– Wind– Solar Thermal
Combined Heat and Power
Huntly. Source: Genesis Energy
– Combined Heat and Power– Microgeneration

Electricity Generation
• New capacity is installed as follows:– Find region with most expensive retail prices– Find region with most expensive retail prices– Determine least expensive technology for that region– Build a plant if
a) the region does not already a plant under construction, and b) the production cost is below the capital planning wholesale price (i.e. lowest cost additional generation)
• Technology learning curves lower production costs of future plants
• Future gas plants are only built if LNG is available
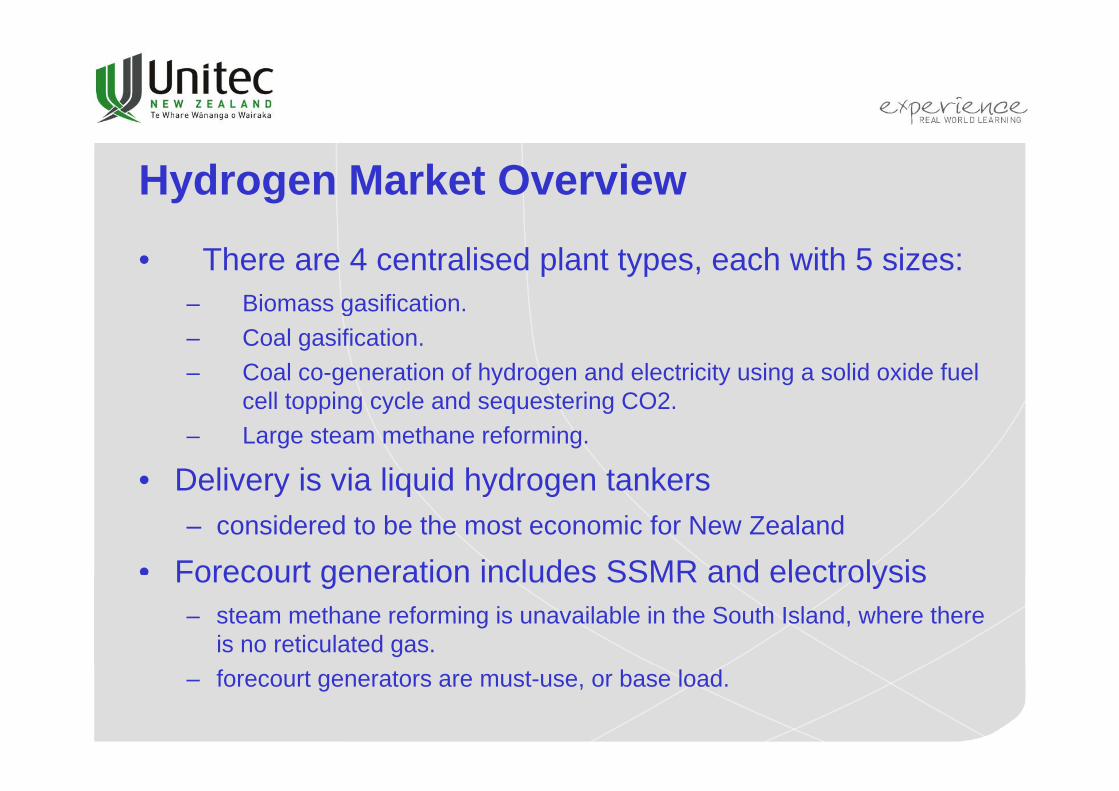
Hydrogen Market Overview
• There are 4 centralised plant types, each with 5 sizes:– Biomass gasification– Biomass gasification.– Coal gasification.– Coal co-generation of hydrogen and electricity using a solid oxide fuel
ll t i l d t i CO2cell topping cycle and sequestering CO2.– Large steam methane reforming.
• Delivery is via liquid hydrogen tankersDelivery is via liquid hydrogen tankers– considered to be the most economic for New Zealand
• Forecourt generation includes SSMR and electrolysisForecourt generation includes SSMR and electrolysis– steam methane reforming is unavailable in the South Island, where there
is no reticulated gas.– forecourt generators are must-use, or base load.

Lignocellulose (Forest) Market - Overview
• Bio-ethanol from forests and biodiesel from rape seed crop
• New biomass development cannot exceed the regional supply limit.
• Marginal pricing system with H2 from biogasification, bioethanol and biomass electricity generation competing for the same fuel.

Vehicle Choice: Logit A – 1st Option
• Logit choice model used for market share, S, of vehicle type, i:yp ,
1 1 11
exp( )exp( )i i i
pSp
β γβ γ
−=
−∑
p is the annual cost
i∑
Β is the price elasticityγ the intrinsic preference parameter
Vehicle Choice: Logit B – 2nd Option
• The market share, S, is function of:F l t k f ICEV• Fuel cost per km from ICEV
• Purchase price from ICEV
• Driving range (km)Driving range (km)
• Convenient medium range destinations requiring no advanced planning.
• Proportion of long range destinations that can be reached.
• Reluctance to drive ICEVs.
Note: CMDD and PLDD utility factors for EVs are sigmoid functions of the % of fleet penetration

Vehicle Fleets
Vehicle Type Modelled Profile
ICEVs, H2ICEVs, BICEVs, HEV PHEV BEV
Imported Used North Island
Light South IslandHEVs, PHEVs, BEVs, FCVs,
New North Island
South Island
Heavy North IslandHeavy North Island
South Island

Vehicle Fuel EconomyFuel Economy (km/kWh)
Vehicle Type Imported Light New Light Heavy
ICEV/HICEVLow Bound 1.24 1.21 0.40ICEV/HICEVHigh Bound 2.17 2.17 0.62
HFCVLow Bound 3.09 3.09 0.89Hi h B dHigh Bound 3.36 3.36 0.97
BEV(320 km range)
Low Bound 4.50 4.50 1.35
High Bound 5 10 5 10 1 52( g ) High Bound 5.10 5.10 1.52

Light Vehicle: Specific Fuel Cost
Fuel Cost0.30
$/km
)
Fuel CostBioEthanolH2ICEVPetrolFCVEV
0 10
0.20
Cos
t (U
S$ EV
0 00
0.10
Fuel
0.002010 2020 2030 2040 2050
Year
18

Vehicle Cost and Payback
24
32k
(yea
rs)
Logit A - No weighting
Low bound
High bound24
32
(yea
rs)
Logit B - Consumer weighted
Low bound
High bound
8
16
Sim
ple
Pay
back
8
16
Sim
ple
Pay
back
0Turbo Diesel HEV PHEV-48
kmHFCV PHEV-96
kmBEV
24000Low bound
24000Low bound
0Turbo Diesel HEV PHEV-48
kmHFCV PHEV-96
kmBEV
12000
18000
vehi
cle
cost
(US
$) High bound
12000
18000
ehic
le c
ost (
US
$) High bound
0
6000
Turbo Diesel HEV PHEV-48 km
HFCV PHEV-96 km
BEV
Ext
ra v
0
6000
Turbo Diesel HEV PHEV-48 km
HFCV PHEV-96 km
BEV
Ext
ra v
e
19
Gasoline US$1.00/litre (US$3.80/gal); electricity US$0.05/kWh; H2 US$3.50/kg; 20,000 km per year, BEV (320 km range).Data from: Matthew A. Kromer and John B. Heywood May 2007 “Electric Powertrains: Opportunities and Challenges in the U.S. Light-Duty Vehicle Fleet “, MIT Report LFEE 2007-02 RP
km km km km

Part 3: Scenario ParametersB CBase Case:• Oil US$200/bbl by 2050• Ctax: US$15/t-C from 2012• New fossils with sequestration
itt d b t l t li id
2.30U
Oil & NG Price Increase %
2020U
Start Year H2ICEV
2015U
Start Year PHEV
2015
Start Year EV
80?U
International Oil PriceUSD per Barrel
12.5?U
Carbon Tax 2008$ per T CO2
25?U
Carbon Tax 2012$ per T CO2
2020
Start Year FCV
2010
Start Year HEV
150U
Max % Oil & NG Price Increase %
2010U
Year of Oil & NG Price Increase
2010U
Start Year BICEV
HEV Drive Cycle
Vehicle Fleets CarbonFossil/Bio Fuels
permitted but no coal to liquids
High CTax Case:• Oil US$200/bbl by 2050
Ct US$120/t C f 2012
2U
Battery Learning Curve
2U
FC Learning Curve2010U
Start Year New fossil?
1.00U
Extra Vehicle TechnologyRetai l Markup
150U2010U
320U
EV Range km
Mandate Fuel Economy
2010U
Start Year New Bio?
64U
PHEV Range km
Linear Fuel Economy?
0.50?
HEV Drive Cycle Regen Factor[Heavy]
ALL PRICES IN 2008 NZD1 = Low cost 2 = Med cost 3 = High 1 = Low cost 2 = Med cost 3 = High cost
PRIMARY VARIABLES
1 NZ$=US$0.60 • Ctax: US$120/t-C from 2012• New fossils with sequestration permitted but no coal to liquids
Allow H2 from Cogen? Allow Small SMR? PHEV Battery Range E t i F t
8.0
yL per 100 KM
Random Rainfall
Loss Wll ingness
2051U
Fuel Mandate YearLinear Fuel Economy?
Use Restricted PHEV Range?
Vehicle ParametersElectricity
Pl t
Hydrogen Production
Ignore LNG
LNG ImportationBegins
Micro NG CHP?
Seasonal Hydro Flows
Micro H2 CHP?
Use Distance Preference?
0
Initial EVCapital Tax %
Mandate H2 pipelines
Initial PHEVCapital Tax %
10.0U
Extension Factor
2050U
Capital Cost Red Target Year
Use Capital and Fuel Preference?
10U
g Use Restricted PHEV Range?
0.90U
ElectricityDemand Growth
Ratio 1.0U
EnthusiasticH2 Plant Building
Carbon
Plant
16.3
Maximum Cost US$Carbon Sequestration
NZ to USExchange Rate
2051U
4.0U
Start price Coal$ per GJ
0
Initial FCVCapital Tax %
Micro H2 CHP?
Use ICEV Disincentive?
0
Tag Coal to Oil?
2020U
Start Year Ramp Down Existing CoalPercentage of Predicted
Biomass Resource
0U
Capital Cost Red Factor %
Use Sigmoid Distance Factors?
Annual Cost
0U
Annual Cost EV Tax %
Annual Cost
Tag Demand to Pop?1.6U
Carbon SequestrationBase Cost US$
Other
20
0.60?U 100U
0U
FCV Tax %
0
PHEV Tax %
SECONDARY VARIABLES

Electricity and Vehicle Fleet Profiles
Low CtaxLogit A
0.30
0.40
S$/k
Wh)
National Wholesale Electricity Price
300
400
atio
n (P
J)
National ElectricityHydroDG CogenCoalGeothermalBioNatural Gas
4000
6000
(100
0s)
Vehicle Fleet Nos
Light BICEVLight FCVLight EVLogit A
0.00
0.10
0.20
2010 2020 2030 2040 2050Who
lesa
le P
rice
(US
Year
0
100
200
2010 2020 2030 2040 2050Elec
trici
ty G
ener
a
Year
Natural GasH2 CogenSolar ThermalWindBioEth CogenGovt-DieselElectricity Demand
0
2000
2010 2020 2030 2040 2050
Vehi
cle
No.
(
Year
Light PHEVLight HEVLight Petrol
Low CtaxLogit B
0 10
0.20
0.30
0.40
Pric
e (U
S$/
kWh)
National Wholesale Electricity Price
100
200
300
400
y G
ener
atio
n (P
J)
National ElectricityHydroDG CogenCoalGeothermalBioNatural GasH2 CogenSolar ThermalWindBioEth Cogen
2000
4000
6000
cle
No.
(100
0s)
Vehicle Fleet Nos
Light BICEVLight FCVLight EVLight PHEVLight HEVLi ht P t l
0.00
0.10
2010 2020 2030 2040 2050Who
lesa
le P
Year
0
100
2010 2020 2030 2040 2050Elec
trici
ty
Year
BioEth CogenGovt-DieselElectricity Demand
0.40National Wholesale Electricity Price
400
)
National ElectricityHydroDG Cogen
02010 2020 2030 2040 2050
Vehi
Year
Light Petrol
6000Vehicle Fleet Nos
Light BICEV
High CtaxLogit A
0.00
0.10
0.20
0.30
hole
sale
Pric
e (U
S$/k
Wh)
0
100
200
300
Elec
trici
ty G
ener
atio
n (P
J)
gCoalGeothermalBioNatural GasH2 CogenSolar ThermalWindBioEth CogenGovt-DieselElectricity Demand
0
2000
4000
Vehi
cle
No.
(100
0s) Light BICEV
Light FCVLight EVLight PHEVLight HEVLight Petrol
21
2010 2020 2030 2040 2050Wh
Year2010 2020 2030 2040 2050E
Year2010 2020 2030 2040 2050
Year
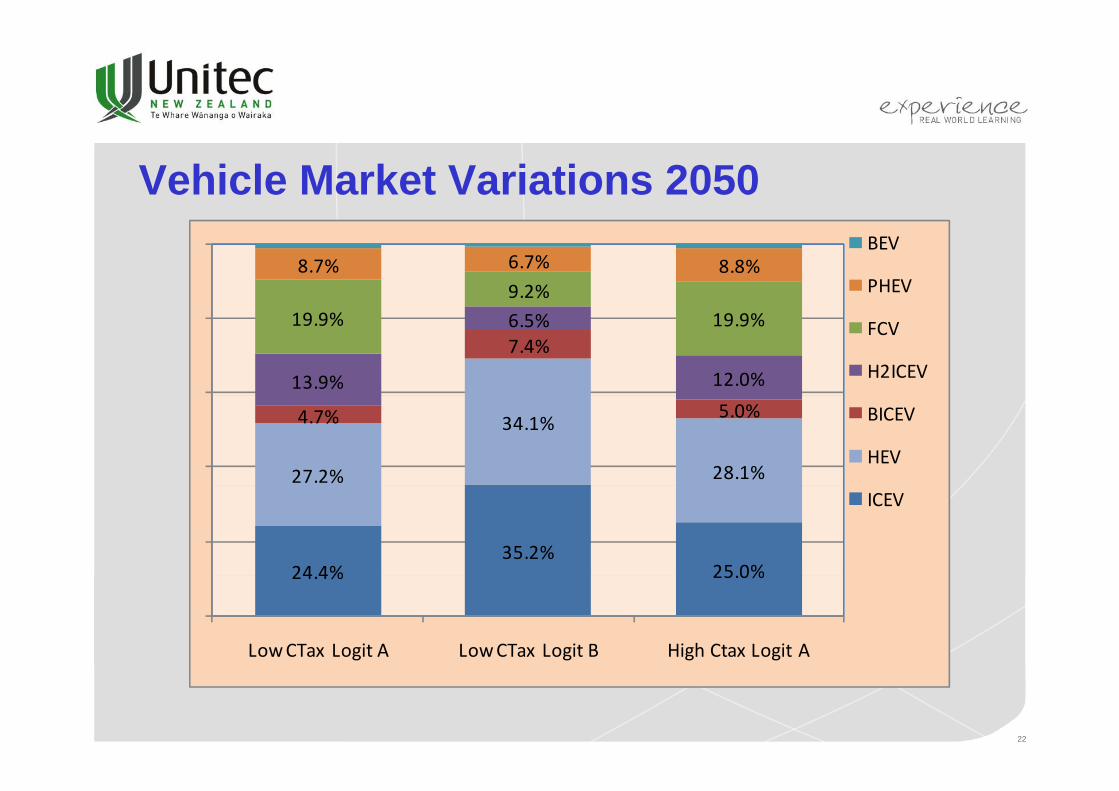
Vehicle Market Variations 2050
9.2%8.7% 6.7% 8.8%
BEV
PHEV
7.4%
13.9%
6.5%
12.0%
19.9% 19.9% FCV
H2ICEV
27.2%
34.1%
28.1%
4.7% 5.0% BICEV
HEV
24 4%35.2%
25 0%
ICEV
24.4% 25.0%
Low CTax Logit A Low CTax Logit B High Ctax Logit A
22

Greenhouse Gas Emissions
Low CtaxLogit A 20
30
40
sions
(Mt)
GHG EmissionsSequesteredEmitted due to Seq ConstraintEmitted 15
20
e (U
S$/k
g)
National Wholesale Hydrogen Price
South Island
North Island600
800
atio
n (k
t)
National Hydrogen
Large SMRCogenBioGasificationCoal GasificationSmall SMRLogit A
0
10
20
2010 2020 2030 2040 2050
CO
2 E
mis
s
Year
0
5
10
2010 2020 2030 2040 2050
Who
lesa
le P
rice
Year
0
200
400
2010 2020 2030 2040 2050
H2
Gen
era
Year
Small SMRElectrolysis
Low CtaxLogit B 20
30
40
2 Em
issio
ns (M
t)
GHG EmissionsSequesteredEmitted due to Seq ConstraintEmitted
10
15
20
e P
rice
(US
$/kg
)
National Wholesale Hydrogen Price
South Island
North Island
400
600
800
Gen
erat
ion
(kt)
National Hydrogen
Large SMRCogenBioGasificationCoal GasificationSmall SMRElectrolysis
40GHG Emissions
S d
0
10
2010 2020 2030 2040 2050
CO
2
Year
20National Wholesale Hydrogen Price
800National Hydrogen
L SMR
0
5
2010 2020 2030 2040 2050
Who
lesa
le
Year
0
200
2010 2020 2030 2040 2050
H2
G
Year
High CtaxLogit A
10
20
30
CO
2 E
miss
ions
(Mt)
SequesteredEmitted due to Seq ConstraintEmitted
5
10
15
0
esal
e H
2 Pr
ice
(US
$/kg
)
South IslandNorth Island
200
400
600
800
H2
Gen
erat
ion
(kt)
Large SMRCogenBioGasificationCoal GasificationSmall SMRElectrolysis
23
02010 2020 2030 2040 2050
Year
02010 2020 2030 2040 2050W
hole
Year
02010 2020 2030 2040 2050
Year

Conclusions• In the base case scenario using the Logit B consumer weightings of
capital and fuel costs results in a 34% increase in CVs (ICEVs, HEVs) in 2050HEVs) in 2050.
• Increasing the carbon tax in the Logit A case from US$15/t-CO2-eq to US$120/t-CO2-eq results in:2 eq
– Reduction of CVs from 69% to 52% by 2050.– A 27% increase in GHG emissions from 2010 levels due to lack of sequestration
capacity.
• To counter consumer resistance to the purchase of higher priced electric drive vehicles it is advisable to capitalise fuel savings with a fuel tax and subsidise the capital cost.
• A cap and trade policy may be necessary to keep GHG emissions at or below 2010 levels due to the production of hydrogen from advanced technology plants producing hydrogen by coaladvanced technology plants producing hydrogen by coal gasification.

Questions? Pohutu Geyser, Rotorua Akaroa, South Island
Kereru (Native Wood Pigeon)
Lake Pukaki & Mt Aoraki (Cook) 3,754 metres, 12,316 ft
Omaha Beach, North Auckland
25
Recommended