Copyright: Gilean McVean, 2001 1
Population structure
• The evolutionary significance of structure
• Detecting and describing structure
– Wright’s F statistics
• Implications for genetic variability
– Inbreeding effects of structure– The Wahlund effect– Drift and founder effects
• Island models of population structure
– Identity by descent– Diffusion methods– The coalescent with structure
• Selection in subdivided populations
– Location adaptation– Clines– Wright’s Shifting-Balance theory
Copyright: Gilean McVean, 2001 2
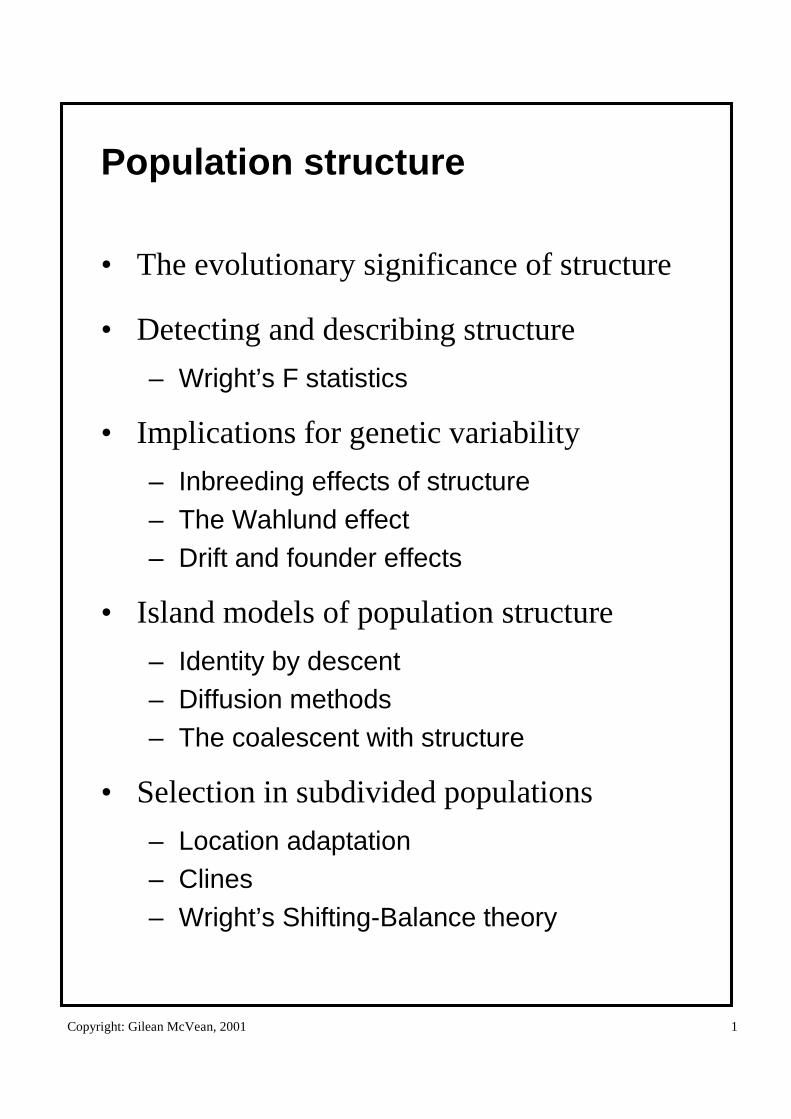
Population structure
• Non-random location
• Non-random mating
Genetic and phenotypic divergence due to
ChanceSelectionSelection plus chance
Distribution of surname
Hannah
Goodacre and Sykes
Copyright: Gilean McVean, 2001 3
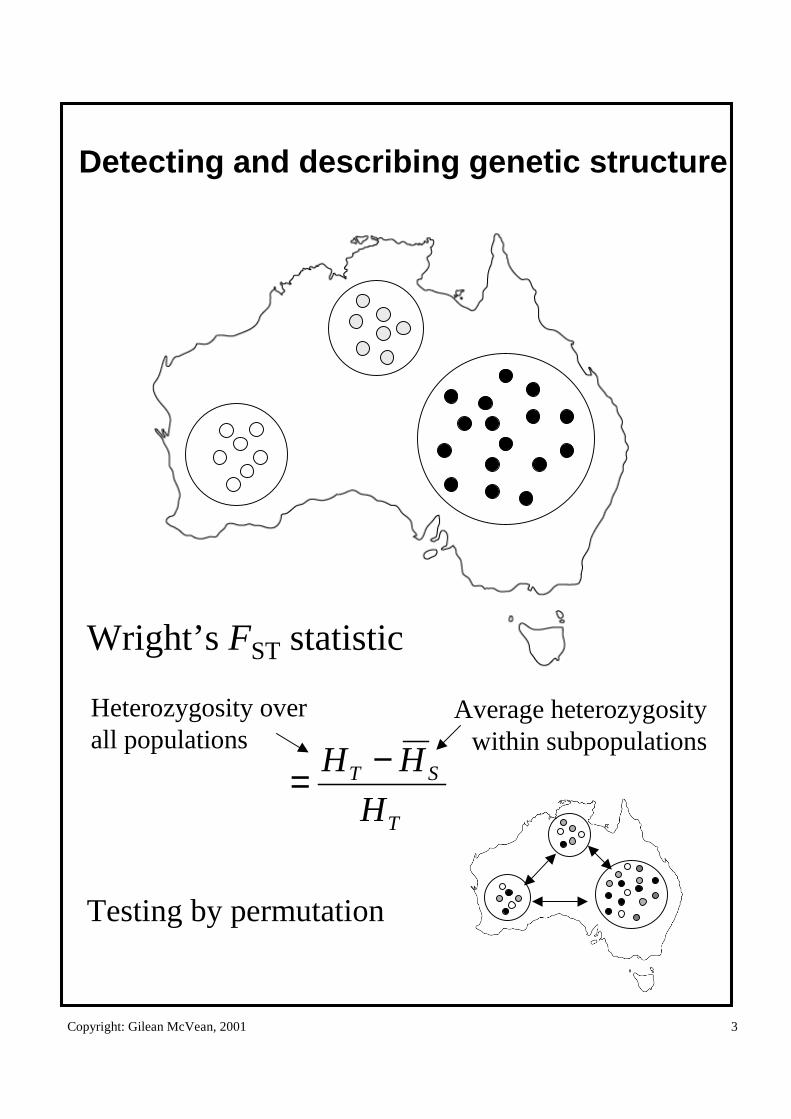
Detecting and describing genetic structure
Wright’s FST statistic
T
ST
H
HH −=
Testing by permutation
Average heterozygositywithin subpopulations
Heterozygosity overall populations
Copyright: Gilean McVean, 2001 4
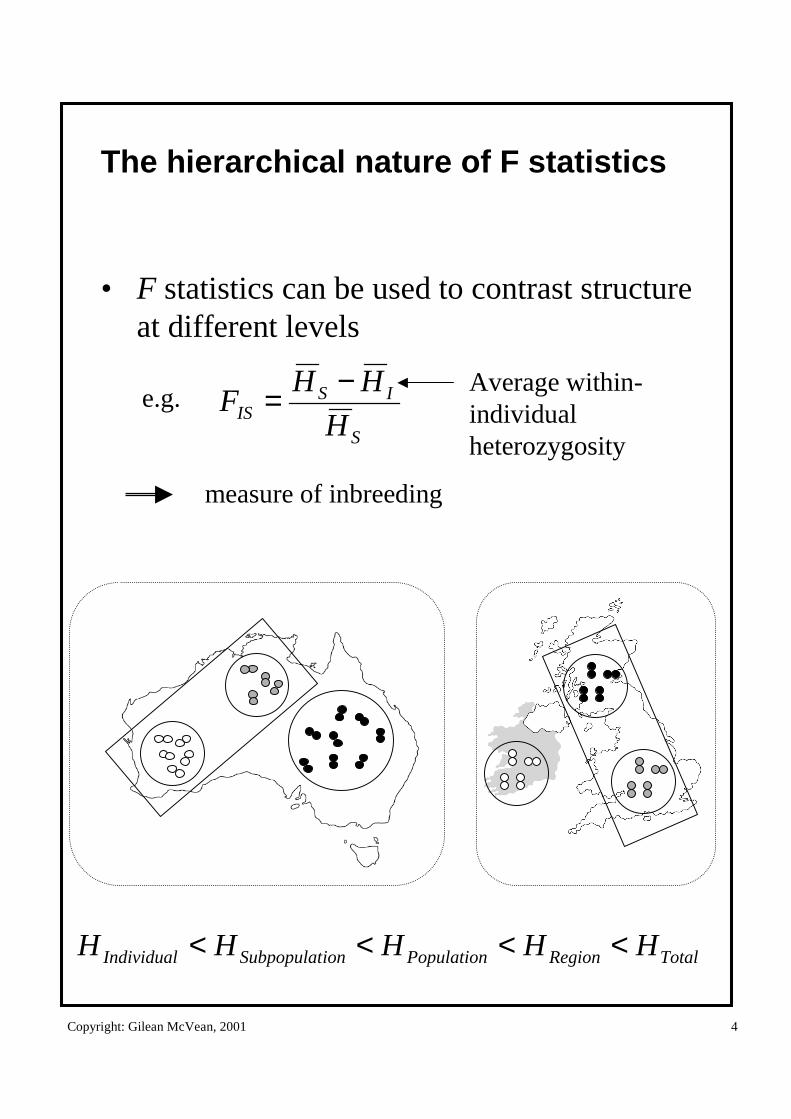
The hierarchical nature of F statistics
• F statistics can be used to contrast structure at different levels
e.g.S
ISIS H
HHF
−= Average within-individualheterozygosity
measure of inbreeding
TotalRegionPopulationionSubpopulatIndividual HHHHH <<<<
Copyright: Gilean McVean, 2001 5
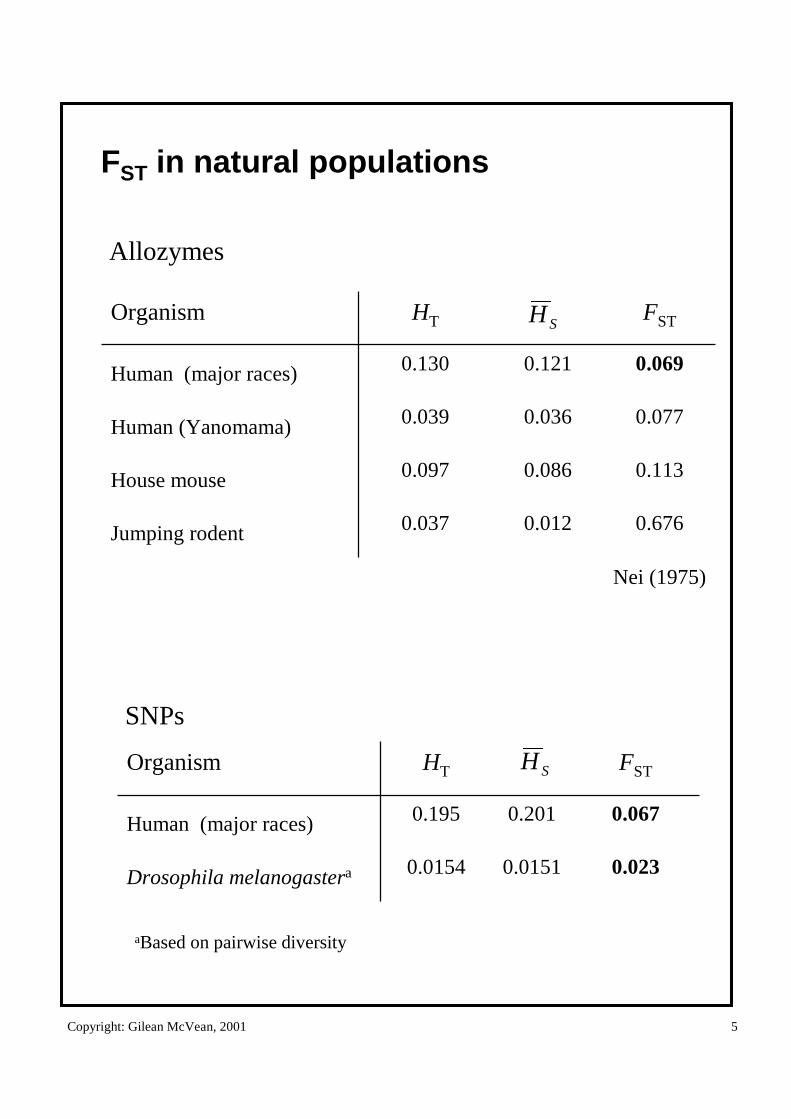
FST in natural populations
0.6760.0120.037Jumping rodent
0.1130.0860.097House mouse
0.0770.0360.039Human (Yanomama)
0.0690.1210.130Human (major races)
FSTHTOrganismSH
Nei (1975)
Allozymes
SNPs
0.0230.01510.0154Drosophila melanogastera
0.0670.2010.195Human (major races)
FSTHTOrganism SH
aBased on pairwise diversity
Copyright: Gilean McVean, 2001 6
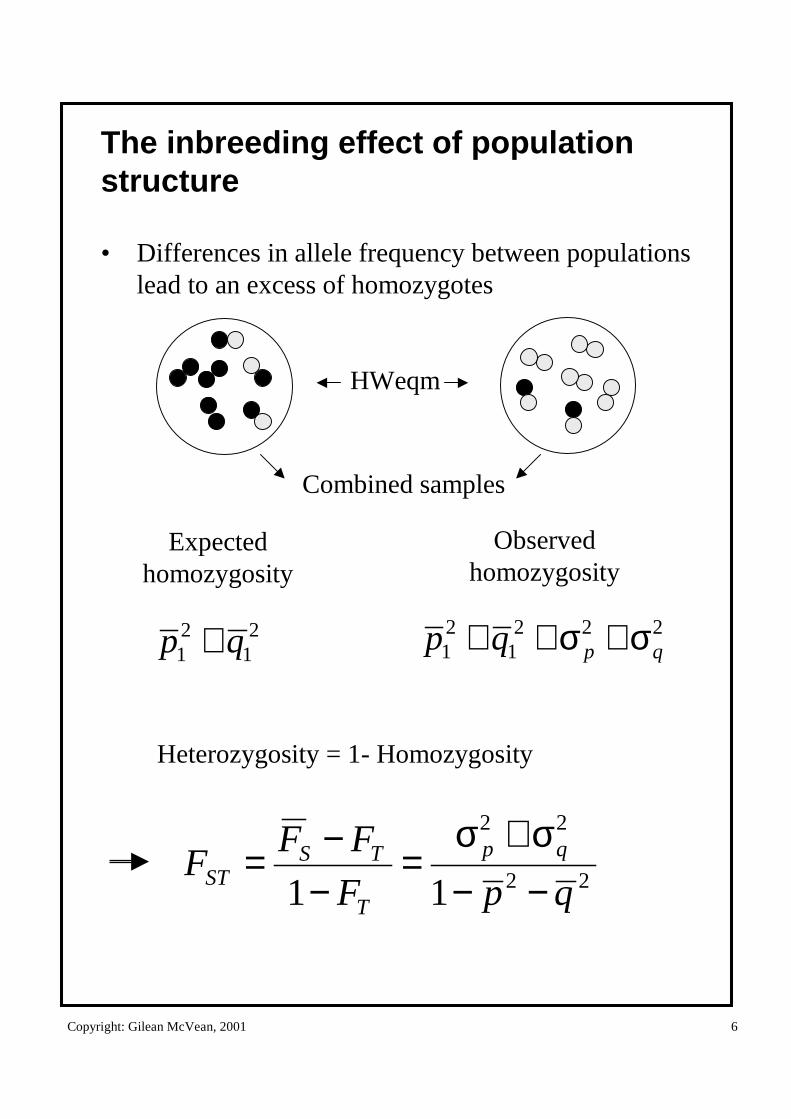
The inbreeding effect of population structure
• Differences in allele frequency between populations lead to an excess of homozygotes
21
21 qp +
HWeqm
22
22
11 qpF
FFF qp
T
TSST −−
σ+σ=
−−=
Expectedhomozygosity
Observedhomozygosity
2221
21 qpqp σ+σ++
Combined samples
Heterozygosity = 1- Homozygosity
Copyright: Gilean McVean, 2001 7
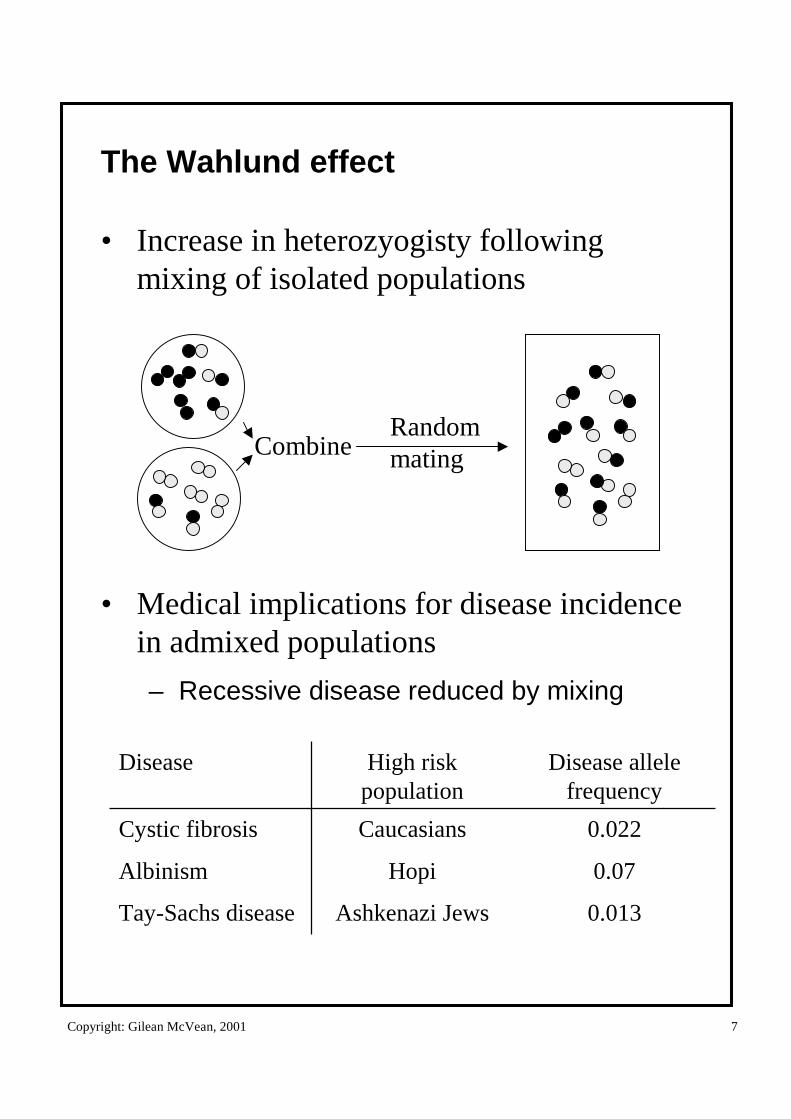
The Wahlund effect
• Increase in heterozyogisty following mixing of isolated populations
• Medical implications for disease incidence in admixed populations
– Recessive disease reduced by mixing
0.013
0.07
0.022
Disease allele frequency
Ashkenazi JewsTay-Sachs disease
HopiAlbinism
CaucasiansCystic fibrosis
High risk population
Disease
CombineRandommating
Copyright: Gilean McVean, 2001 8
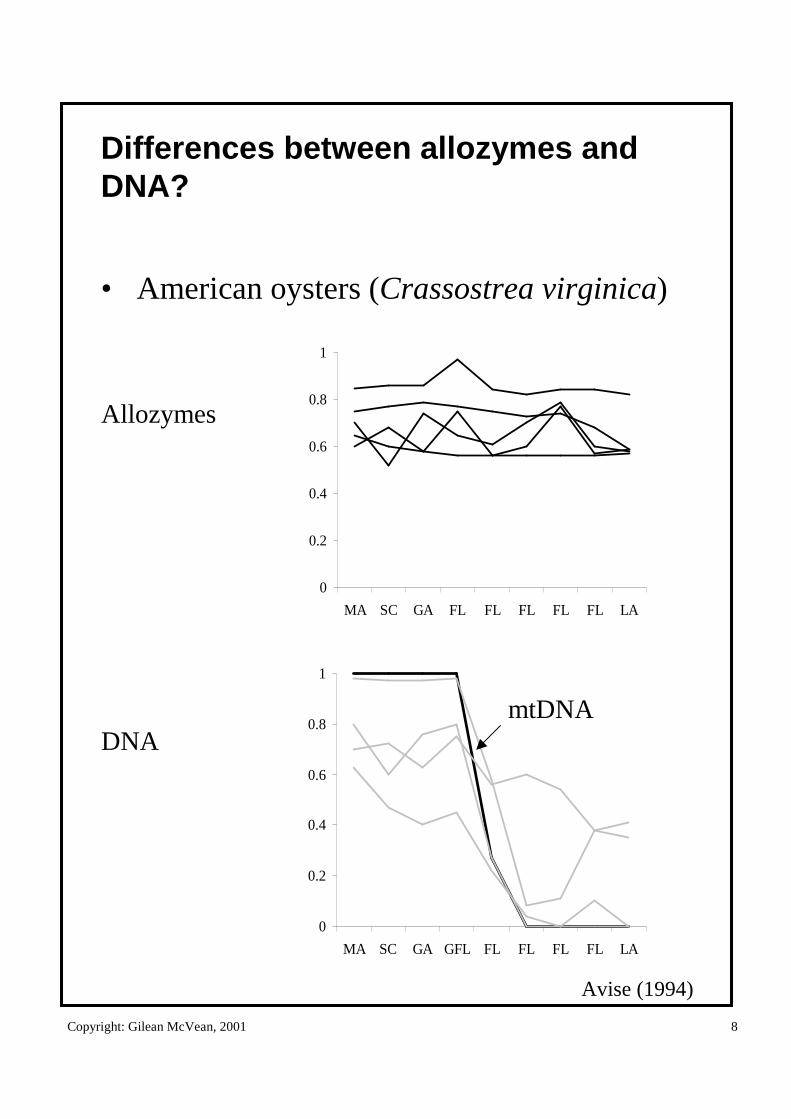
Differences between allozymes and DNA?
• American oysters (Crassostrea virginica)
0
0.2
0.4
0.6
0.8
1
MA SC GA FL FL FL FL FL LA
0
0.2
0.4
0.6
0.8
1
MA SC GA GFL FL FL FL FL LA
Allozymes
DNAmtDNA
Avise (1994)
Copyright: Gilean McVean, 2001 9
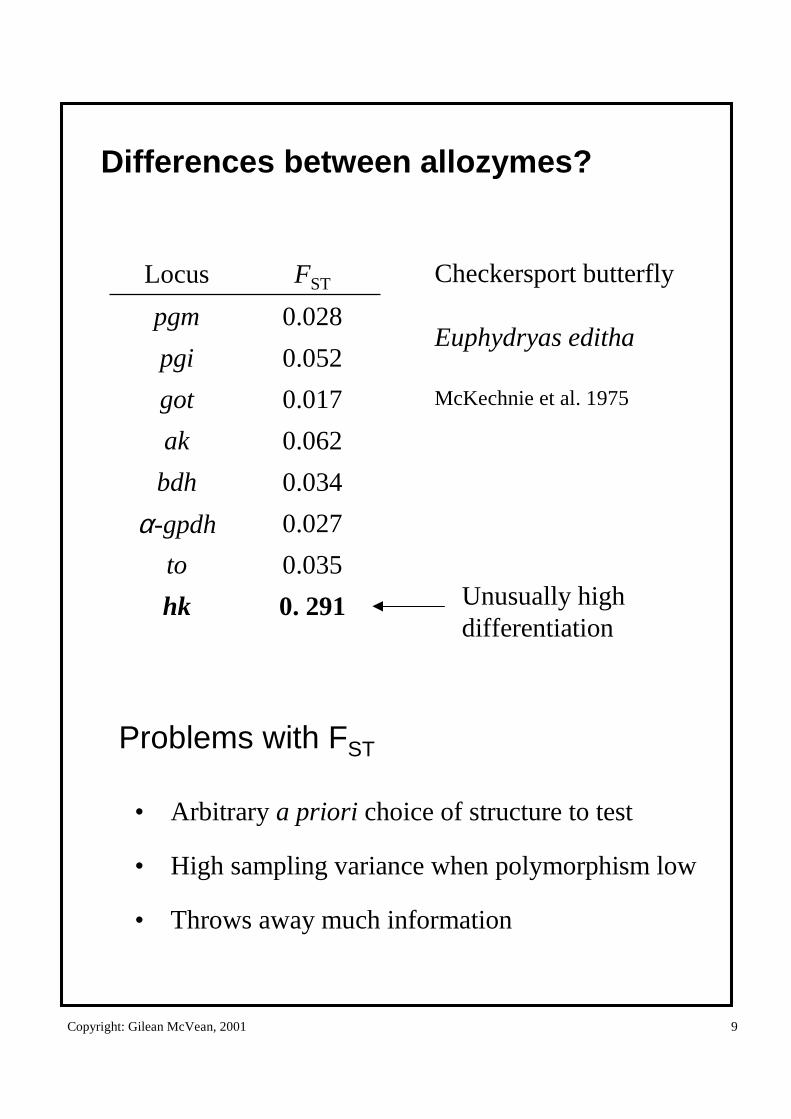
Differences between allozymes?
0. 291hk
0.035to
0.027α-gpdh
0.034bdh
0.062ak
0.017got
0.052pgi
0.028pgm
FSTLocus
Unusually high differentiation
Checkersport butterfly
Euphydryas editha
McKechnie et al. 1975
Problems with FST
• Arbitrary a priori choice of structure to test
• High sampling variance when polymorphism low
• Throws away much information
Copyright: Gilean McVean, 2001 10
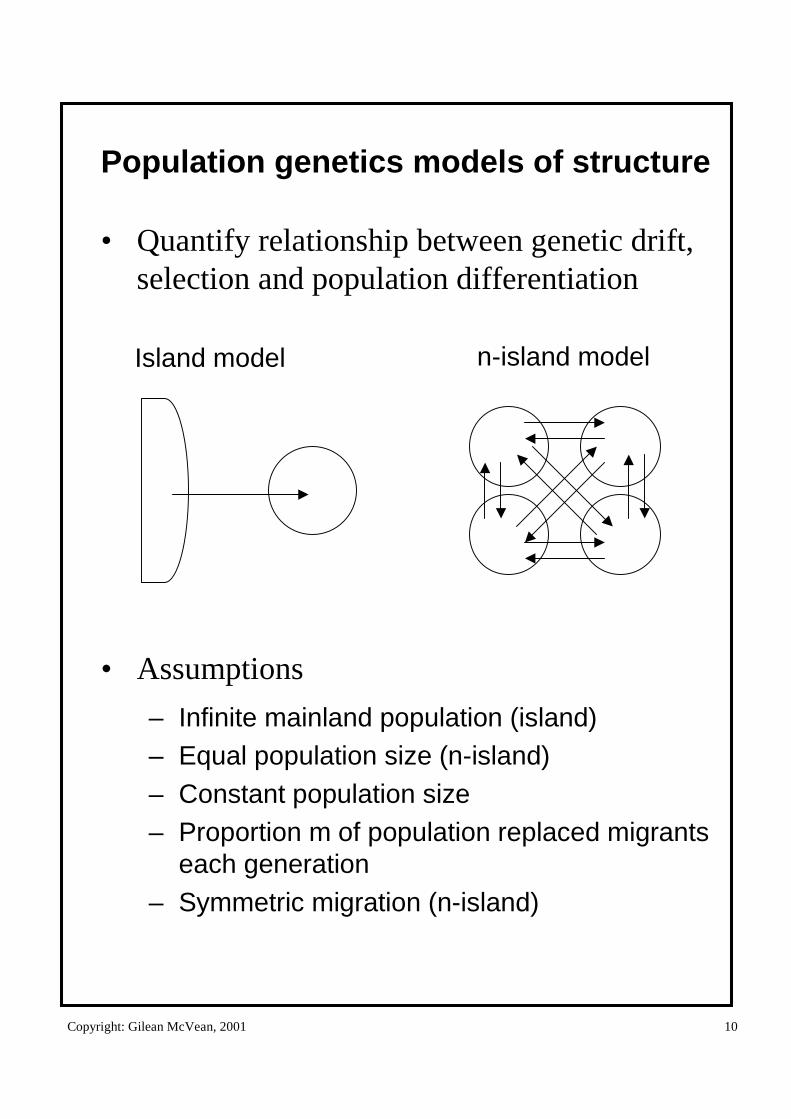
Population genetics models of structure
• Quantify relationship between genetic drift, selection and population differentiation
• Assumptions
– Infinite mainland population (island)– Equal population size (n-island)– Constant population size– Proportion m of population replaced migrants
each generation– Symmetric migration (n-island)
Island model n-island model
Copyright: Gilean McVean, 2001 11
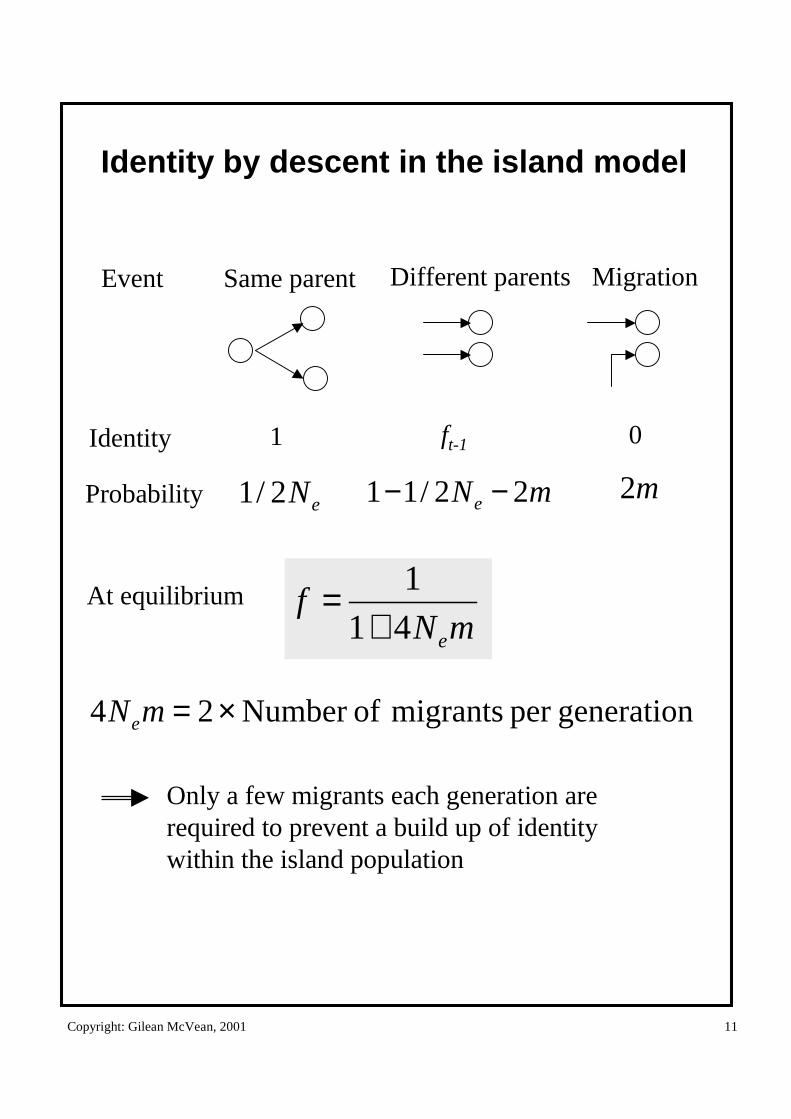
Identity by descent in the island model
1
Same parent
ft-1 0
Different parents MigrationEvent
Identity
Probability eN2/1 2mmNe 22/11 −−
At equilibriummN
fe41
1
+=
generationper migrants ofNumber 24 ×=mNe
Only a few migrants each generation are required to prevent a build up of identity within the island population
Copyright: Gilean McVean, 2001 12
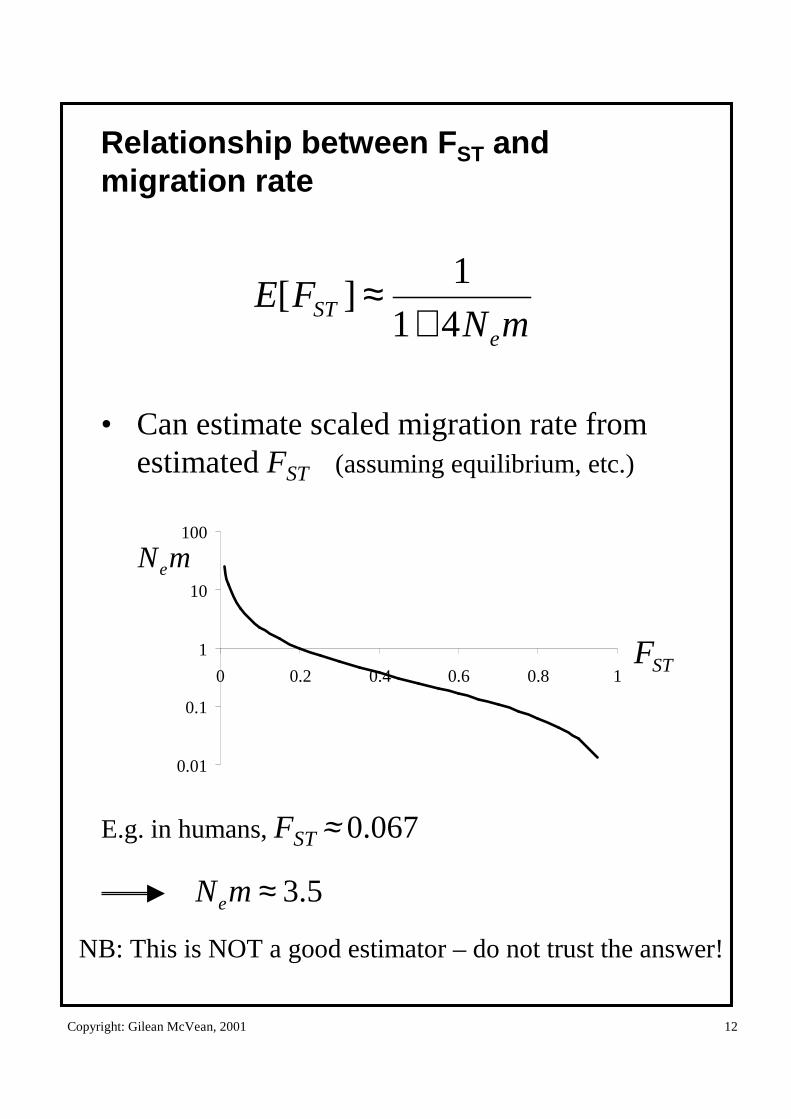
Relationship between FST and migration rate
• Can estimate scaled migration rate from estimated FST (assuming equilibrium, etc.)
mNFE
eST 41
1][
+≈
0.01
0.1
1
10
100
0 0.2 0.4 0.6 0.8 1STF
mNe
E.g. in humans, FST ≈ 0.067
5.3≈mNe
NB: This is NOT a good estimator – do not trust the answer!
Copyright: Gilean McVean, 2001 13
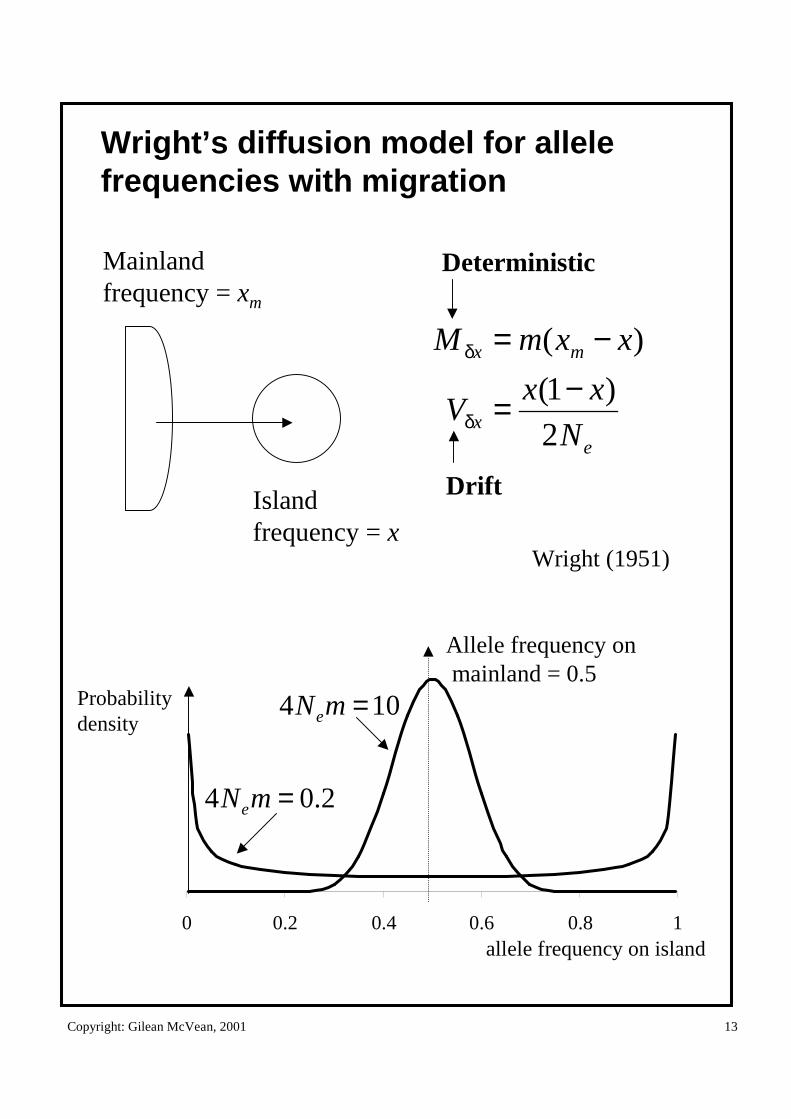
Wright’s diffusion model for allele frequencies with migration
0 0.2 0.4 0.6 0.8 1
Allele frequency onmainland = 0.5
Probability density
104 =mNe
2.04 =mNe
allele frequency on island
Mainlandfrequency = xm
ex
mx
N
xxV
xxmM
2
)1(
)(
−=
−=
δ
δ
Islandfrequency = x
Wright (1951)
Deterministic
Drift
Copyright: Gilean McVean, 2001 14
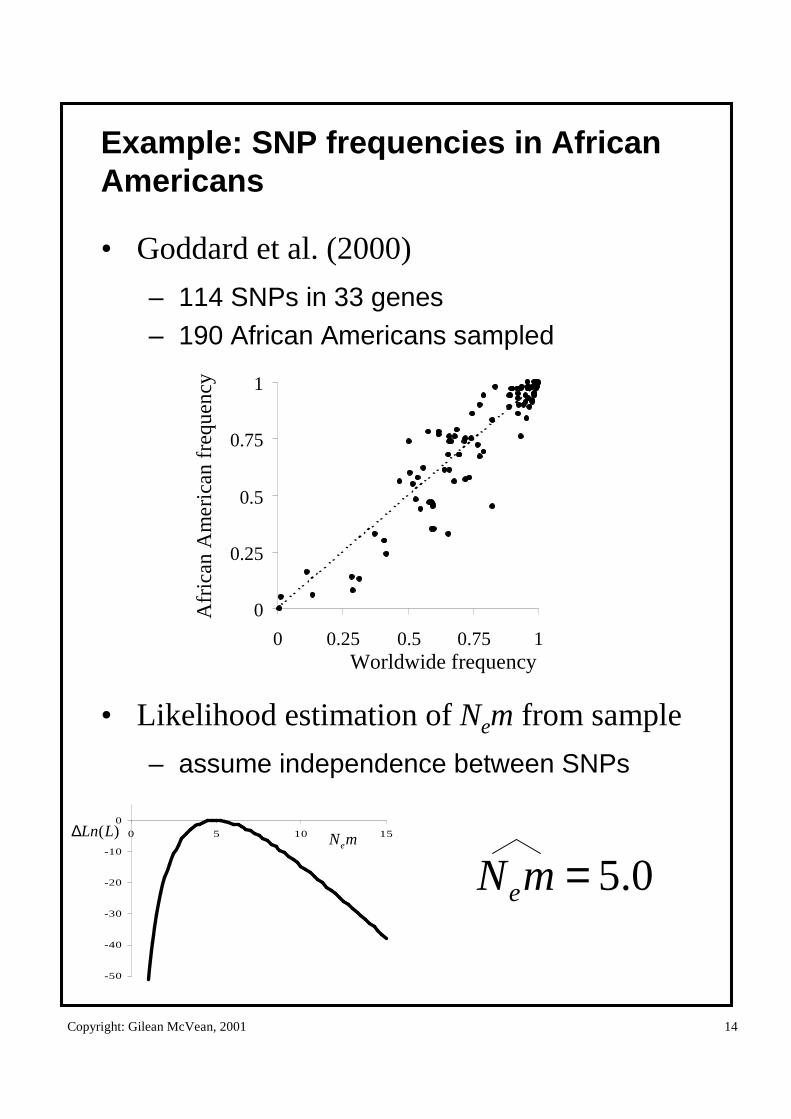
Example: SNP frequencies in African Americans
• Goddard et al. (2000)
– 114 SNPs in 33 genes– 190 African Americans sampled
• Likelihood estimation of Nem from sample
– assume independence between SNPs
0
0.25
0.5
0.75
1
0 0.25 0.5 0.75 1Worldwide frequency
Afr
ican
Am
eric
an f
requ
ency
-50
-40
-30
-20
-10
0
0 5 10 15
0.5=mNe
)(LLn∆ mNe
Copyright: Gilean McVean, 2001 15
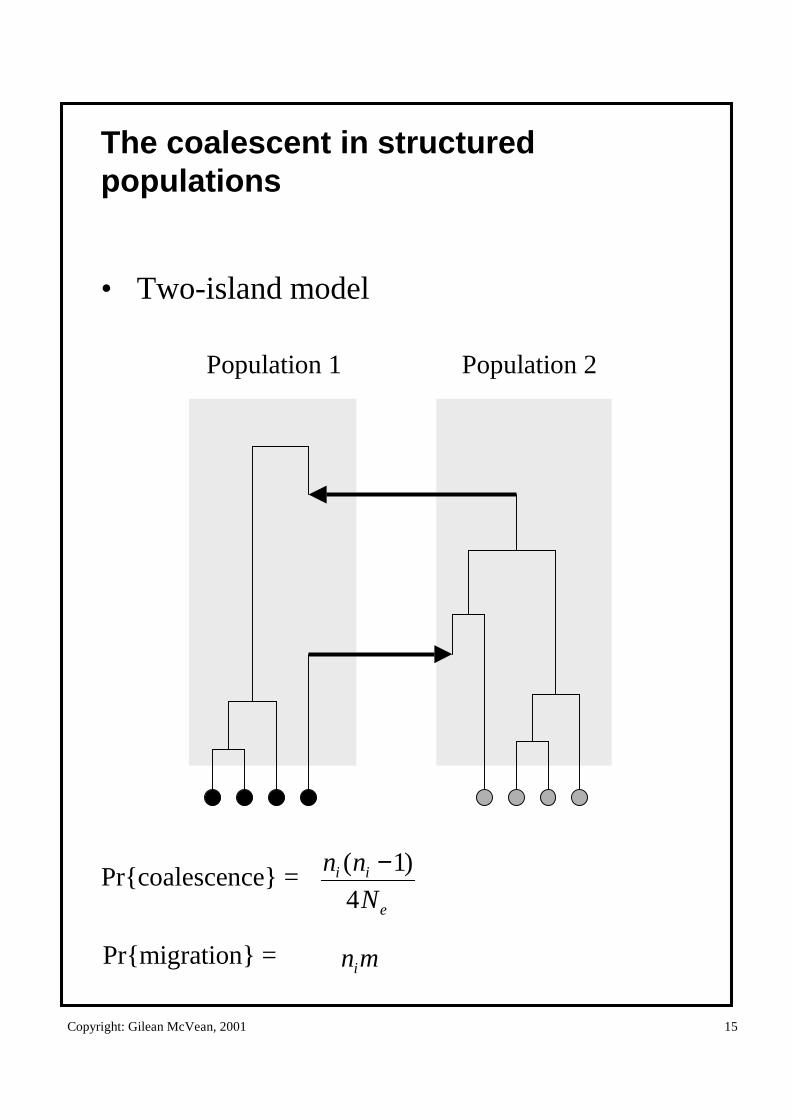
The coalescent in structured populations
• Two-island model
Population 1 Population 2
Pr{coalescence} =e
ii
N
nn
4
)1( −
Pr{migration} = mni
Copyright: Gilean McVean, 2001 16
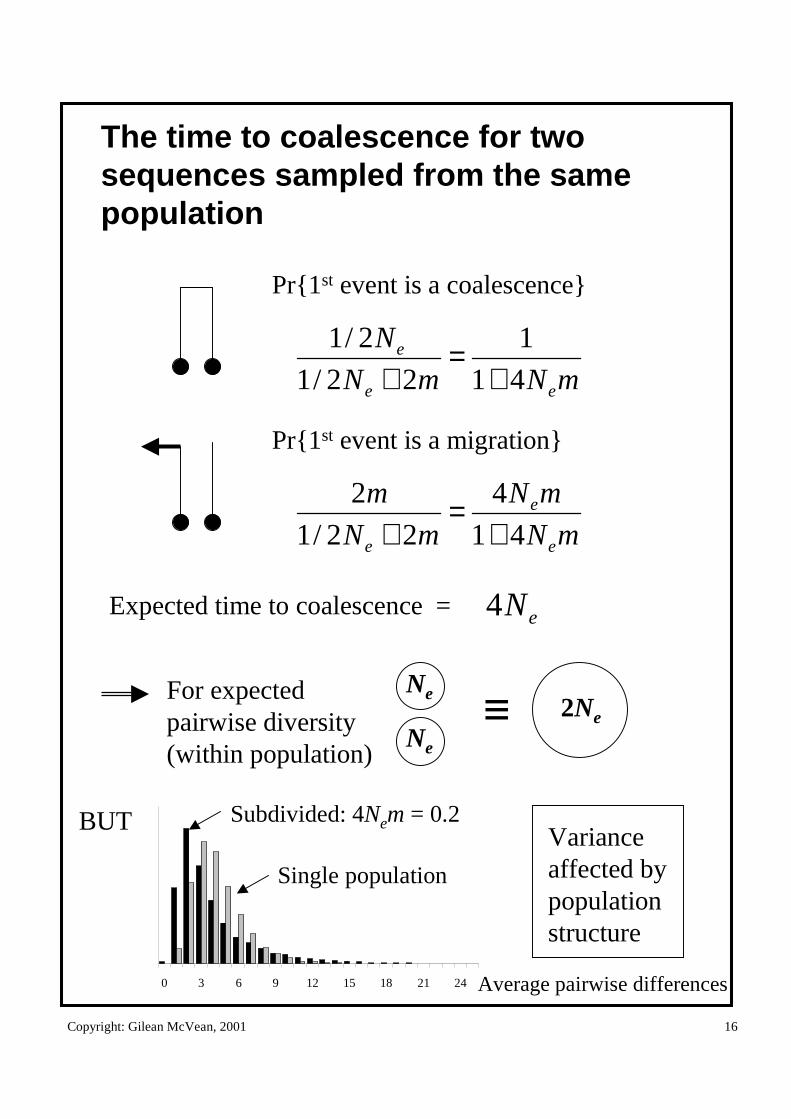
The time to coalescence for two sequences sampled from the same population
Pr{1st event is a coalescence}
mNmN
N
ee
e
41
1
22/1
2/1
+=
+
Pr{1st event is a migration}
mN
mN
mN
m
e
e
e 41
4
22/1
2
+=
+
Expected time to coalescence = eN4
Ne
Ne
2Ne≡For expectedpairwise diversity (within population)
BUT
0 3 6 9 12 15 18 21 24
Subdivided: 4Nem = 0.2
Single population
Variance affected by population structure
Average pairwise differences
Copyright: Gilean McVean, 2001 17
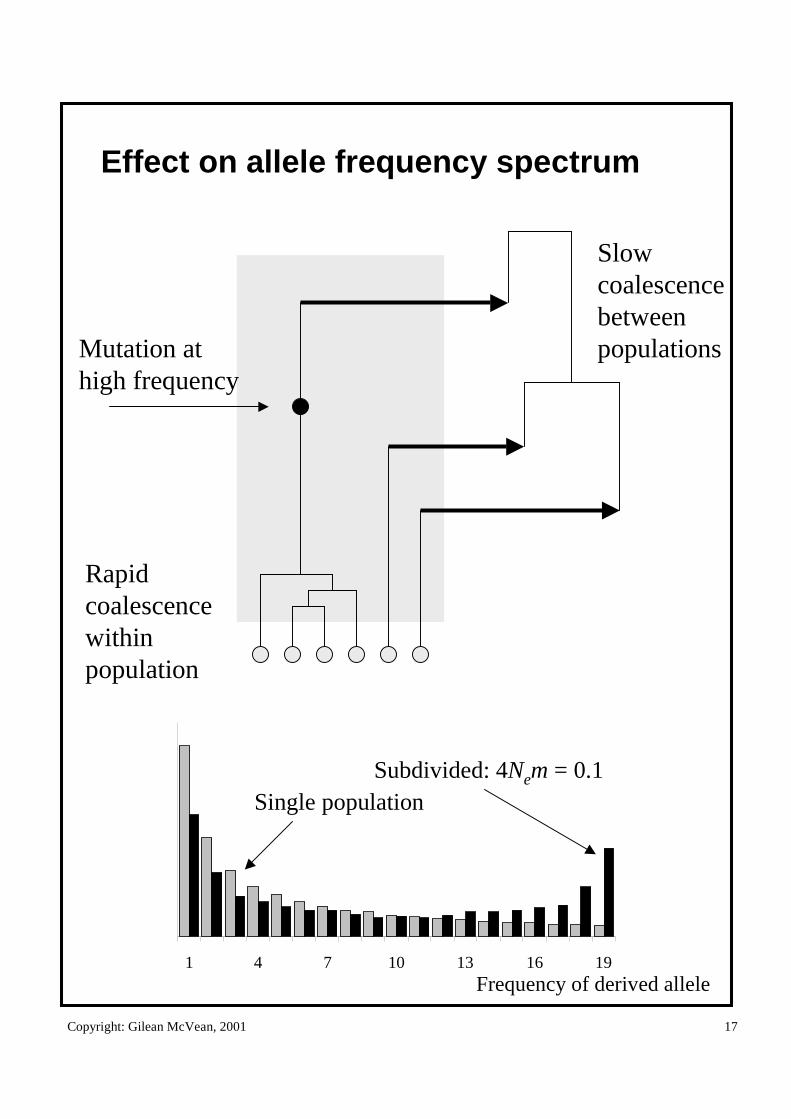
Effect on allele frequency spectrum
Rapid coalescencewithin population
Slow coalescence between populationsMutation at
high frequency
1 4 7 10 13 16 19Frequency of derived allele
Subdivided: 4Nem = 0.1Single population
Copyright: Gilean McVean, 2001 18
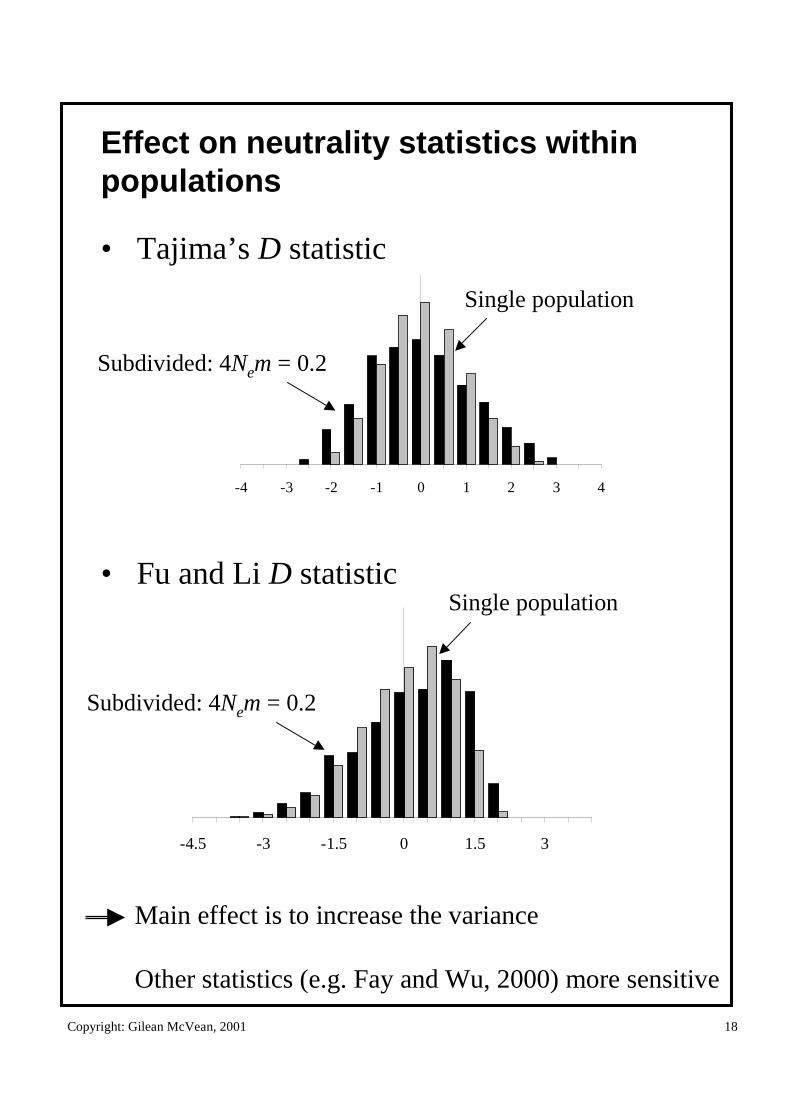
Effect on neutrality statistics within populations
• Tajima’s D statistic
• Fu and Li D statistic
-4 -3 -2 -1 0 1 2 3 4
Subdivided: 4Nem = 0.2
Single population
Main effect is to increase the variance
Other statistics (e.g. Fay and Wu, 2000) more sensitive
-4.5 -3 -1.5 0 1.5 3
Subdivided: 4Nem = 0.2
Single population
Copyright: Gilean McVean, 2001 19
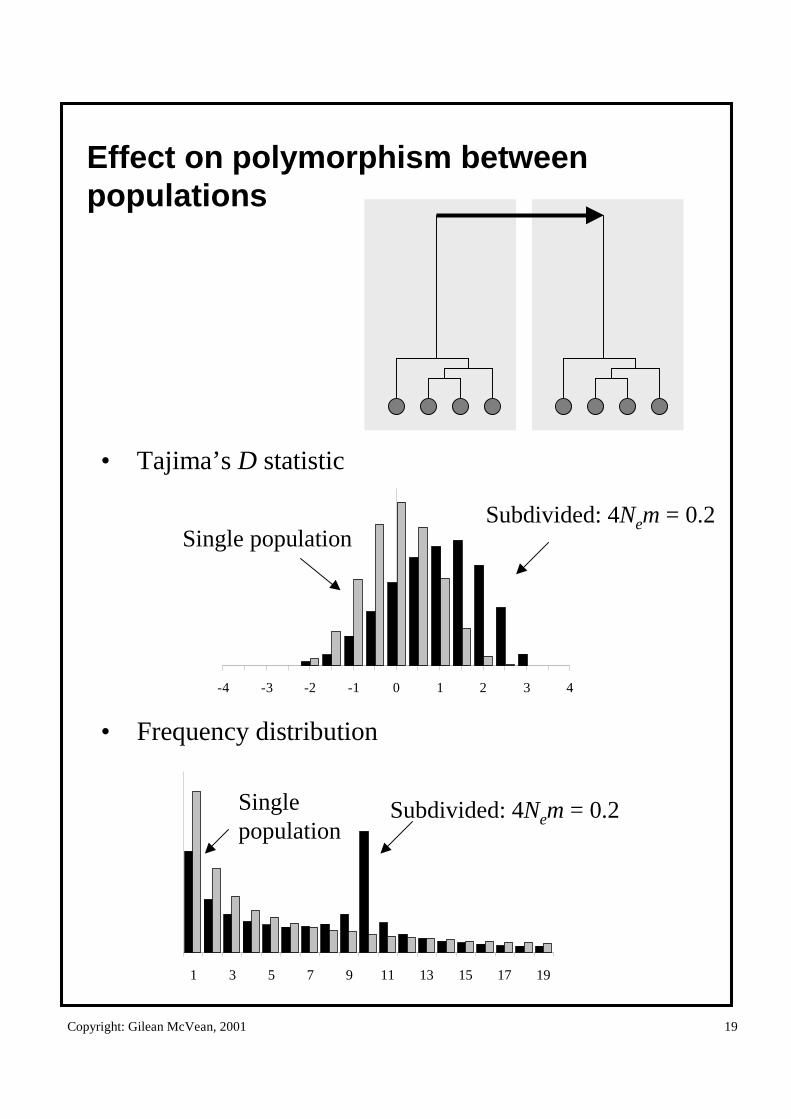
Effect on polymorphism between populations
-4 -3 -2 -1 0 1 2 3 4
• Tajima’s D statistic
• Frequency distribution
Subdivided: 4Nem = 0.2Single population
1 3 5 7 9 11 13 15 17 19
Subdivided: 4Nem = 0.2Singlepopulation
Copyright: Gilean McVean, 2001 20
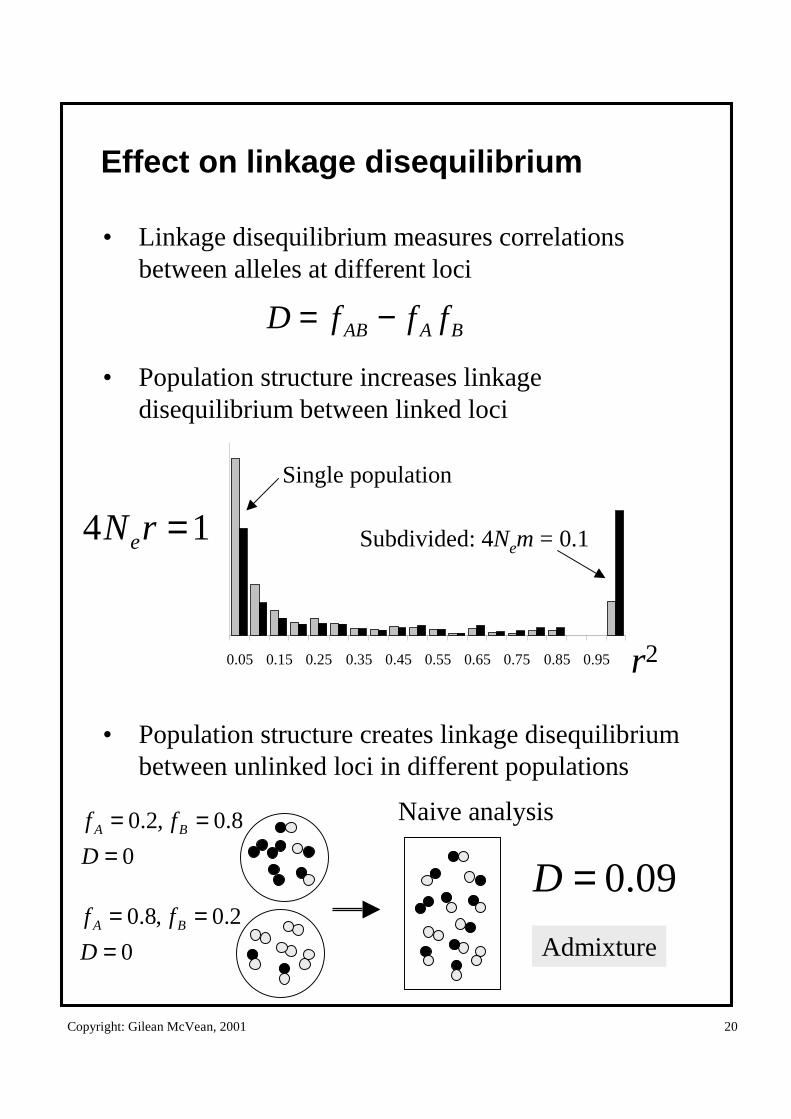
Effect on linkage disequilibrium
• Linkage disequilibrium measures correlations between alleles at different loci
• Population structure increases linkage disequilibrium between linked loci
• Population structure creates linkage disequilibrium between unlinked loci in different populations
0.05 0.15 0.25 0.35 0.45 0.55 0.65 0.75 0.85 0.95 r2
Subdivided: 4Nem = 0.1
Single population
14 =rNe
BAAB fffD −=
0
8.0,2.0
===
D
ff BA
0
2.0,8.0
===
D
ff BA
Naive analysis
09.0=D
Admixture
Copyright: Gilean McVean, 2001 21
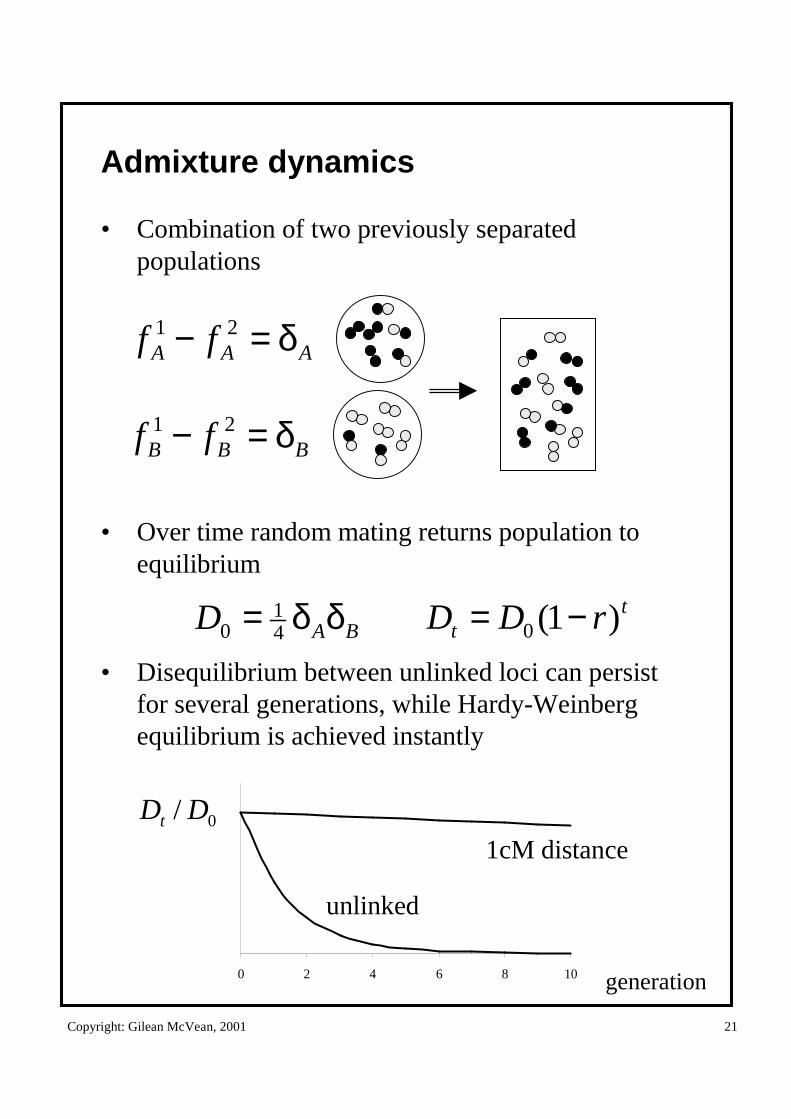
Admixture dynamics
• Combination of two previously separated populations
• Over time random mating returns population to equilibrium
• Disequilibrium between unlinked loci can persist for several generations, while Hardy-Weinberg equilibrium is achieved instantly
tt rDD )1(0 −=BAD δδ= 4
10
AAA ff δ=− 21
BBB ff δ=− 21
0 2 4 6 8 10
0/ DDt
unlinked
1cM distance
generation
Copyright: Gilean McVean, 2001 22
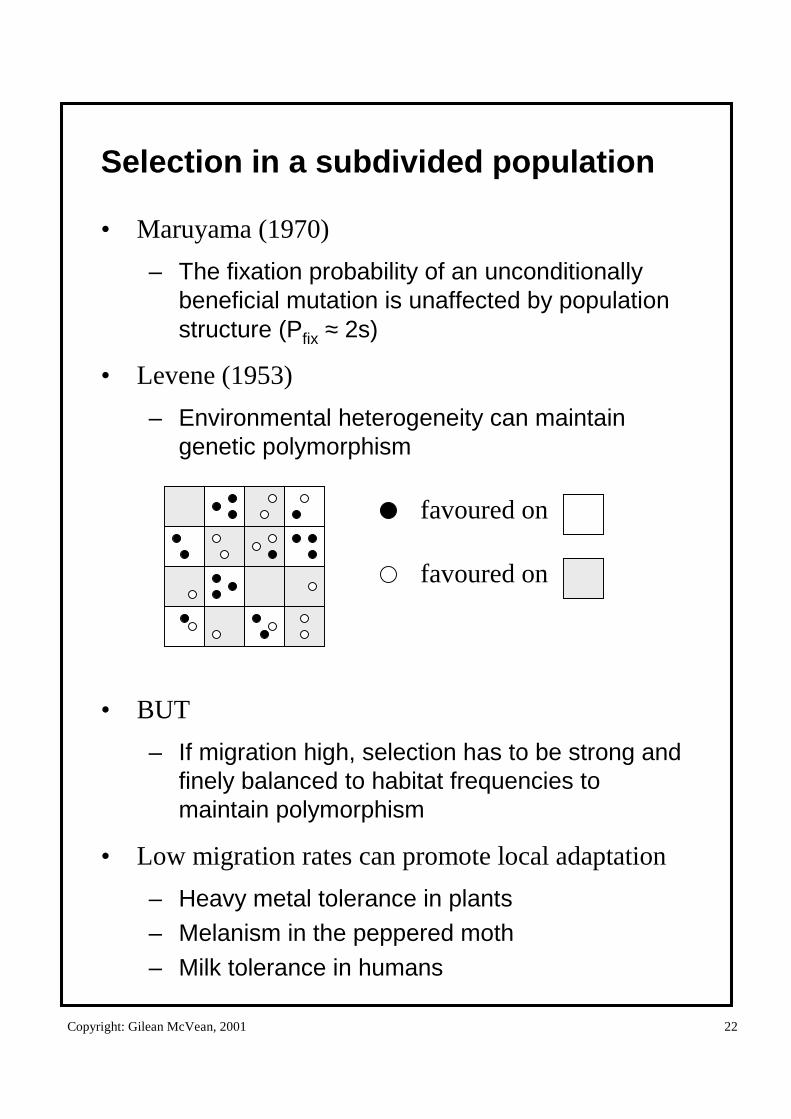
Selection in a subdivided population
• Maruyama (1970)
– The fixation probability of an unconditionally beneficial mutation is unaffected by population structure (Pfix ≈ 2s)
• Levene (1953)
– Environmental heterogeneity can maintain genetic polymorphism
• BUT
– If migration high, selection has to be strong and finely balanced to habitat frequencies to maintain polymorphism
• Low migration rates can promote local adaptation
– Heavy metal tolerance in plants– Melanism in the peppered moth
– Milk tolerance in humans
favoured on
favoured on
Copyright: Gilean McVean, 2001 23
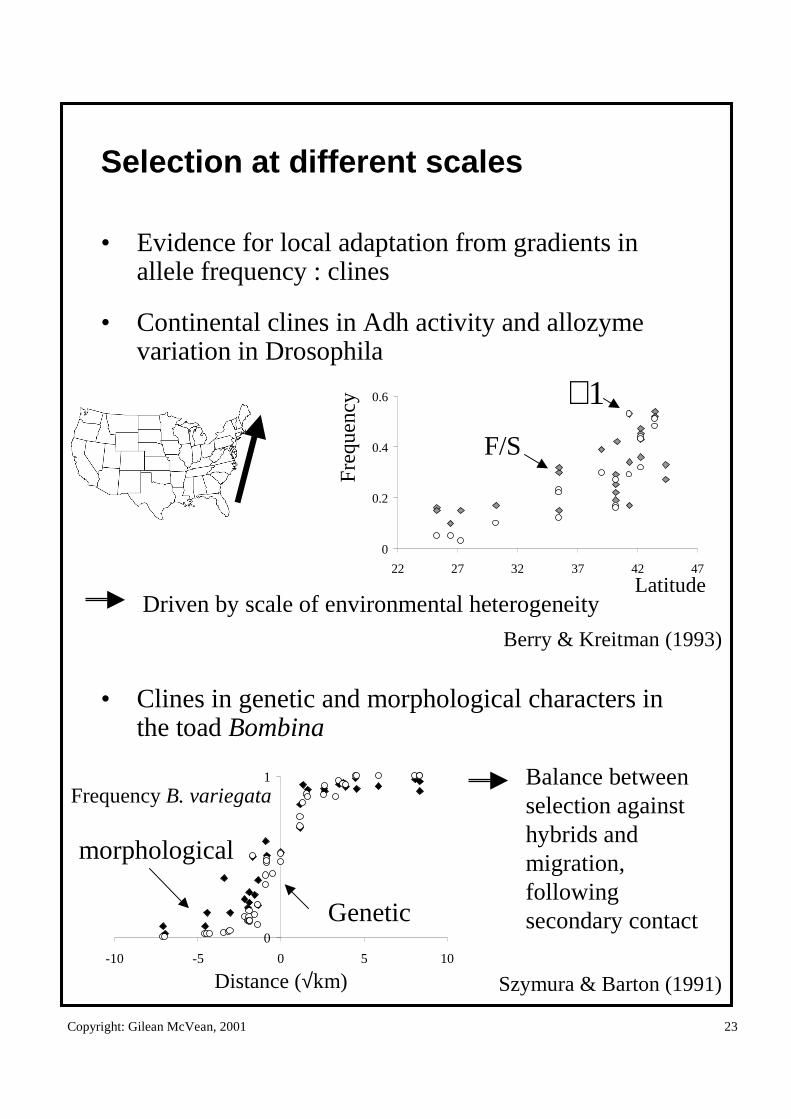
Selection at different scales
• Evidence for local adaptation from gradients in allele frequency : clines
• Continental clines in Adh activity and allozyme variation in Drosophila
• Clines in genetic and morphological characters in the toad Bombina
Driven by scale of environmental heterogeneity
Balance between selection against hybrids and migration, following secondary contact
0
0.2
0.4
0.6
22 27 32 37 42 47
Latitude
Freq
uenc
y
F/S
1∇
0
1
-10 -5 0 5 10
Distance (√km)
Frequency B. variegata
morphological
Genetic
Berry & Kreitman (1993)
Szymura & Barton (1991)
Copyright: Gilean McVean, 2001 24
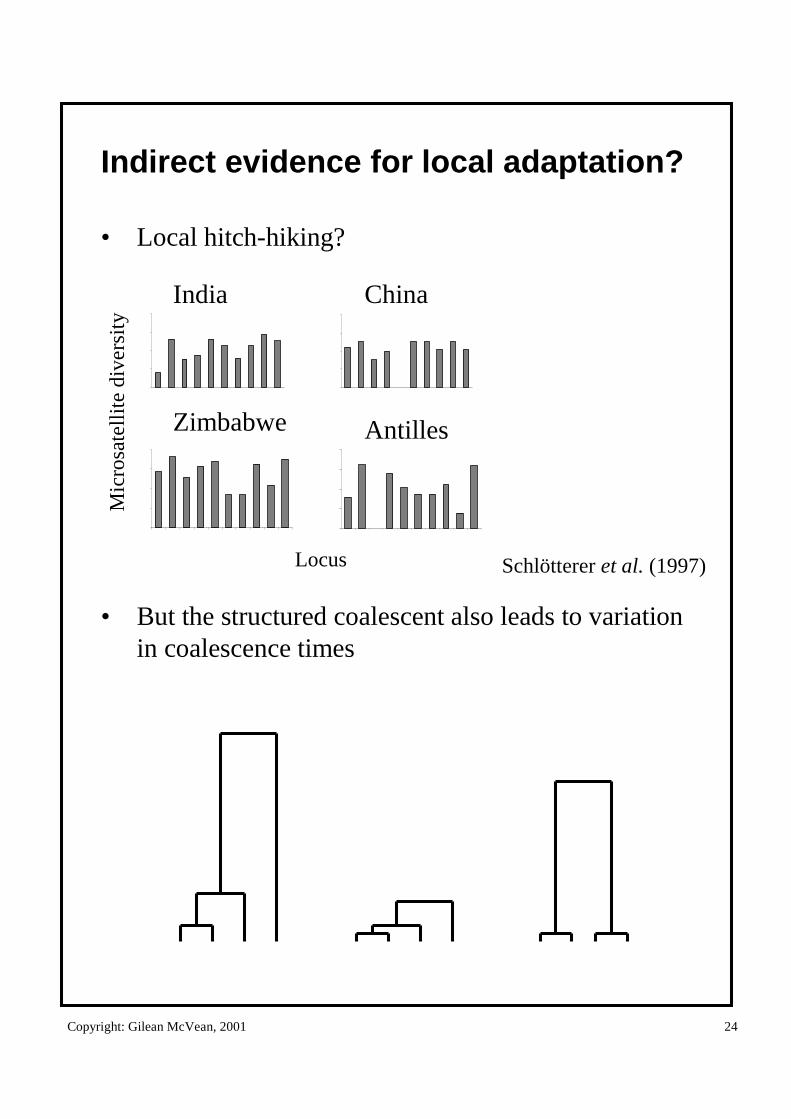
Indirect evidence for local adaptation?
• Local hitch-hiking?
• But the structured coalescent also leads to variation in coalescence times
India
Zimbabwe
China
Antilles
Mic
rosa
tell
ite
dive
rsit
y
Locus Schlötterer et al. (1997)
Copyright: Gilean McVean, 2001 25
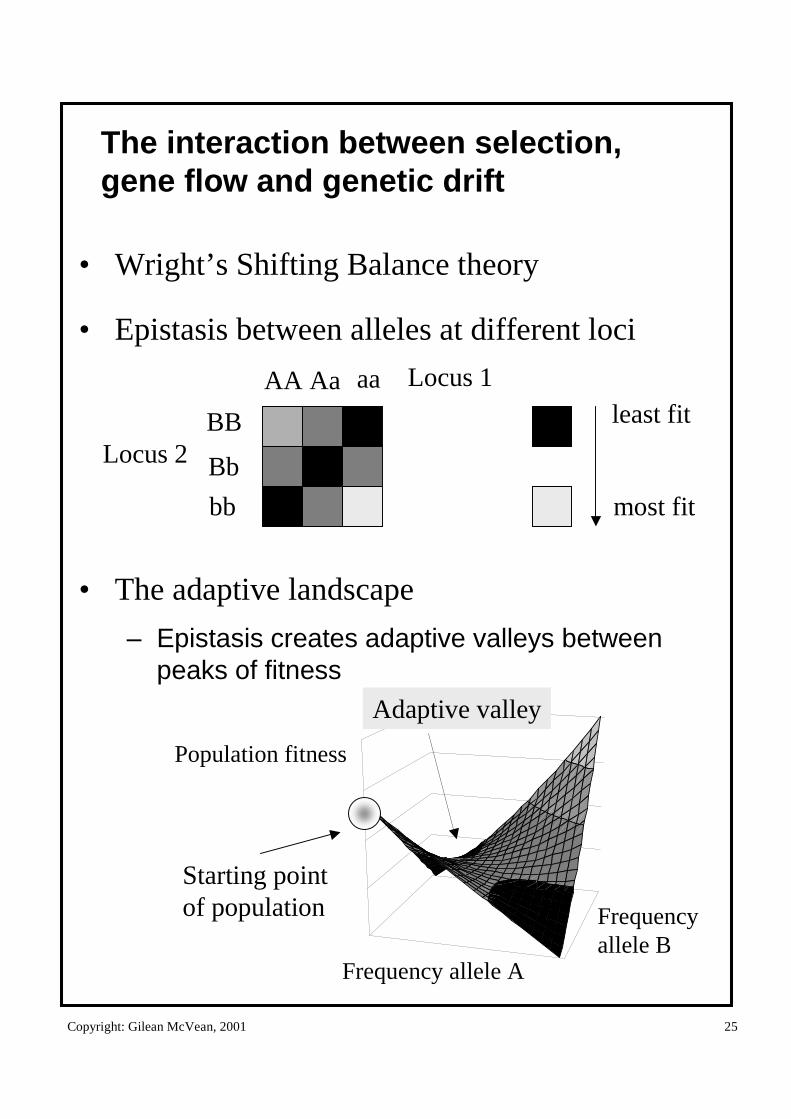
The interaction between selection, gene flow and genetic drift
• Wright’s Shifting Balance theory
• Epistasis between alleles at different loci
• The adaptive landscape
– Epistasis creates adaptive valleys between peaks of fitness
Population fitness
Frequency allele A
Frequencyallele B
Adaptive valley
Starting pointof population
AA Aa aa
BB
Bb
bb
Locus 2
Locus 1least fit
most fit
Copyright: Gilean McVean, 2001 26
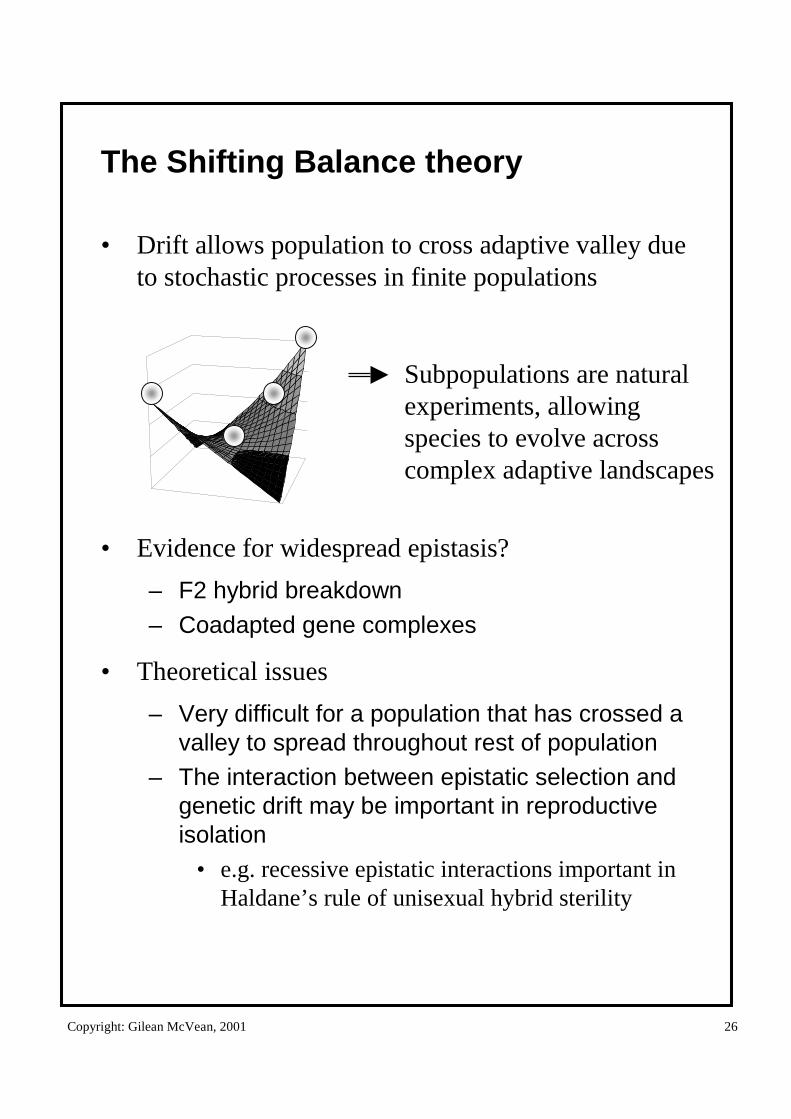
The Shifting Balance theory
• Drift allows population to cross adaptive valley due to stochastic processes in finite populations
• Evidence for widespread epistasis?
– F2 hybrid breakdown
– Coadapted gene complexes
• Theoretical issues
– Very difficult for a population that has crossed a valley to spread throughout rest of population
– The interaction between epistatic selection and genetic drift may be important in reproductive isolation
• e.g. recessive epistatic interactions important in Haldane’s rule of unisexual hybrid sterility
Subpopulations are natural experiments, allowing species to evolve across complex adaptive landscapes
Copyright: Gilean McVean, 2001 27
Future directions
• Theoretical and statistical issues– Methods for discriminating between local
adaptation and chance effects of coalescence in a structured population
– The relationship between population structure and linkage disequilibrium
– Selection on polygenic traits in subdivided populations
• Empirical challenges– Describing patterns of gene diversity at
many loci across genomes (from an well-chosen sample)
– Comparing differentiation for different types of mutation (e.g. silent v replacement)
– Mapping genetic variation to phenotypic variation
Recommended


![Burden of Lupus Nephritis among Patients Managed in ... · Keywords: Lupus Nephritis, Burden, Flares, Hospitalizations, Europe . 1. ... compared with Caucasians (14%) [5].Approximately](https://img.pdfslide.us/doc/110x75/5f08e9627e708231d42452c4/burden-of-lupus-nephritis-among-patients-managed-in-keywords-lupus-nephritis.jpg)