Business benefits of a PLM system
1
Factors leading to PLM
2
Growing competition
and tighter budgets
Internationalization
of business
Company
mergers
Shortening
delivery times
Less time available for
developing new products
Tightening quality requirements
Regulations and common industry standards
Tightening
legislation
“processes need to change”
“increasing product data”
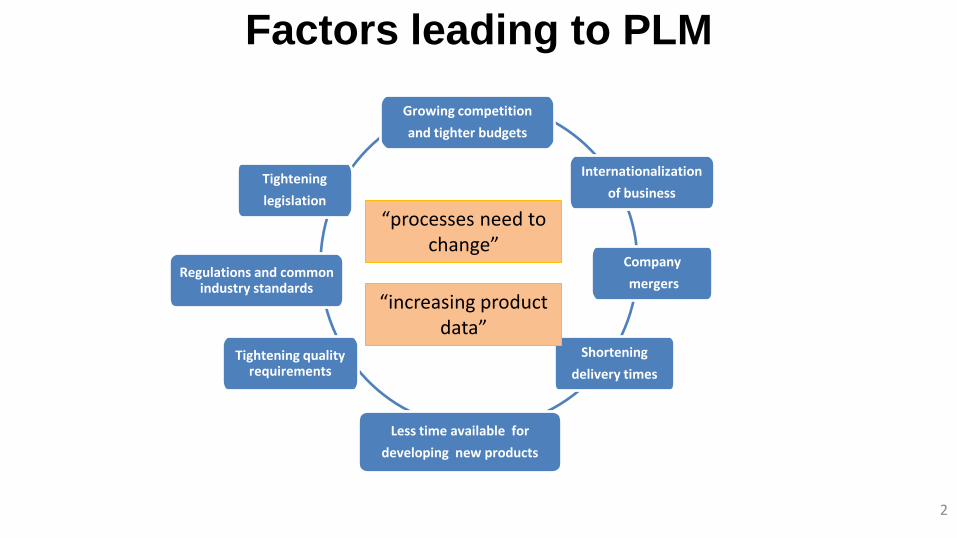
Changing mode of operations
3
Increased manufacturing
automation
Expanded Product portfolios
Increased customer
involvement
More sub-contracted work
Changed organization
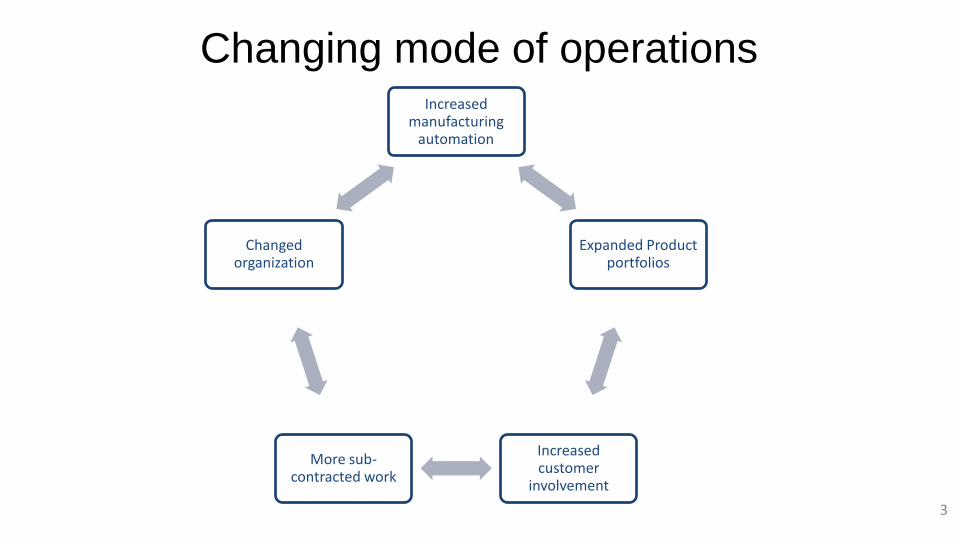
Impacts of the changes in the business environment
4
Major Problems:
Finding the right product-related
information
Retaining the entirety of this
information
The Main Reasons:
Increasing variations of the products
Increasing amount of product information
Increasing complexity of companies’ supply networks.
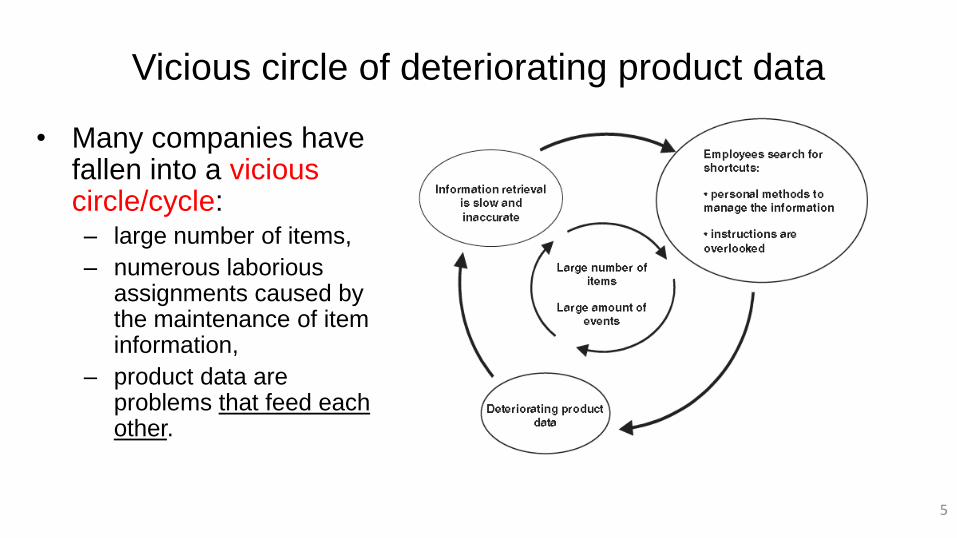
Vicious circle of deteriorating product data
• Many companies have fallen into a vicious circle/cycle: – large number of items,
– numerous laborious assignments caused by the maintenance of item information,
– product data are problems that feed each other.
5
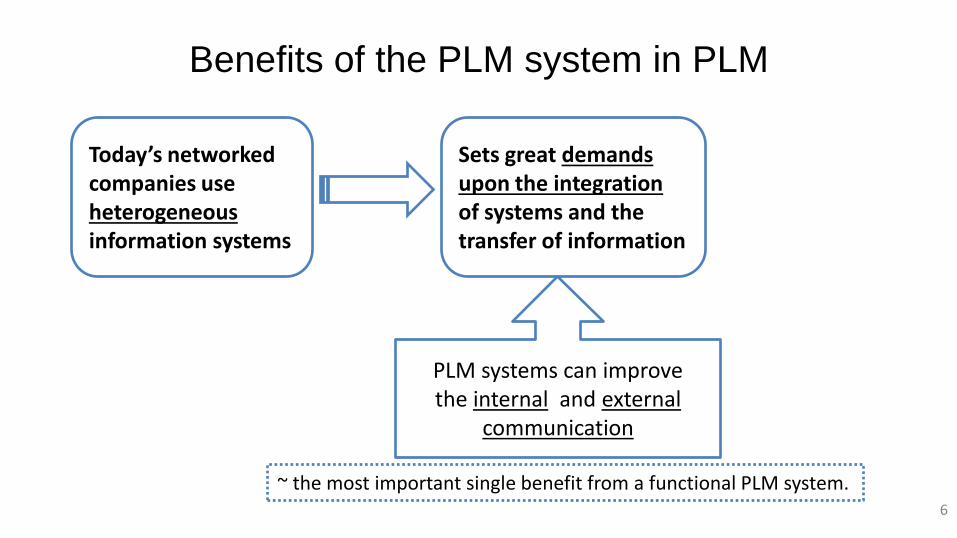
~ the most important single benefit from a functional PLM system.
Benefits of the PLM system in PLM
6
Today’s networked companies use heterogeneous information systems
Sets great demands upon the integration of systems and the transfer of information
PLM systems can improve the internal and external
communication
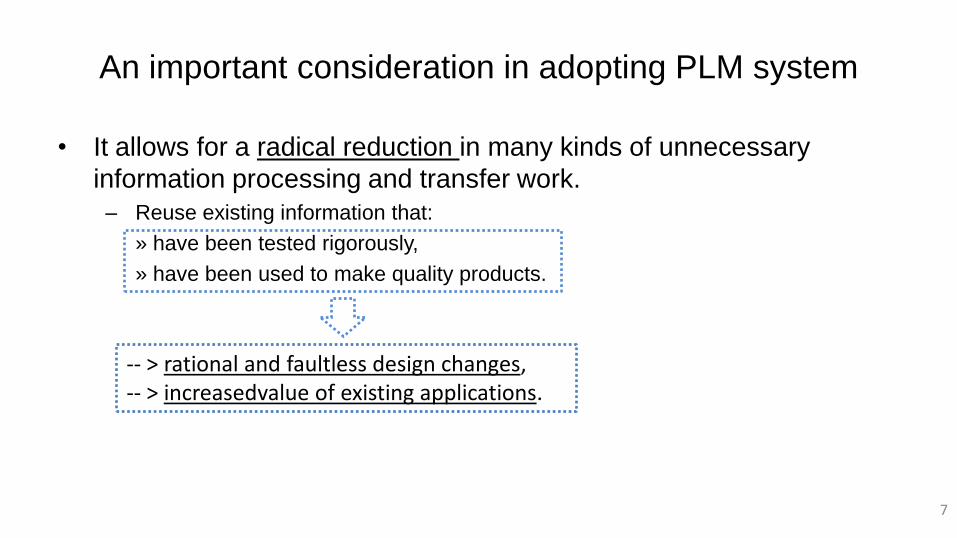
An important consideration in adopting PLM system
• It allows for a radical reduction in many kinds of unnecessary
information processing and transfer work.
– Reuse existing information that:
» have been tested rigorously,
» have been used to make quality products.
7
-- > rational and faultless design changes, -- > increasedvalue of existing applications.
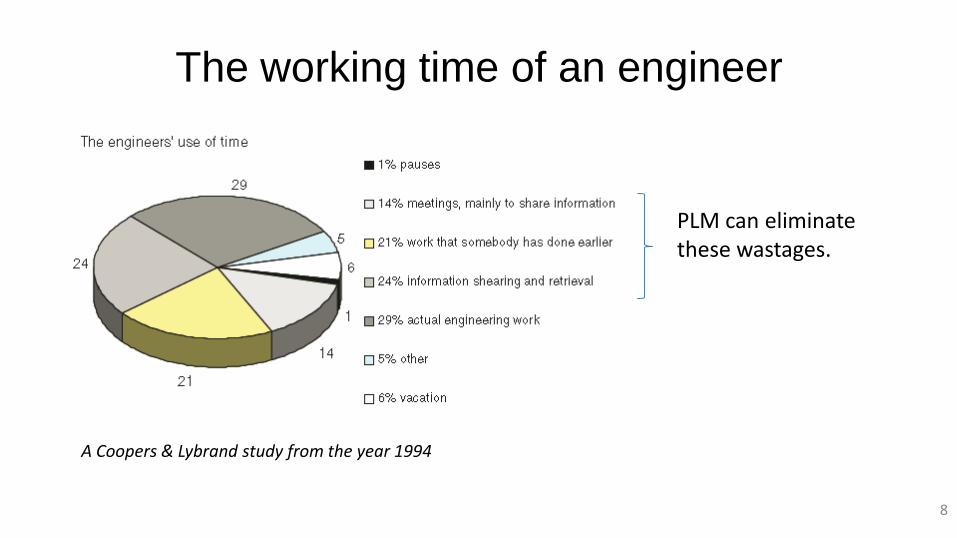
The working time of an engineer
8
A Coopers & Lybrand study from the year 1994
PLM can eliminate these wastages.
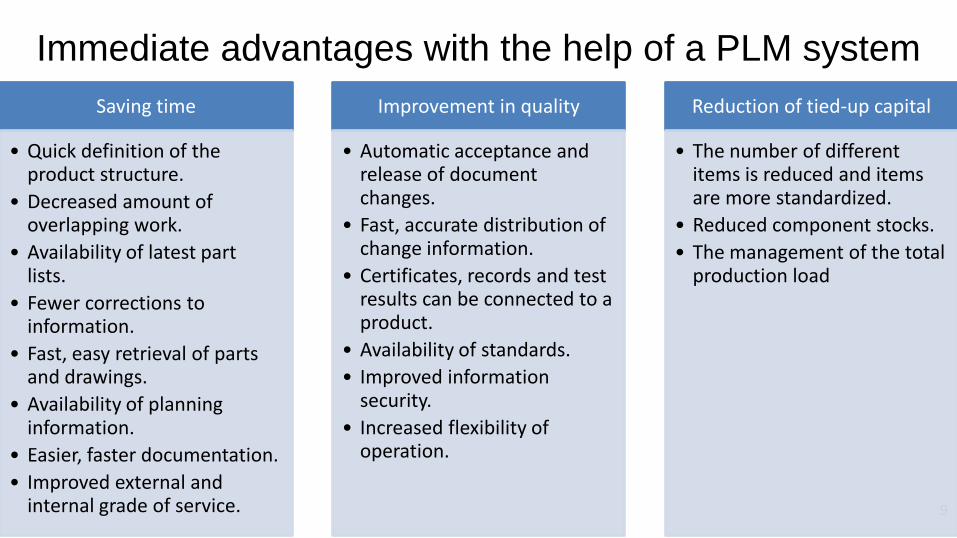
Immediate advantages with the help of a PLM system
9
Saving time
• Quick definition of the product structure.
• Decreased amount of overlapping work.
• Availability of latest part lists.
• Fewer corrections to information.
• Fast, easy retrieval of parts and drawings.
• Availability of planning information.
• Easier, faster documentation.
• Improved external and internal grade of service.
Improvement in quality
• Automatic acceptance and release of document changes.
• Fast, accurate distribution of change information.
• Certificates, records and test results can be connected to a product.
• Availability of standards.
• Improved information security.
• Increased flexibility of operation.
Reduction of tied-up capital
• The number of different items is reduced and items are more standardized.
• Reduced component stocks.
• The management of the total production load
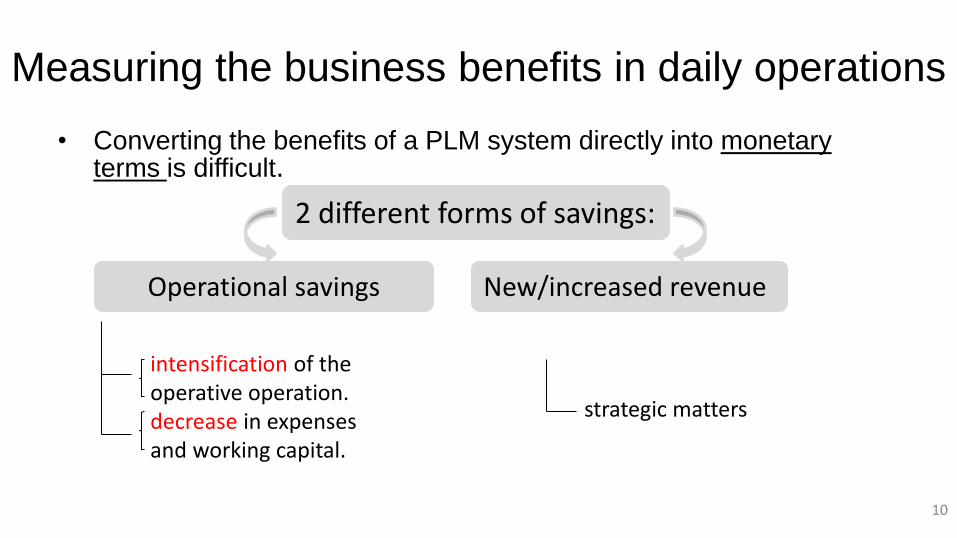
Measuring the business benefits in daily operations
• Converting the benefits of a PLM system directly into monetary terms is difficult.
10
2 different forms of savings:
Operational savings New/increased revenue
intensification of the operative operation. decrease in expenses and working capital.
strategic matters
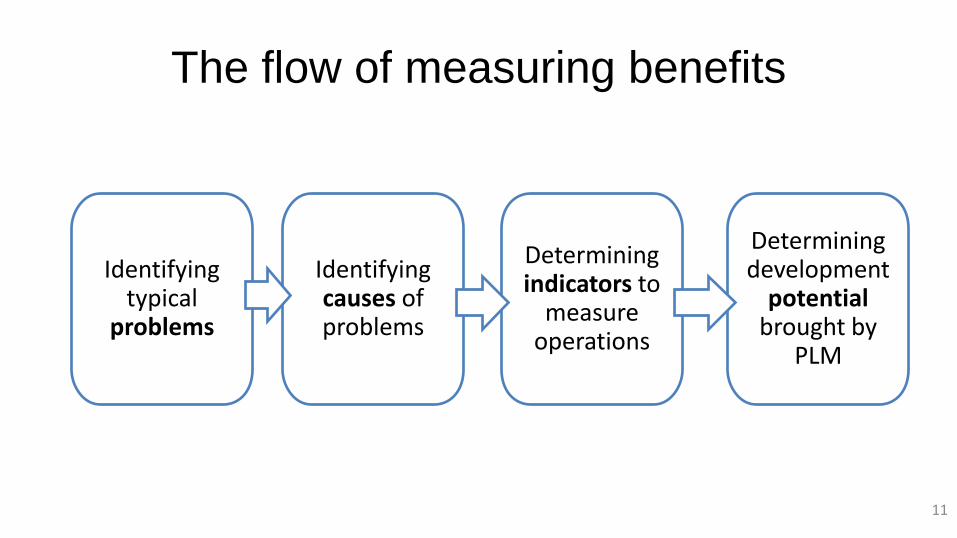
The flow of measuring benefits
11
Identifying typical
problems
Identifying causes of problems
Determining indicators to
measure operations
Determining development
potential brought by
PLM
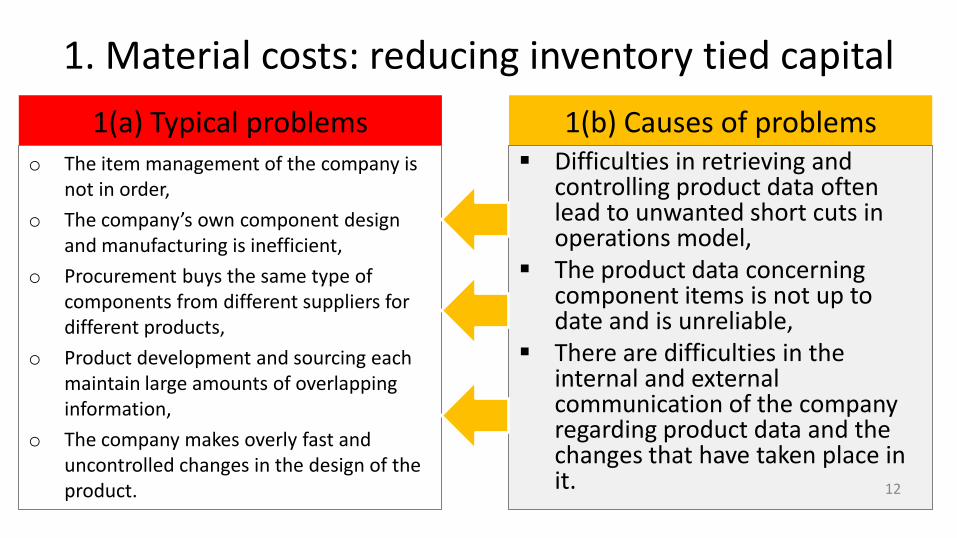
1. Material costs: reducing inventory tied capital
1(a) Typical problems o The item management of the company is
not in order,
o The company’s own component design and manufacturing is inefficient,
o Procurement buys the same type of components from different suppliers for different products,
o Product development and sourcing each maintain large amounts of overlapping information,
o The company makes overly fast and uncontrolled changes in the design of the product.
1(b) Causes of problems Difficulties in retrieving and
controlling product data often lead to unwanted short cuts in operations model,
The product data concerning component items is not up to date and is unreliable,
There are difficulties in the internal and external communication of the company regarding product data and the changes that have taken place in it.
12
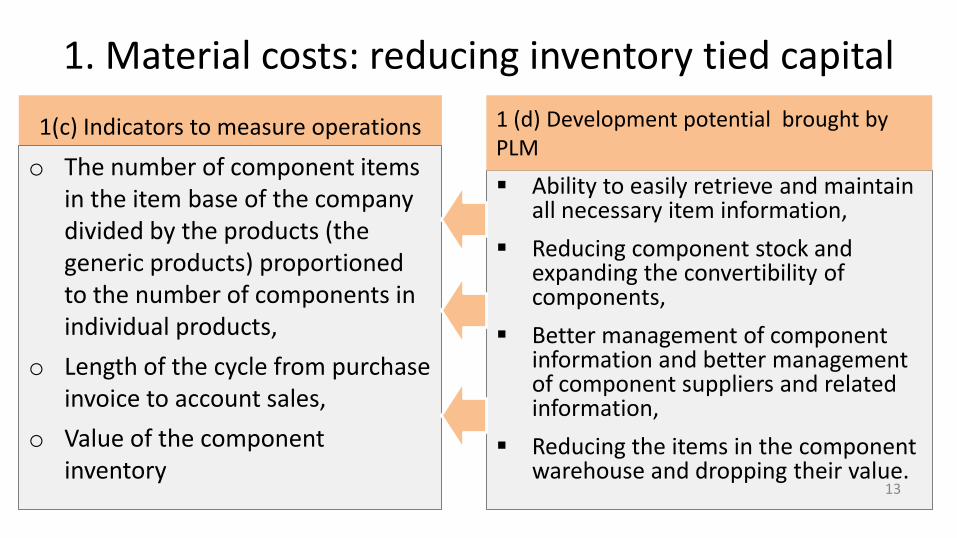
1. Material costs: reducing inventory tied capital
1(c) Indicators to measure operations
o The number of component items in the item base of the company divided by the products (the generic products) proportioned to the number of components in individual products,
o Length of the cycle from purchase invoice to account sales,
o Value of the component inventory
Ability to easily retrieve and maintain all necessary item information,
Reducing component stock and expanding the convertibility of components,
Better management of component information and better management of component suppliers and related information,
Reducing the items in the component warehouse and dropping their value.
13
1 (d) Development potential brought by PLM
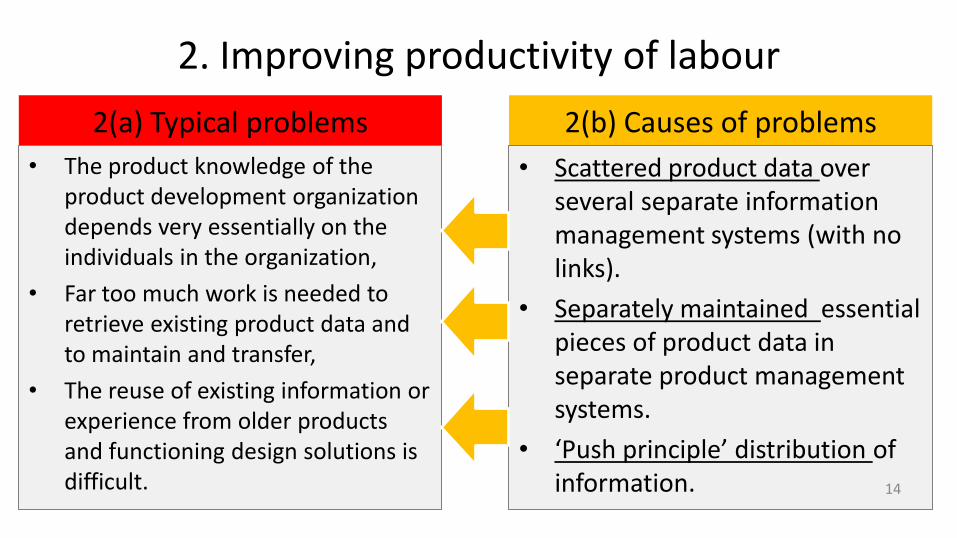
2. Improving productivity of labour
2(a) Typical problems
• The product knowledge of the product development organization depends very essentially on the individuals in the organization,
• Far too much work is needed to retrieve existing product data and to maintain and transfer,
• The reuse of existing information or experience from older products and functioning design solutions is difficult.
2(b) Causes of problems
• Scattered product data over several separate information management systems (with no links).
• Separately maintained essential pieces of product data in separate product management systems.
• ‘Push principle’ distribution of information. 14
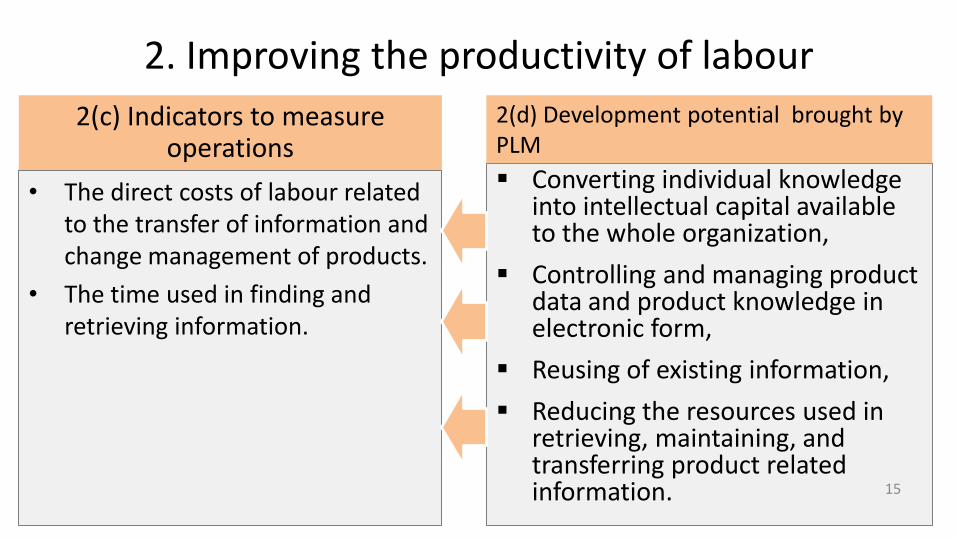
2. Improving the productivity of labour
2(c) Indicators to measure operations
• The direct costs of labour related to the transfer of information and change management of products.
• The time used in finding and retrieving information.
Converting individual knowledge into intellectual capital available to the whole organization,
Controlling and managing product data and product knowledge in electronic form,
Reusing of existing information,
Reducing the resources used in retrieving, maintaining, and transferring product related information.
15
2(d) Development potential brought by PLM
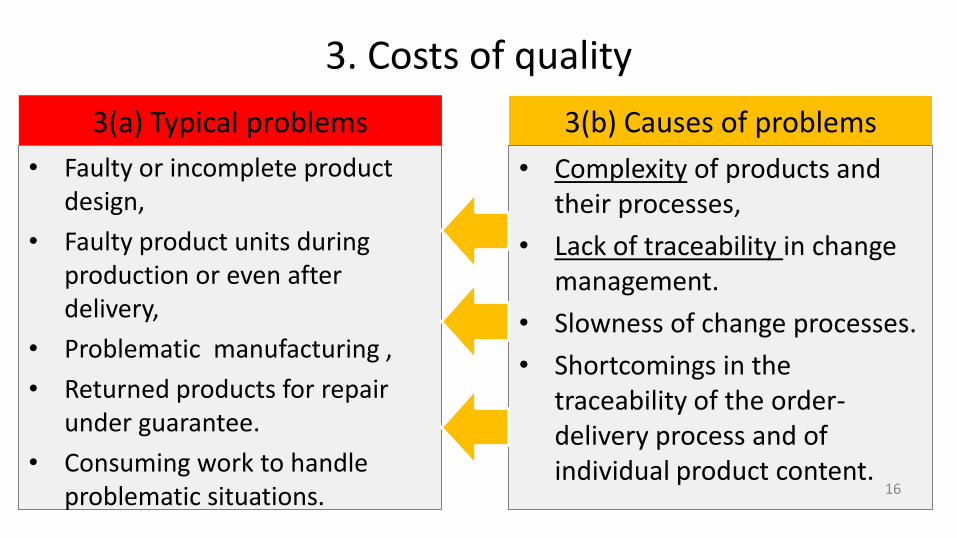
3. Costs of quality
3(a) Typical problems
• Faulty or incomplete product design,
• Faulty product units during production or even after delivery,
• Problematic manufacturing ,
• Returned products for repair under guarantee.
• Consuming work to handle problematic situations.
3(b) Causes of problems
• Complexity of products and their processes,
• Lack of traceability in change management.
• Slowness of change processes.
• Shortcomings in the traceability of the order-delivery process and of individual product content.
16
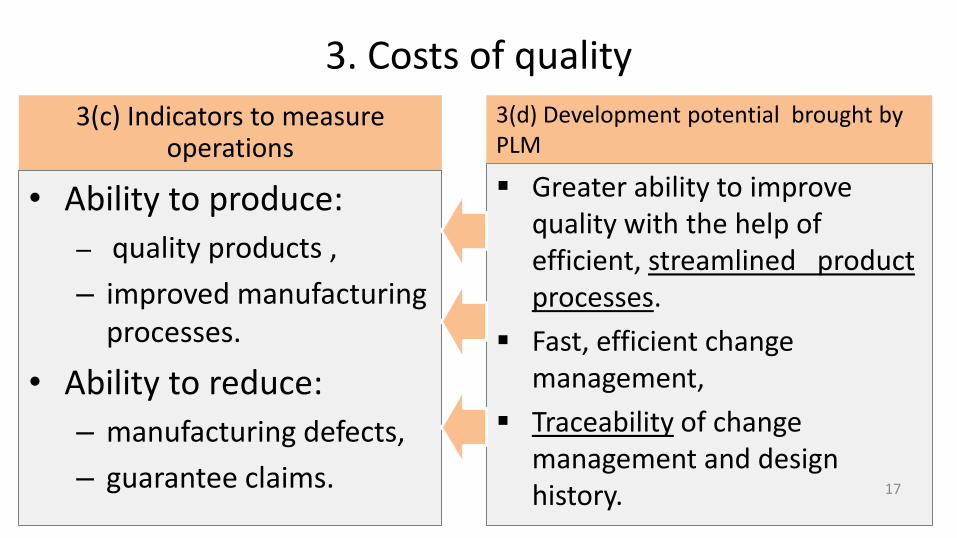
3. Costs of quality
3(c) Indicators to measure operations
• Ability to produce:
– quality products ,
– improved manufacturing processes.
• Ability to reduce:
– manufacturing defects,
– guarantee claims.
Greater ability to improve quality with the help of efficient, streamlined product processes.
Fast, efficient change management,
Traceability of change management and design history. 17
3(d) Development potential brought by PLM
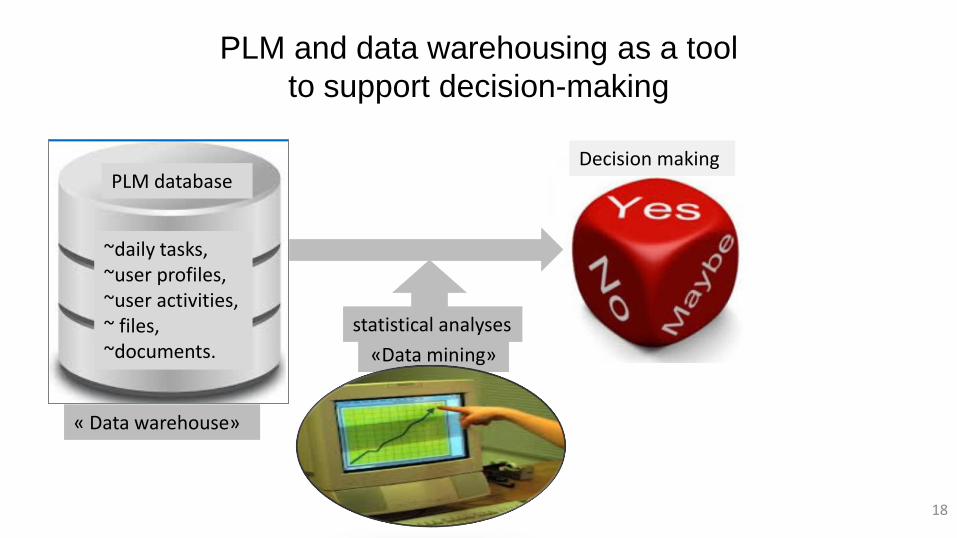
«Data mining»
PLM and data warehousing as a tool
to support decision-making
18
~daily tasks, ~user profiles, ~user activities, ~ files, ~documents.
PLM database Decision making
statistical analyses
« Data warehouse»
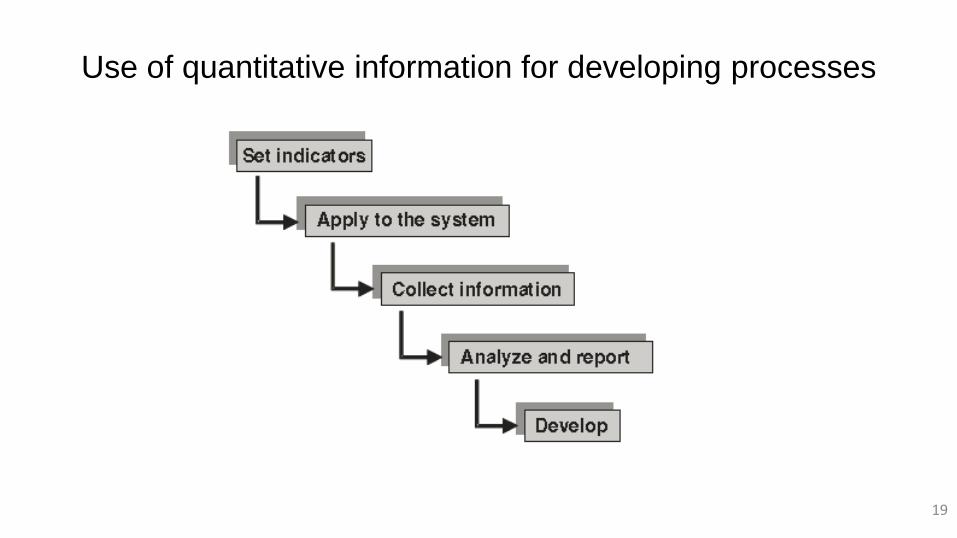
Use of quantitative information for developing processes
19
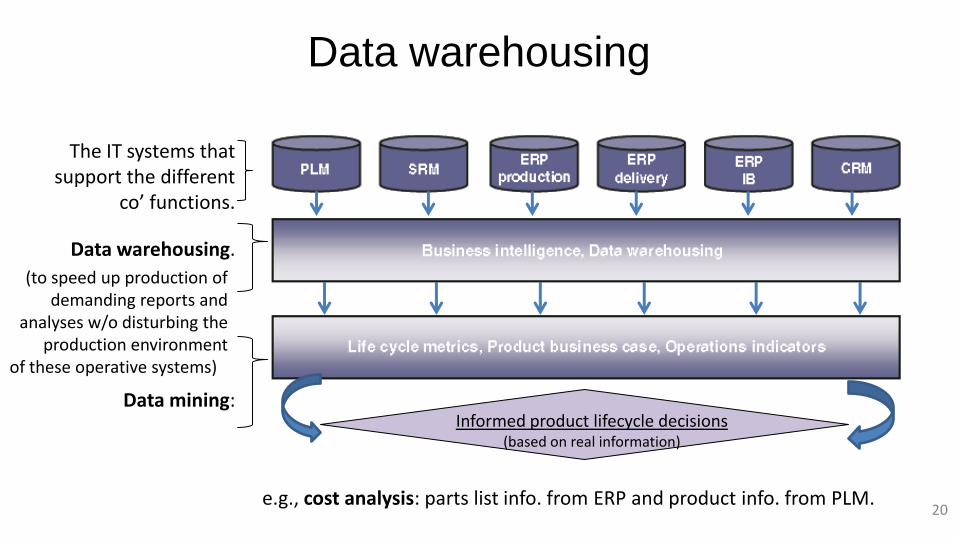
Data warehousing
20
The IT systems that support the different
co’ functions.
Data warehousing.
Data mining:
(to speed up production of demanding reports and
analyses w/o disturbing the production environment
of these operative systems)
Informed product lifecycle decisions (based on real information)
e.g., cost analysis: parts list info. from ERP and product info. from PLM.
Data mining: An example
• The analysis of a manufactured product or product family. – Reason for the product changes or ECOs,
– The dispersion and amount for each reason,
– The reason codes;
Reduction of costs
■ Documentation error
■ Design error
■ Product improvement – customer feedback
■ Product improvement – claim
■ Product improvement – development of production
■ New version
21
Data mining: An example
• The analysis of a manufactured product or product family.
– Reason for the product changes or ECOs,
– The dispersion and amount for each reason,
– The reason codes;
Reduction of costs, ■ Documentation error, Design error,
■ Product improvement , customer feedback, Product improvement – claim
■ Product improvement – development of production, New version.
• Comparing the procured/made ratio and their cost the cost structure and
profitability of the assemblies to buy or to manufacture.
• Number of different items delivered by the different component suppliers.
22
Recommended