©2008 metrum research group LLC
PK-PD Modeling and DosageDetermination for Proof-of-Concept Trials
Marc R. Gastonguay, Ph.D.([email protected])
IMMPACT-VIII
Early Clinical Study Designs, Emphasizing Proof-of-Concept Trials
June 12-14, 2008
Arlington, VA
©2008 metrum research group LLC 2
PKPD in Proof of Concept Trials: IMMPACT 2008
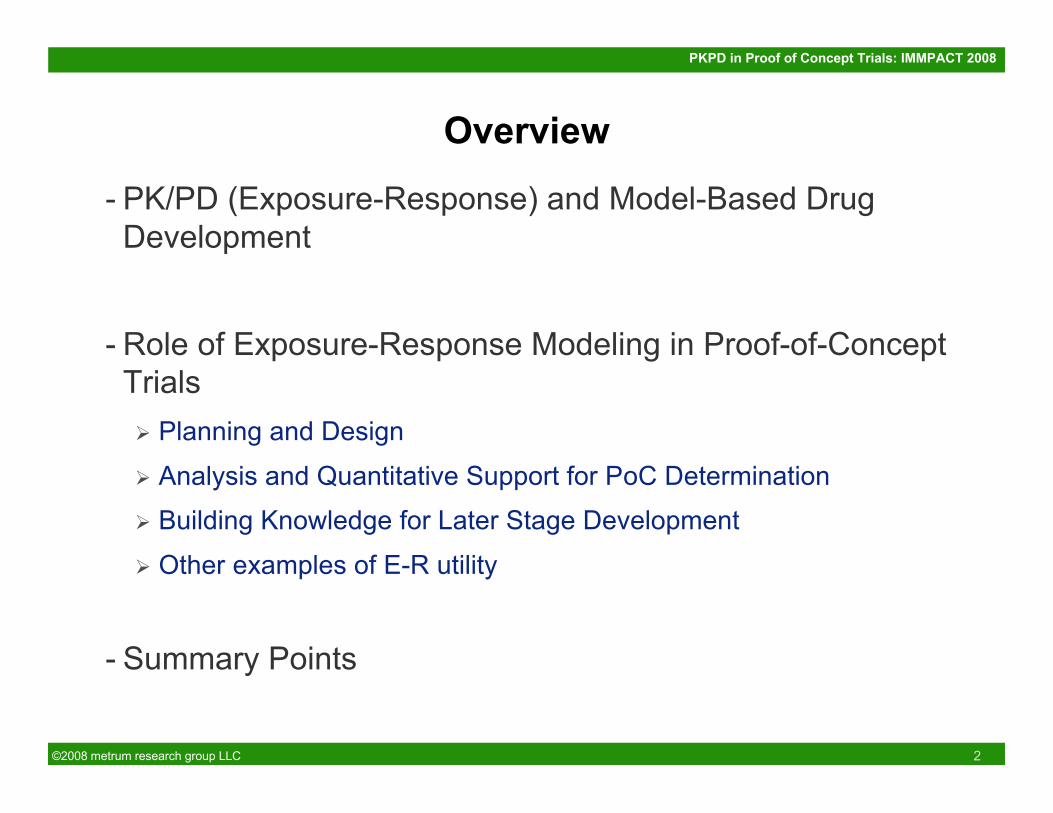
Overview
- PK/PD (Exposure-Response) and Model-Based DrugDevelopment
- Role of Exposure-Response Modeling in Proof-of-ConceptTrials Planning and Design
Analysis and Quantitative Support for PoC Determination
Building Knowledge for Later Stage Development
Other examples of E-R utility
- Summary Points

©2008 metrum research group LLC 3
PKPD in Proof of Concept Trials: IMMPACT 2008
Innovation: Planes are modeled long before takeoffNASA Aerospace Engineering Grid
•Lift Capabilities•Drag Capabilities•Responsiveness
•Deflection capabilities•Responsiveness
•Thrust performance•Reverse Thrust performance•Responsiveness•Fuel Consumption
•Braking performance•Steering capabilities•Traction•Dampening capabilities
Crew Capabilities- accuracy- perception- stamina- re-action times- SOP’s
Engine Models
Airframe Models
Wing Models
Landing Gear Models
Stabilizer Models
Human Models
Whole system simulations are produced by couplingall of the sub -system simulations
It takes a distributed virtual organization to design,simulate and build a complex system like an aircraft
http://grids.ucs.indiana.edu/ptliupages/presentations/cendiapril25-05.ppt
©2008 metrum research group LLC 4
PKPD in Proof of Concept Trials: IMMPACT 2008
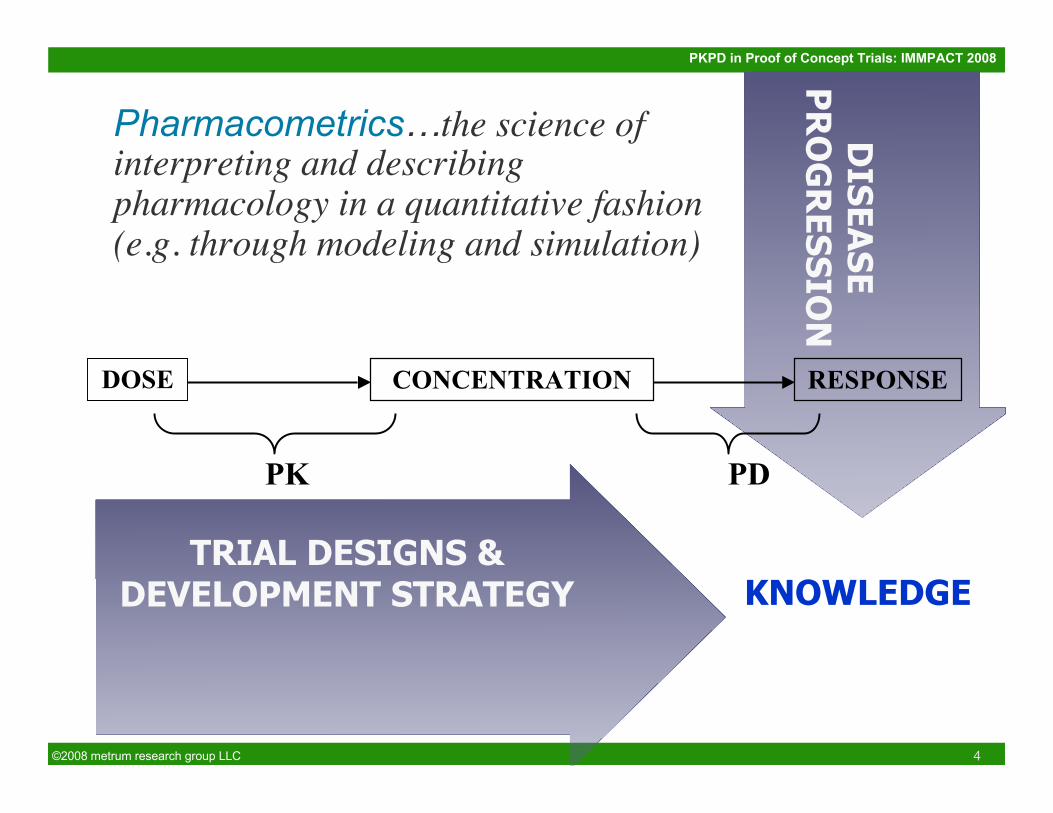
Pharmacometrics…the science ofinterpreting and describingpharmacology in a quantitative fashion(e.g. through modeling and simulation)
DOSE CONCENTRATION RESPONSE
PK PD
DIS
EA
SE
PR
OG
RE
SS
ION
TRIAL DESIGNS &DEVELOPMENT STRATEGY KNOWLEDGE
©2008 metrum research group LLC 5
PKPD in Proof of Concept Trials: IMMPACT 2008
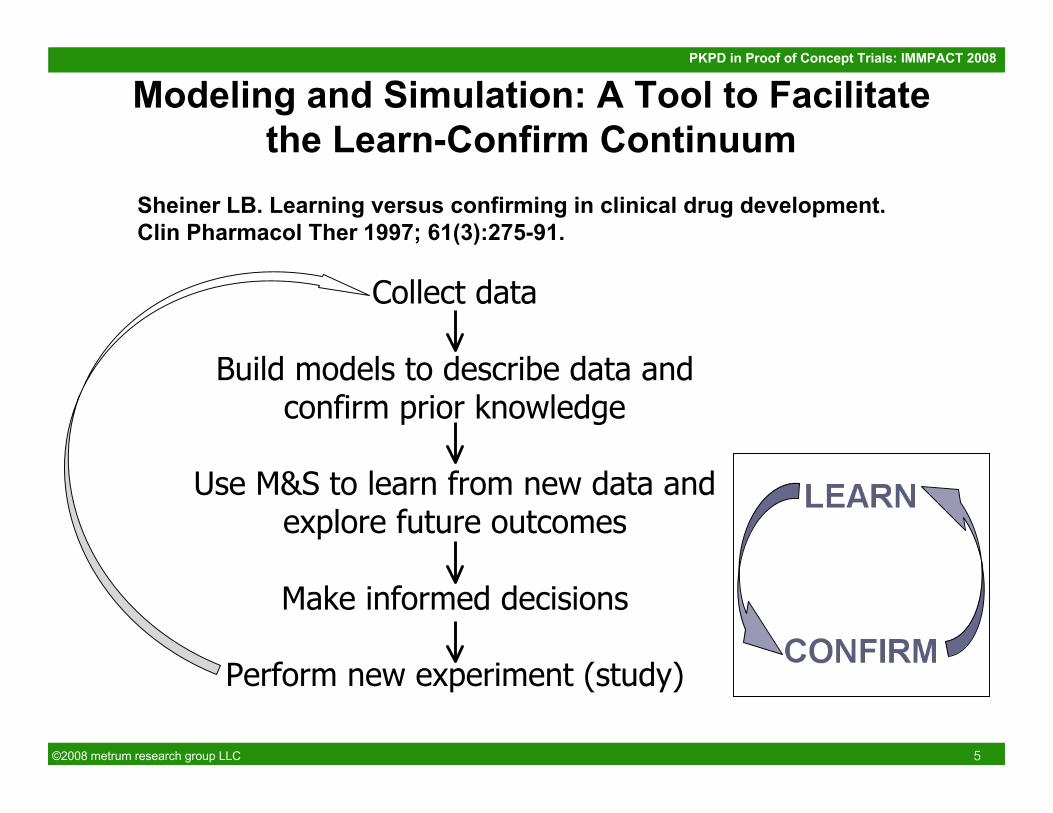
Modeling and Simulation: A Tool to Facilitatethe Learn-Confirm Continuum
Collect data
Build models to describe data andconfirm prior knowledge
Use M&S to learn from new data andexplore future outcomes
Make informed decisions
Perform new experiment (study)
Sheiner LB. Learning versus confirming in clinical drug development.Clin Pharmacol Ther 1997; 61(3):275-91.
©2008 metrum research group LLC 6
PKPD in Proof of Concept Trials: IMMPACT 2008
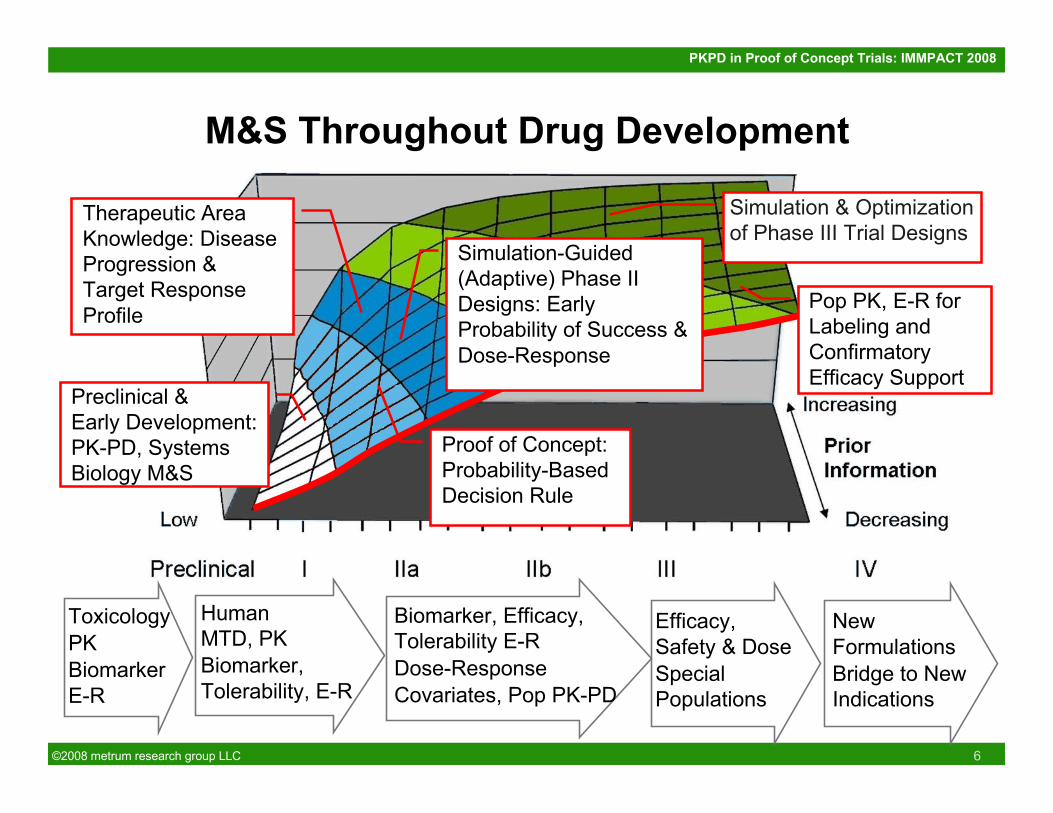
M&S Throughout Drug Development
Simulation & Optimizationof Phase III Trial Designs
Simulation-Guided(Adaptive) Phase IIDesigns: EarlyProbability of Success &Dose-Response
Pop PK, E-R forLabeling andConfirmatoryEfficacy Support
Preclinical &Early Development:PK-PD, SystemsBiology M&S
Therapeutic AreaKnowledge: DiseaseProgression &Target ResponseProfile
ToxicologyPKBiomarkerE-R
HumanMTD, PKBiomarker,Tolerability, E-R
Biomarker, Efficacy,Tolerability E-RDose-ResponseCovariates, Pop PK-PD
Efficacy,Safety & DoseSpecialPopulations
NewFormulationsBridge to NewIndications
Proof of Concept:Probability-BasedDecision Rule
©2008 metrum research group LLC 7
PKPD in Proof of Concept Trials: IMMPACT 2008
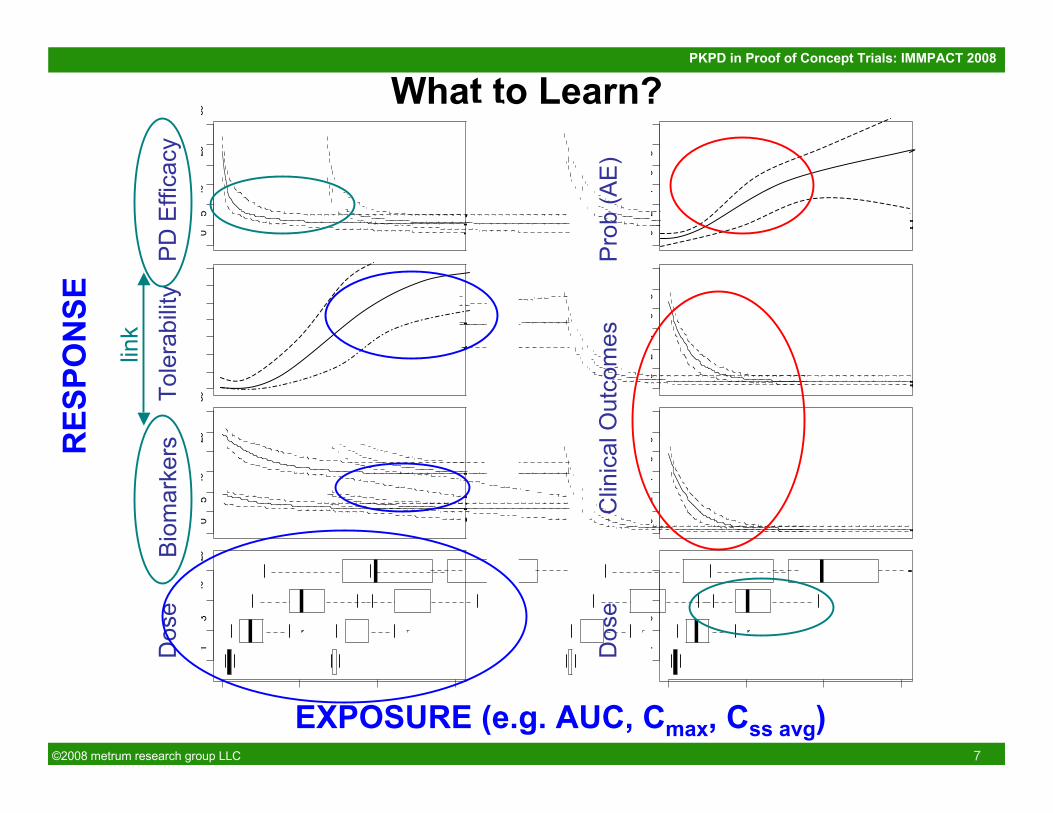
What to Learn?
05
1020
30
LPSres$AUC
LP
S (
min
)
390
410
430
450
TSTres$AUC
TS
T (
min
)
05
1020
30
NAW1res$AUC
NA
W
NAW 1
NAW 2
13
1020
NG2-73 AUC (ng*hr/mL)
Dose
(m
g)
0 50 100 150
NG2-73 AUC (ng*hr/mL)
02
46
810
WRres$AUC
WR
Im
media
te
02
46
810
WRres$AUC
WR
0.5
hr
02
46
810
WRres$AUC
WR
7 h
rs
13
1020
NG2-73 AUC (ng*hr/mL)
Dose
(m
g)
0 50 100 150
NG2-73 AUC (ng*hr/mL)
05
1020
30LPSres$AUC
LP
S (
min
)
390
410
430
450
TSTres$AUC
TS
T (
min
)
05
1020
30
NAW1res$AUC
NA
W
NAW 1
NAW 2
13
1020
NG2-73 AUC (ng*hr/mL)
Dose
(m
g)
0 50 100 150
NG2-73 AUC (ng*hr/mL)
02
46
810
WRres$AUC
WR
Im
media
te
02
46
810
WRres$AUC
WR
0.5
hr
02
46
810
WRres$AUC
WR
7 h
rs
13
1020
NG2-73 AUC (ng*hr/mL)
Dose
(m
g)
0 50 100 150
NG2-73 AUC (ng*hr/mL)EXPOSURE (e.g. AUC, Cmax, Css avg)
RES
PON
SE
Dos
e
Dos
e
Bio
mar
kers
Pro
b (A
E)
Tole
rabi
lity
Clin
ical
Out
com
es
PD
Effi
cacy
link
©2008 metrum research group LLC 8
PKPD in Proof of Concept Trials: IMMPACT 2008
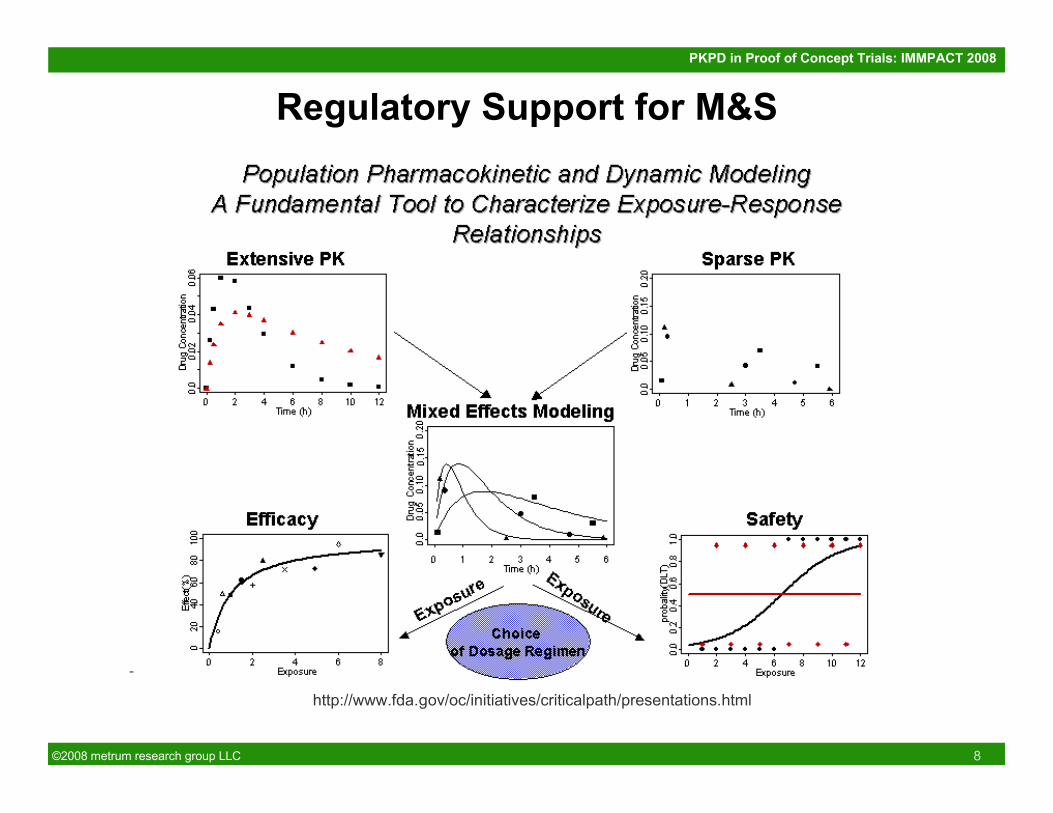
- Stanski.Model-BasedDrugDevelopment:ACriticalPathOpportunity,March18,2004
Regulatory Support for M&S
http://www.fda.gov/oc/initiatives/criticalpath/presentations.html
©2008 metrum research group LLC 9
PKPD in Proof of Concept Trials: IMMPACT 2008
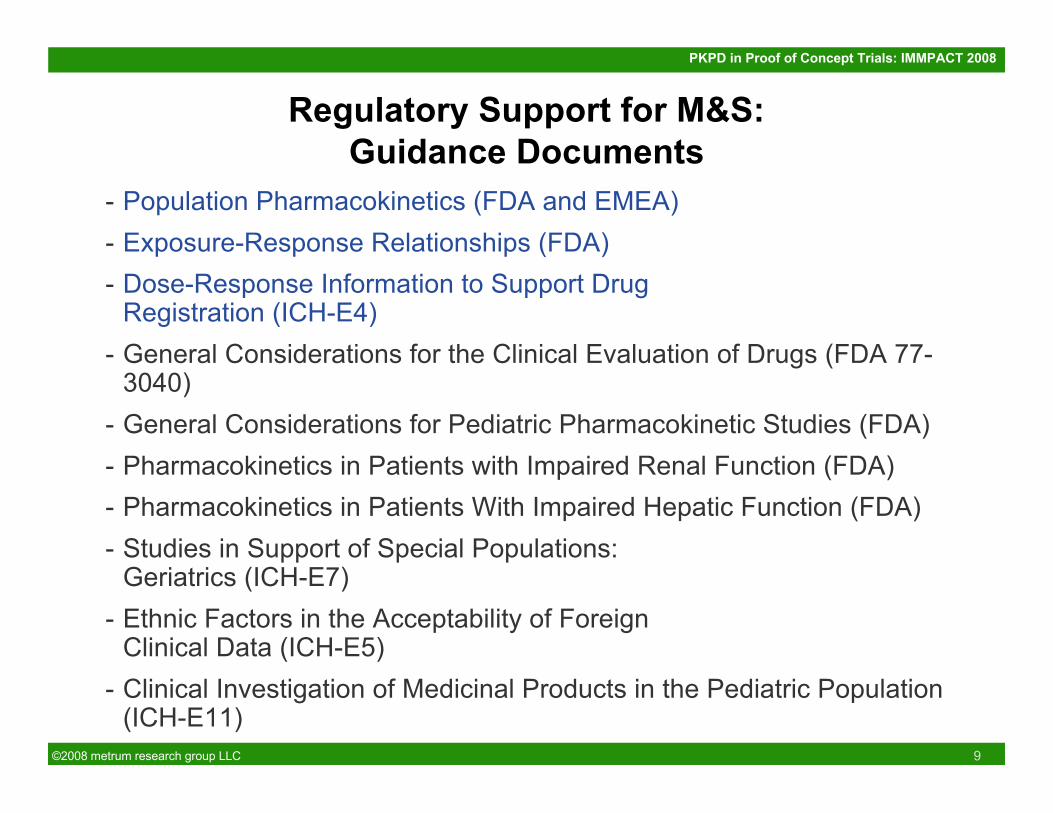
Regulatory Support for M&S:Guidance Documents
- Population Pharmacokinetics (FDA and EMEA)- Exposure-Response Relationships (FDA)- Dose-Response Information to Support Drug
Registration (ICH-E4)- General Considerations for the Clinical Evaluation of Drugs (FDA 77-
3040)- General Considerations for Pediatric Pharmacokinetic Studies (FDA)- Pharmacokinetics in Patients with Impaired Renal Function (FDA)- Pharmacokinetics in Patients With Impaired Hepatic Function (FDA)- Studies in Support of Special Populations:
Geriatrics (ICH-E7)- Ethnic Factors in the Acceptability of Foreign
Clinical Data (ICH-E5)- Clinical Investigation of Medicinal Products in the Pediatric Population
(ICH-E11)
©2008 metrum research group LLC 10
PKPD in Proof of Concept Trials: IMMPACT 2008
Determination of PoC
- Primary Challenge: Define decision criteria for PoCdetermination Proof of mechanism
Statistically significant efficacy response with approval endpoint
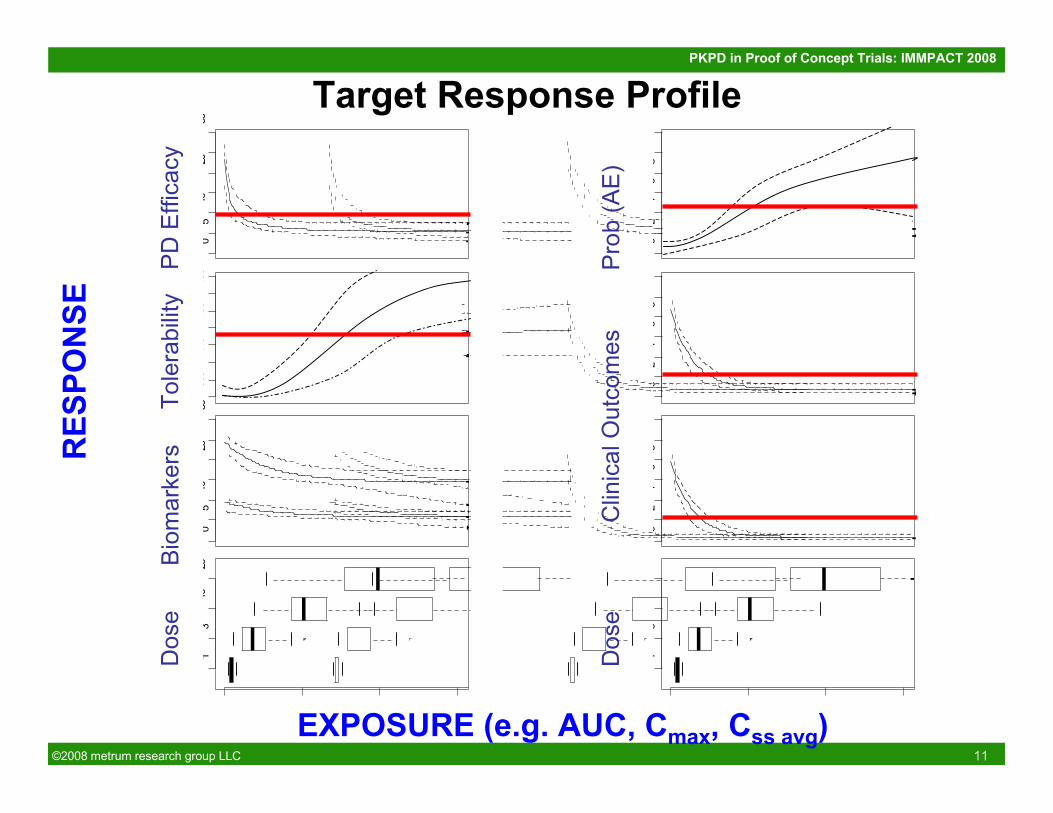
Acceptable probability of achieving multivariate target responseprofile
Comparability to active control
- Once defined, probability of meeting PoC decision criteriafor different trial designs can be explored throughmodeling and simulation
©2008 metrum research group LLC 11
PKPD in Proof of Concept Trials: IMMPACT 2008
Target Response Profile
05
1020
30
LPSres$AUC
LP
S (
min
)
390
410
430
450
TSTres$AUC
TS
T (
min
)
05
1020
30
NAW1res$AUC
NA
W
NAW 1
NAW 2
13
1020
NG2-73 AUC (ng*hr/mL)
Dose
(m
g)
0 50 100 150
NG2-73 AUC (ng*hr/mL)
02
46
810
WRres$AUC
WR
Im
media
te
02
46
810
WRres$AUC
WR
0.5
hr
02
46
810
WRres$AUC
WR
7 h
rs
13
1020
NG2-73 AUC (ng*hr/mL)
Dose
(m
g)
0 50 100 150
NG2-73 AUC (ng*hr/mL)
05
1020
30LPSres$AUC
LP
S (
min
)
390
410
430
450
TSTres$AUC
TS
T (
min
)
05
1020
30
NAW1res$AUC
NA
W
NAW 1
NAW 2
13
1020
NG2-73 AUC (ng*hr/mL)
Dose
(m
g)
0 50 100 150
NG2-73 AUC (ng*hr/mL)
02
46
810
WRres$AUC
WR
Im
media
te
02
46
810
WRres$AUC
WR
0.5
hr
02
46
810
WRres$AUCW
R 7
hrs
13
1020
NG2-73 AUC (ng*hr/mL)
Dose
(m
g)
0 50 100 150
NG2-73 AUC (ng*hr/mL)EXPOSURE (e.g. AUC, Cmax, Css avg)
RES
PON
SE
Dos
e
Dos
e
Bio
mar
kers
Pro
b (A
E)
Tole
rabi
lity
Clin
ical
Out
com
es
PD
Effi
cacy

©2008 metrum research group LLC 12
PKPD in Proof of Concept Trials: IMMPACT 2008
PK and Exposure-Response M&SOpportunities in PoC
- PK Modeling Understand PK in target population and possibly reduce inter-
individual variability in exposure to increase signal/noise: dosingindividualization
Select PoC doses with minimal exposure overlap Explain unexpected outcomes (e.g. unknown phenotypic
differences in PK) Adjust for formulation differences
- E-R Modeling Assessment of E-R relationships for multiple endpoints (e.g. after
dose-ranging based on efficacy endpoint) Basis for trial simulations: explore performance/options in silico
before initiating clinical trial
©2008 metrum research group LLC 13
PKPD in Proof of Concept Trials: IMMPACT 2008
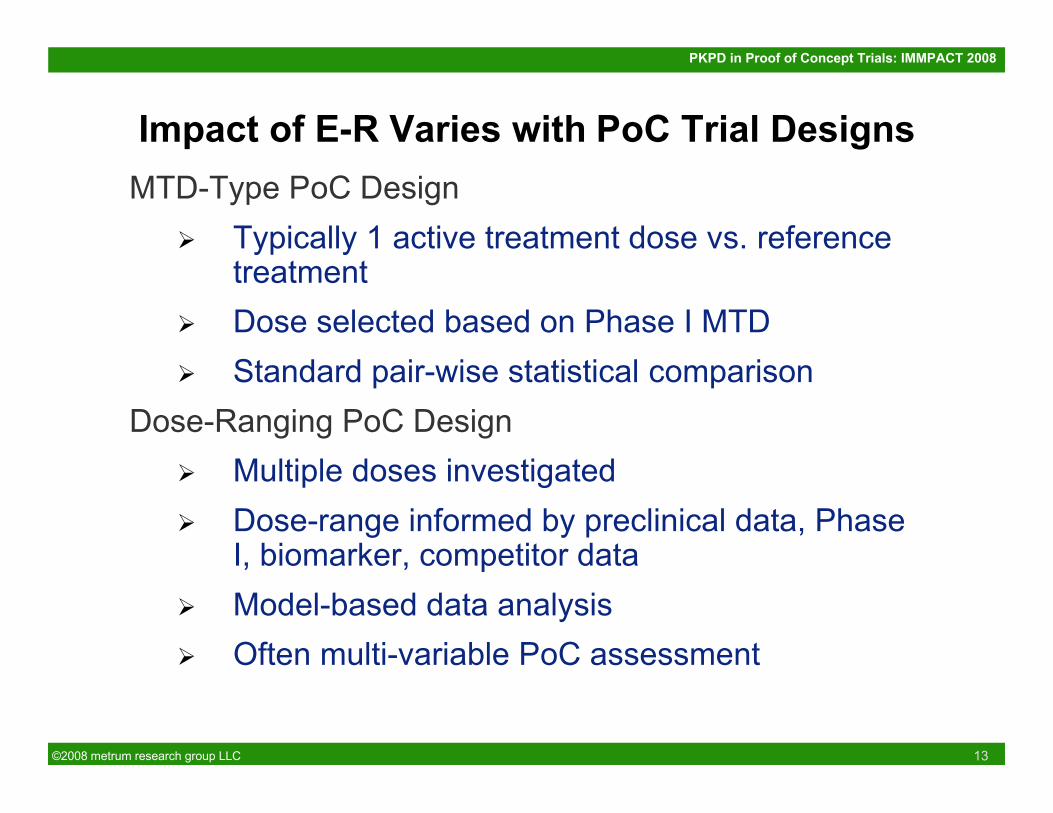
Impact of E-R Varies with PoC Trial DesignsMTD-Type PoC Design
Typically 1 active treatment dose vs. referencetreatment
Dose selected based on Phase I MTD Standard pair-wise statistical comparison
Dose-Ranging PoC Design Multiple doses investigated Dose-range informed by preclinical data, Phase
I, biomarker, competitor data Model-based data analysis Often multi-variable PoC assessment
©2008 metrum research group LLC 14
PKPD in Proof of Concept Trials: IMMPACT 2008
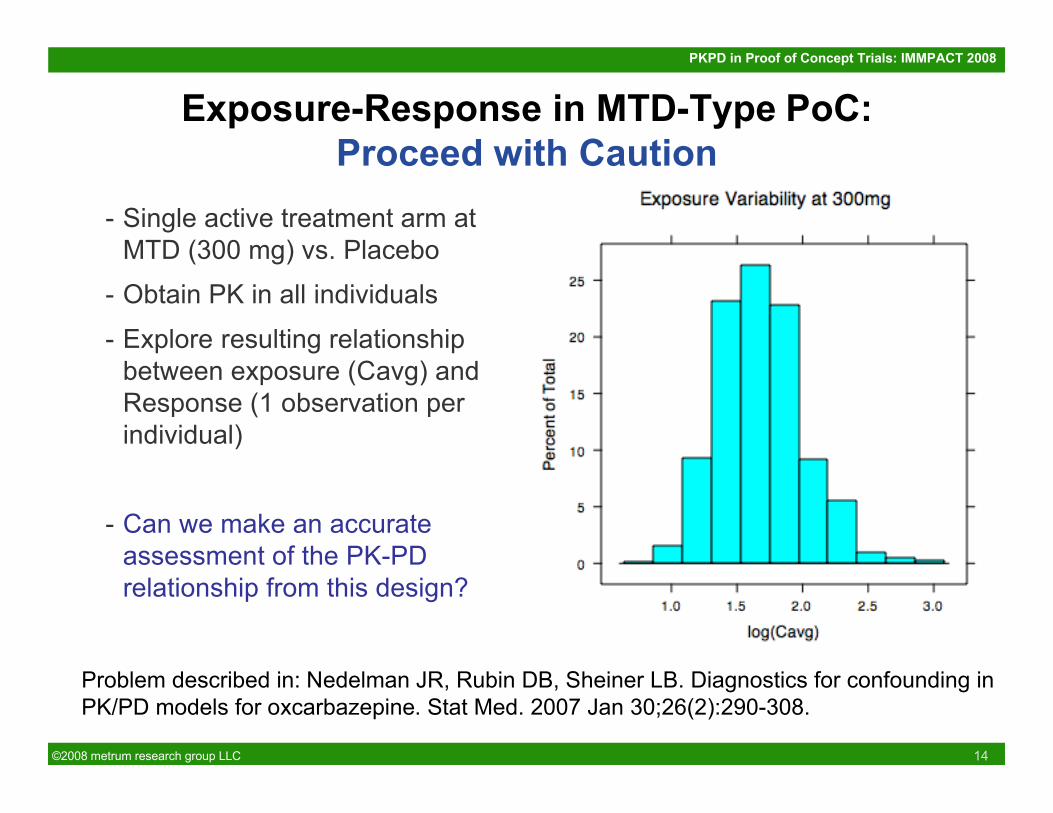
Exposure-Response in MTD-Type PoC:Proceed with Caution
- Single active treatment arm atMTD (300 mg) vs. Placebo
- Obtain PK in all individuals
- Explore resulting relationshipbetween exposure (Cavg) andResponse (1 observation perindividual)
- Can we make an accurateassessment of the PK-PDrelationship from this design?
Problem described in: Nedelman JR, Rubin DB, Sheiner LB. Diagnostics for confounding inPK/PD models for oxcarbazepine. Stat Med. 2007 Jan 30;26(2):290-308.
©2008 metrum research group LLC 15
PKPD in Proof of Concept Trials: IMMPACT 2008
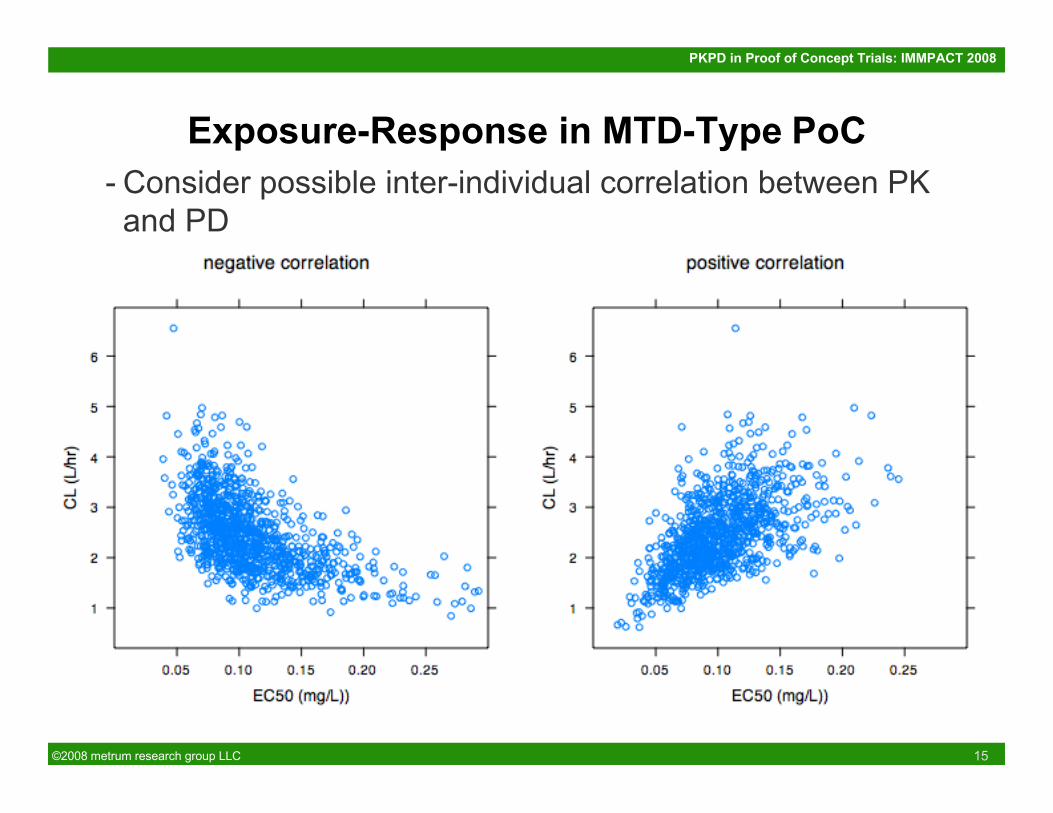
Exposure-Response in MTD-Type PoC- Consider possible inter-individual correlation between PKand PD
©2008 metrum research group LLC 16
PKPD in Proof of Concept Trials: IMMPACT 2008
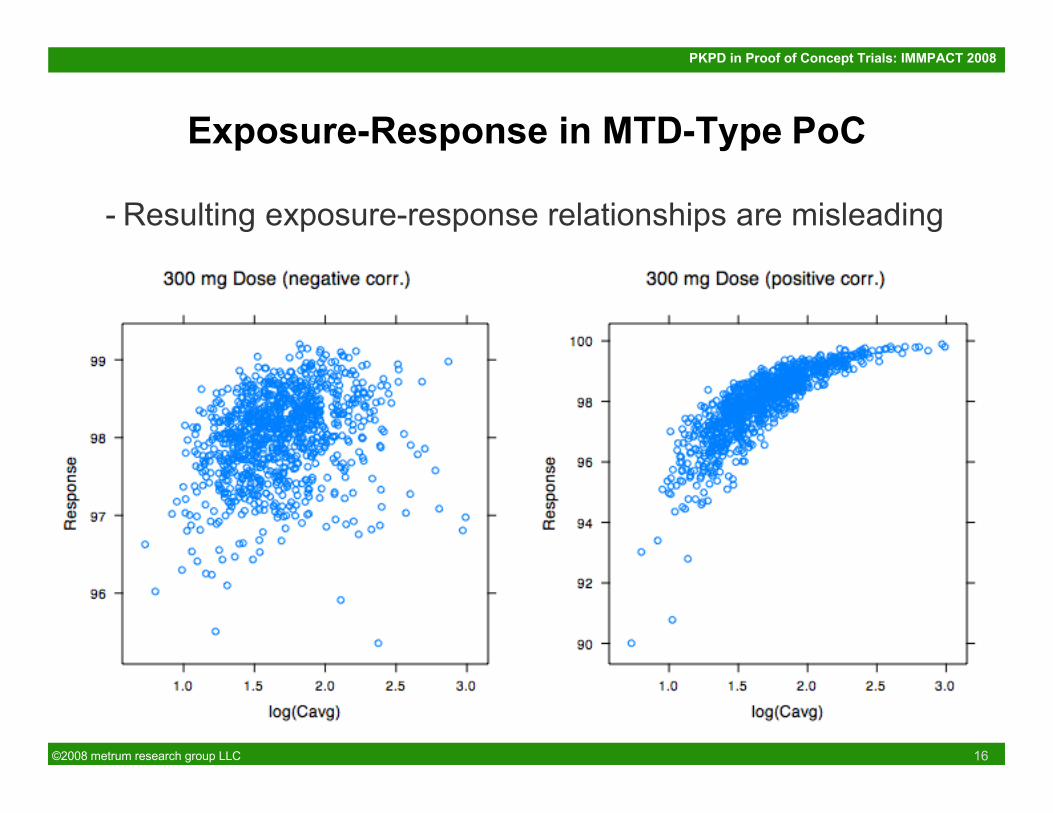
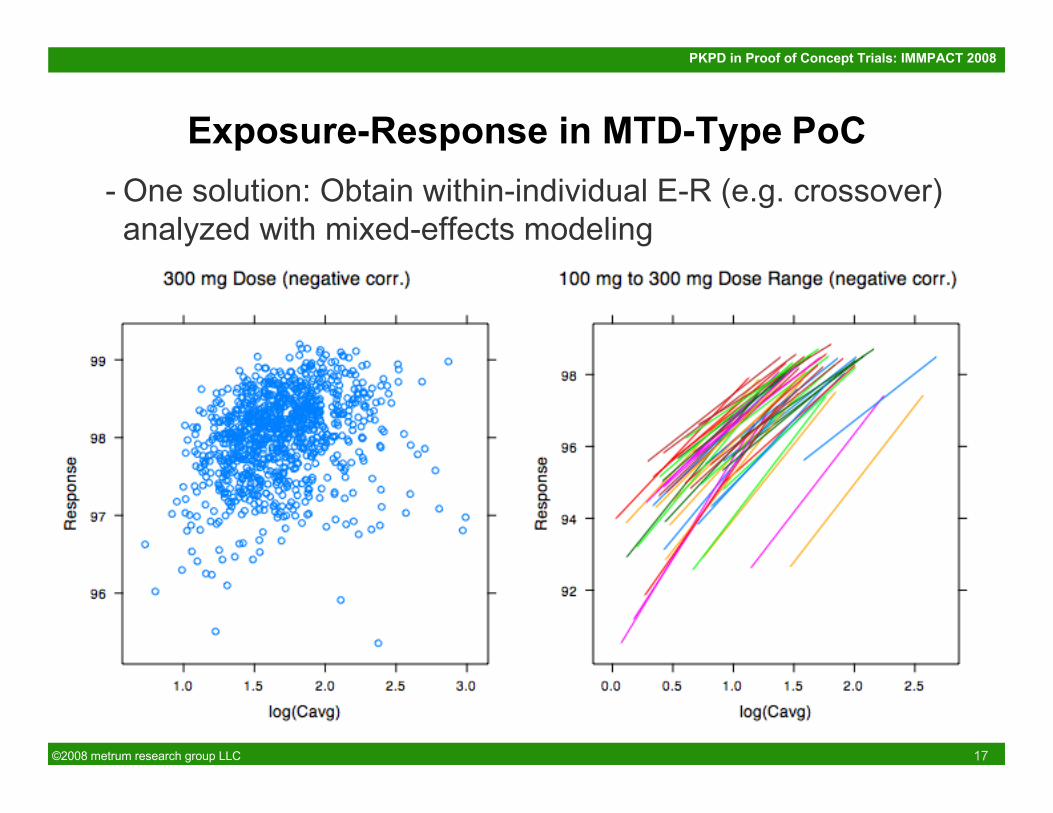
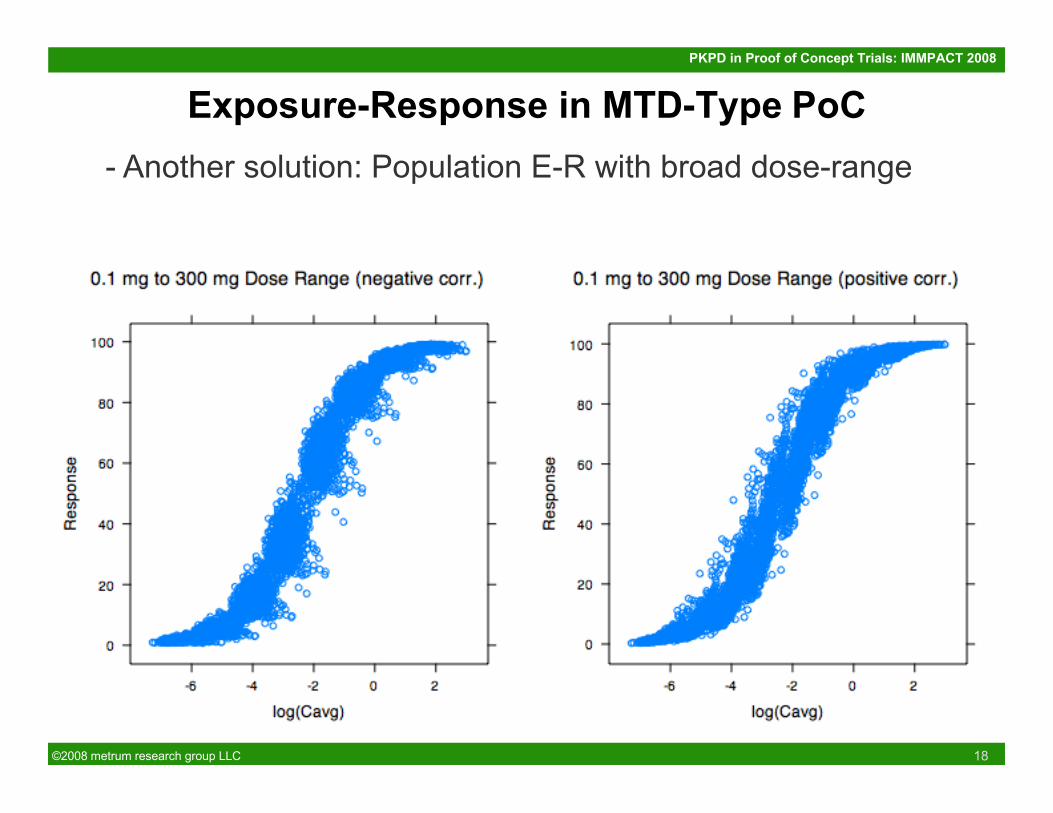
Exposure-Response in MTD-Type PoC
- Resulting exposure-response relationships are misleading
©2008 metrum research group LLC 17
PKPD in Proof of Concept Trials: IMMPACT 2008
Exposure-Response in MTD-Type PoC- One solution: Obtain within-individual E-R (e.g. crossover)analyzed with mixed-effects modeling
©2008 metrum research group LLC 18
PKPD in Proof of Concept Trials: IMMPACT 2008
Exposure-Response in MTD-Type PoC- Another solution: Population E-R with broad dose-range
©2008 metrum research group LLC 19
PKPD in Proof of Concept Trials: IMMPACT 2008
PK-PD in Planning and Design of PoC Trials
- Use prior information, when available
Phase I PK, tolerability, biomarkers
Pre-clinical estimates of effective concentrations,relative potency
Competitor data
Therapeutic area knowledge
©2008 metrum research group LLC 20
PKPD in Proof of Concept Trials: IMMPACT 2008
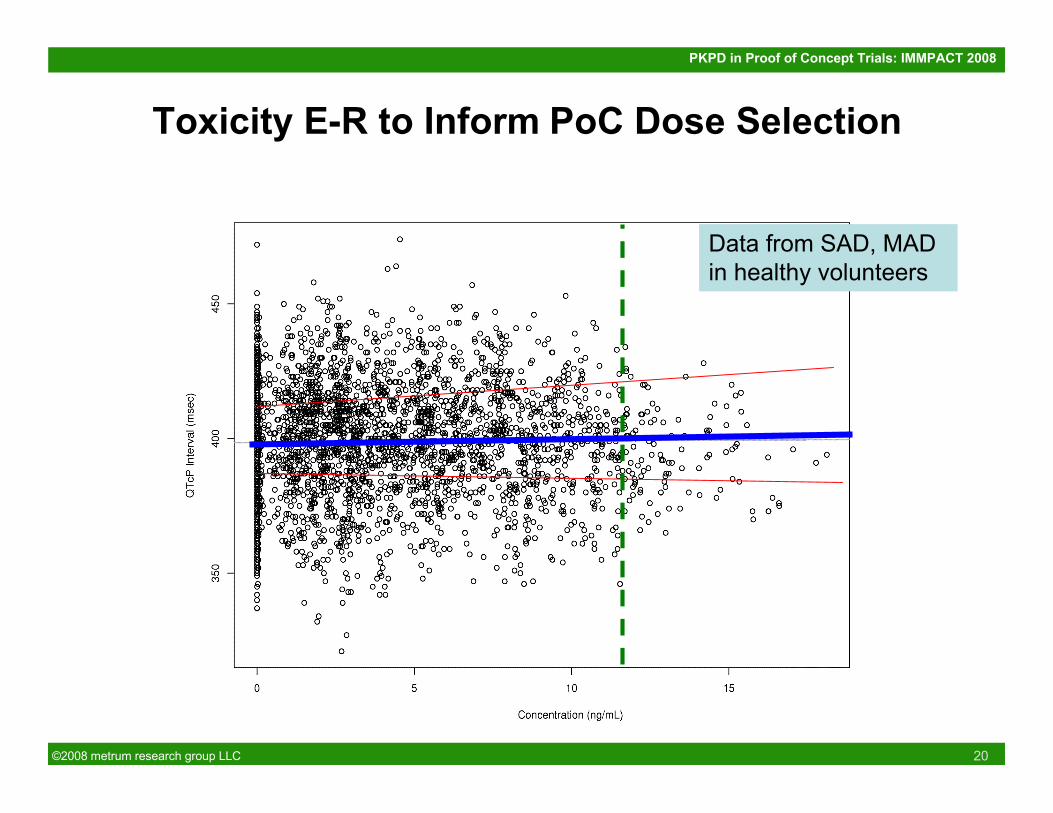
Toxicity E-R to Inform PoC Dose Selection
Data from SAD, MADin healthy volunteers
©2008 metrum research group LLC 21
PKPD in Proof of Concept Trials: IMMPACT 2008
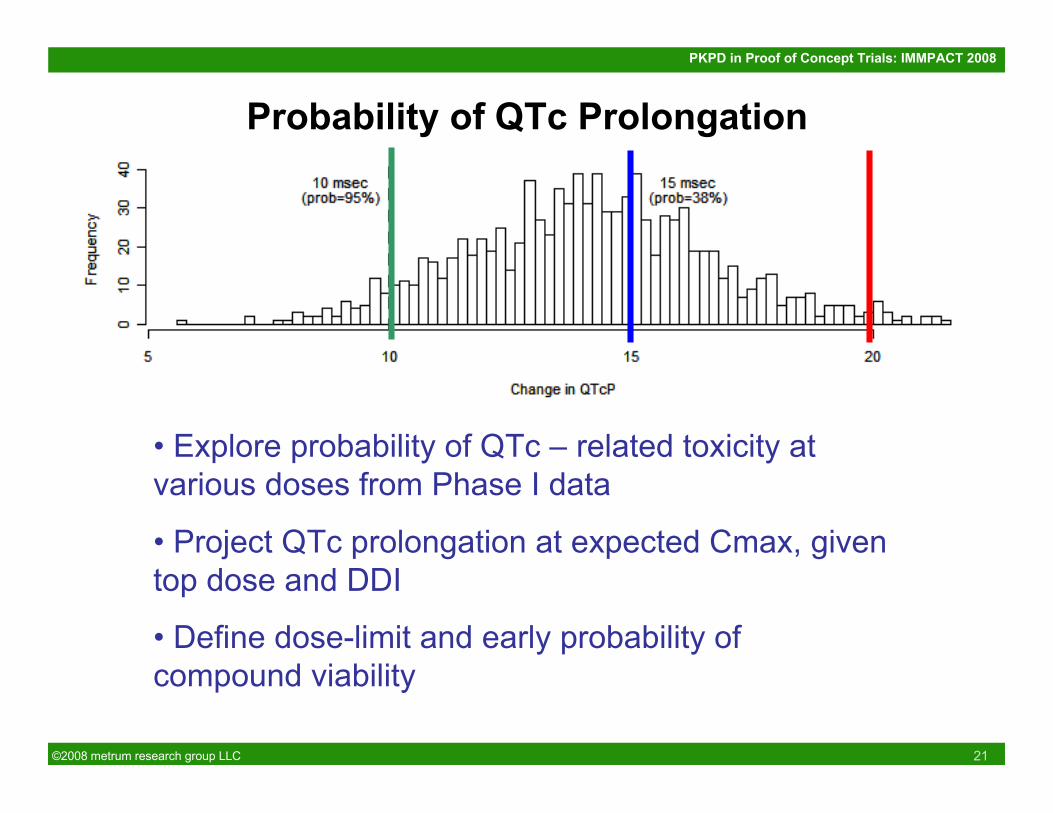
Probability of QTc Prolongation
• Explore probability of QTc – related toxicity atvarious doses from Phase I data
• Project QTc prolongation at expected Cmax, giventop dose and DDI
• Define dose-limit and early probability ofcompound viability
©2008 metrum research group LLC 22
PKPD in Proof of Concept Trials: IMMPACT 2008
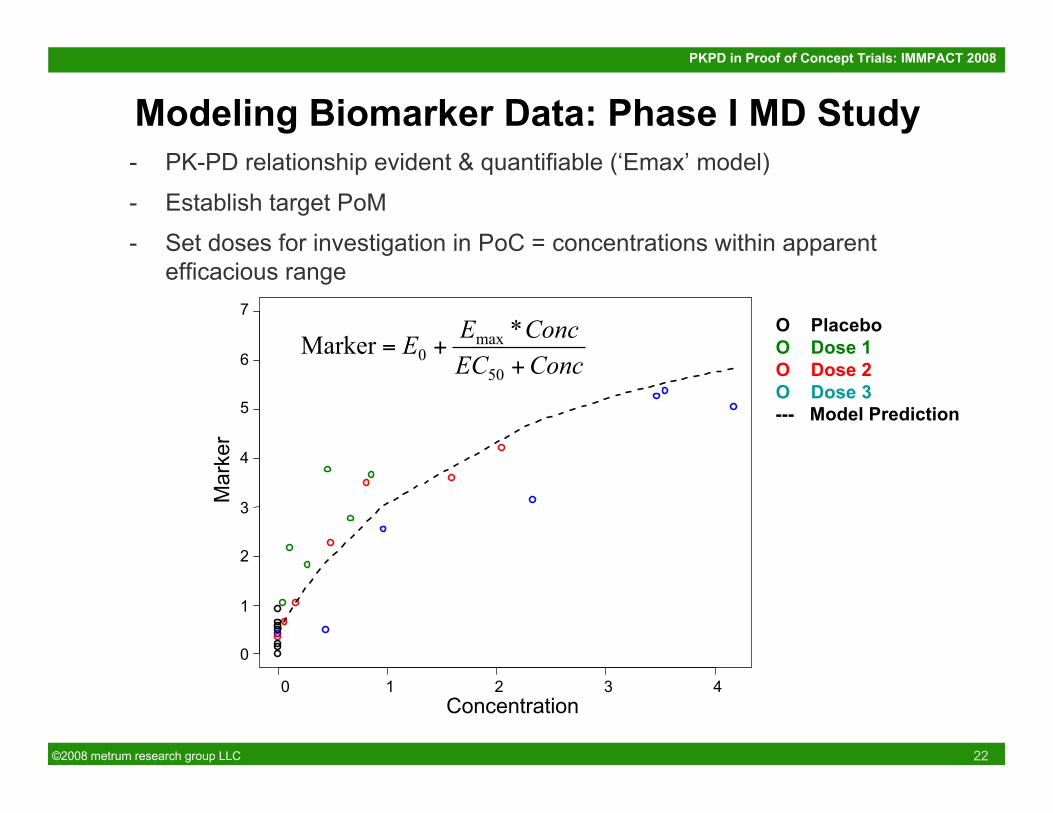
Modeling Biomarker Data: Phase I MD Study- PK-PD relationship evident & quantifiable (‘Emax’ model)
- Establish target PoM
- Set doses for investigation in PoC = concentrations within apparentefficacious range
Concentration
Mar
ker
ConcEC
ConcEE
++=
50
max
0
*Marker
0 1 2 3 4
7
6
5
4
3
2
1
0
O PlaceboO Dose 1O Dose 2O Dose 3--- Model Prediction
©2008 metrum research group LLC 23
PKPD in Proof of Concept Trials: IMMPACT 2008
E-R Analysis of PoC Trials
- Example Parallel groups: 4 active doses + placebo + active control
(competing therapy)
Multiple Endpoints: biomarker 1 (efficacy), biomarker 2(undesired), clinical outcome 1
PoC determination based on model-based posterior probability ofreaching target response profile
©2008 metrum research group LLC 24
PKPD in Proof of Concept Trials: IMMPACT 2008
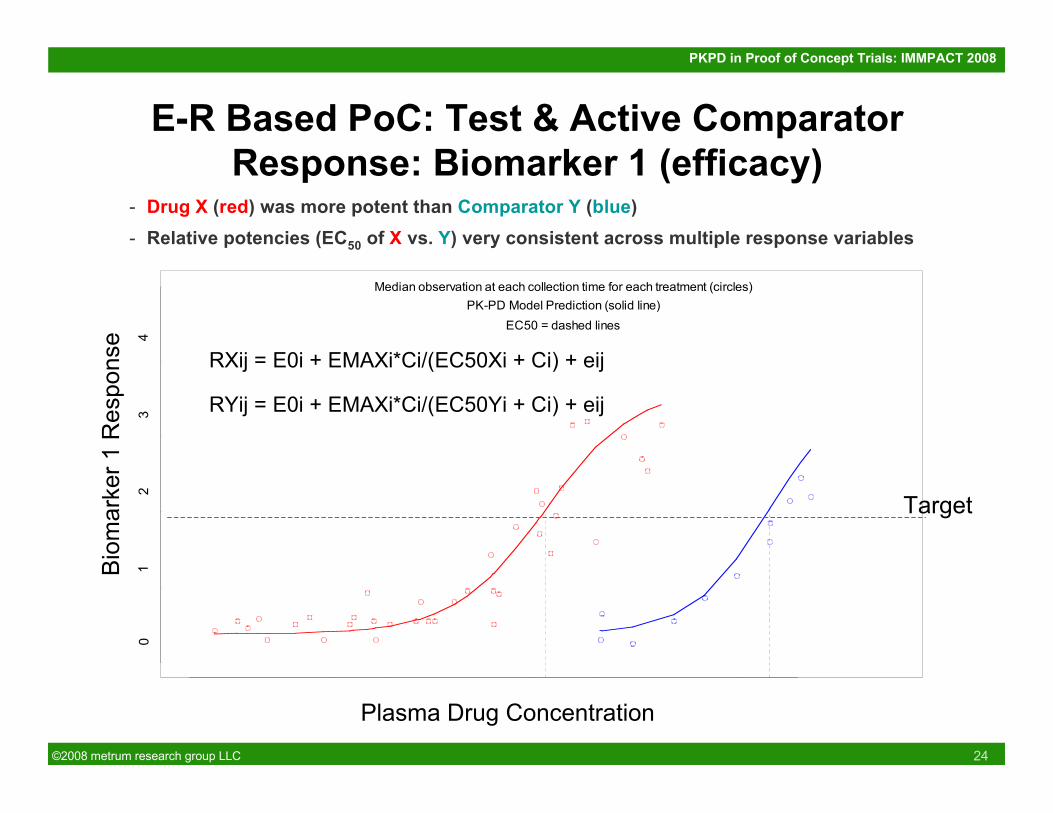
E-R Based PoC: Test & Active ComparatorResponse: Biomarker 1 (efficacy)
Drug X (red),Comparator Y (blue)
Median Concentration
Media
n R
esponse
EC50 = dashed lines
Median observation at each collection time for each treatment (circles)
PK-PD Model Prediction (solid line)
01
23
45
- Drug X (red) was more potent than Comparator Y (blue)- Relative potencies (EC50 of X vs. Y) very consistent across multiple response variables
Plasma Drug Concentration
Bio
mar
ker 1
Res
pons
e
RXij = E0i + EMAXi*Ci/(EC50Xi + Ci) + eij
RYij = E0i + EMAXi*Ci/(EC50Yi + Ci) + eij
Target
©2008 metrum research group LLC 25
PKPD in Proof of Concept Trials: IMMPACT 2008
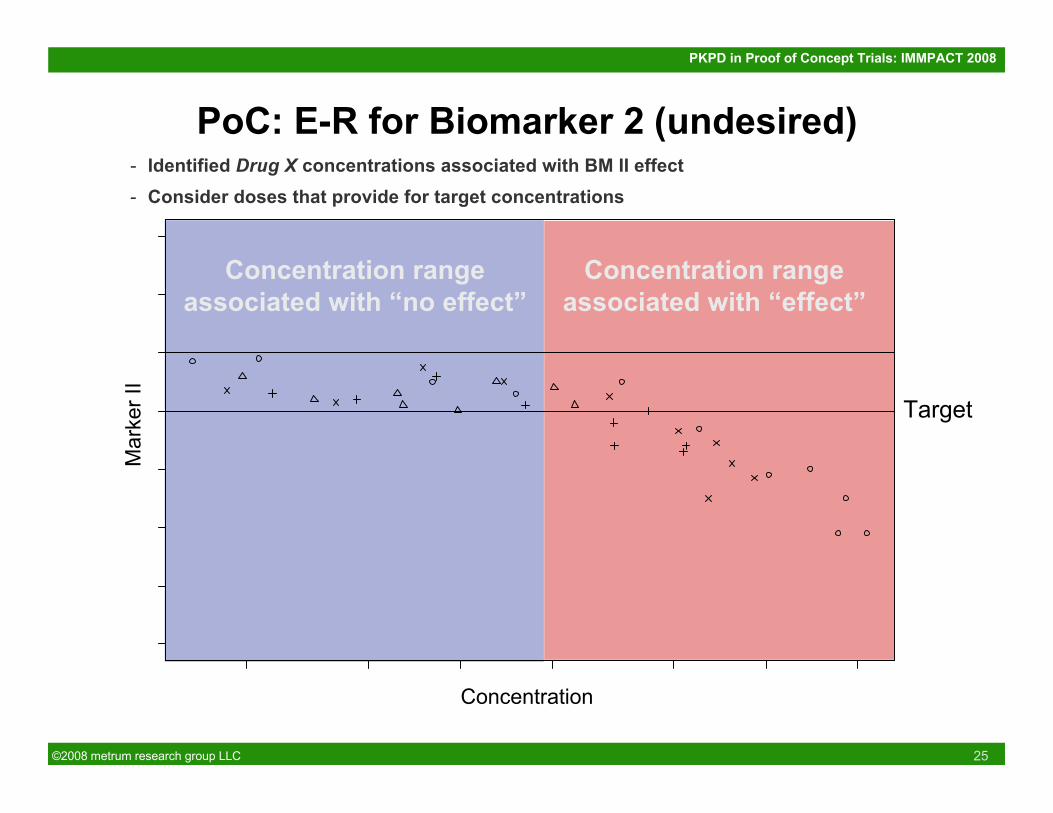
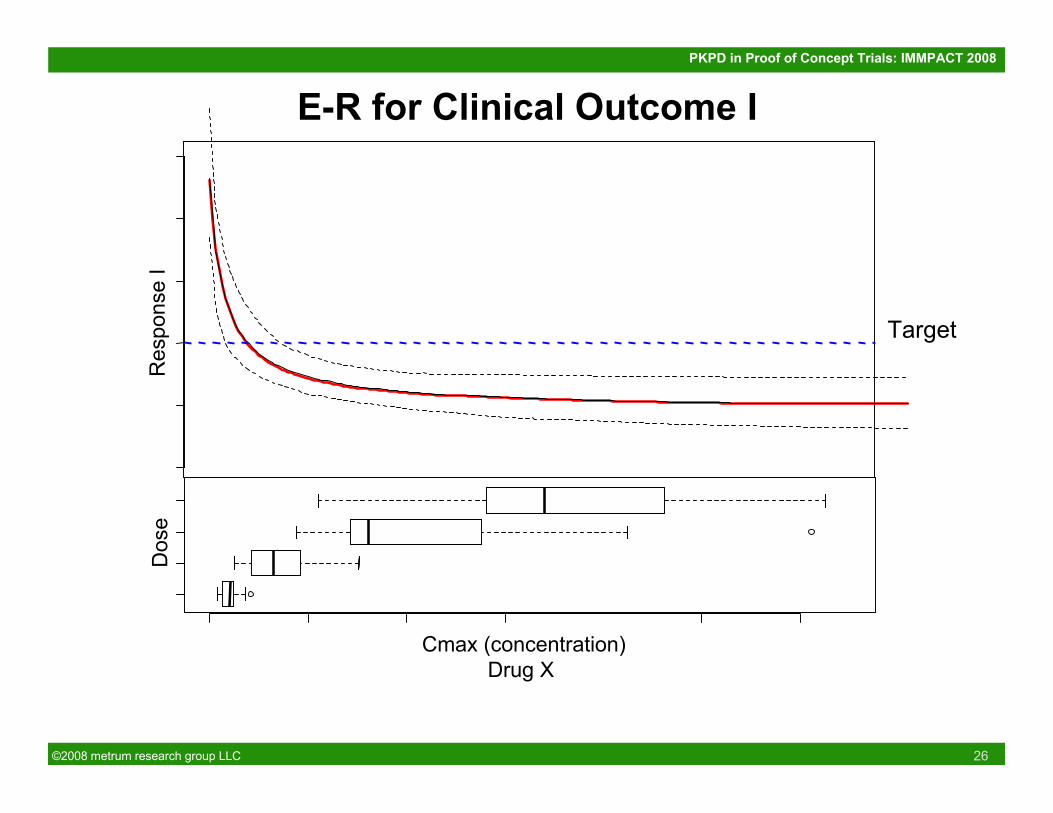
- Identified Drug X concentrations associated with BM II effect- Consider doses that provide for target concentrations
PoC: E-R for Biomarker 2 (undesired)
Concentration rangeassociated with “no effect”
Concentration rangeassociated with “effect”
Concentration
Mar
ker I
I
Target
©2008 metrum research group LLC 26
PKPD in Proof of Concept Trials: IMMPACT 2008
Res
pons
e I
Dos
e
Cmax (concentration)Drug X
E-R for Clinical Outcome I
Target
©2008 metrum research group LLC 27
PKPD in Proof of Concept Trials: IMMPACT 2008
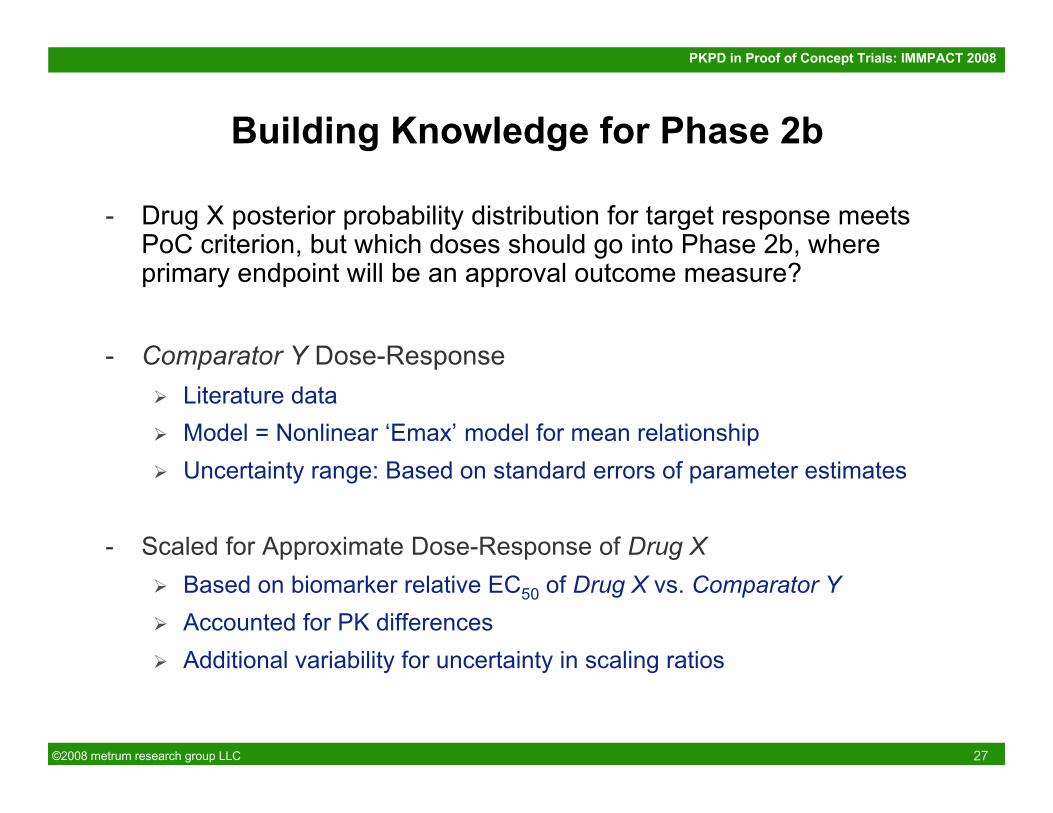
- Drug X posterior probability distribution for target response meetsPoC criterion, but which doses should go into Phase 2b, whereprimary endpoint will be an approval outcome measure?
- Comparator Y Dose-Response Literature data Model = Nonlinear ‘Emax’ model for mean relationship Uncertainty range: Based on standard errors of parameter estimates
- Scaled for Approximate Dose-Response of Drug X Based on biomarker relative EC50 of Drug X vs. Comparator Y Accounted for PK differences Additional variability for uncertainty in scaling ratios
Building Knowledge for Phase 2b
©2008 metrum research group LLC 28
PKPD in Proof of Concept Trials: IMMPACT 2008
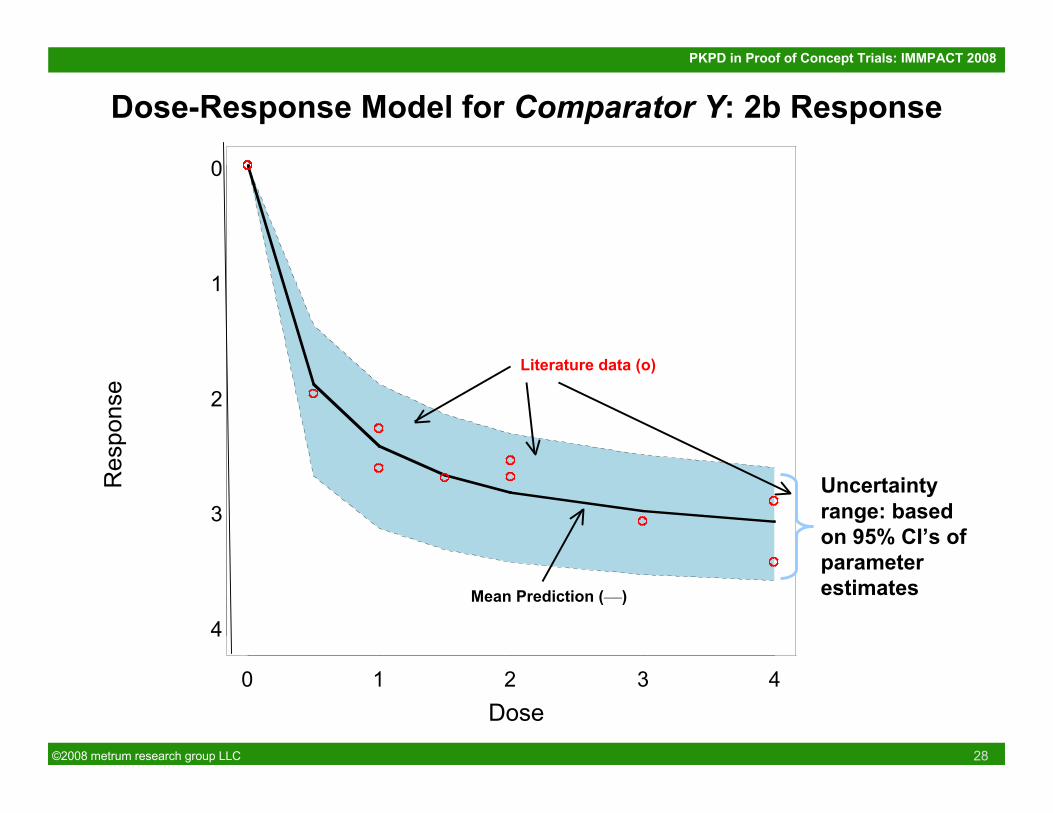
Dose Y
Response
Dose-Response Model for Comparator Y: 2b Response
0 1 2 3 4
0
1
2
3
4
Literature data (o)
Mean Prediction (___)
Uncertaintyrange: basedon 95% CI’s ofparameterestimates
Dose
Res
pons
e
©2008 metrum research group LLC 29
PKPD in Proof of Concept Trials: IMMPACT 2008
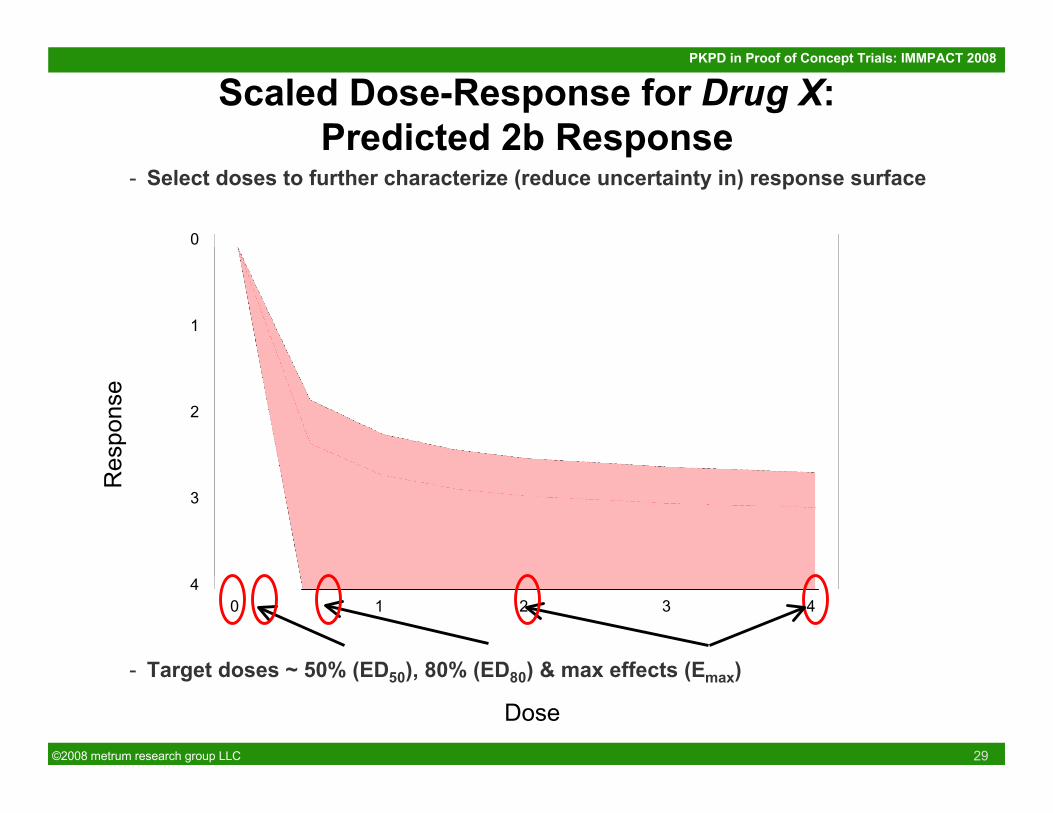
- Select doses to further characterize (reduce uncertainty in) response surface
- Target doses ~ 50% (ED50), 80% (ED80) & max effects (Emax)
0
1
2
3
40 1 2 3 4
Scaled Dose-Response for Drug X:Predicted 2b Response
Dose
Res
pons
e
©2008 metrum research group LLC 30
PKPD in Proof of Concept Trials: IMMPACT 2008
Other Examples of E-R in Analgesic PoC Trials
- Dissociation of rescue drug effects from test treatment
- Model-based inferences with dropout (missing data)

©2008 metrum research group LLC 31
PKPD in Proof of Concept Trials: IMMPACT 2008
Dissociating Treatment Effects fromRescue Dose Effects
- Chronic pain PoC design (PBO plus 4 dose levels)
- Acetaminophen rescue (500 mg) allowed as needed
- Reduction in pain intensity is primary endpoint
- Problem: How to interpret pain response in presence of rescue?
- Proposal: Analyze entire data set with model-based analysis using 2simultaneous exposure-response relationships: Study Drug E-R
Rescue E-R
©2008 metrum research group LLC 32
PKPD in Proof of Concept Trials: IMMPACT 2008
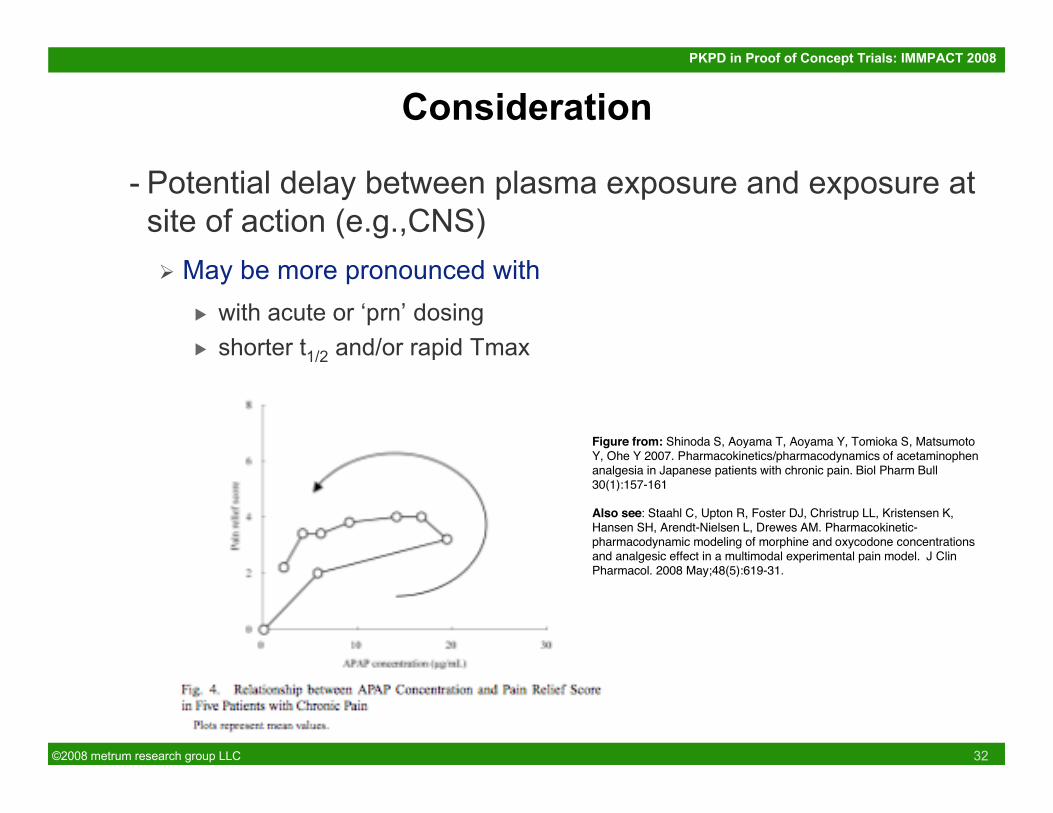
Consideration
- Potential delay between plasma exposure and exposure atsite of action (e.g.,CNS) May be more pronounced with
▶ with acute or ‘prn’ dosing▶ shorter t1/2 and/or rapid Tmax
Figure from: Shinoda S, Aoyama T, Aoyama Y, Tomioka S, MatsumotoY, Ohe Y 2007. Pharmacokinetics/pharmacodynamics of acetaminophenanalgesia in Japanese patients with chronic pain. Biol Pharm Bull30(1):157-161
Also see: Staahl C, Upton R, Foster DJ, Christrup LL, Kristensen K,Hansen SH, Arendt-Nielsen L, Drewes AM. Pharmacokinetic-pharmacodynamic modeling of morphine and oxycodone concentrationsand analgesic effect in a multimodal experimental pain model. J ClinPharmacol. 2008 May;48(5):619-31.
©2008 metrum research group LLC 33
PKPD in Proof of Concept Trials: IMMPACT 2008
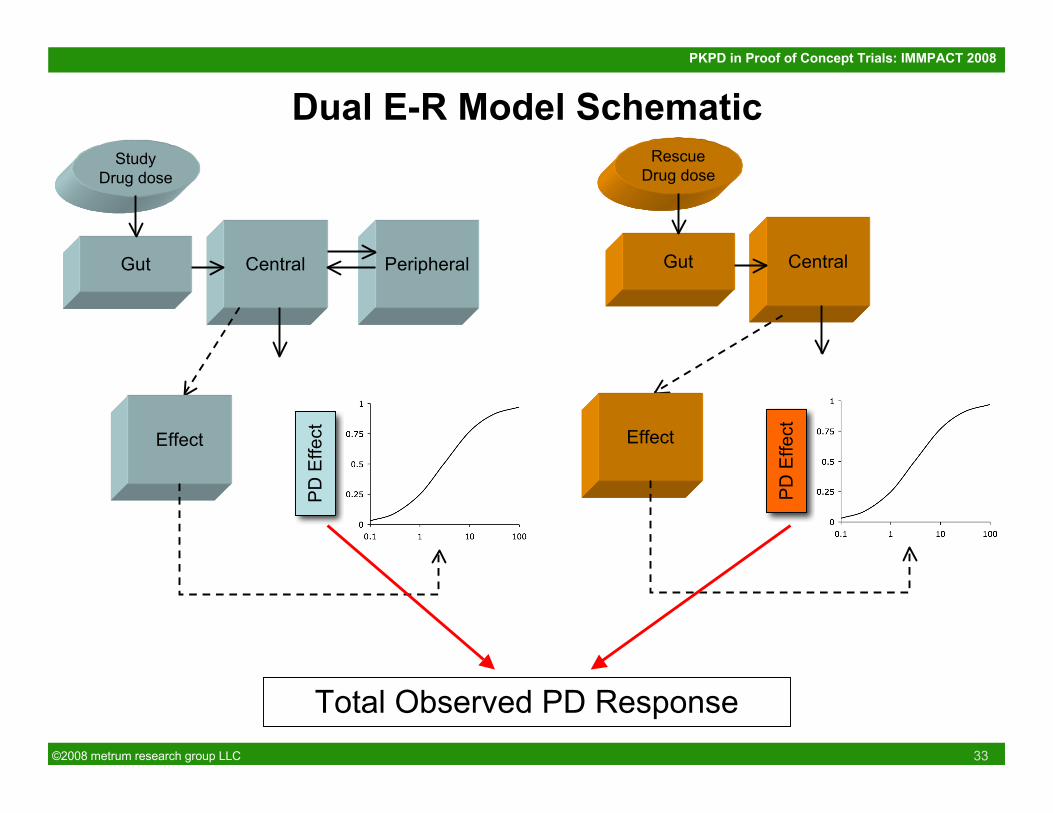
Dual E-R Model Schematic
Gut
StudyDrug dose
Central Peripheral
Effect
PD
Effe
ct
Gut
RescueDrug dose
Central
Effect
PD
Effe
ct
Total Observed PD Response
©2008 metrum research group LLC 34
PKPD in Proof of Concept Trials: IMMPACT 2008
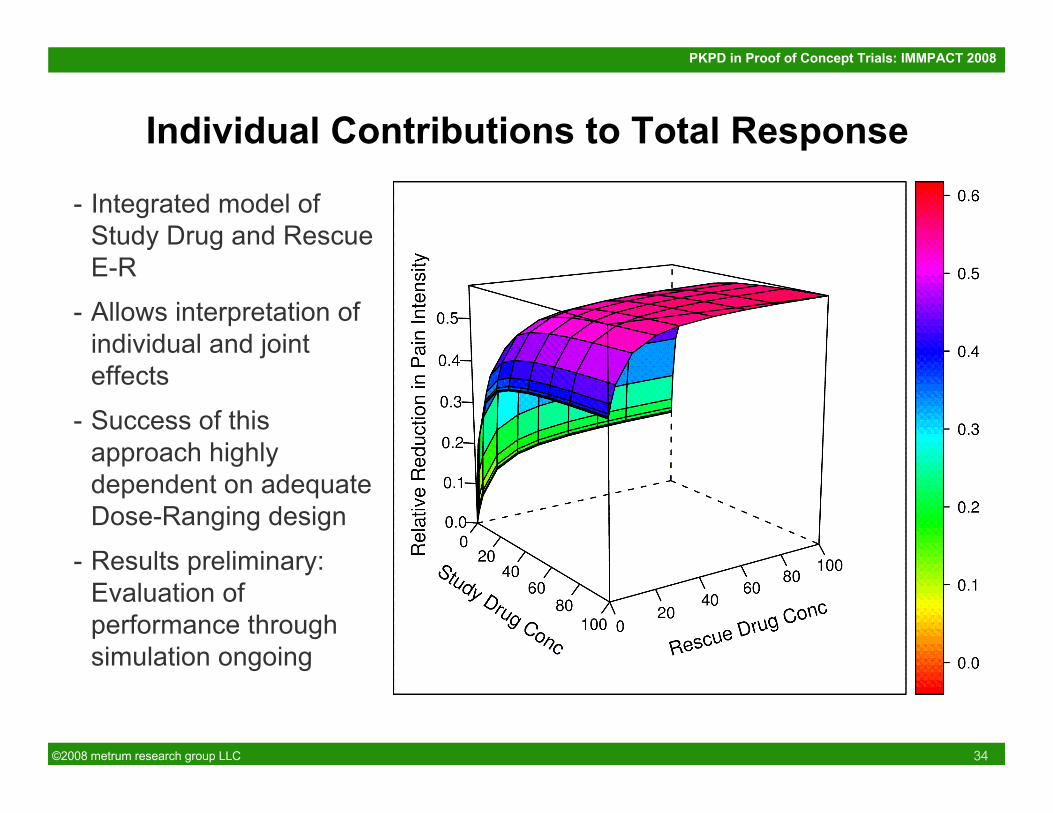
Individual Contributions to Total Response
- Integrated model ofStudy Drug and RescueE-R
- Allows interpretation ofindividual and jointeffects
- Success of thisapproach highlydependent on adequateDose-Ranging design
- Results preliminary:Evaluation ofperformance throughsimulation ongoing
©2008 metrum research group LLC 35
PKPD in Proof of Concept Trials: IMMPACT 2008
Model-Based Inferences in the Presence ofDropout
- Acute pain PoC study
- Dropout after first rescue
- Population nonlinear-mixed effects exposure-response modeldeveloped from observed repeated-measures data (missing Atrandom assumption)
Approach first described in:
Sheiner LB. A new approach to the analysis of analgesic drug trials,illustrated with bromfenac data. Clin Pharmacol Ther. 1994Sep;56(3):309-22.

©2008 metrum research group LLC 36
PKPD in Proof of Concept Trials: IMMPACT 2008
Observed Data
0.25 1 2 4 6 8 10 12
Observed Pain Intensity Placebo (n=34)
Time (hr)
NP
RS
Score
Fre
quency (
%)
020
4060
80100
Rescued
NPRS = 10NPRS = 9
NPRS = 8NPRS = 7
NPRS = 6
NPRS = 5
NPRS = 4NPRS = 3
NPRS = 2NPRS = 1
NPRS = 0
0.25 1 2 4 6 8 10 12
Predicted Pain Intensity Placebo (n=34)
Time (hr)
NP
RS
Score
Fre
quency (
%)
020
4060
80100
0.25 1 2 4 6 8 10 12
Extrapolated Pain Intensity Placebo (n=34)
Time (hr)
NP
RS
Score
Fre
quency (
%)
020
4060
80100
0.25 1 2 4 6 8 10 12
Observed Pain Intensity 60 mg Patients (n=65)
Time (hr)
NP
RS
Score
Fre
quency (
%)
020
4060
80100
Rescued
NPRS = 10NPRS = 9
NPRS = 8NPRS = 7
NPRS = 6
NPRS = 5
NPRS = 4NPRS = 3
NPRS = 2NPRS = 1
NPRS = 0
0.25 1 2 4 6 8 10 12
Predicted Pain Intensity 60 mg Patients (n=65)
Time (hr)
NP
RS
Score
Fre
quency (
%)
020
4060
80100
0.25 1 2 4 6 8 10 12
Extrapolated Pain Intensity 60 mg Patients (n=65)
Time (hr)
NP
RS
Score
Fre
quency (
%)
020
4060
80100
0.25 1 2 4 6 8 10 12
Observed Pain Intensity 120 mg Patients (n=66)
Time (hr)
NP
RS
Score
Fre
quency (
%)
020
4060
80100
Rescued
NPRS = 10NPRS = 9
NPRS = 8NPRS = 7
NPRS = 6
NPRS = 5
NPRS = 4NPRS = 3
NPRS = 2NPRS = 1
NPRS = 0
0.25 1 2 4 6 8 10 12
Predicted Pain Intensity 120 mg Patients (n=66)
Time (hr)
NP
RS
Score
Fre
quency (
%)
020
4060
80100
0.25 1 2 4 6 8 10 12
Extrapolated Pain Intensity 120 mg Patients (n=66)
Time (hr)
NP
RS
Score
Fre
quency (
%)
020
4060
80100
0.25 1 2 4 6 8 10 12
Observed Pain Intensity 120 mg Patients (n=66)
Time (hr)
NP
RS
Score
Fre
quency (
%)
020
4060
80100
Rescued
NPRS = 10NPRS = 9
NPRS = 8NPRS = 7
NPRS = 6
NPRS = 5
NPRS = 4NPRS = 3
NPRS = 2NPRS = 1
NPRS = 0
0.25 1 2 4 6 8 10 12
Predicted Pain Intensity 120 mg Patients (n=66)
Time (hr)
NP
RS
Score
Fre
quency (
%)
020
4060
80100
0.25 1 2 4 6 8 10 12
Extrapolated Pain Intensity 120 mg Patients (n=66)
Time (hr)
NP
RS
Score
Fre
quency (
%)
020
4060
80100
Placebo
Dose 1 Dose 2
Freq
uenc
y of
NP
RS
Sco
re

©2008 metrum research group LLC 37
PKPD in Proof of Concept Trials: IMMPACT 2008
PD Response Time-Course
0 2 4 6 8 10 12
02
46
810
PI121 ID=2036
Time (hr)
Pain
Inte
nsity
0 2 4 6 8 10 12
02
46
810
PI121 ID=2037
Time (hr)
Pain
Inte
nsity
0 2 4 6 8 10 12
02
46
810
PI121 ID=2038
Time (hr)
Pain
Inte
nsity
0 2 4 6 8 10 12
02
46
810
PI121 ID=2039
Time (hr)
Pain
Inte
nsity
0 2 4 6 8 10 12
02
46
810
PI121 ID=2040
Time (hr)
Pain
Inte
nsity
0 2 4 6 8 10 12
02
46
810
PI121 ID=2041
Time (hr)
Pain
Inte
nsity
0 2 4 6 8 10 12
02
46
810
PI121 ID=2042
Time (hr)
Pain
Inte
nsity
0 2 4 6 8 10 12
02
46
810
PI121 ID=2043
Time (hr)
Pain
Inte
nsity
0 2 4 6 8 10 12
02
46
810
PI121 ID=2044
Time (hr)
Pain
Inte
nsity
Pai
n In
tens
ity (N
PR
S)
©2008 metrum research group LLC 38
PKPD in Proof of Concept Trials: IMMPACT 2008
Model-Based Extrapolation
0.25 1 2 4 6 8 10 12
Predicted Pain Intensity 60 mg Patients (n=65)
Time (hr)
NP
RS
Score
Fre
quency (
%)
020
60100
0.25 1 2 4 6 8 10 12
Predicted Pain Intensity 120 mg Patients (n=66)
Time (hr)
NP
RS
Score
Fre
quency (
%)
020
60100
0.25 1 2 4 6 8 10 12
Extrapolated Pain Intensity 60 mg Patients (n=65)
Time (hr)
NP
RS
Score
Fre
quency (
%)
020
60100
0.25 1 2 4 6 8 10 12
Extrapolated Pain Intensity 120 mg Patients (n=66)
Time (hr)
NP
RS
Score
Fre
quency (
%)
020
60100
Rescued
NPRS = 10
NPRS = 9
NPRS = 8
NPRS = 7NPRS = 6
NPRS = 5
NPRS = 4
NPRS = 3
NPRS = 2
NPRS = 1NPRS = 0
0.25 1 2 4 6 8 10 12
Predicted Pain Intensity 60 mg Patients (n=65)
Time (hr)
NP
RS
Score
Fre
quency (
%)
020
60100
0.25 1 2 4 6 8 10 12
Predicted Pain Intensity 120 mg Patients (n=66)
Time (hr)
NP
RS
Score
Fre
quency (
%)
020
60100
0.25 1 2 4 6 8 10 12
Extrapolated Pain Intensity 60 mg Patients (n=65)
Time (hr)
NP
RS
Score
Fre
quency (
%)
020
60100
0.25 1 2 4 6 8 10 12
Extrapolated Pain Intensity 120 mg Patients (n=66)
Time (hr)
NP
RS
Score
Fre
quency (
%)
020
60100
Rescued
NPRS = 10
NPRS = 9
NPRS = 8
NPRS = 7NPRS = 6
NPRS = 5
NPRS = 4
NPRS = 3
NPRS = 2
NPRS = 1NPRS = 0
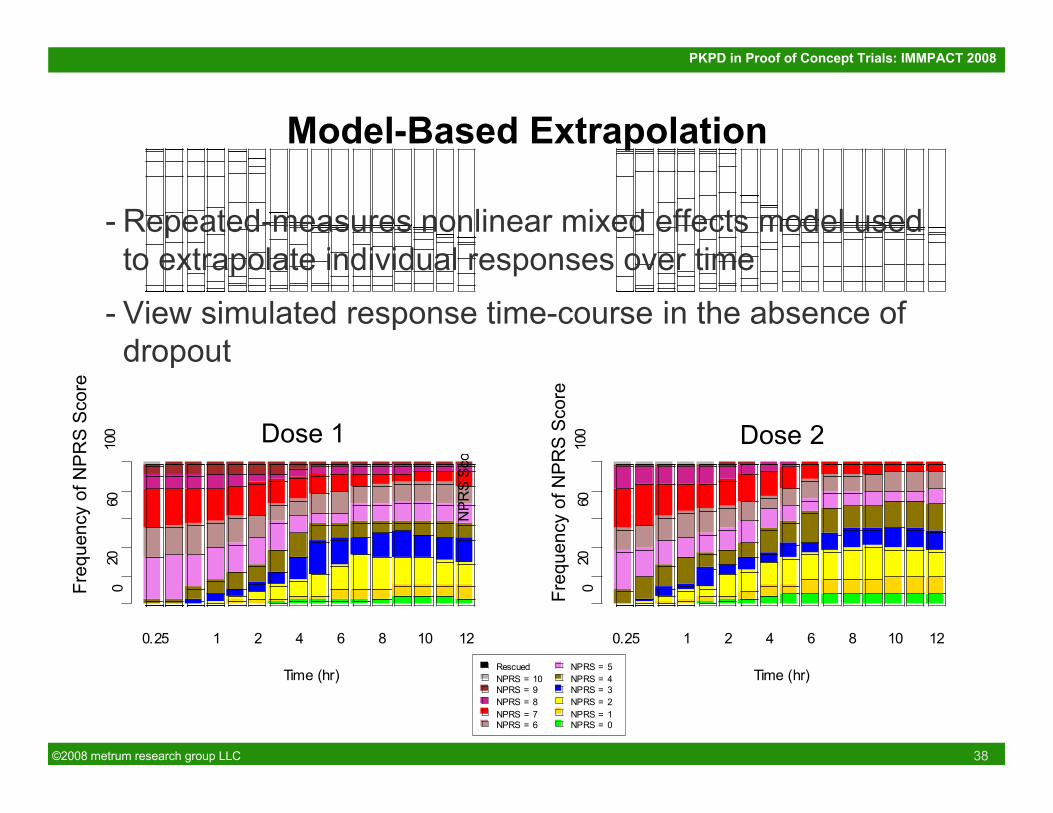
Dose 1 Dose 2
- Repeated-measures nonlinear mixed effects model usedto extrapolate individual responses over time
- View simulated response time-course in the absence ofdropout
Freq
uenc
y of
NP
RS
Sco
re
Freq
uenc
y of
NP
RS
Sco
re
©2008 metrum research group LLC 39
PKPD in Proof of Concept Trials: IMMPACT 2008
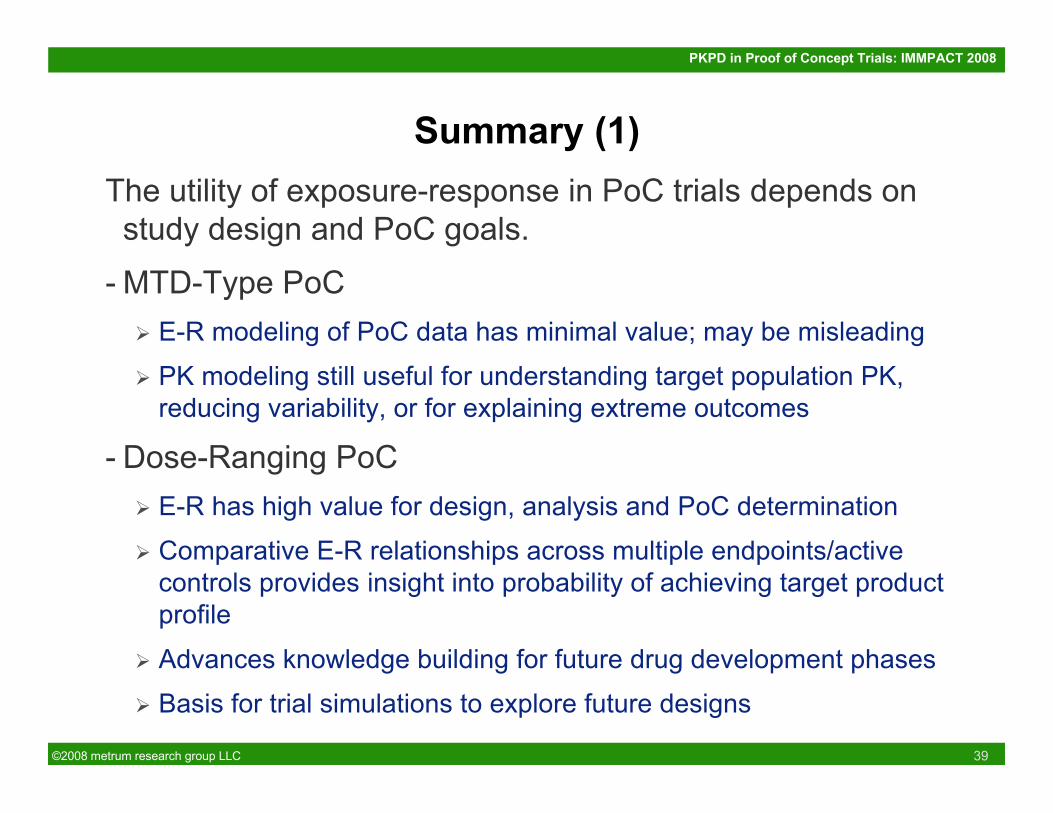
Summary (1)The utility of exposure-response in PoC trials depends onstudy design and PoC goals.
- MTD-Type PoC E-R modeling of PoC data has minimal value; may be misleading
PK modeling still useful for understanding target population PK,reducing variability, or for explaining extreme outcomes
- Dose-Ranging PoC E-R has high value for design, analysis and PoC determination
Comparative E-R relationships across multiple endpoints/activecontrols provides insight into probability of achieving target productprofile
Advances knowledge building for future drug development phases
Basis for trial simulations to explore future designs
©2008 metrum research group LLC 40
PKPD in Proof of Concept Trials: IMMPACT 2008
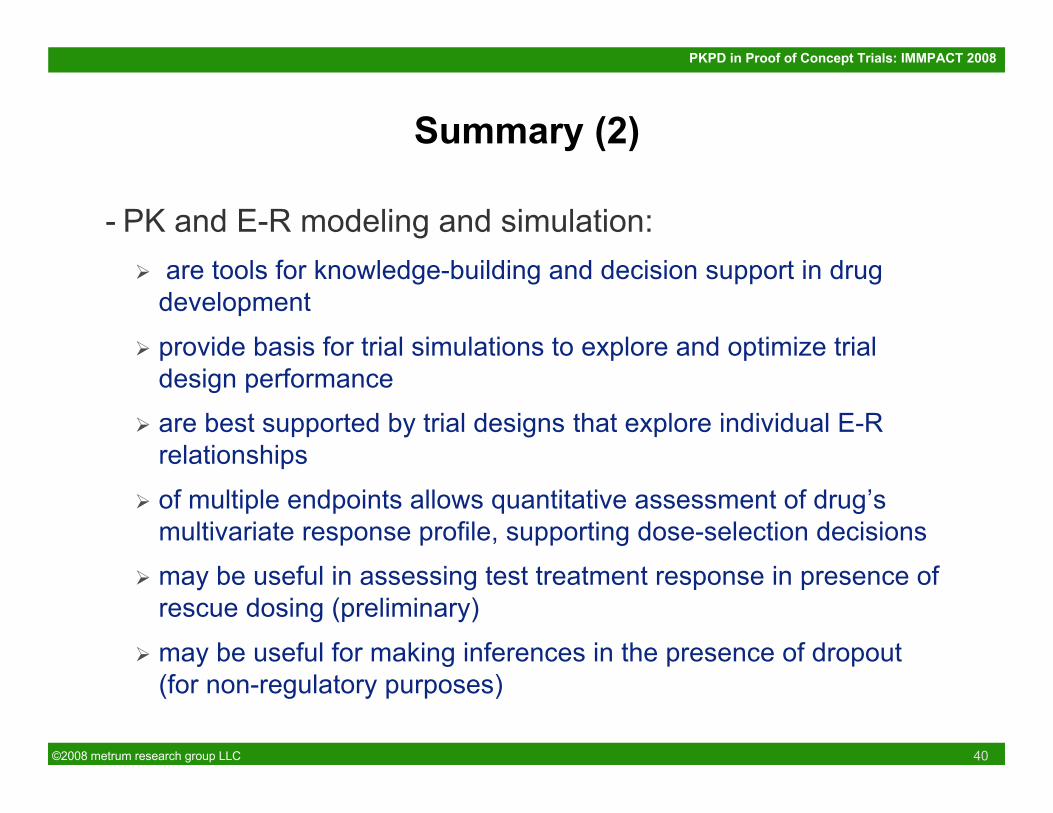
Summary (2)
- PK and E-R modeling and simulation: are tools for knowledge-building and decision support in drug
development
provide basis for trial simulations to explore and optimize trialdesign performance
are best supported by trial designs that explore individual E-Rrelationships
of multiple endpoints allows quantitative assessment of drug’smultivariate response profile, supporting dose-selection decisions
may be useful in assessing test treatment response in presence ofrescue dosing (preliminary)
may be useful for making inferences in the presence of dropout(for non-regulatory purposes)
©2008 metrum research group LLC 41
PKPD in Proof of Concept Trials: IMMPACT 2008
Additional References- Krall RL, KH Engleman, HC Ko, and CC Peck. “Clinical Trial Modeling and Simulation – Warner KE, Peck
CC, Work in Progress.” /Drug Info J/, 32: 971-976, 1998.- Peck CC. “Drug development: Improving the process.” /Food and Drug Law J/. 52 (2):163-167, 1997.- Reigner BG, PEO Williams, IH Patel, J-L Steimer, CC Peck, and P van Brummelen. “An evaluation of the
integration of pharmacokinetic and pharmacodynamic principles in clinical drug development.” /ClinPharmacokinet/, 33(2): 142-52, 1997.
- Biomarkers Definitions Working Group. “Biomarkers and surrogate endpoints: Preferred definitions andconceptual framework.” /Clin Pharm Ther/ 69 (3): 89-95, 2001.
- Galluppi GR, MC Rogge, LK Roskos, LJ Lesko, MD Green, DW Feigal, and CC Peck. “Integration ofpharmacokinetics and pharmacodynamics studies in the discovery, development and review of proteintherapeutic agents: a conference report.” /Clin Pharm Ther/, 2001.
- Holford NHG, JPR Monteleone, HC Kimko, and CC Peck. “Simulation of Clinical Trials” in /Annual RevPharmacol Toxicol./ Vol. 40: 209-234, 2000.
- Lockwood, Ewy, Herman, Holford. Application of Clinical Trial Simulation to Compare Proof of ConceptDesigns for Drugs with a Slow Onset of Effect; An Example in Alzheimer’s Disease. Pharm Res. 23:9, 2006.
- Klingenberg B. A Unified Framework for Proof of Concept and Dose Estimation with Categorical Responses.www.williams.edu/~bklingen .
- Lalonde RL, Kowalski KG, Hutmacher MM, Ewy W, Nichols DJ, Milligan PA, Corrigan BW, Lockwood PA,Marshall SA, Benincosa LJ, Tensfeldt TG, Parivar K, Amantea M, Glue P, Koide H, Miller R. Model-baseddrug development. Clin Pharmacol Ther. 2007 Jul;82(1):21-32.
- Atkinson AJ Jr, Lalonde RL.Introduction of quantitative methods in pharmacology and clinical pharmacology:a historical overview. Clin Pharmacol Ther. 2007 Jul;82(1):3-6.
FDA Presentations on Model-Based Drug Development- http://www.fda.gov/oc/initiatives/criticalpath/presentations.html- http://www.fda.gov/ohrms/dockets/ac/03/slides/3998s1.htm- http://www.aapspharmaceutica.com/meetings/files/38/Booth.ppt
©2008 metrum research group LLC 42
PKPD in Proof of Concept Trials: IMMPACT 2008
Acknowledgements
- Heidi Costa- Leonid Gibiansky- Bill Knebel- Matthew Riggs- Bill Gillespie
- Industry collaborators
Recommended