1
PILLAR 3 (BASEL III) DISCLOSURES AS ON 30.09.2019
CENTRAL BANK OF INDIA
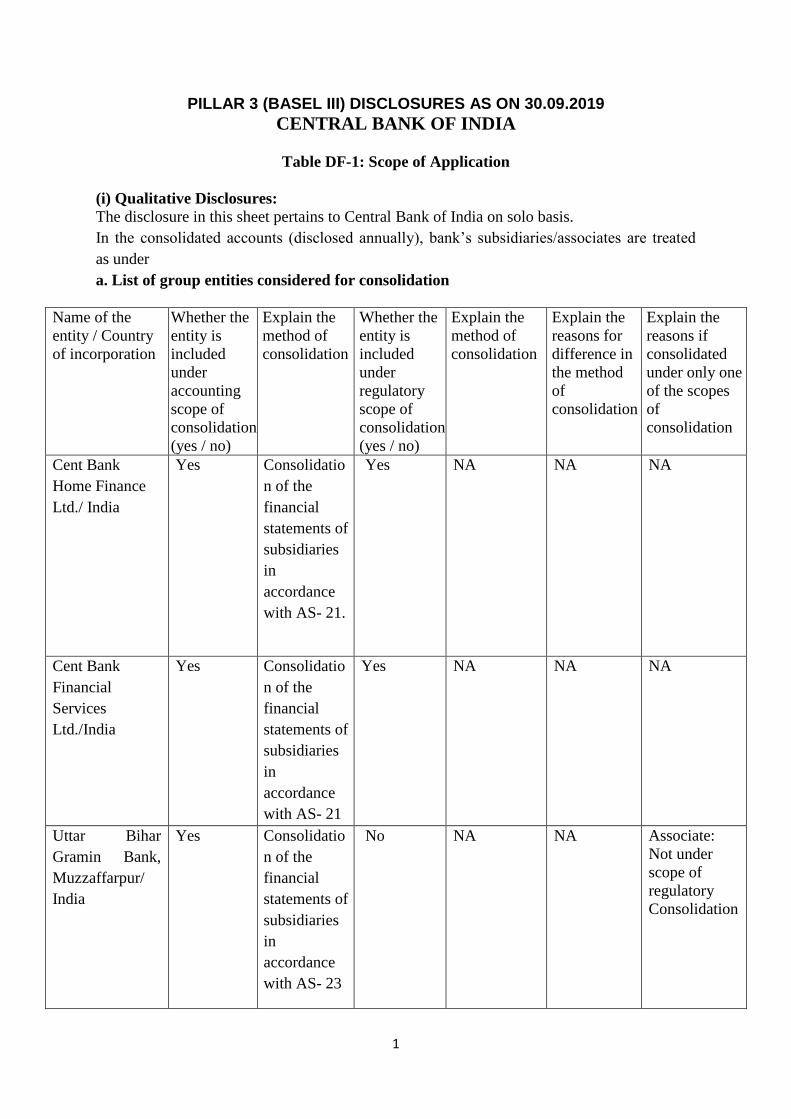
Table DF-1: Scope of Application
(i) Qualitative Disclosures:
The disclosure in this sheet pertains to Central Bank of India on solo basis.
In the consolidated accounts (disclosed annually), bank‟s subsidiaries/associates are treated
as under
a. List of group entities considered for consolidation
Name of the
entity / Country
of incorporation
Whether the
entity is
included
under
accounting
scope of
consolidation
(yes / no)
Explain the
method of
consolidation
Whether the
entity is
included
under
regulatory
scope of
consolidation
(yes / no)
Explain the
method of
consolidation
Explain the
reasons for
difference in
the method
of
consolidation
Explain the
reasons if
consolidated
under only one
of the scopes
of
consolidation
Cent Bank
Home Finance
Ltd./ India
Yes Consolidatio
n of the
financial
statements of
subsidiaries
in
accordance
with AS- 21.
Yes NA NA NA
Cent Bank
Financial
Services
Ltd./India
Yes Consolidatio
n of the
financial
statements of
subsidiaries
in
accordance
with AS- 21
Yes NA NA NA
Uttar Bihar
Gramin Bank,
Muzzaffarpur/
India
Yes Consolidatio
n of the
financial
statements of
subsidiaries
in
accordance
with AS- 23
No NA NA Associate:
Not under
scope of
regulatory
Consolidation
2
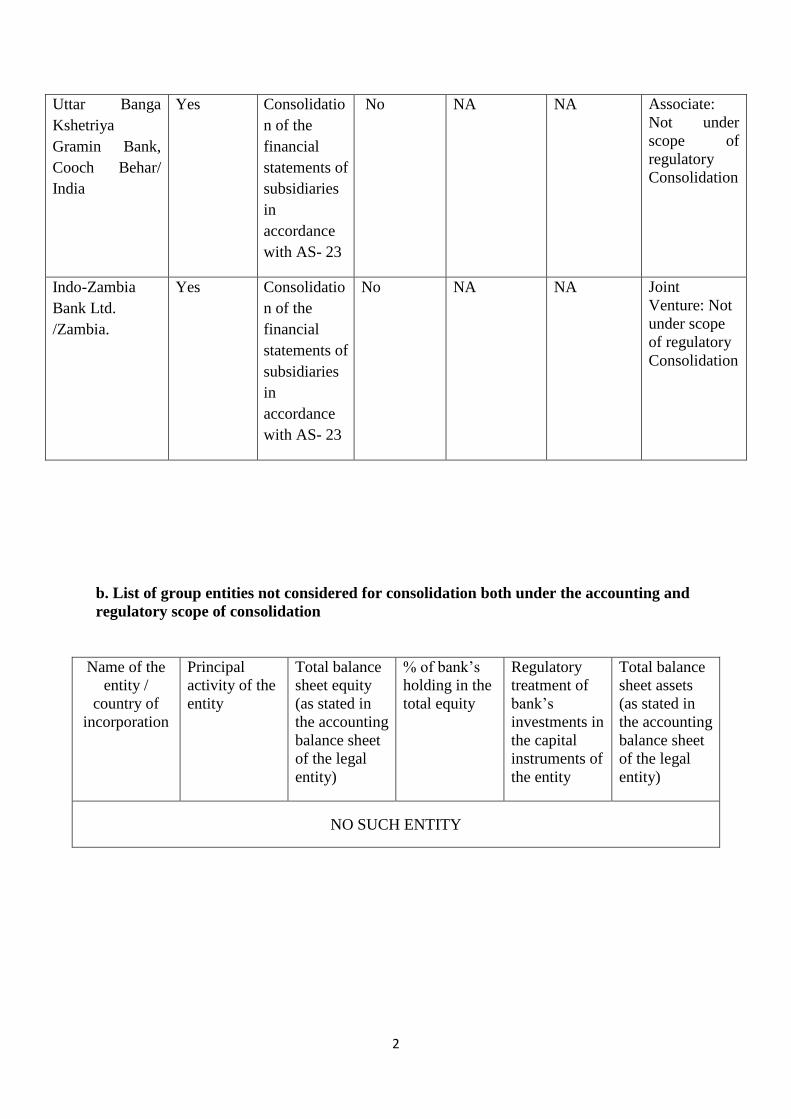
Uttar Banga
Kshetriya
Gramin Bank,
Cooch Behar/
India
Yes Consolidatio
n of the
financial
statements of
subsidiaries
in
accordance
with AS- 23
No NA NA Associate:
Not under
scope of
regulatory
Consolidation
Indo-Zambia
Bank Ltd.
/Zambia.
Yes Consolidatio
n of the
financial
statements of
subsidiaries
in
accordance
with AS- 23
No NA NA Joint
Venture: Not
under scope
of regulatory
Consolidation
b. List of group entities not considered for consolidation both under the accounting and
regulatory scope of consolidation
Name of the
entity /
country of
incorporation
Principal
activity of the
entity
Total balance
sheet equity
(as stated in
the accounting
balance sheet
of the legal
entity)
% of bank‟s
holding in the
total equity
Regulatory
treatment of
bank‟s
investments in
the capital
instruments of
the entity
Total balance
sheet assets
(as stated in
the accounting
balance sheet
of the legal
entity)
NO SUCH ENTITY
3
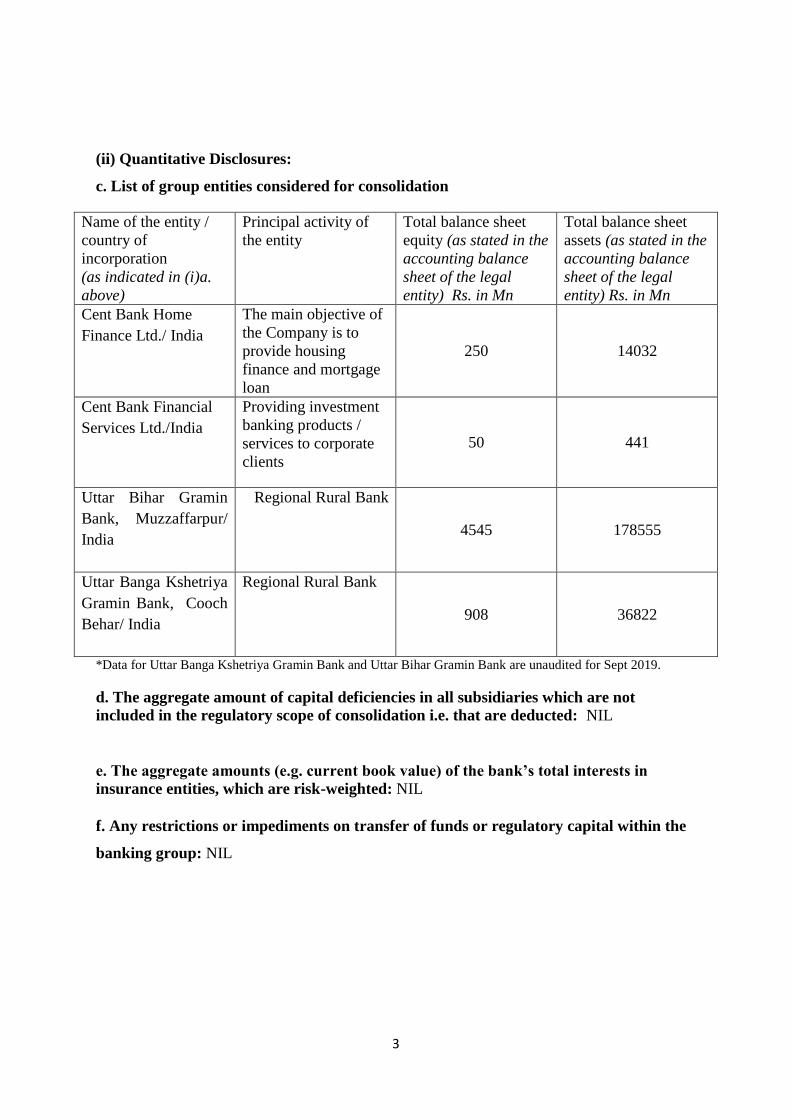
(ii) Quantitative Disclosures:
c. List of group entities considered for consolidation
Name of the entity /
country of
incorporation
(as indicated in (i)a.
above)
Principal activity of
the entity
Total balance sheet
equity (as stated in the
accounting balance
sheet of the legal
entity) Rs. in Mn
Total balance sheet
assets (as stated in the
accounting balance
sheet of the legal
entity) Rs. in Mn
Cent Bank Home
Finance Ltd./ India
The main objective of
the Company is to
provide housing
finance and mortgage
loan
250 14032
Cent Bank Financial
Services Ltd./India
Providing investment
banking products /
services to corporate
clients
50 441
Uttar Bihar Gramin
Bank, Muzzaffarpur/
India
Regional Rural Bank
4545 178555
Uttar Banga Kshetriya
Gramin Bank, Cooch
Behar/ India
Regional Rural Bank
908 36822
*Data for Uttar Banga Kshetriya Gramin Bank and Uttar Bihar Gramin Bank are unaudited for Sept 2019.
d. The aggregate amount of capital deficiencies in all subsidiaries which are not
included in the regulatory scope of consolidation i.e. that are deducted: NIL
e. The aggregate amounts (e.g. current book value) of the bank’s total interests in
insurance entities, which are risk-weighted: NIL
f. Any restrictions or impediments on transfer of funds or regulatory capital within the
banking group: NIL
4
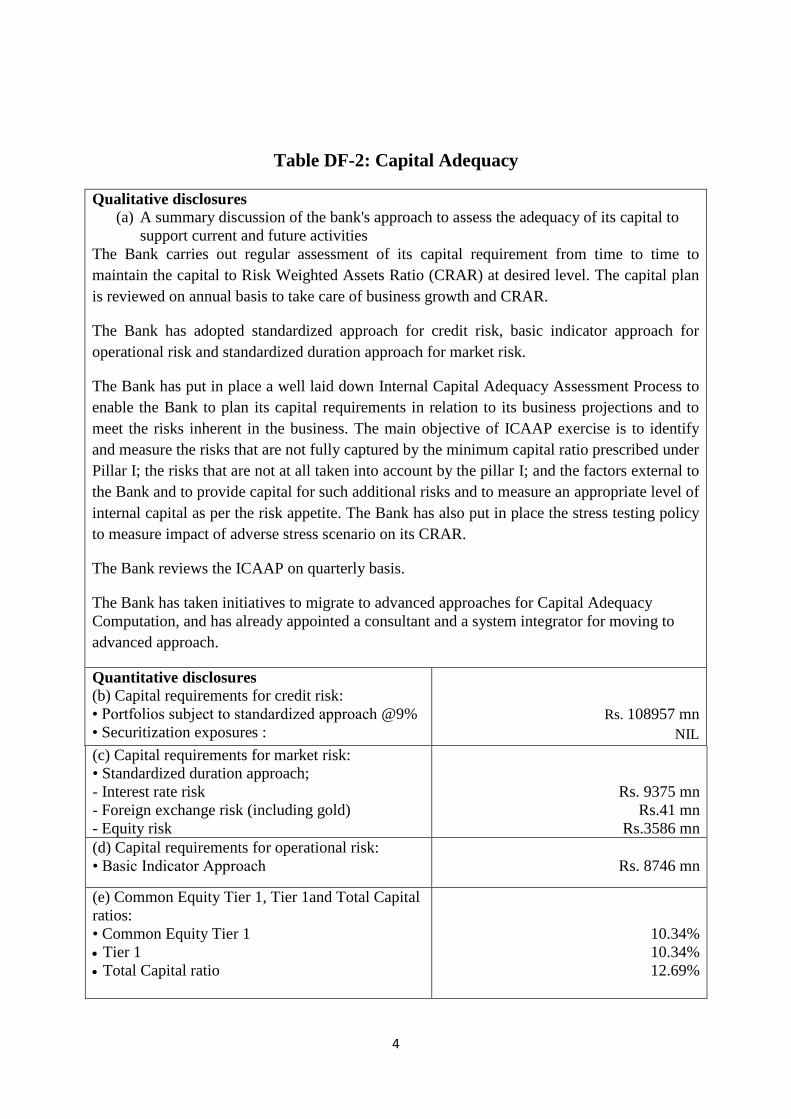
Table DF-2: Capital Adequacy
Qualitative disclosures (a) A summary discussion of the bank's approach to assess the adequacy of its capital to
support current and future activities
The Bank carries out regular assessment of its capital requirement from time to time to
maintain the capital to Risk Weighted Assets Ratio (CRAR) at desired level. The capital plan
is reviewed on annual basis to take care of business growth and CRAR.
The Bank has adopted standardized approach for credit risk, basic indicator approach for
operational risk and standardized duration approach for market risk.
The Bank has put in place a well laid down Internal Capital Adequacy Assessment Process to
enable the Bank to plan its capital requirements in relation to its business projections and to
meet the risks inherent in the business. The main objective of ICAAP exercise is to identify
and measure the risks that are not fully captured by the minimum capital ratio prescribed under
Pillar I; the risks that are not at all taken into account by the pillar I; and the factors external to
the Bank and to provide capital for such additional risks and to measure an appropriate level of
internal capital as per the risk appetite. The Bank has also put in place the stress testing policy
to measure impact of adverse stress scenario on its CRAR.
The Bank reviews the ICAAP on quarterly basis.
The Bank has taken initiatives to migrate to advanced approaches for Capital Adequacy
Computation, and has already appointed a consultant and a system integrator for moving to
advanced approach.
Quantitative disclosures (b) Capital requirements for credit risk:
• Portfolios subject to standardized approach @9%
• Securitization exposures :
Rs. 108957 mn
NIL
(c) Capital requirements for market risk:
• Standardized duration approach;
- Interest rate risk
- Foreign exchange risk (including gold)
- Equity risk
Rs. 9375 mn
Rs.41 mn
Rs.3586 mn
(d) Capital requirements for operational risk:
• Basic Indicator Approach
Rs. 8746 mn
(e) Common Equity Tier 1, Tier 1and Total Capital
ratios:
• Common Equity Tier 1
Tier 1
Total Capital ratio
10.34%
10.34%
12.69%
5
General qualitative disclosure requirement
A committee of Board of Directors regularly oversees the Bank‟s Risk Management
policies/practices under various risks viz. credit, operational, market, etc. The Bank also has
separate committees comprising of top executives of Bank, headed by Managing Director &
CEO and Executive Directors, such as Asset Liability Management, Credit Risk
Management, and Operational Risk Management. These committees meet at regular intervals
to assess and monitor the level of risk under various operations and initiate appropriate
mitigation measures wherever necessary.
The Risk Management Department at Central Office headed by the Chief Risk Officer
(General Manager) measures, controls and manages risk within the limits set by the Board
and enforces compliance with risk parameters set by the committees. The General Manager is
assisted by a team of Deputy General Managers, Assistant General Managers, Chief
Managers, Senior Managers and Managers.
Risk Managers are posted at all Zonal offices who act as extended arms of Risk Management
Department of Central Office. Risk Managers have also been identified at Regional Offices.
The Bank has in place detailed policies such as Credit Risk Policy, Credit Risk Mitigation
and Collateral Management Policy, Enterprise Risk Management Policy, Market Discipline
& Disclosure Policy, Operational Risk Management Policies, ALM Policy, Market Risk
Management Policy, etc.
Besides these, the Loan Policies prescribe the parameters governing loan sourcing, guidelines
on appraisal and evaluation of credit proposals, lending powers of delegated authorities,
exposure norms, prudential limits, and monitoring and supervising the credit portfolio.
Credit Monitoring Department headed by a General Manager monitors the loan portfolio,
identifies Special Mention Accounts and takes corrective measures. Loan Review Mechanism
is implemented by the department apart from managing of accounts under CDR mechanism.
The Bank has introduced rating models for different segments of borrowers including for
retail lending schemes which measure the risks associated with counterparties and helps in
making lending and pricing decisions. In case of large borrowers, credit risk assessment
models evaluate financial risk, Industry risk, management risk and business risk of the
counter party. Conduct of account is also factored in for arriving at an overall rating of the
counter party. Facility rating module is also available in the rating tool. Where parental
support as corporate guarantee is available, it is also factored in.
6
Table DF-3
Credit risk: General disclosures for all banks
Qualitative Disclosures
Credit risk
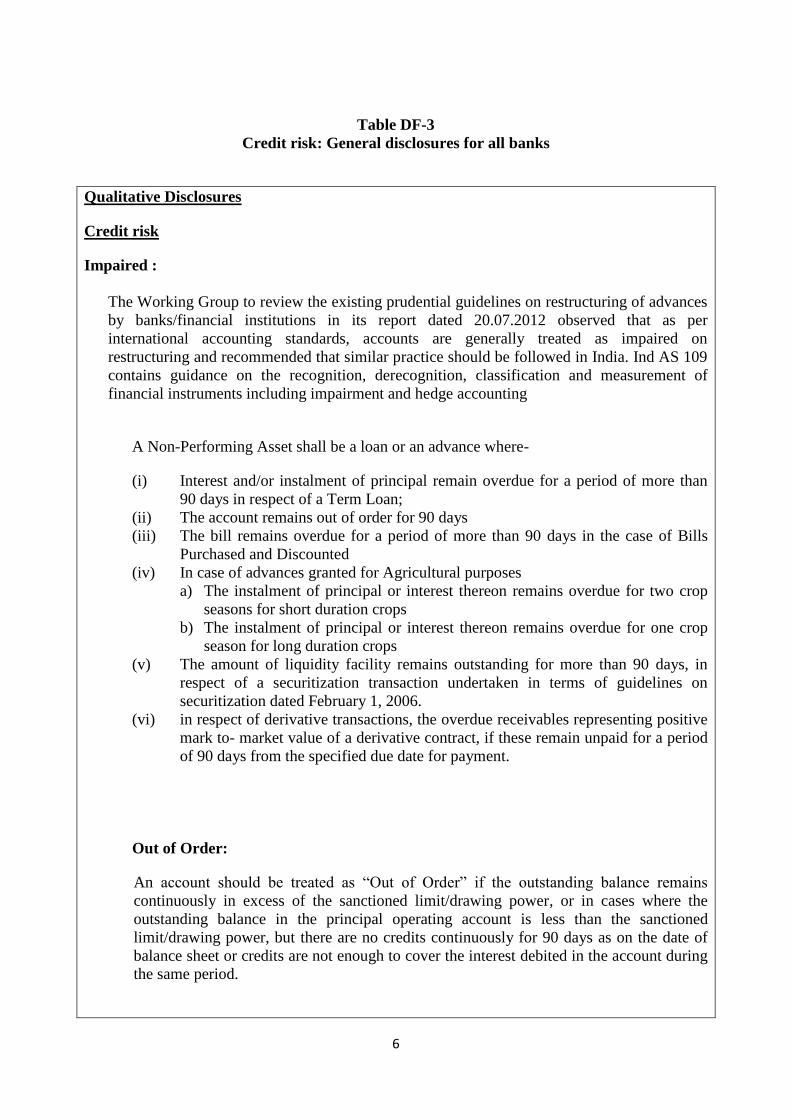
Impaired :
The Working Group to review the existing prudential guidelines on restructuring of advances
by banks/financial institutions in its report dated 20.07.2012 observed that as per
international accounting standards, accounts are generally treated as impaired on
restructuring and recommended that similar practice should be followed in India. Ind AS 109
contains guidance on the recognition, derecognition, classification and measurement of
financial instruments including impairment and hedge accounting
A Non-Performing Asset shall be a loan or an advance where-
(i) Interest and/or instalment of principal remain overdue for a period of more than
90 days in respect of a Term Loan;
(ii) The account remains out of order for 90 days
(iii) The bill remains overdue for a period of more than 90 days in the case of Bills
Purchased and Discounted
(iv) In case of advances granted for Agricultural purposes
a) The instalment of principal or interest thereon remains overdue for two crop
seasons for short duration crops
b) The instalment of principal or interest thereon remains overdue for one crop
season for long duration crops
(v) The amount of liquidity facility remains outstanding for more than 90 days, in
respect of a securitization transaction undertaken in terms of guidelines on
securitization dated February 1, 2006.
(vi) in respect of derivative transactions, the overdue receivables representing positive
mark to- market value of a derivative contract, if these remain unpaid for a period
of 90 days from the specified due date for payment.
Out of Order:
An account should be treated as “Out of Order” if the outstanding balance remains
continuously in excess of the sanctioned limit/drawing power, or in cases where the
outstanding balance in the principal operating account is less than the sanctioned
limit/drawing power, but there are no credits continuously for 90 days as on the date of
balance sheet or credits are not enough to cover the interest debited in the account during
the same period.
7
Overdue:
Any amount due to a bank under any credit facility is overdue if it is not paid on due date
fixed by the bank.
Credit Risk Management Policy
The Bank has put in place a well-articulated Board approved Credit Risk Policy which is
reviewed annually. The policy deals with the following areas:
Credit risk- definition, Policy and strategy
Risk identification & measurement,
Risk grading and aggregation,
Credit risk rating framework and reporting,
Risk control and portfolio management,
Mitigation techniques,
Target markets and type of economic activity,
Credit approval authority,
Country and currency exposure,
Maturity patterns, level of diversification,
Cyclical aspect of the economy,
Credit risk in off balance sheet exposure,
Credit risk monitoring procedures
Managing of credit risk in interbank exposure,
Country risk and other operational matters
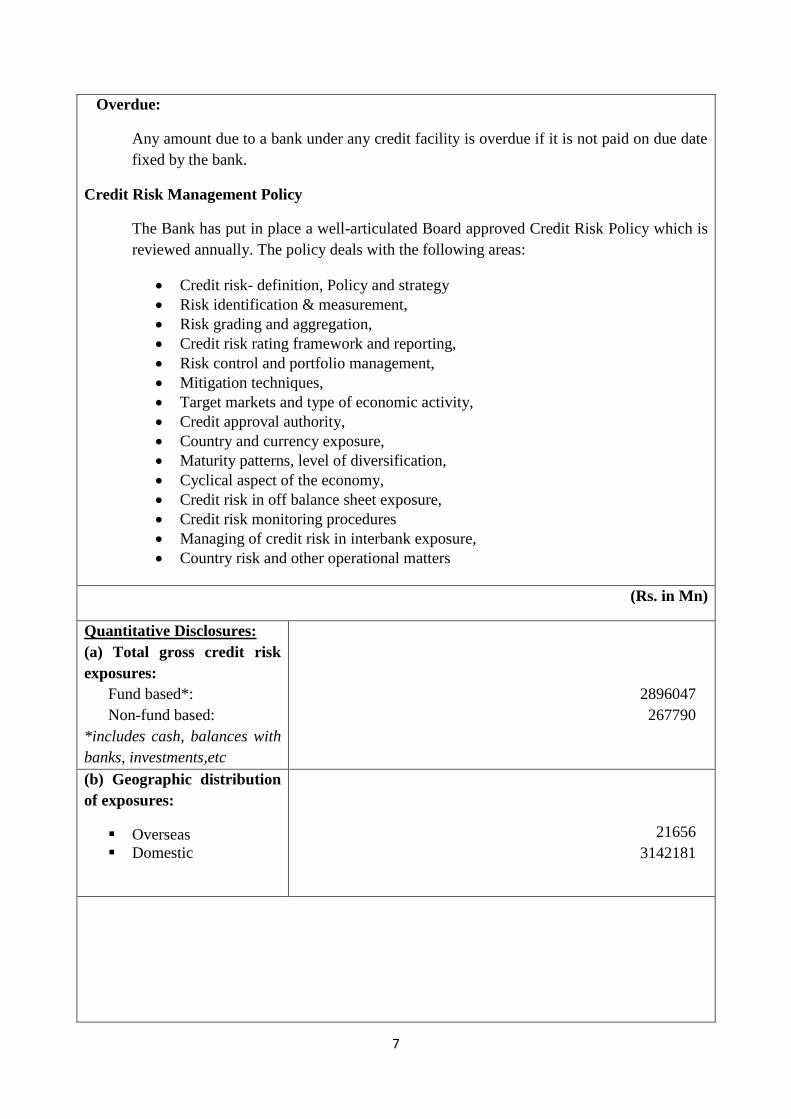
(Rs. in Mn)
Quantitative Disclosures:
(a) Total gross credit risk
exposures:
Fund based*:
Non-fund based:
*includes cash, balances with
banks, investments,etc
2896047
267790
(b) Geographic distribution
of exposures:
Overseas
Domestic
21656
3142181
8
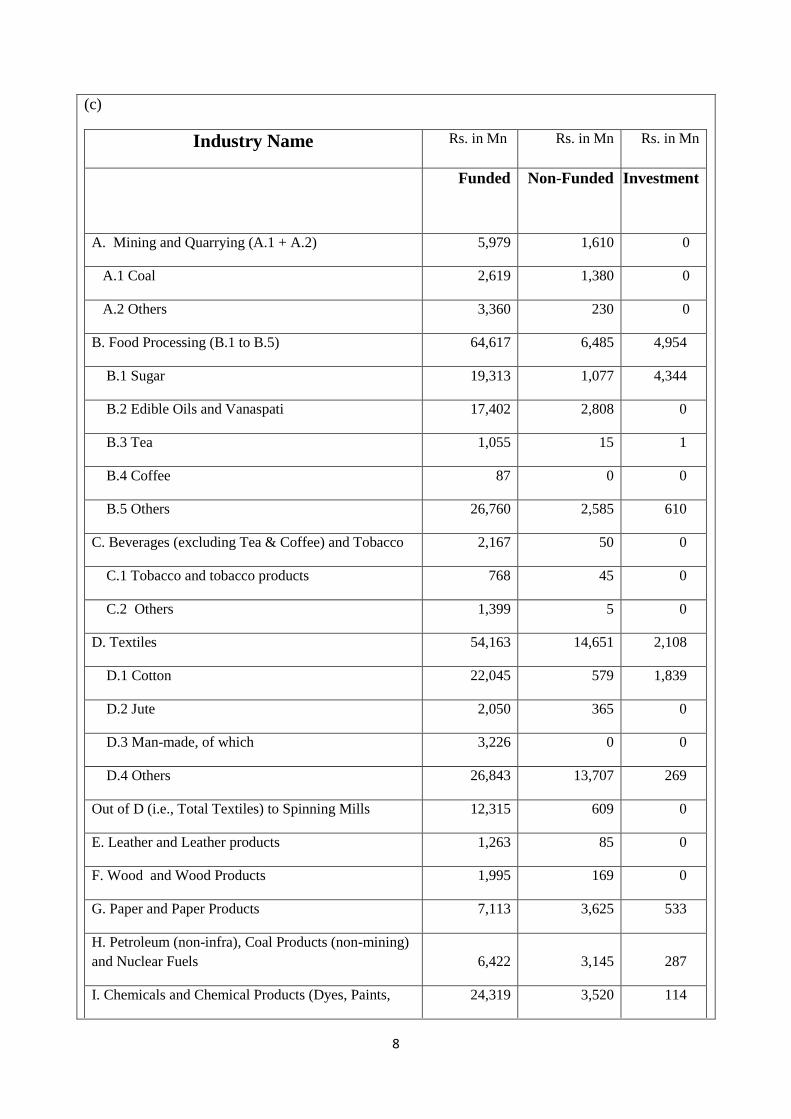
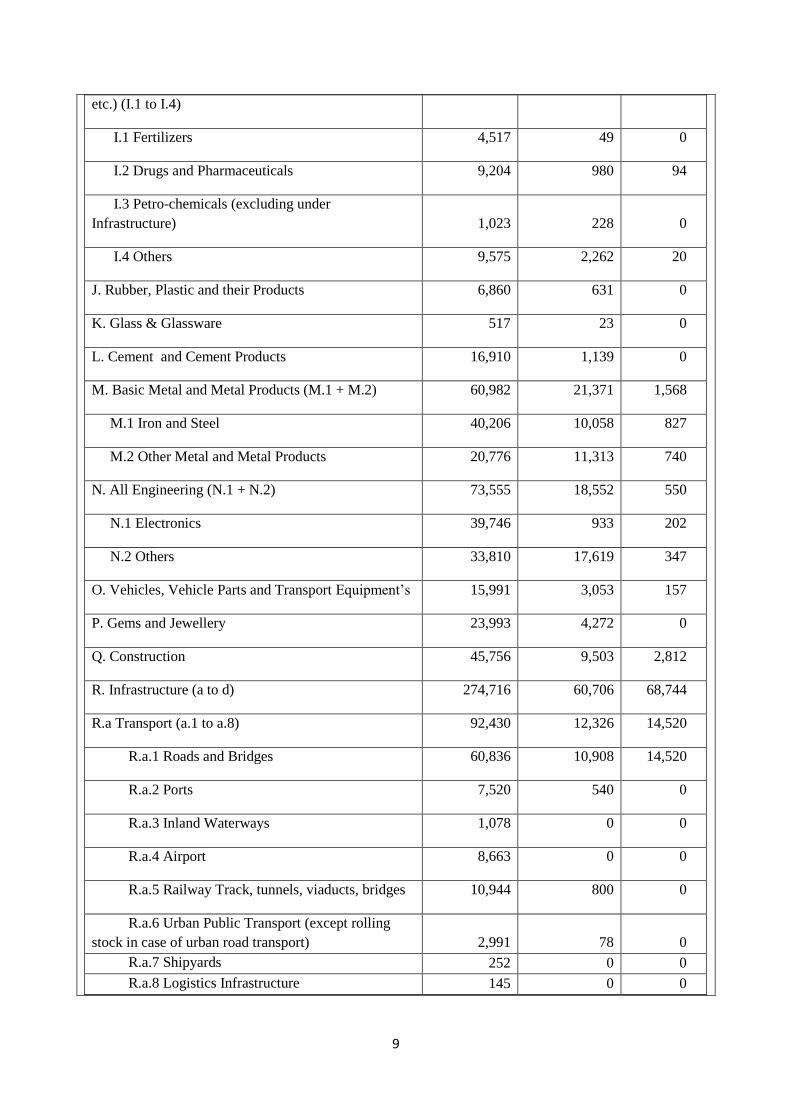
(c)
Industry Name Rs. in Mn Rs. in Mn Rs. in Mn
Funded Non-Funded Investment
A. Mining and Quarrying (A.1 + A.2) 5,979 1,610 0
A.1 Coal 2,619 1,380 0
A.2 Others 3,360 230 0
B. Food Processing (B.1 to B.5) 64,617 6,485 4,954
B.1 Sugar 19,313 1,077 4,344
B.2 Edible Oils and Vanaspati 17,402 2,808 0
B.3 Tea 1,055 15 1
B.4 Coffee 87 0 0
B.5 Others 26,760 2,585 610
C. Beverages (excluding Tea & Coffee) and Tobacco 2,167 50 0
C.1 Tobacco and tobacco products 768 45 0
C.2 Others 1,399 5 0
D. Textiles 54,163 14,651 2,108
D.1 Cotton 22,045 579 1,839
D.2 Jute 2,050 365 0
D.3 Man-made, of which 3,226 0 0
D.4 Others 26,843 13,707 269
Out of D (i.e., Total Textiles) to Spinning Mills 12,315 609 0
E. Leather and Leather products 1,263 85 0
F. Wood and Wood Products 1,995 169 0
G. Paper and Paper Products 7,113 3,625 533
H. Petroleum (non-infra), Coal Products (non-mining)
and Nuclear Fuels 6,422 3,145 287
I. Chemicals and Chemical Products (Dyes, Paints, 24,319 3,520 114
9
etc.) (I.1 to I.4)
I.1 Fertilizers 4,517 49 0
I.2 Drugs and Pharmaceuticals 9,204 980 94
I.3 Petro-chemicals (excluding under
Infrastructure) 1,023 228 0
I.4 Others 9,575 2,262 20
J. Rubber, Plastic and their Products 6,860 631 0
K. Glass & Glassware 517 23 0
L. Cement and Cement Products 16,910 1,139 0
M. Basic Metal and Metal Products (M.1 + M.2) 60,982 21,371 1,568
M.1 Iron and Steel 40,206 10,058 827
M.2 Other Metal and Metal Products 20,776 11,313 740
N. All Engineering (N.1 + N.2) 73,555 18,552 550
N.1 Electronics 39,746 933 202
N.2 Others 33,810 17,619 347
O. Vehicles, Vehicle Parts and Transport Equipment‟s 15,991 3,053 157
P. Gems and Jewellery 23,993 4,272 0
Q. Construction 45,756 9,503 2,812
R. Infrastructure (a to d) 274,716 60,706 68,744
R.a Transport (a.1 to a.8) 92,430 12,326 14,520
R.a.1 Roads and Bridges 60,836 10,908 14,520
R.a.2 Ports 7,520 540 0
R.a.3 Inland Waterways 1,078 0 0
R.a.4 Airport 8,663 0 0
R.a.5 Railway Track, tunnels, viaducts, bridges 10,944 800 0
R.a.6 Urban Public Transport (except rolling
stock in case of urban road transport) 2,991 78 0
R.a.7 Shipyards 252 0 0
R.a.8 Logistics Infrastructure 145 0 0
10
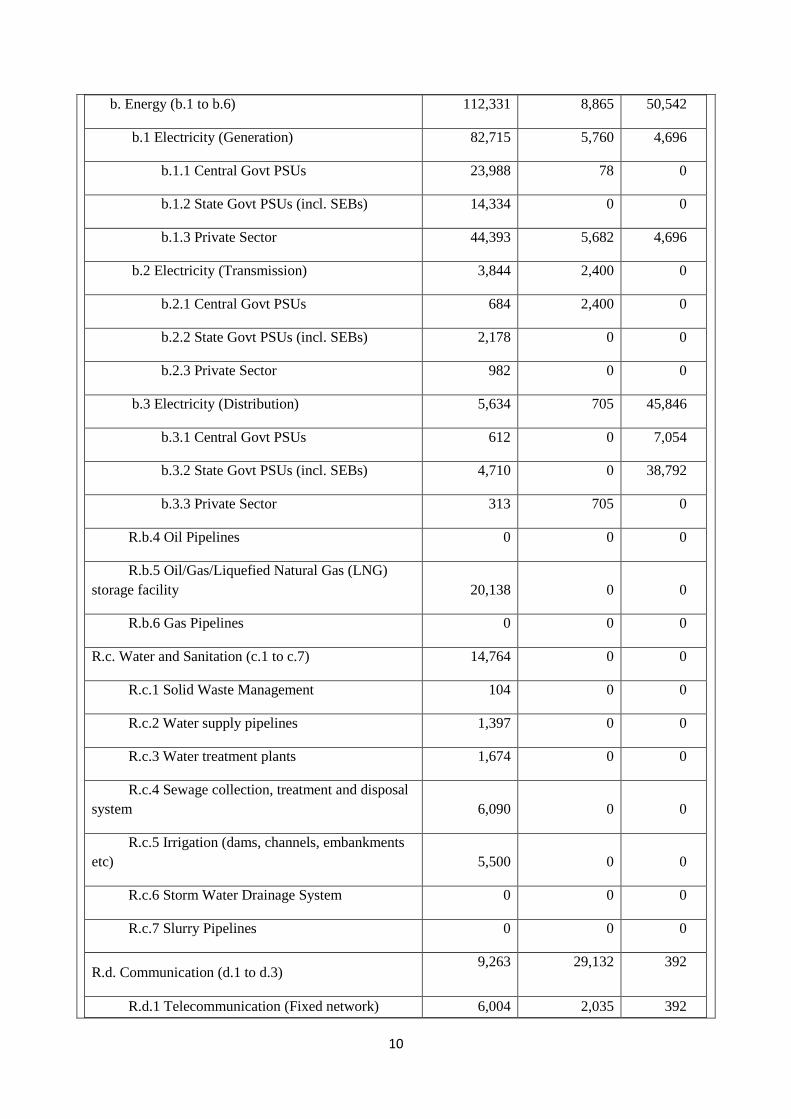
b. Energy (b.1 to b.6) 112,331 8,865 50,542
b.1 Electricity (Generation) 82,715 5,760 4,696
b.1.1 Central Govt PSUs 23,988 78 0
b.1.2 State Govt PSUs (incl. SEBs) 14,334 0 0
b.1.3 Private Sector 44,393 5,682 4,696
b.2 Electricity (Transmission) 3,844 2,400 0
b.2.1 Central Govt PSUs 684 2,400 0
b.2.2 State Govt PSUs (incl. SEBs) 2,178 0 0
b.2.3 Private Sector 982 0 0
b.3 Electricity (Distribution) 5,634 705 45,846
b.3.1 Central Govt PSUs 612 0 7,054
b.3.2 State Govt PSUs (incl. SEBs) 4,710 0 38,792
b.3.3 Private Sector 313 705 0
R.b.4 Oil Pipelines 0 0 0
R.b.5 Oil/Gas/Liquefied Natural Gas (LNG)
storage facility 20,138 0 0
R.b.6 Gas Pipelines 0 0 0
R.c. Water and Sanitation (c.1 to c.7) 14,764 0 0
R.c.1 Solid Waste Management 104 0 0
R.c.2 Water supply pipelines 1,397 0 0
R.c.3 Water treatment plants 1,674 0 0
R.c.4 Sewage collection, treatment and disposal
system 6,090 0 0
R.c.5 Irrigation (dams, channels, embankments
etc) 5,500 0 0
R.c.6 Storm Water Drainage System 0 0 0
R.c.7 Slurry Pipelines 0 0 0
R.d. Communication (d.1 to d.3) 9,263 29,132 392
R.d.1 Telecommunication (Fixed network) 6,004 2,035 392
11
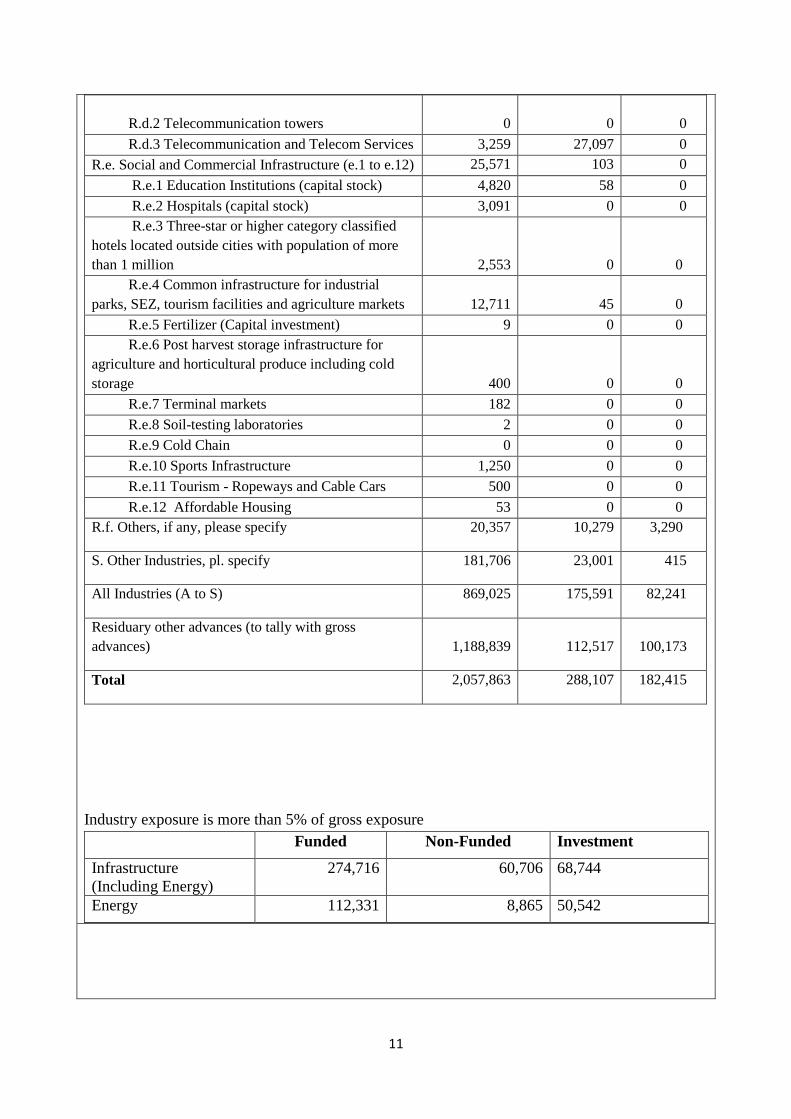
R.d.2 Telecommunication towers 0 0 0
R.d.3 Telecommunication and Telecom Services 3,259 27,097 0
R.e. Social and Commercial Infrastructure (e.1 to e.12) 25,571 103 0
R.e.1 Education Institutions (capital stock) 4,820 58 0
R.e.2 Hospitals (capital stock) 3,091 0 0
R.e.3 Three-star or higher category classified
hotels located outside cities with population of more
than 1 million 2,553 0 0
R.e.4 Common infrastructure for industrial
parks, SEZ, tourism facilities and agriculture markets 12,711 45 0
R.e.5 Fertilizer (Capital investment) 9 0 0
R.e.6 Post harvest storage infrastructure for
agriculture and horticultural produce including cold
storage 400 0 0
R.e.7 Terminal markets 182 0 0
R.e.8 Soil-testing laboratories 2 0 0
R.e.9 Cold Chain 0 0 0
R.e.10 Sports Infrastructure 1,250 0 0
R.e.11 Tourism - Ropeways and Cable Cars 500 0 0
R.e.12 Affordable Housing 53 0 0
R.f. Others, if any, please specify 20,357 10,279 3,290
S. Other Industries, pl. specify 181,706 23,001 415
All Industries (A to S) 869,025 175,591 82,241
Residuary other advances (to tally with gross
advances) 1,188,839 112,517 100,173
Total 2,057,863 288,107 182,415
Industry exposure is more than 5% of gross exposure
Funded Non-Funded Investment
Infrastructure
(Including Energy)
274,716 60,706 68,744
Energy 112,331 8,865 50,542
12
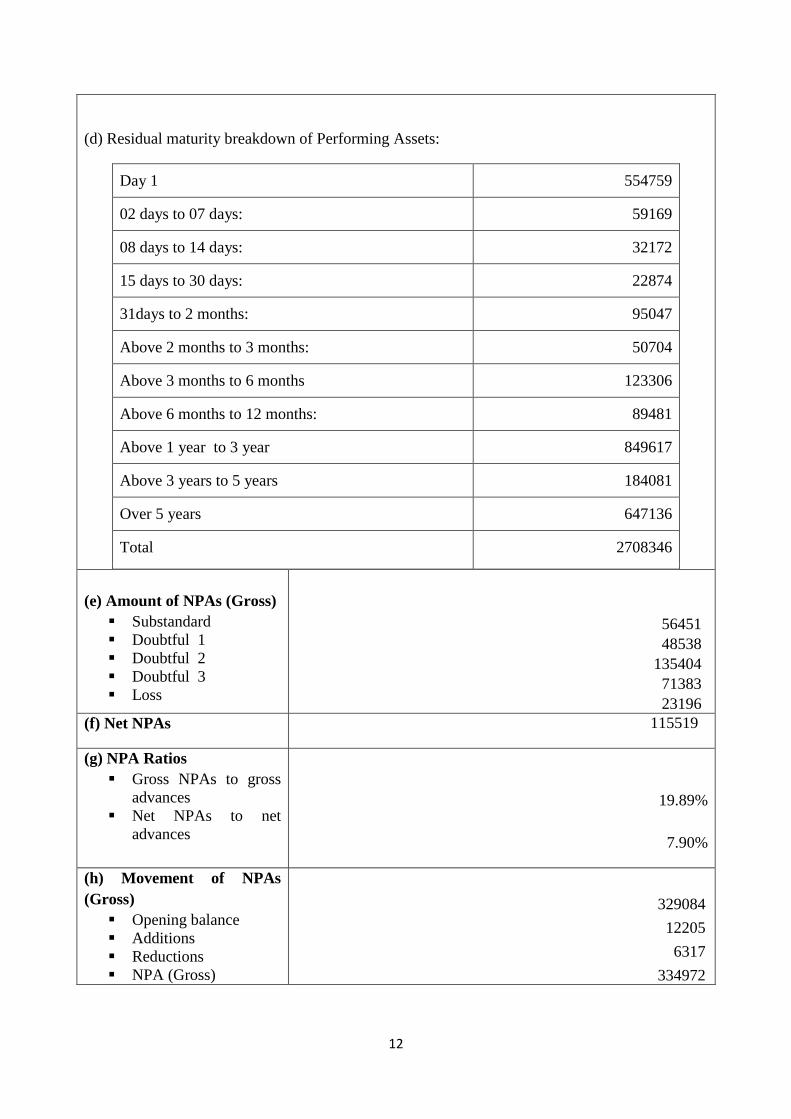
(d) Residual maturity breakdown of Performing Assets:
Day 1 554759
02 days to 07 days: 59169
08 days to 14 days: 32172
15 days to 30 days: 22874
31days to 2 months: 95047
Above 2 months to 3 months: 50704
Above 3 months to 6 months 123306
Above 6 months to 12 months: 89481
Above 1 year to 3 year 849617
Above 3 years to 5 years 184081
Over 5 years 647136
Total 2708346
(e) Amount of NPAs (Gross)
Substandard
Doubtful 1
Doubtful 2
Doubtful 3
Loss
56451
48538
135404
71383
23196
(f) Net NPAs 115519
(g) NPA Ratios
Gross NPAs to gross
advances
Net NPAs to net
advances
19.89%
7.90%
(h) Movement of NPAs
(Gross)
Opening balance
Additions
Reductions
NPA (Gross)
329084
12205
6317
334972
13
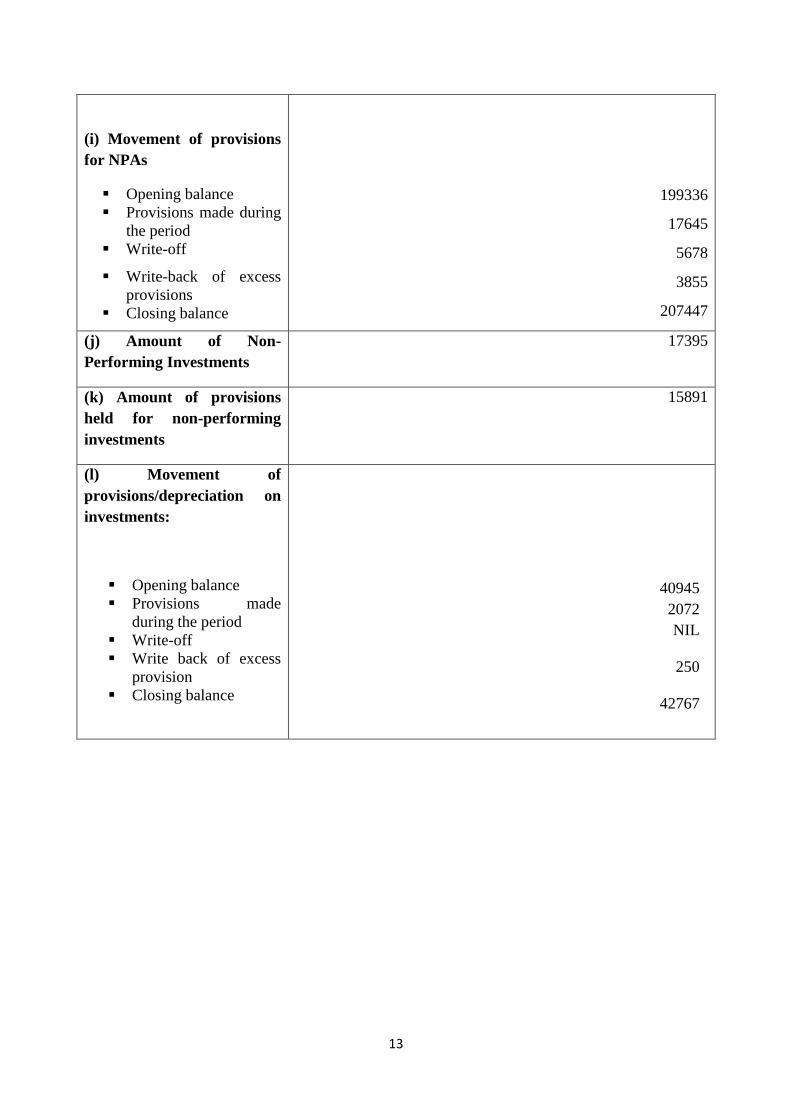
(i) Movement of provisions
for NPAs
Opening balance
Provisions made during
the period
Write-off
Write-back of excess
provisions
Closing balance
199336
17645
5678
3855
207447
(j) Amount of Non-
Performing Investments
17395
(k) Amount of provisions
held for non-performing
investments
15891
(l) Movement of
provisions/depreciation on
investments:
Opening balance
Provisions made
during the period
Write-off
Write back of excess
provision
Closing balance
40945
2072
NIL
250
42767
14
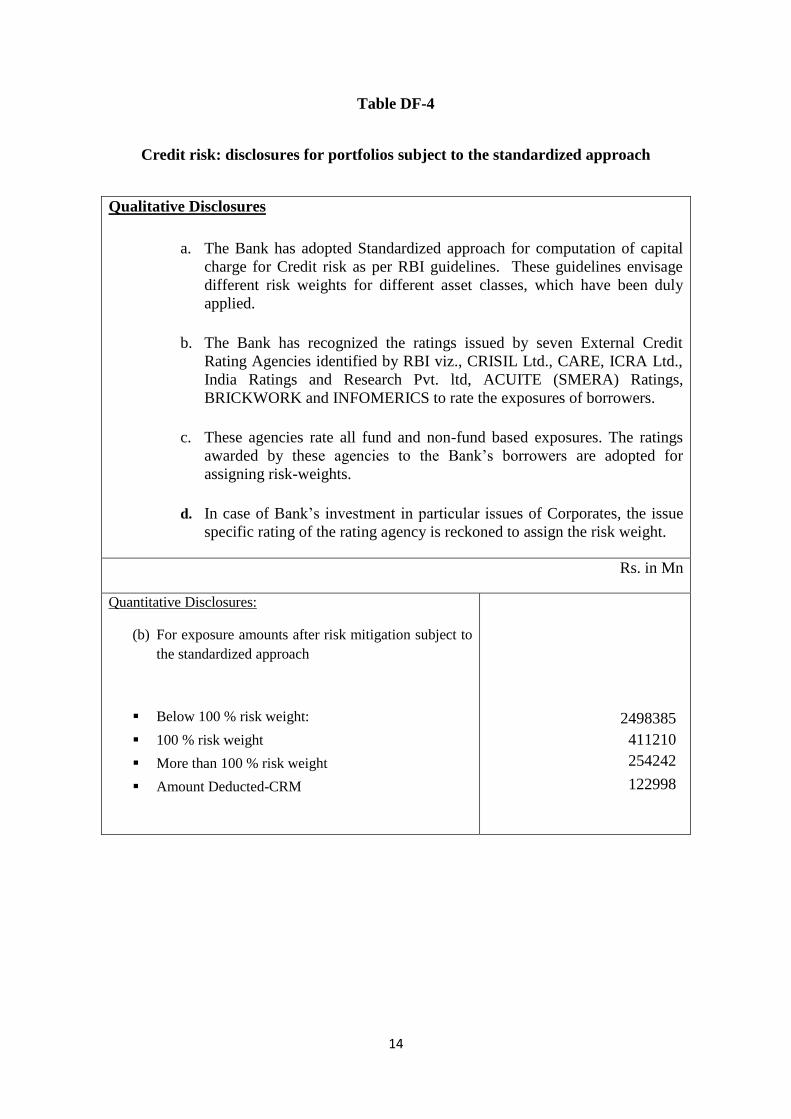
Table DF-4
Credit risk: disclosures for portfolios subject to the standardized approach
Qualitative Disclosures
a. The Bank has adopted Standardized approach for computation of capital
charge for Credit risk as per RBI guidelines. These guidelines envisage
different risk weights for different asset classes, which have been duly
applied.
b. The Bank has recognized the ratings issued by seven External Credit
Rating Agencies identified by RBI viz., CRISIL Ltd., CARE, ICRA Ltd.,
India Ratings and Research Pvt. ltd, ACUITE (SMERA) Ratings,
BRICKWORK and INFOMERICS to rate the exposures of borrowers.
c. These agencies rate all fund and non-fund based exposures. The ratings
awarded by these agencies to the Bank‟s borrowers are adopted for
assigning risk-weights.
d. In case of Bank‟s investment in particular issues of Corporates, the issue
specific rating of the rating agency is reckoned to assign the risk weight.
Rs. in Mn
Quantitative Disclosures:
(b) For exposure amounts after risk mitigation subject to
the standardized approach
Below 100 % risk weight:
100 % risk weight
More than 100 % risk weight
Amount Deducted-CRM
2498385
411210
254242
122998
15
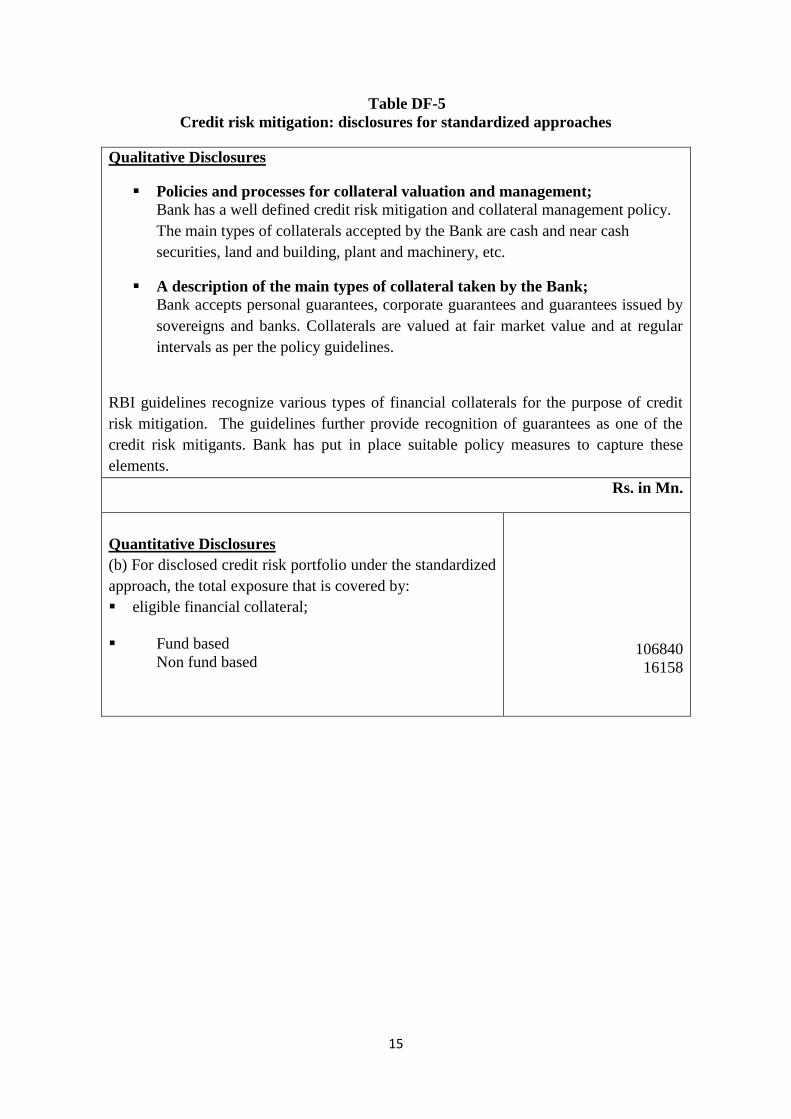
Table DF-5
Credit risk mitigation: disclosures for standardized approaches
Qualitative Disclosures
Policies and processes for collateral valuation and management;
Bank has a well defined credit risk mitigation and collateral management policy.
The main types of collaterals accepted by the Bank are cash and near cash
securities, land and building, plant and machinery, etc.
A description of the main types of collateral taken by the Bank;
Bank accepts personal guarantees, corporate guarantees and guarantees issued by
sovereigns and banks. Collaterals are valued at fair market value and at regular
intervals as per the policy guidelines.
RBI guidelines recognize various types of financial collaterals for the purpose of credit
risk mitigation. The guidelines further provide recognition of guarantees as one of the
credit risk mitigants. Bank has put in place suitable policy measures to capture these
elements.
Rs. in Mn.
Quantitative Disclosures
(b) For disclosed credit risk portfolio under the standardized
approach, the total exposure that is covered by:
eligible financial collateral;
Fund based
Non fund based
106840
16158
16
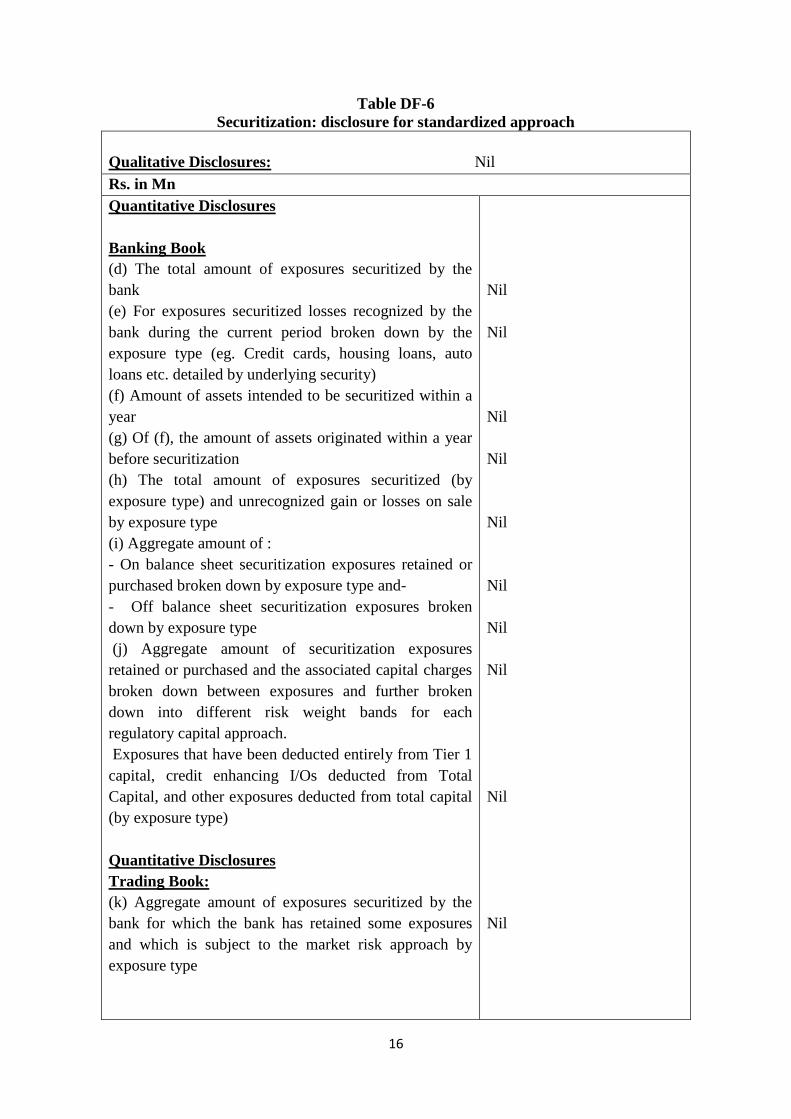
Table DF-6
Securitization: disclosure for standardized approach
Qualitative Disclosures: Nil
Rs. in Mn
Quantitative Disclosures
Banking Book
(d) The total amount of exposures securitized by the
bank
(e) For exposures securitized losses recognized by the
bank during the current period broken down by the
exposure type (eg. Credit cards, housing loans, auto
loans etc. detailed by underlying security)
(f) Amount of assets intended to be securitized within a
year
(g) Of (f), the amount of assets originated within a year
before securitization
(h) The total amount of exposures securitized (by
exposure type) and unrecognized gain or losses on sale
by exposure type
(i) Aggregate amount of :
- On balance sheet securitization exposures retained or
purchased broken down by exposure type and-
- Off balance sheet securitization exposures broken
down by exposure type
(j) Aggregate amount of securitization exposures
retained or purchased and the associated capital charges
broken down between exposures and further broken
down into different risk weight bands for each
regulatory capital approach.
Exposures that have been deducted entirely from Tier 1
capital, credit enhancing I/Os deducted from Total
Capital, and other exposures deducted from total capital
(by exposure type)
Quantitative Disclosures
Trading Book:
(k) Aggregate amount of exposures securitized by the
bank for which the bank has retained some exposures
and which is subject to the market risk approach by
exposure type
Nil
Nil
Nil
Nil
Nil
Nil
Nil
Nil
Nil
Nil
17
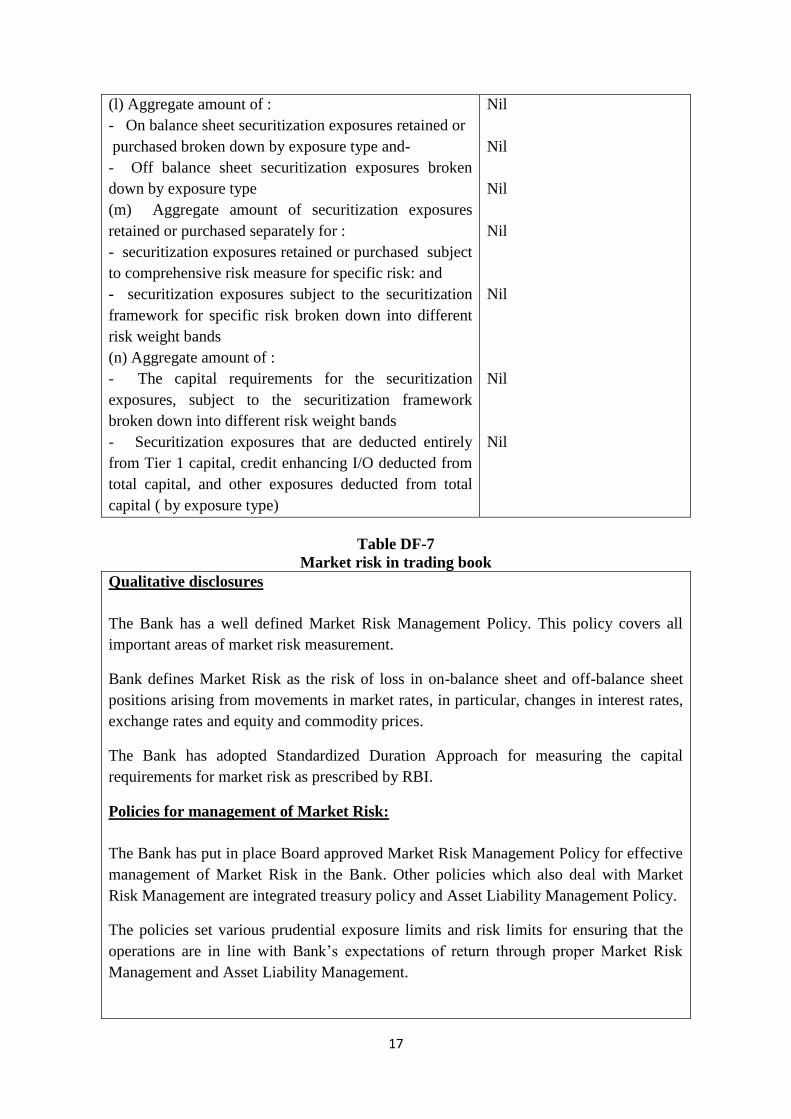
(l) Aggregate amount of :
- On balance sheet securitization exposures retained or
purchased broken down by exposure type and-
- Off balance sheet securitization exposures broken
down by exposure type
(m) Aggregate amount of securitization exposures
retained or purchased separately for :
- securitization exposures retained or purchased subject
to comprehensive risk measure for specific risk: and
- securitization exposures subject to the securitization
framework for specific risk broken down into different
risk weight bands
(n) Aggregate amount of :
- The capital requirements for the securitization
exposures, subject to the securitization framework
broken down into different risk weight bands
- Securitization exposures that are deducted entirely
from Tier 1 capital, credit enhancing I/O deducted from
total capital, and other exposures deducted from total
capital ( by exposure type)
Nil
Nil
Nil
Nil
Nil
Nil
Nil
Table DF-7
Market risk in trading book
Qualitative disclosures
The Bank has a well defined Market Risk Management Policy. This policy covers all
important areas of market risk measurement.
Bank defines Market Risk as the risk of loss in on-balance sheet and off-balance sheet
positions arising from movements in market rates, in particular, changes in interest rates,
exchange rates and equity and commodity prices.
The Bank has adopted Standardized Duration Approach for measuring the capital
requirements for market risk as prescribed by RBI.
Policies for management of Market Risk:
The Bank has put in place Board approved Market Risk Management Policy for effective
management of Market Risk in the Bank. Other policies which also deal with Market
Risk Management are integrated treasury policy and Asset Liability Management Policy.
The policies set various prudential exposure limits and risk limits for ensuring that the
operations are in line with Bank‟s expectations of return through proper Market Risk
Management and Asset Liability Management.
18
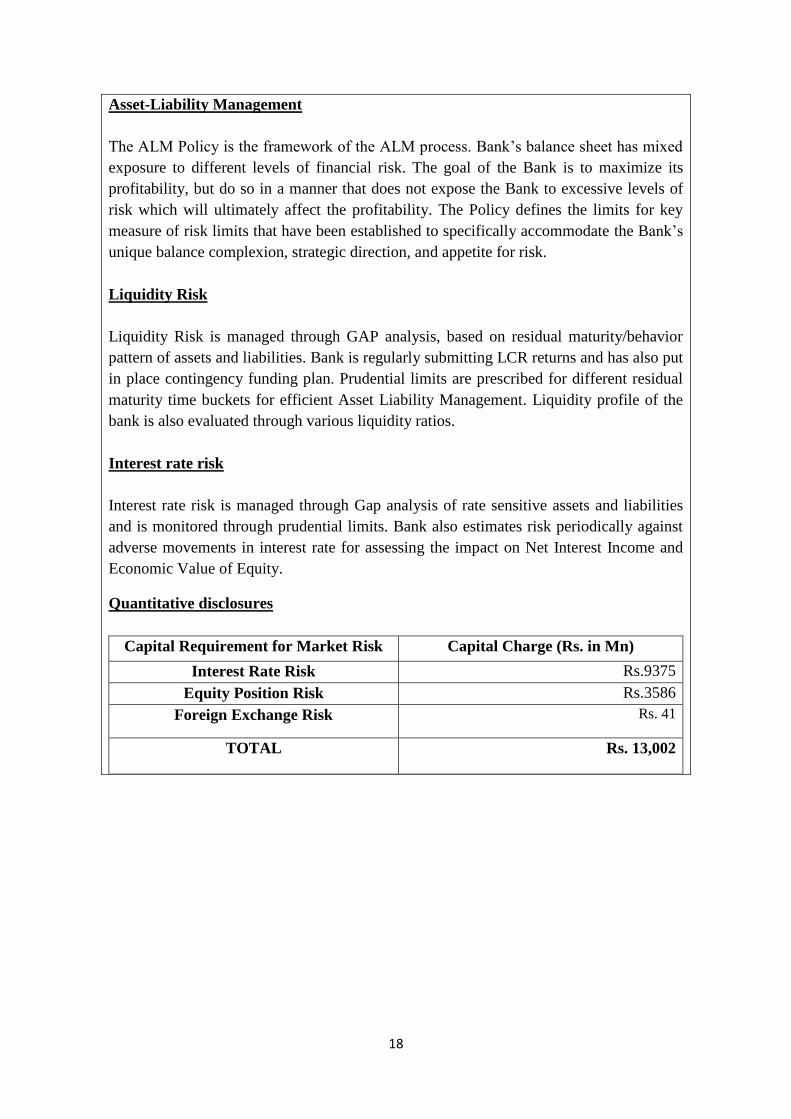
Asset-Liability Management
The ALM Policy is the framework of the ALM process. Bank‟s balance sheet has mixed
exposure to different levels of financial risk. The goal of the Bank is to maximize its
profitability, but do so in a manner that does not expose the Bank to excessive levels of
risk which will ultimately affect the profitability. The Policy defines the limits for key
measure of risk limits that have been established to specifically accommodate the Bank‟s
unique balance complexion, strategic direction, and appetite for risk.
Liquidity Risk
Liquidity Risk is managed through GAP analysis, based on residual maturity/behavior
pattern of assets and liabilities. Bank is regularly submitting LCR returns and has also put
in place contingency funding plan. Prudential limits are prescribed for different residual
maturity time buckets for efficient Asset Liability Management. Liquidity profile of the
bank is also evaluated through various liquidity ratios.
Interest rate risk
Interest rate risk is managed through Gap analysis of rate sensitive assets and liabilities
and is monitored through prudential limits. Bank also estimates risk periodically against
adverse movements in interest rate for assessing the impact on Net Interest Income and
Economic Value of Equity.
Quantitative disclosures
Capital Requirement for Market Risk Capital Charge (Rs. in Mn)
Interest Rate Risk Rs.9375
Equity Position Risk Rs.3586
Foreign Exchange Risk Rs. 41
TOTAL Rs. 13,002
19
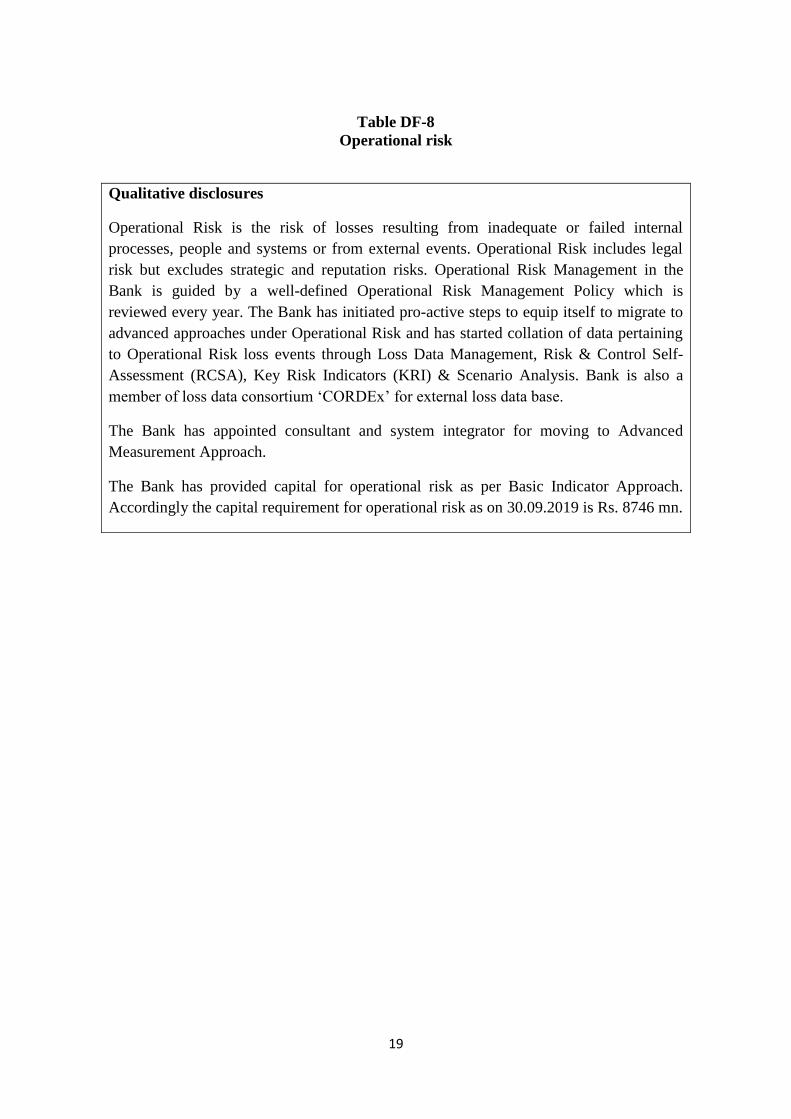
Table DF-8
Operational risk
Qualitative disclosures
Operational Risk is the risk of losses resulting from inadequate or failed internal
processes, people and systems or from external events. Operational Risk includes legal
risk but excludes strategic and reputation risks. Operational Risk Management in the
Bank is guided by a well-defined Operational Risk Management Policy which is
reviewed every year. The Bank has initiated pro-active steps to equip itself to migrate to
advanced approaches under Operational Risk and has started collation of data pertaining
to Operational Risk loss events through Loss Data Management, Risk & Control Self-
Assessment (RCSA), Key Risk Indicators (KRI) & Scenario Analysis. Bank is also a
member of loss data consortium „CORDEx‟ for external loss data base.
The Bank has appointed consultant and system integrator for moving to Advanced
Measurement Approach.
The Bank has provided capital for operational risk as per Basic Indicator Approach.
Accordingly the capital requirement for operational risk as on 30.09.2019 is Rs. 8746 mn.
20
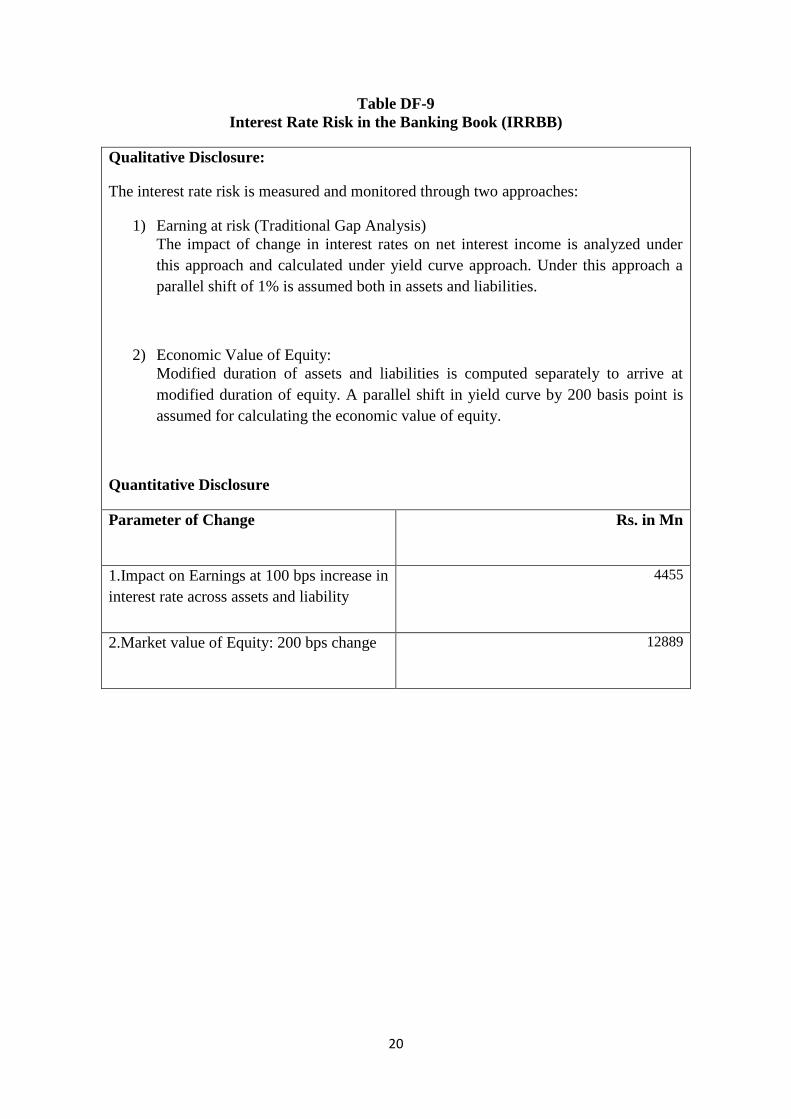
Table DF-9
Interest Rate Risk in the Banking Book (IRRBB)
Qualitative Disclosure:
The interest rate risk is measured and monitored through two approaches:
1) Earning at risk (Traditional Gap Analysis)
The impact of change in interest rates on net interest income is analyzed under
this approach and calculated under yield curve approach. Under this approach a
parallel shift of 1% is assumed both in assets and liabilities.
2) Economic Value of Equity:
Modified duration of assets and liabilities is computed separately to arrive at
modified duration of equity. A parallel shift in yield curve by 200 basis point is
assumed for calculating the economic value of equity.
Quantitative Disclosure
Parameter of Change Rs. in Mn
1.Impact on Earnings at 100 bps increase in
interest rate across assets and liability
4455
2.Market value of Equity: 200 bps change 12889
21
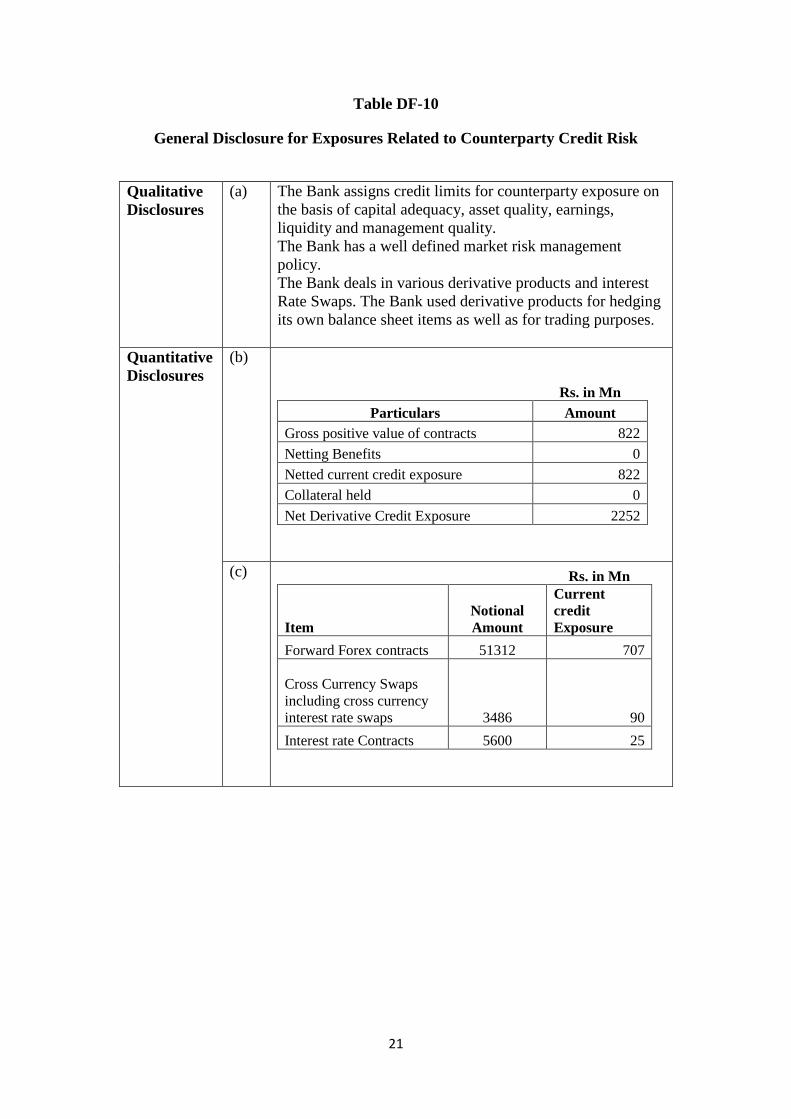
Table DF-10
General Disclosure for Exposures Related to Counterparty Credit Risk
Qualitative
Disclosures
(a) The Bank assigns credit limits for counterparty exposure on
the basis of capital adequacy, asset quality, earnings,
liquidity and management quality.
The Bank has a well defined market risk management
policy. The Bank deals in various derivative products and interest
Rate Swaps. The Bank used derivative products for hedging
its own balance sheet items as well as for trading purposes.
Quantitative
Disclosures
(b)
Rs. in Mn
Particulars Amount
Gross positive value of contracts 822
Netting Benefits 0
Netted current credit exposure 822
Collateral held 0
Net Derivative Credit Exposure 2252
(c)
Rs. in Mn
Item
Notional
Amount
Current
credit
Exposure
Forward Forex contracts 51312 707
Cross Currency Swaps
including cross currency
interest rate swaps 3486 90
Interest rate Contracts 5600 25
22
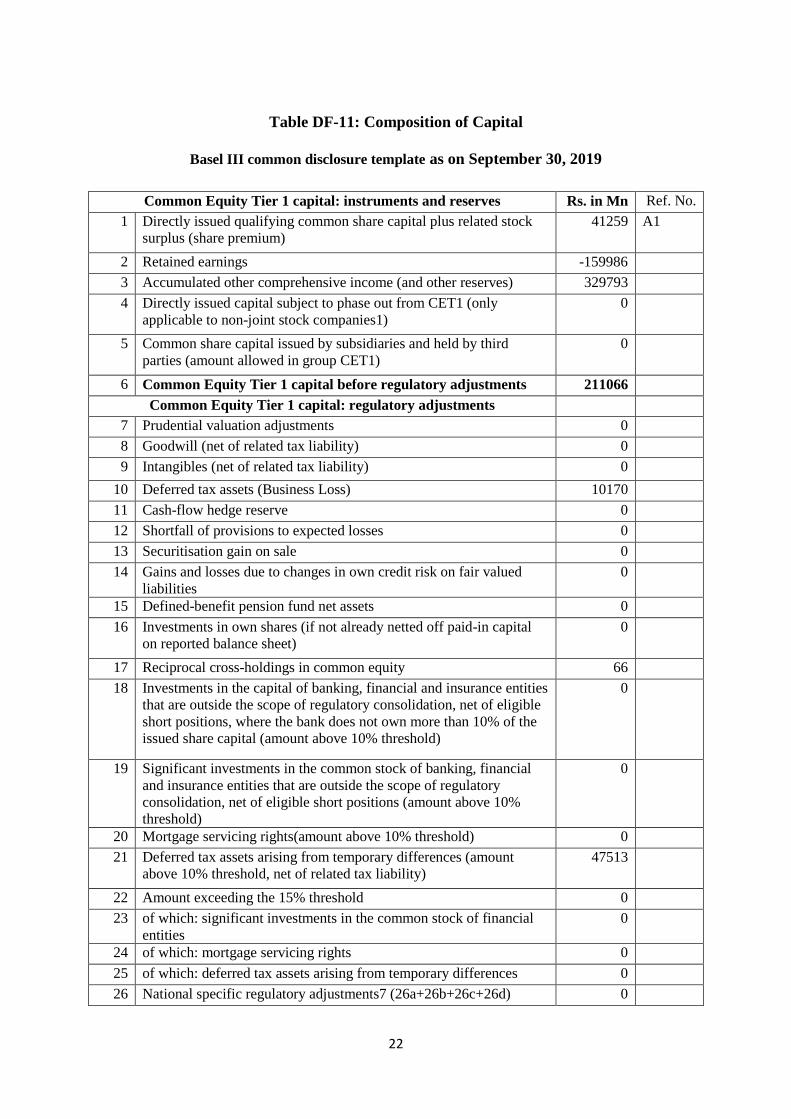
Table DF-11: Composition of Capital
Basel III common disclosure template as on September 30, 2019
Common Equity Tier 1 capital: instruments and reserves Rs. in Mn Ref. No.
1 Directly issued qualifying common share capital plus related stock
surplus (share premium)
41259 A1
2 Retained earnings -159986
3 Accumulated other comprehensive income (and other reserves) 329793
4 Directly issued capital subject to phase out from CET1 (only
applicable to non-joint stock companies1)
0
5 Common share capital issued by subsidiaries and held by third
parties (amount allowed in group CET1)
0
6 Common Equity Tier 1 capital before regulatory adjustments 211066
Common Equity Tier 1 capital: regulatory adjustments
7 Prudential valuation adjustments 0
8 Goodwill (net of related tax liability) 0
9 Intangibles (net of related tax liability) 0
10 Deferred tax assets (Business Loss) 10170
11 Cash-flow hedge reserve 0
12 Shortfall of provisions to expected losses 0
13 Securitisation gain on sale 0
14 Gains and losses due to changes in own credit risk on fair valued
liabilities
0
15 Defined-benefit pension fund net assets 0
16 Investments in own shares (if not already netted off paid-in capital
on reported balance sheet)
0
17 Reciprocal cross-holdings in common equity 66
18 Investments in the capital of banking, financial and insurance entities
that are outside the scope of regulatory consolidation, net of eligible
short positions, where the bank does not own more than 10% of the
issued share capital (amount above 10% threshold)
0
19 Significant investments in the common stock of banking, financial
and insurance entities that are outside the scope of regulatory
consolidation, net of eligible short positions (amount above 10%
threshold)
0
20 Mortgage servicing rights(amount above 10% threshold) 0
21 Deferred tax assets arising from temporary differences (amount
above 10% threshold, net of related tax liability)
47513
22 Amount exceeding the 15% threshold 0
23 of which: significant investments in the common stock of financial
entities
0
24 of which: mortgage servicing rights 0
25 of which: deferred tax assets arising from temporary differences 0
26 National specific regulatory adjustments7 (26a+26b+26c+26d) 0
23
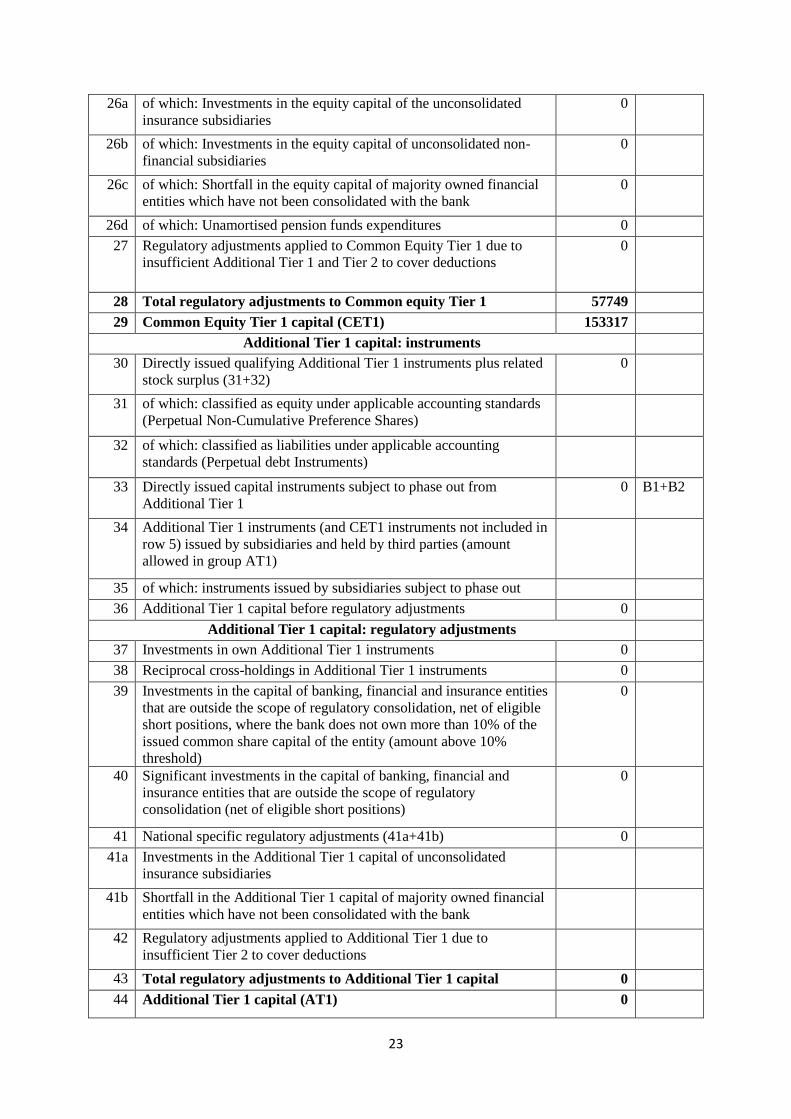
26a of which: Investments in the equity capital of the unconsolidated
insurance subsidiaries
0
26b of which: Investments in the equity capital of unconsolidated non-
financial subsidiaries
0
26c of which: Shortfall in the equity capital of majority owned financial
entities which have not been consolidated with the bank
0
26d of which: Unamortised pension funds expenditures 0
27 Regulatory adjustments applied to Common Equity Tier 1 due to
insufficient Additional Tier 1 and Tier 2 to cover deductions
0
28 Total regulatory adjustments to Common equity Tier 1 57749
29 Common Equity Tier 1 capital (CET1) 153317
Additional Tier 1 capital: instruments
30 Directly issued qualifying Additional Tier 1 instruments plus related
stock surplus (31+32)
0
31 of which: classified as equity under applicable accounting standards
(Perpetual Non-Cumulative Preference Shares)
32 of which: classified as liabilities under applicable accounting
standards (Perpetual debt Instruments)
33 Directly issued capital instruments subject to phase out from
Additional Tier 1
0 B1+B2
34 Additional Tier 1 instruments (and CET1 instruments not included in
row 5) issued by subsidiaries and held by third parties (amount
allowed in group AT1)
35 of which: instruments issued by subsidiaries subject to phase out
36 Additional Tier 1 capital before regulatory adjustments 0
Additional Tier 1 capital: regulatory adjustments
37 Investments in own Additional Tier 1 instruments 0
38 Reciprocal cross-holdings in Additional Tier 1 instruments 0
39 Investments in the capital of banking, financial and insurance entities
that are outside the scope of regulatory consolidation, net of eligible
short positions, where the bank does not own more than 10% of the
issued common share capital of the entity (amount above 10%
threshold)
0
40 Significant investments in the capital of banking, financial and
insurance entities that are outside the scope of regulatory
consolidation (net of eligible short positions)
0
41 National specific regulatory adjustments (41a+41b) 0
41a Investments in the Additional Tier 1 capital of unconsolidated
insurance subsidiaries
41b Shortfall in the Additional Tier 1 capital of majority owned financial
entities which have not been consolidated with the bank
42 Regulatory adjustments applied to Additional Tier 1 due to
insufficient Tier 2 to cover deductions
43 Total regulatory adjustments to Additional Tier 1 capital 0
44 Additional Tier 1 capital (AT1) 0
24
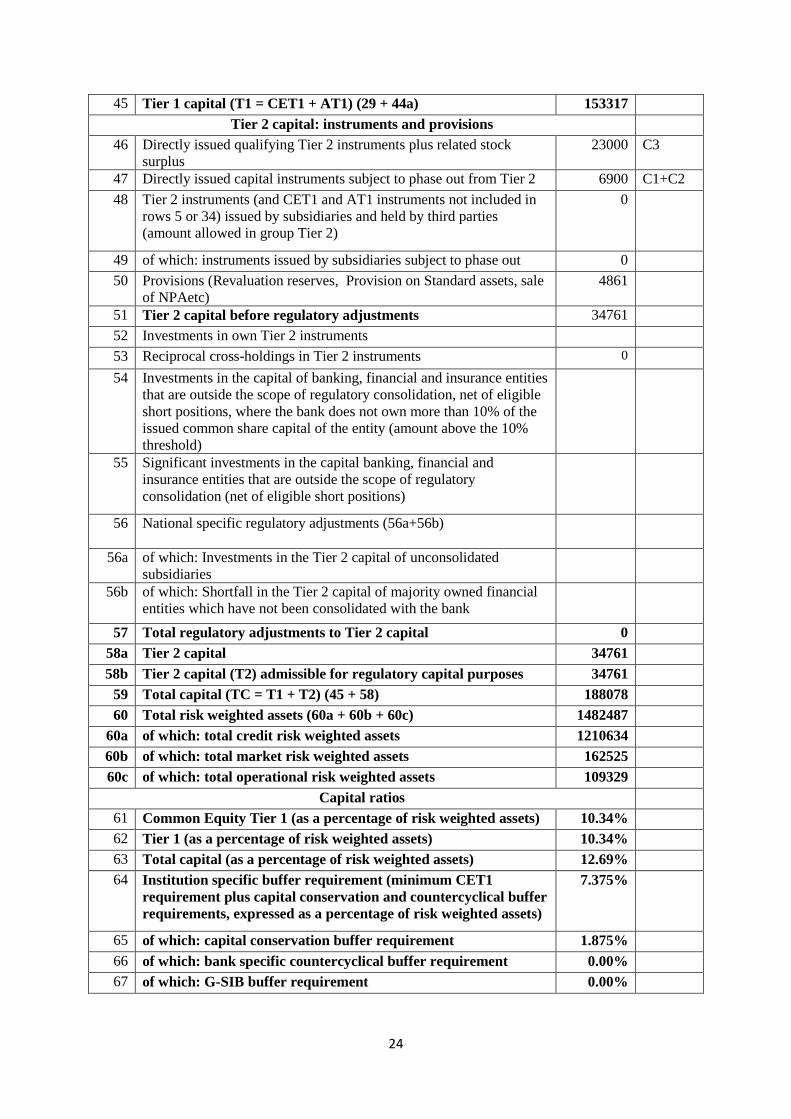
45 Tier 1 capital (T1 = CET1 + AT1) (29 + 44a) 153317
Tier 2 capital: instruments and provisions
46 Directly issued qualifying Tier 2 instruments plus related stock
surplus
23000 C3
47 Directly issued capital instruments subject to phase out from Tier 2 6900 C1+C2
48 Tier 2 instruments (and CET1 and AT1 instruments not included in
rows 5 or 34) issued by subsidiaries and held by third parties
(amount allowed in group Tier 2)
0
49 of which: instruments issued by subsidiaries subject to phase out 0
50 Provisions (Revaluation reserves, Provision on Standard assets, sale
of NPAetc)
4861
51 Tier 2 capital before regulatory adjustments 34761
52 Investments in own Tier 2 instruments
53 Reciprocal cross-holdings in Tier 2 instruments 0
54 Investments in the capital of banking, financial and insurance entities
that are outside the scope of regulatory consolidation, net of eligible
short positions, where the bank does not own more than 10% of the
issued common share capital of the entity (amount above the 10%
threshold)
55 Significant investments in the capital banking, financial and
insurance entities that are outside the scope of regulatory
consolidation (net of eligible short positions)
56 National specific regulatory adjustments (56a+56b)
56a of which: Investments in the Tier 2 capital of unconsolidated
subsidiaries
56b of which: Shortfall in the Tier 2 capital of majority owned financial
entities which have not been consolidated with the bank
57 Total regulatory adjustments to Tier 2 capital 0
58a Tier 2 capital 34761
58b Tier 2 capital (T2) admissible for regulatory capital purposes 34761
59 Total capital (TC = T1 + T2) (45 + 58) 188078
60 Total risk weighted assets (60a + 60b + 60c) 1482487
60a of which: total credit risk weighted assets 1210634
60b of which: total market risk weighted assets 162525
60c of which: total operational risk weighted assets 109329
Capital ratios
61 Common Equity Tier 1 (as a percentage of risk weighted assets) 10.34%
62 Tier 1 (as a percentage of risk weighted assets) 10.34%
63 Total capital (as a percentage of risk weighted assets) 12.69%
64 Institution specific buffer requirement (minimum CET1
requirement plus capital conservation and countercyclical buffer
requirements, expressed as a percentage of risk weighted assets)
7.375%
65 of which: capital conservation buffer requirement 1.875%
66 of which: bank specific countercyclical buffer requirement 0.00%
67 of which: G-SIB buffer requirement 0.00%
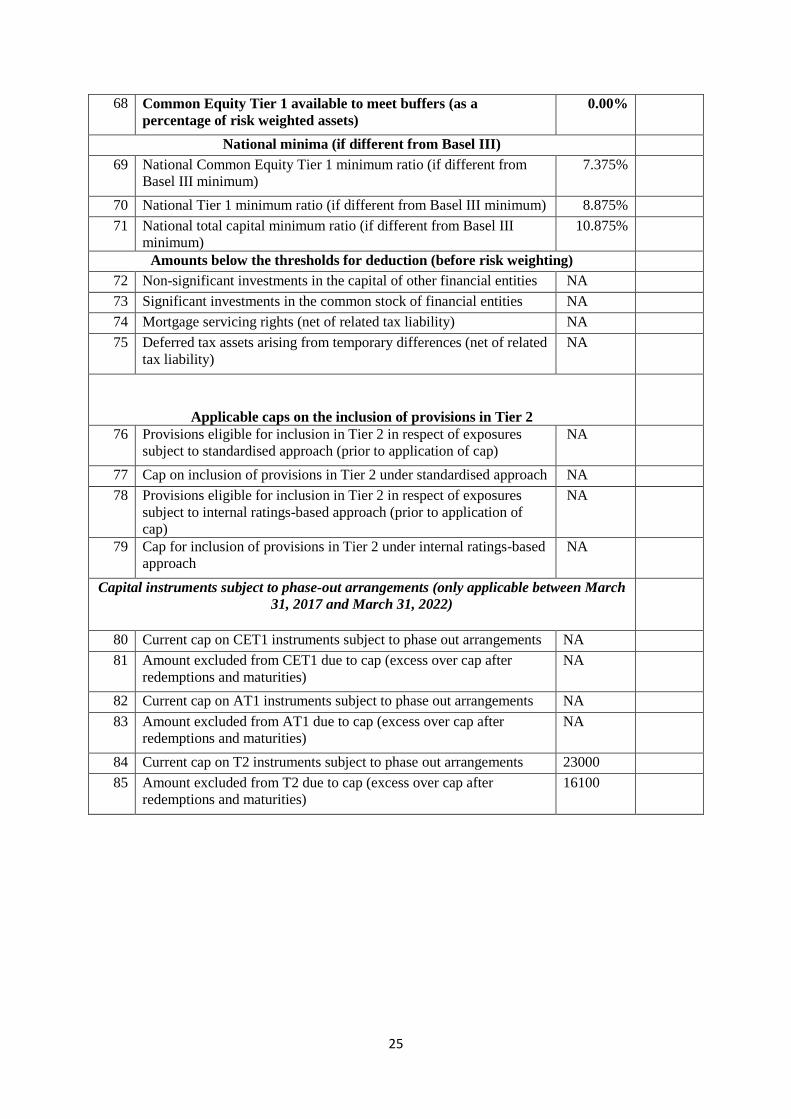
25
68 Common Equity Tier 1 available to meet buffers (as a
percentage of risk weighted assets)
0.00%
National minima (if different from Basel III)
69 National Common Equity Tier 1 minimum ratio (if different from
Basel III minimum)
7.375%
70 National Tier 1 minimum ratio (if different from Basel III minimum) 8.875%
71 National total capital minimum ratio (if different from Basel III
minimum)
10.875%
Amounts below the thresholds for deduction (before risk weighting)
72 Non-significant investments in the capital of other financial entities NA
73 Significant investments in the common stock of financial entities NA
74 Mortgage servicing rights (net of related tax liability) NA
75 Deferred tax assets arising from temporary differences (net of related
tax liability)
NA
Applicable caps on the inclusion of provisions in Tier 2
76 Provisions eligible for inclusion in Tier 2 in respect of exposures
subject to standardised approach (prior to application of cap)
NA
77 Cap on inclusion of provisions in Tier 2 under standardised approach NA
78 Provisions eligible for inclusion in Tier 2 in respect of exposures
subject to internal ratings-based approach (prior to application of
cap)
NA
79 Cap for inclusion of provisions in Tier 2 under internal ratings-based
approach
NA
Capital instruments subject to phase-out arrangements (only applicable between March
31, 2017 and March 31, 2022)
80 Current cap on CET1 instruments subject to phase out arrangements NA
81 Amount excluded from CET1 due to cap (excess over cap after
redemptions and maturities)
NA
82 Current cap on AT1 instruments subject to phase out arrangements NA
83 Amount excluded from AT1 due to cap (excess over cap after
redemptions and maturities)
NA
84 Current cap on T2 instruments subject to phase out arrangements 23000
85 Amount excluded from T2 due to cap (excess over cap after
redemptions and maturities)
16100
26
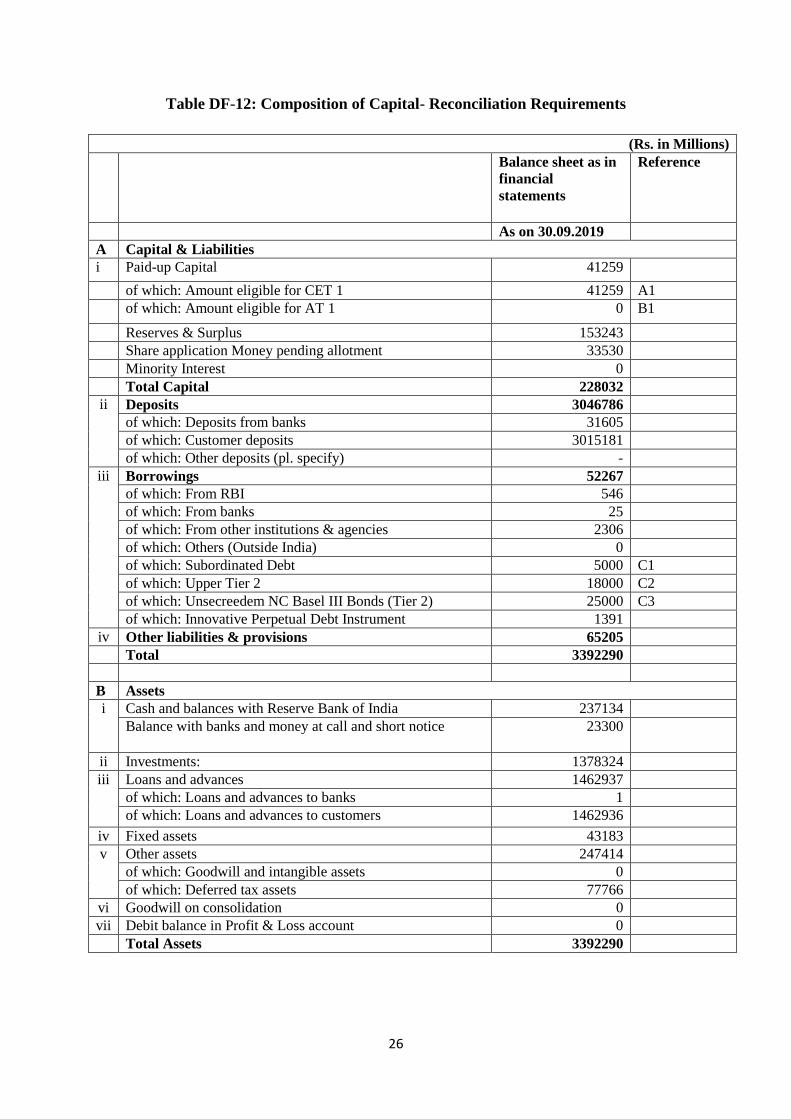
Table DF-12: Composition of Capital- Reconciliation Requirements
(Rs. in Millions)
Balance sheet as in
financial
statements
Reference
As on 30.09.2019
A Capital & Liabilities
i Paid-up Capital 41259
of which: Amount eligible for CET 1 41259 A1
of which: Amount eligible for AT 1 0 B1
Reserves & Surplus 153243
Share application Money pending allotment 33530
Minority Interest 0
Total Capital 228032
ii Deposits 3046786
of which: Deposits from banks 31605
of which: Customer deposits 3015181
of which: Other deposits (pl. specify) -
iii Borrowings 52267
of which: From RBI 546
of which: From banks 25
of which: From other institutions & agencies 2306
of which: Others (Outside India) 0
of which: Subordinated Debt 5000 C1
of which: Upper Tier 2 18000 C2
of which: Unsecreedem NC Basel III Bonds (Tier 2) 25000 C3
of which: Innovative Perpetual Debt Instrument 1391
iv Other liabilities & provisions 65205
Total 3392290
B Assets
i Cash and balances with Reserve Bank of India 237134
Balance with banks and money at call and short notice 23300
ii Investments: 1378324
iii Loans and advances 1462937
of which: Loans and advances to banks 1
of which: Loans and advances to customers 1462936
iv Fixed assets 43183
v Other assets 247414
of which: Goodwill and intangible assets 0
of which: Deferred tax assets 77766
vi Goodwill on consolidation 0
vii Debit balance in Profit & Loss account 0
Total Assets 3392290
27
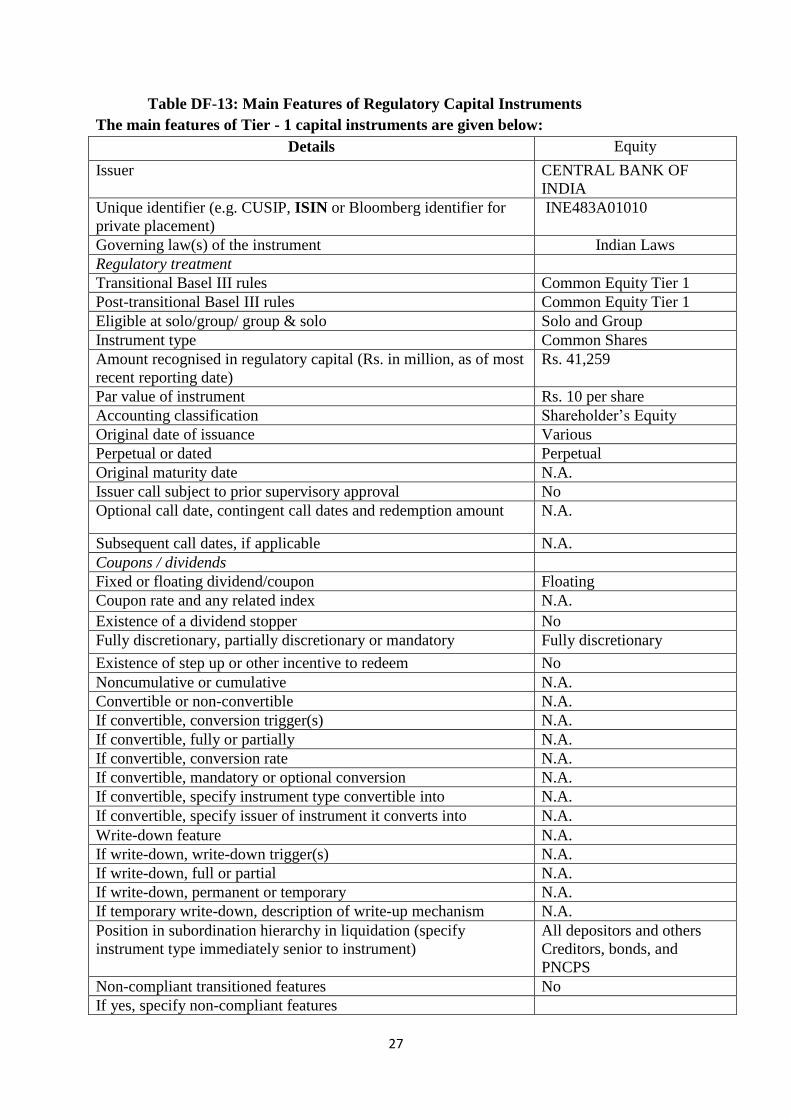
Table DF-13: Main Features of Regulatory Capital Instruments
The main features of Tier - 1 capital instruments are given below:
Details Equity
Issuer CENTRAL BANK OF
INDIA
Unique identifier (e.g. CUSIP, ISIN or Bloomberg identifier for
private placement)
INE483A01010
Governing law(s) of the instrument Indian Laws
Regulatory treatment
Transitional Basel III rules Common Equity Tier 1
Post-transitional Basel III rules Common Equity Tier 1
Eligible at solo/group/ group & solo Solo and Group
Instrument type Common Shares
Amount recognised in regulatory capital (Rs. in million, as of most
recent reporting date)
Rs. 41,259
Par value of instrument Rs. 10 per share
Accounting classification Shareholder‟s Equity
Original date of issuance Various
Perpetual or dated Perpetual
Original maturity date N.A.
Issuer call subject to prior supervisory approval No
Optional call date, contingent call dates and redemption amount N.A.
Subsequent call dates, if applicable N.A.
Coupons / dividends
Fixed or floating dividend/coupon Floating
Coupon rate and any related index N.A.
Existence of a dividend stopper No
Fully discretionary, partially discretionary or mandatory Fully discretionary
Existence of step up or other incentive to redeem No
Noncumulative or cumulative N.A.
Convertible or non-convertible N.A.
If convertible, conversion trigger(s) N.A.
If convertible, fully or partially N.A.
If convertible, conversion rate N.A.
If convertible, mandatory or optional conversion N.A.
If convertible, specify instrument type convertible into N.A.
If convertible, specify issuer of instrument it converts into N.A.
Write-down feature N.A.
If write-down, write-down trigger(s) N.A.
If write-down, full or partial N.A.
If write-down, permanent or temporary N.A.
If temporary write-down, description of write-up mechanism N.A.
Position in subordination hierarchy in liquidation (specify
instrument type immediately senior to instrument)
All depositors and others
Creditors, bonds, and
PNCPS
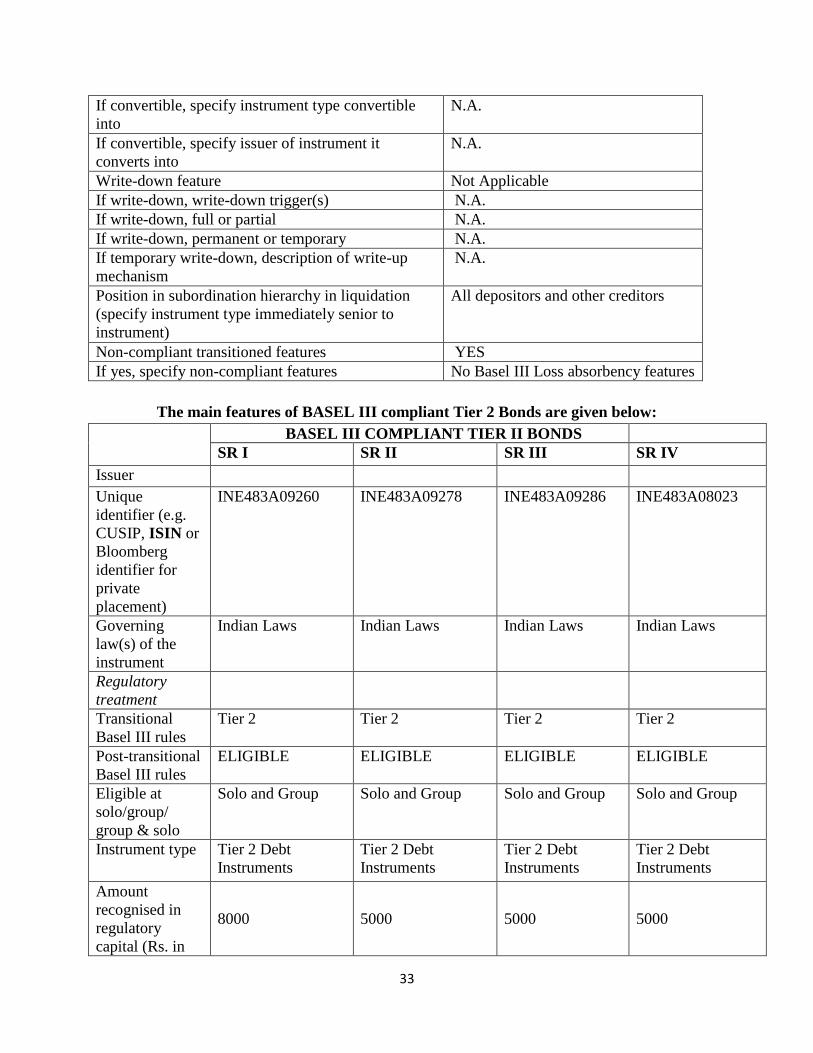
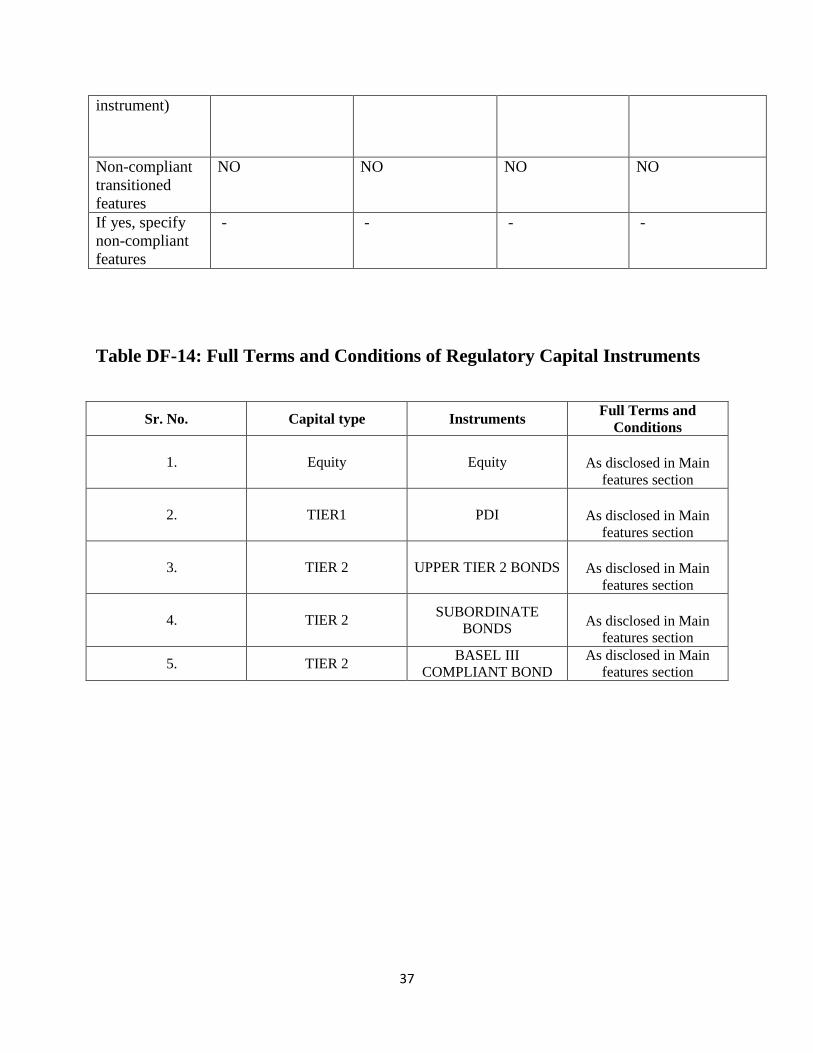
Non-compliant transitioned features No
If yes, specify non-compliant features
28
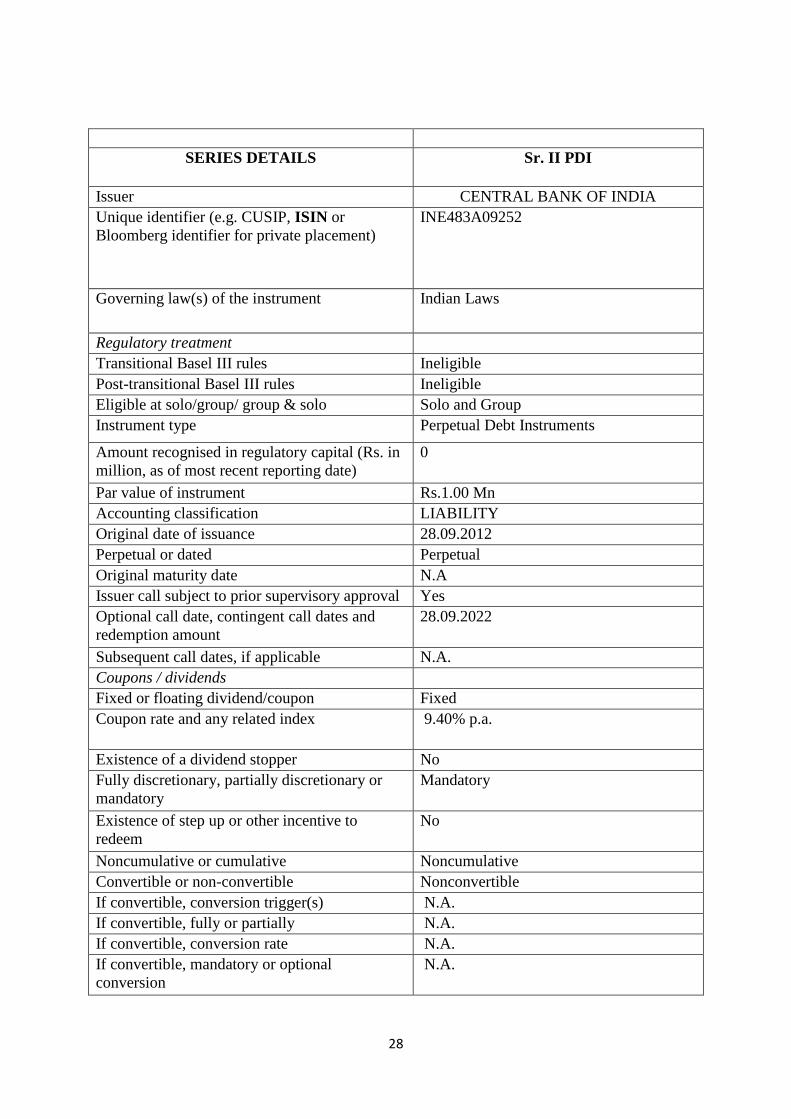
SERIES DETAILS Sr. II PDI
Issuer CENTRAL BANK OF INDIA
Unique identifier (e.g. CUSIP, ISIN or
Bloomberg identifier for private placement)
INE483A09252
Governing law(s) of the instrument Indian Laws
Regulatory treatment
Transitional Basel III rules Ineligible
Post-transitional Basel III rules Ineligible
Eligible at solo/group/ group & solo Solo and Group
Instrument type Perpetual Debt Instruments
Amount recognised in regulatory capital (Rs. in
million, as of most recent reporting date)
0
Par value of instrument Rs.1.00 Mn
Accounting classification LIABILITY
Original date of issuance 28.09.2012
Perpetual or dated Perpetual
Original maturity date N.A
Issuer call subject to prior supervisory approval Yes
Optional call date, contingent call dates and
redemption amount
28.09.2022
Subsequent call dates, if applicable N.A.
Coupons / dividends
Fixed or floating dividend/coupon Fixed
Coupon rate and any related index 9.40% p.a.
Existence of a dividend stopper No
Fully discretionary, partially discretionary or
mandatory
Mandatory
Existence of step up or other incentive to
redeem
No
Noncumulative or cumulative Noncumulative
Convertible or non-convertible Nonconvertible
If convertible, conversion trigger(s) N.A.
If convertible, fully or partially N.A.
If convertible, conversion rate N.A.
If convertible, mandatory or optional
conversion
N.A.
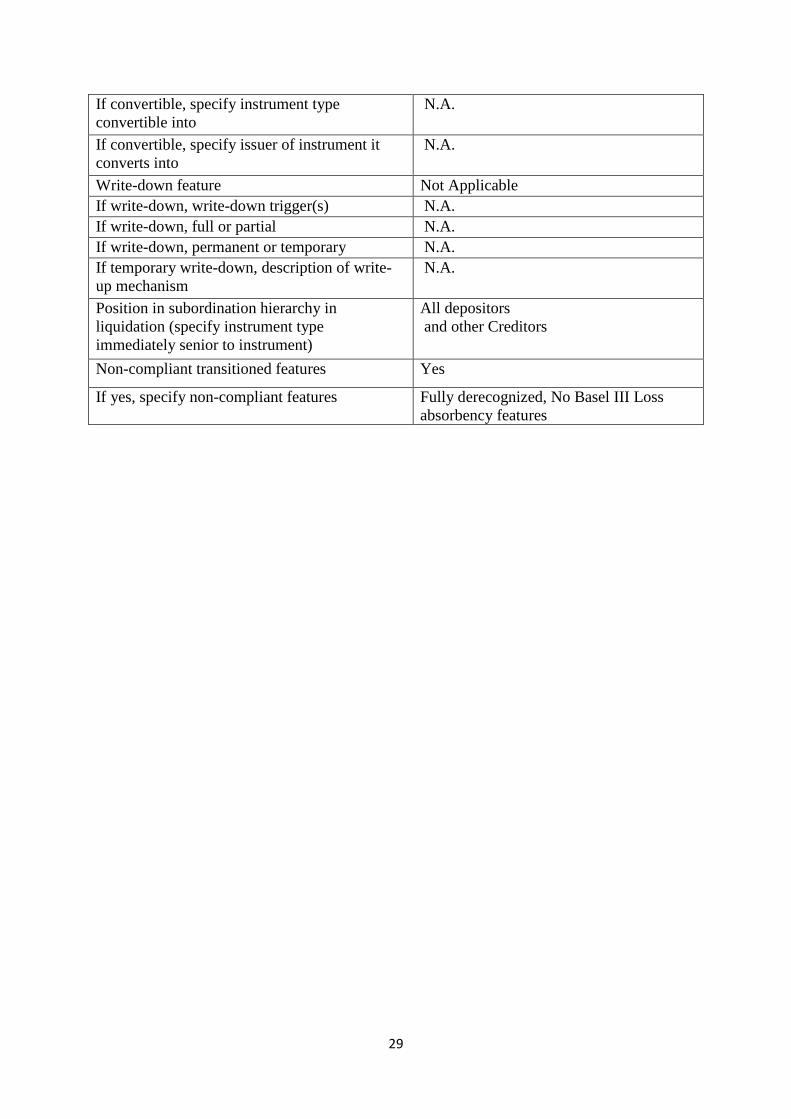
29
If convertible, specify instrument type
convertible into
N.A.
If convertible, specify issuer of instrument it
converts into
N.A.
Write-down feature Not Applicable
If write-down, write-down trigger(s) N.A.
If write-down, full or partial N.A.
If write-down, permanent or temporary N.A.
If temporary write-down, description of write-
up mechanism
N.A.
Position in subordination hierarchy in
liquidation (specify instrument type
immediately senior to instrument)
All depositors
and other Creditors
Non-compliant transitioned features Yes
If yes, specify non-compliant features Fully derecognized, No Basel III Loss
absorbency features
30
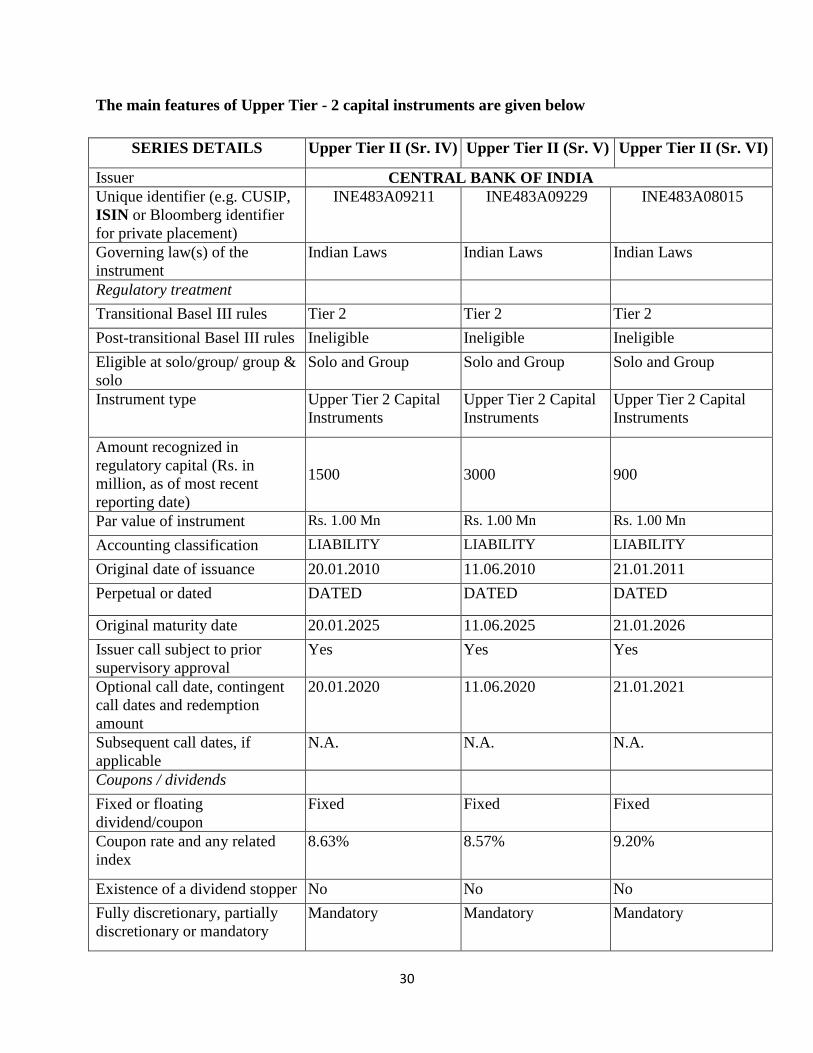
The main features of Upper Tier - 2 capital instruments are given below
SERIES DETAILS Upper Tier II (Sr. IV) Upper Tier II (Sr. V) Upper Tier II (Sr. VI)
Issuer CENTRAL BANK OF INDIA
Unique identifier (e.g. CUSIP,
ISIN or Bloomberg identifier
for private placement)
INE483A09211 INE483A09229 INE483A08015
Governing law(s) of the
instrument
Indian Laws Indian Laws Indian Laws
Regulatory treatment
Transitional Basel III rules Tier 2 Tier 2 Tier 2
Post-transitional Basel III rules Ineligible Ineligible Ineligible
Eligible at solo/group/ group &
solo
Solo and Group Solo and Group Solo and Group
Instrument type Upper Tier 2 Capital
Instruments
Upper Tier 2 Capital
Instruments
Upper Tier 2 Capital
Instruments
Amount recognized in
regulatory capital (Rs. in
million, as of most recent
reporting date)
1500 3000 900
Par value of instrument Rs. 1.00 Mn Rs. 1.00 Mn Rs. 1.00 Mn
Accounting classification LIABILITY LIABILITY LIABILITY
Original date of issuance 20.01.2010 11.06.2010 21.01.2011
Perpetual or dated DATED DATED DATED
Original maturity date 20.01.2025 11.06.2025 21.01.2026
Issuer call subject to prior
supervisory approval
Yes Yes Yes
Optional call date, contingent
call dates and redemption
amount
20.01.2020 11.06.2020 21.01.2021
Subsequent call dates, if
applicable
N.A. N.A. N.A.
Coupons / dividends
Fixed or floating
dividend/coupon
Fixed Fixed Fixed
Coupon rate and any related
index
8.63% 8.57% 9.20%
Existence of a dividend stopper No No No
Fully discretionary, partially
discretionary or mandatory
Mandatory Mandatory Mandatory
31
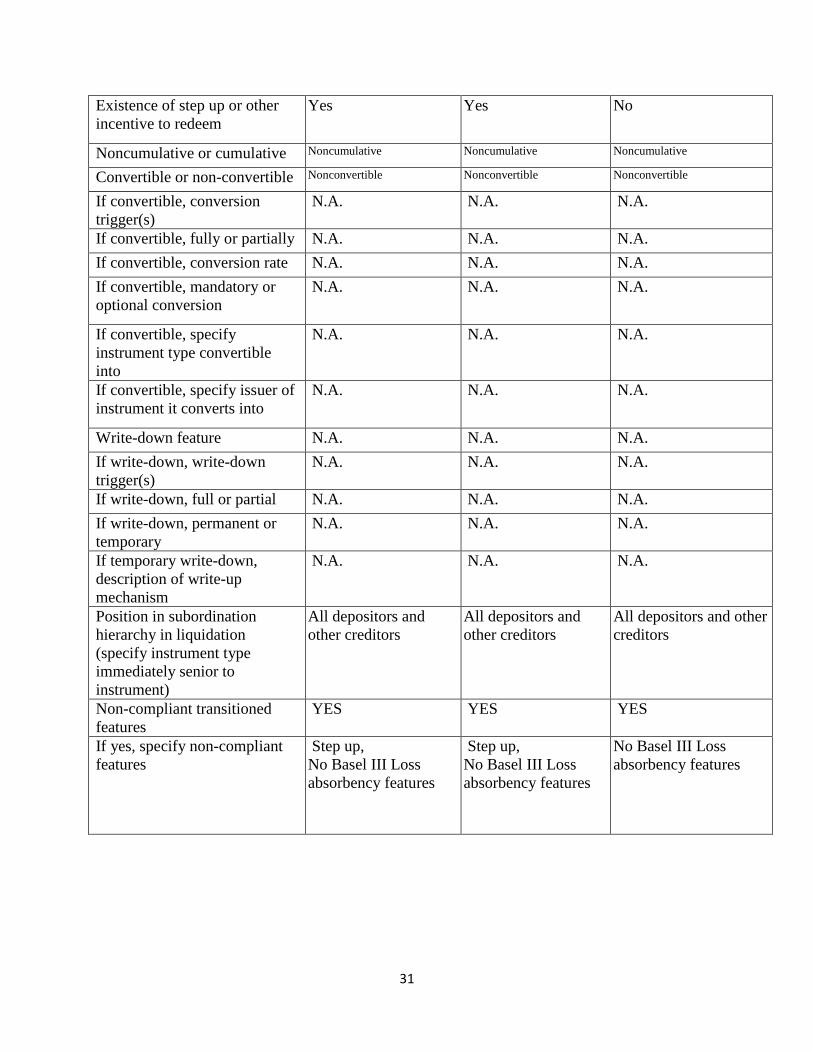
Existence of step up or other
incentive to redeem
Yes Yes No
Noncumulative or cumulative Noncumulative Noncumulative Noncumulative
Convertible or non-convertible Nonconvertible Nonconvertible Nonconvertible
If convertible, conversion
trigger(s)
N.A. N.A. N.A.
If convertible, fully or partially N.A. N.A. N.A.
If convertible, conversion rate N.A. N.A. N.A.
If convertible, mandatory or
optional conversion
N.A. N.A. N.A.
If convertible, specify
instrument type convertible
into
N.A. N.A. N.A.
If convertible, specify issuer of
instrument it converts into
N.A. N.A. N.A.
Write-down feature N.A. N.A. N.A.
If write-down, write-down
trigger(s)
N.A. N.A. N.A.
If write-down, full or partial N.A. N.A. N.A.
If write-down, permanent or
temporary
N.A. N.A. N.A.
If temporary write-down,
description of write-up
mechanism
N.A. N.A. N.A.
Position in subordination
hierarchy in liquidation
(specify instrument type
immediately senior to
instrument)
All depositors and
other creditors
All depositors and
other creditors
All depositors and other
creditors
Non-compliant transitioned
features
YES YES YES
If yes, specify non-compliant
features
Step up,
No Basel III Loss
absorbency features
Step up,
No Basel III Loss
absorbency features
No Basel III Loss
absorbency features
32
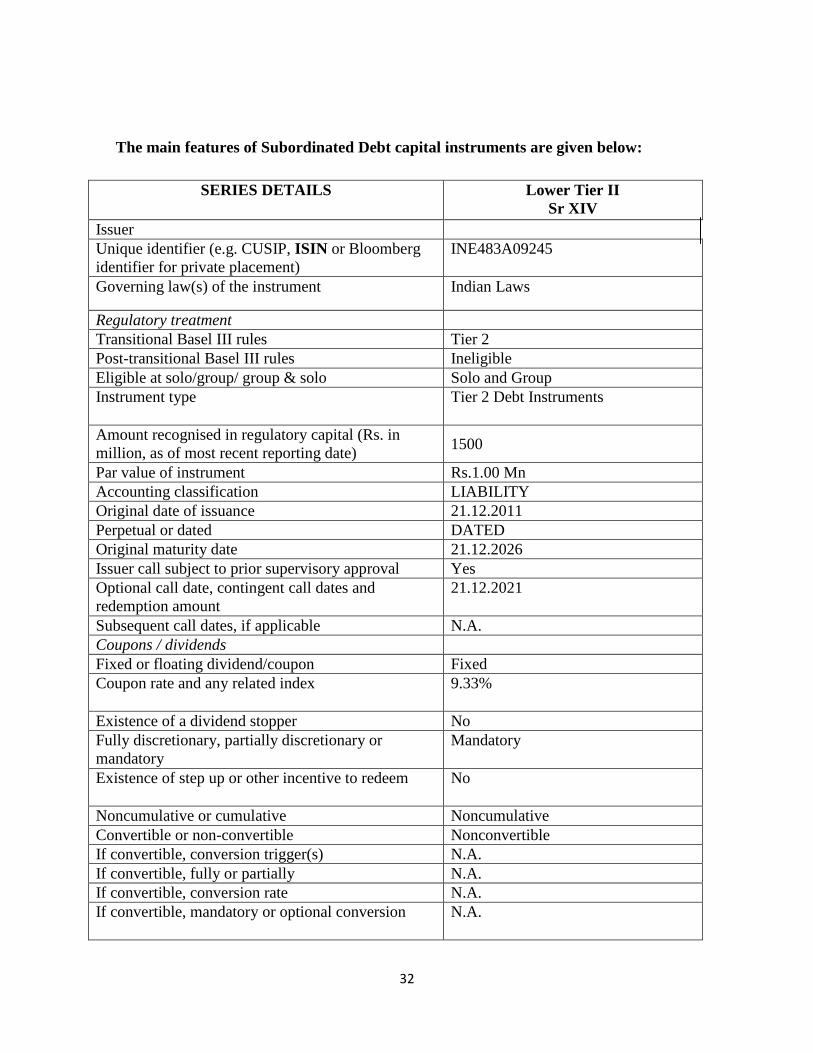
The main features of Subordinated Debt capital instruments are given below:
SERIES DETAILS Lower Tier II
Sr XIV
Issuer
Unique identifier (e.g. CUSIP, ISIN or Bloomberg
identifier for private placement)
INE483A09245
Governing law(s) of the instrument Indian Laws
Regulatory treatment
Transitional Basel III rules Tier 2
Post-transitional Basel III rules Ineligible
Eligible at solo/group/ group & solo Solo and Group
Instrument type Tier 2 Debt Instruments
Amount recognised in regulatory capital (Rs. in
million, as of most recent reporting date) 1500
Par value of instrument Rs.1.00 Mn
Accounting classification LIABILITY
Original date of issuance 21.12.2011
Perpetual or dated DATED
Original maturity date 21.12.2026
Issuer call subject to prior supervisory approval Yes
Optional call date, contingent call dates and
redemption amount
21.12.2021
Subsequent call dates, if applicable N.A.
Coupons / dividends
Fixed or floating dividend/coupon Fixed
Coupon rate and any related index 9.33%
Existence of a dividend stopper No
Fully discretionary, partially discretionary or
mandatory
Mandatory
Existence of step up or other incentive to redeem No
Noncumulative or cumulative Noncumulative
Convertible or non-convertible Nonconvertible
If convertible, conversion trigger(s) N.A.
If convertible, fully or partially N.A.
If convertible, conversion rate N.A.
If convertible, mandatory or optional conversion N.A.
33
If convertible, specify instrument type convertible
into
N.A.
If convertible, specify issuer of instrument it
converts into
N.A.
Write-down feature Not Applicable
If write-down, write-down trigger(s) N.A.
If write-down, full or partial N.A.
If write-down, permanent or temporary N.A.
If temporary write-down, description of write-up
mechanism
N.A.
Position in subordination hierarchy in liquidation
(specify instrument type immediately senior to
instrument)
All depositors and other creditors
Non-compliant transitioned features YES
If yes, specify non-compliant features No Basel III Loss absorbency features
The main features of BASEL III compliant Tier 2 Bonds are given below:
BASEL III COMPLIANT TIER II BONDS
SR I SR II SR III SR IV
Issuer
Unique
identifier (e.g.
CUSIP, ISIN or
Bloomberg
identifier for
private
placement)
INE483A09260 INE483A09278 INE483A09286 INE483A08023
Governing
law(s) of the
instrument
Indian Laws Indian Laws Indian Laws Indian Laws
Regulatory
treatment
Transitional
Basel III rules
Tier 2 Tier 2 Tier 2 Tier 2
Post-transitional
Basel III rules
ELIGIBLE ELIGIBLE ELIGIBLE ELIGIBLE
Eligible at
solo/group/
group & solo
Solo and Group Solo and Group Solo and Group Solo and Group
Instrument type Tier 2 Debt
Instruments
Tier 2 Debt
Instruments
Tier 2 Debt
Instruments
Tier 2 Debt
Instruments
Amount
recognised in
regulatory
capital (Rs. in
8000 5000 5000 5000
34
million, as of
most recent
reporting date)
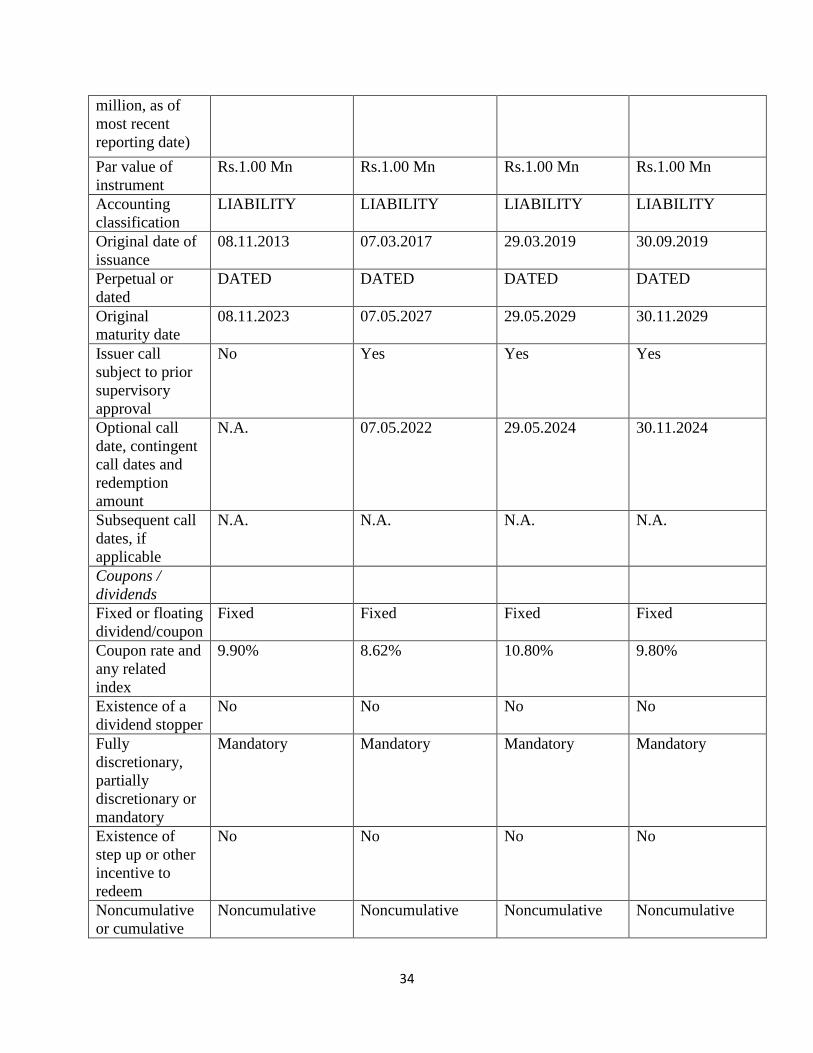
Par value of
instrument
Rs.1.00 Mn Rs.1.00 Mn Rs.1.00 Mn Rs.1.00 Mn
Accounting
classification
LIABILITY LIABILITY LIABILITY LIABILITY
Original date of
issuance
08.11.2013 07.03.2017 29.03.2019 30.09.2019
Perpetual or
dated
DATED DATED DATED DATED
Original
maturity date
08.11.2023 07.05.2027 29.05.2029 30.11.2029
Issuer call
subject to prior
supervisory
approval
No Yes
Yes
Yes
Optional call
date, contingent
call dates and
redemption
amount
N.A. 07.05.2022 29.05.2024 30.11.2024
Subsequent call
dates, if
applicable
N.A. N.A. N.A. N.A.
Coupons /
dividends
Fixed or floating
dividend/coupon
Fixed Fixed Fixed Fixed
Coupon rate and
any related
index
9.90% 8.62% 10.80% 9.80%
Existence of a
dividend stopper
No No No No
Fully
discretionary,
partially
discretionary or
mandatory
Mandatory Mandatory Mandatory Mandatory
Existence of
step up or other
incentive to
redeem
No No No No
Noncumulative
or cumulative
Noncumulative Noncumulative Noncumulative Noncumulative
35
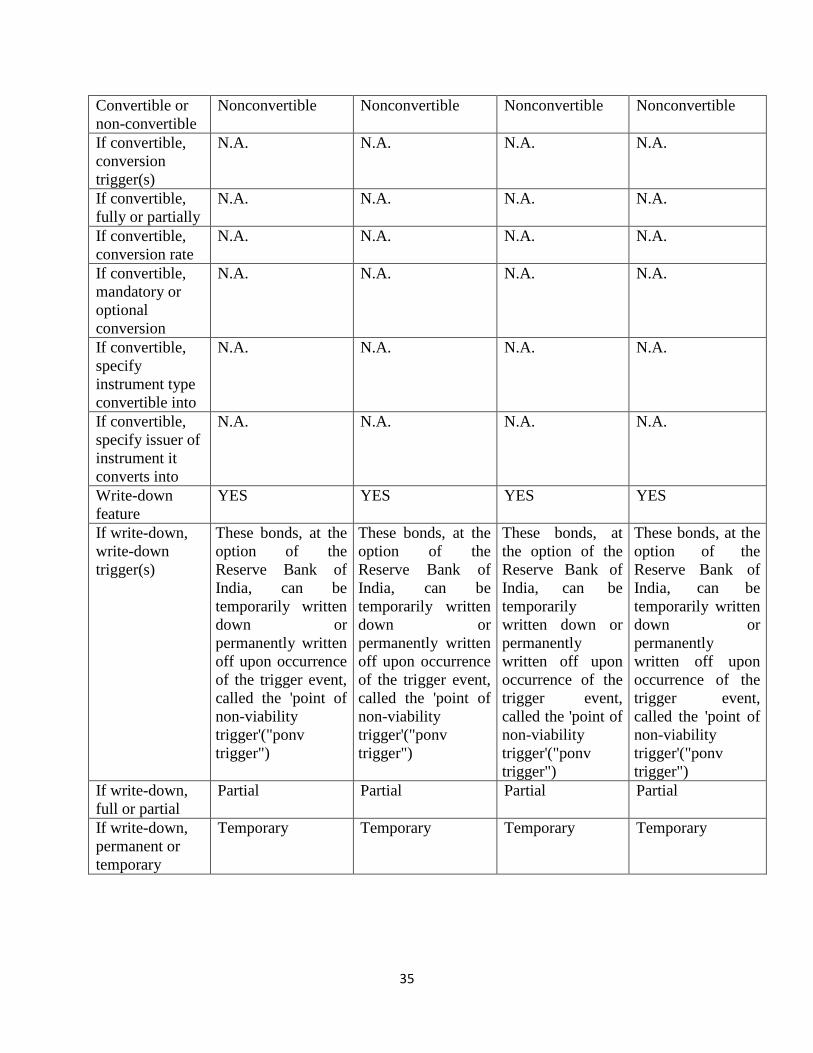
Convertible or
non-convertible
Nonconvertible Nonconvertible Nonconvertible Nonconvertible
If convertible,
conversion
trigger(s)
N.A. N.A. N.A. N.A.
If convertible,
fully or partially
N.A. N.A. N.A. N.A.
If convertible,
conversion rate
N.A. N.A. N.A. N.A.
If convertible,
mandatory or
optional
conversion
N.A. N.A. N.A. N.A.
If convertible,
specify
instrument type
convertible into
N.A. N.A. N.A. N.A.
If convertible,
specify issuer of
instrument it
converts into
N.A. N.A. N.A. N.A.
Write-down
feature
YES YES YES YES
If write-down,
write-down
trigger(s)
These bonds, at the
option of the
Reserve Bank of
India, can be
temporarily written
down or
permanently written
off upon occurrence
of the trigger event,
called the 'point of
non-viability
trigger'("ponv
trigger")
These bonds, at the
option of the
Reserve Bank of
India, can be
temporarily written
down or
permanently written
off upon occurrence
of the trigger event,
called the 'point of
non-viability
trigger'("ponv
trigger")
These bonds, at
the option of the
Reserve Bank of
India, can be
temporarily
written down or
permanently
written off upon
occurrence of the
trigger event,
called the 'point of
non-viability
trigger'("ponv
trigger")
These bonds, at the
option of the
Reserve Bank of
India, can be
temporarily written
down or
permanently
written off upon
occurrence of the
trigger event,
called the 'point of
non-viability
trigger'("ponv
trigger")
If write-down,
full or partial
Partial Partial Partial Partial
If write-down,
permanent or
temporary
Temporary Temporary Temporary Temporary
36
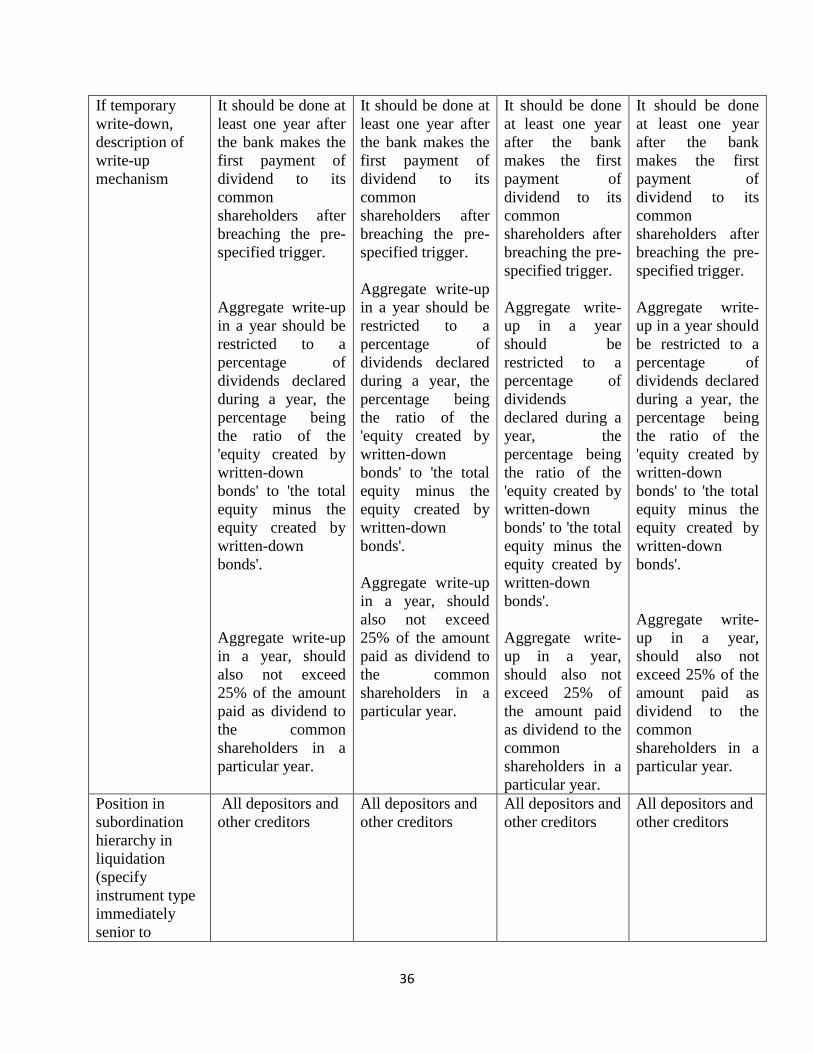
If temporary
write-down,
description of
write-up
mechanism
It should be done at
least one year after
the bank makes the
first payment of
dividend to its
common
shareholders after
breaching the pre-
specified trigger.
Aggregate write-up
in a year should be
restricted to a
percentage of
dividends declared
during a year, the
percentage being
the ratio of the
'equity created by
written-down
bonds' to 'the total
equity minus the
equity created by
written-down
bonds'.
Aggregate write-up
in a year, should
also not exceed
25% of the amount
paid as dividend to
the common
shareholders in a
particular year.
It should be done
at least one year
after the bank
makes the first
payment of
dividend to its
common
shareholders after
breaching the pre-
specified trigger.
Aggregate write-
up in a year
should be
restricted to a
percentage of
dividends
declared during a
year, the
percentage being
the ratio of the
'equity created by
written-down
bonds' to 'the total
equity minus the
equity created by
written-down
bonds'.
Aggregate write-
up in a year,
should also not
exceed 25% of
the amount paid
as dividend to the
common
shareholders in a
particular year.
It should be done
at least one year
after the bank
makes the first
payment of
dividend to its
common
shareholders after
breaching the pre-
specified trigger.
Aggregate write-
up in a year should
be restricted to a
percentage of
dividends declared
during a year, the
percentage being
the ratio of the
'equity created by
written-down
bonds' to 'the total
equity minus the
equity created by
written-down
bonds'.
Aggregate write-
up in a year,
should also not
exceed 25% of the
amount paid as
dividend to the
common
shareholders in a
particular year.
Position in
subordination
hierarchy in
liquidation
(specify
instrument type
immediately
senior to
All depositors and
other creditors
All depositors and
other creditors
All depositors and
other creditors
All depositors and
other creditors
37
instrument)
Non-compliant
transitioned
features
NO NO NO NO
If yes, specify
non-compliant
features
- - - -
Table DF-14: Full Terms and Conditions of Regulatory Capital Instruments
Sr. No. Capital type Instruments Full Terms and
Conditions
1. Equity Equity
As disclosed in Main
features section
2. TIER1 PDI
As disclosed in Main
features section
3. TIER 2 UPPER TIER 2 BONDS
As disclosed in Main
features section
4. TIER 2 SUBORDINATE
BONDS
As disclosed in Main
features section
5. TIER 2 BASEL III
COMPLIANT BOND
As disclosed in Main
features section
38
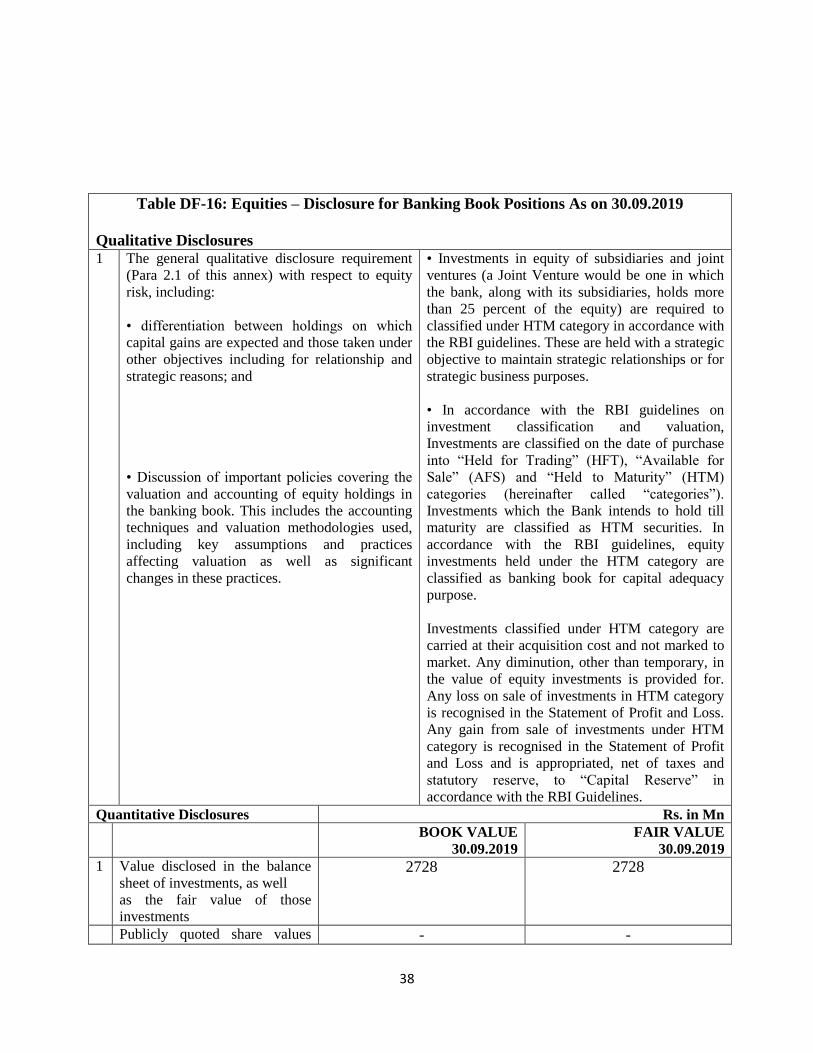
Table DF-16: Equities – Disclosure for Banking Book Positions As on 30.09.2019
Qualitative Disclosures
1 The general qualitative disclosure requirement
(Para 2.1 of this annex) with respect to equity
risk, including:
• differentiation between holdings on which
capital gains are expected and those taken under
other objectives including for relationship and
strategic reasons; and
• Discussion of important policies covering the
valuation and accounting of equity holdings in
the banking book. This includes the accounting
techniques and valuation methodologies used,
including key assumptions and practices
affecting valuation as well as significant
changes in these practices.
• Investments in equity of subsidiaries and joint
ventures (a Joint Venture would be one in which
the bank, along with its subsidiaries, holds more
than 25 percent of the equity) are required to
classified under HTM category in accordance with
the RBI guidelines. These are held with a strategic
objective to maintain strategic relationships or for
strategic business purposes.
• In accordance with the RBI guidelines on
investment classification and valuation,
Investments are classified on the date of purchase
into “Held for Trading” (HFT), “Available for
Sale” (AFS) and “Held to Maturity” (HTM)
categories (hereinafter called “categories”).
Investments which the Bank intends to hold till
maturity are classified as HTM securities. In
accordance with the RBI guidelines, equity
investments held under the HTM category are
classified as banking book for capital adequacy
purpose.
Investments classified under HTM category are
carried at their acquisition cost and not marked to
market. Any diminution, other than temporary, in
the value of equity investments is provided for.
Any loss on sale of investments in HTM category
is recognised in the Statement of Profit and Loss.
Any gain from sale of investments under HTM
category is recognised in the Statement of Profit
and Loss and is appropriated, net of taxes and
statutory reserve, to “Capital Reserve” in
accordance with the RBI Guidelines.
Quantitative Disclosures Rs. in Mn
BOOK VALUE
30.09.2019
FAIR VALUE
30.09.2019
1 Value disclosed in the balance
sheet of investments, as well
as the fair value of those
investments
2728 2728
Publicly quoted share values - -
39
where the share price is
materially different from fair
value
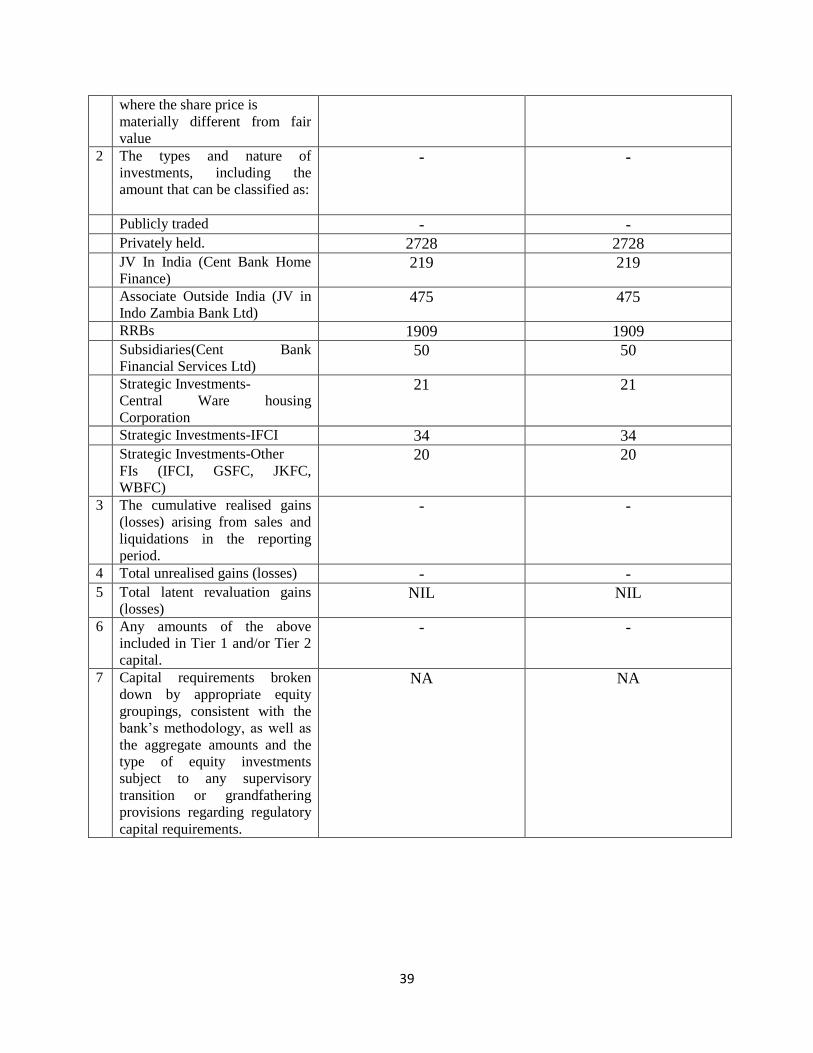
2 The types and nature of
investments, including the
amount that can be classified as:
- -
Publicly traded - - Privately held. 2728 2728 JV In India (Cent Bank Home
Finance) 219 219
Associate Outside India (JV in
Indo Zambia Bank Ltd) 475 475
RRBs 1909 1909 Subsidiaries(Cent Bank
Financial Services Ltd) 50 50
Strategic Investments-
Central Ware housing
Corporation
21 21
Strategic Investments-IFCI 34 34 Strategic Investments-Other
FIs (IFCI, GSFC, JKFC,
WBFC)
20 20
3 The cumulative realised gains
(losses) arising from sales and
liquidations in the reporting
period.
- -
4 Total unrealised gains (losses) - - 5 Total latent revaluation gains
(losses) NIL NIL
6 Any amounts of the above
included in Tier 1 and/or Tier 2
capital.
- -
7 Capital requirements broken
down by appropriate equity
groupings, consistent with the
bank‟s methodology, as well as
the aggregate amounts and the
type of equity investments
subject to any supervisory
transition or grandfathering
provisions regarding regulatory
capital requirements.
NA NA
40
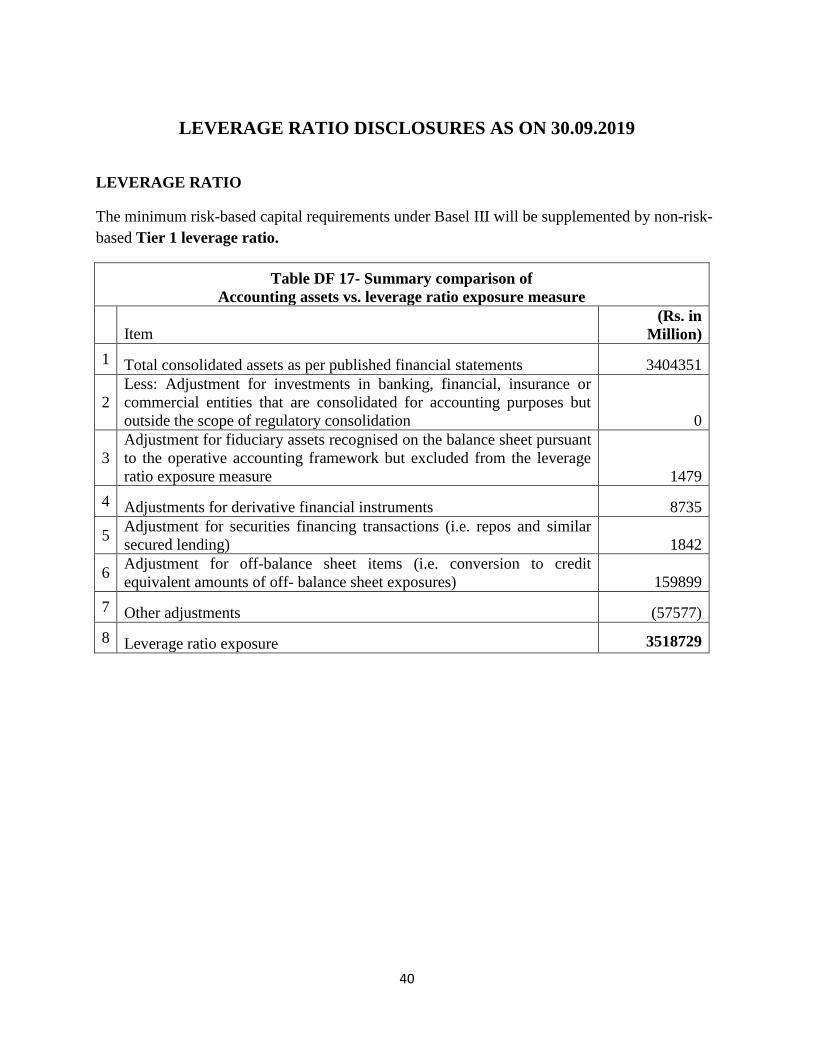
LEVERAGE RATIO DISCLOSURES AS ON 30.09.2019
LEVERAGE RATIO
The minimum risk-based capital requirements under Basel III will be supplemented by non-risk-
based Tier 1 leverage ratio.
Table DF 17- Summary comparison of
Accounting assets vs. leverage ratio exposure measure
Item (Rs. in
Million)
1 Total consolidated assets as per published financial statements 3404351
2
Less: Adjustment for investments in banking, financial, insurance or
commercial entities that are consolidated for accounting purposes but
outside the scope of regulatory consolidation 0
3
Adjustment for fiduciary assets recognised on the balance sheet pursuant
to the operative accounting framework but excluded from the leverage
ratio exposure measure 1479
4 Adjustments for derivative financial instruments 8735
5 Adjustment for securities financing transactions (i.e. repos and similar
secured lending) 1842
6 Adjustment for off-balance sheet items (i.e. conversion to credit
equivalent amounts of off- balance sheet exposures) 159899
7 Other adjustments (57577)
8 Leverage ratio exposure 3518729
41
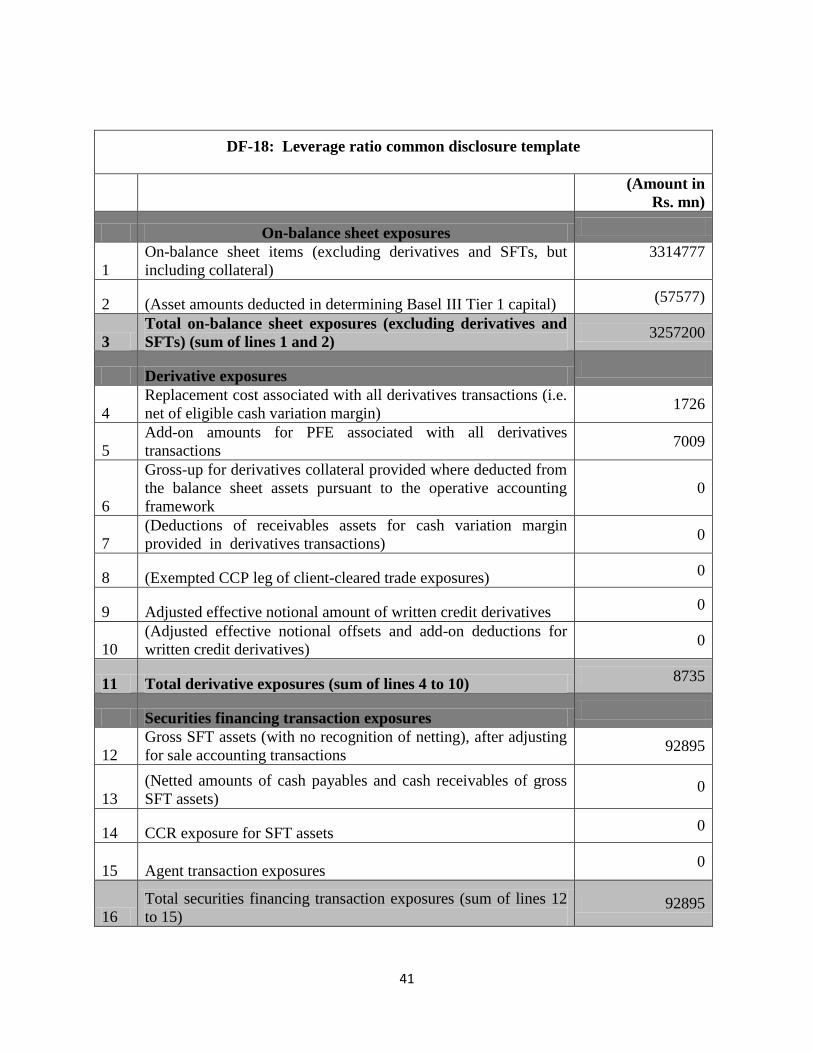
DF-18: Leverage ratio common disclosure template
(Amount in
Rs. mn)
On-balance sheet exposures
1
On-balance sheet items (excluding derivatives and SFTs, but
including collateral)
3314777
2 (Asset amounts deducted in determining Basel III Tier 1 capital) (57577)
3
Total on-balance sheet exposures (excluding derivatives and
SFTs) (sum of lines 1 and 2) 3257200
Derivative exposures
4
Replacement cost associated with all derivatives transactions (i.e.
net of eligible cash variation margin) 1726
5
Add-on amounts for PFE associated with all derivatives
transactions 7009
6
Gross-up for derivatives collateral provided where deducted from
the balance sheet assets pursuant to the operative accounting
framework
0
7
(Deductions of receivables assets for cash variation margin
provided in derivatives transactions) 0
8 (Exempted CCP leg of client-cleared trade exposures) 0
9 Adjusted effective notional amount of written credit derivatives 0
10
(Adjusted effective notional offsets and add-on deductions for
written credit derivatives) 0
11 Total derivative exposures (sum of lines 4 to 10) 8735
Securities financing transaction exposures
12
Gross SFT assets (with no recognition of netting), after adjusting
for sale accounting transactions 92895
13
(Netted amounts of cash payables and cash receivables of gross
SFT assets) 0
14 CCR exposure for SFT assets 0
15 Agent transaction exposures 0
16
Total securities financing transaction exposures (sum of lines 12
to 15) 92895
42
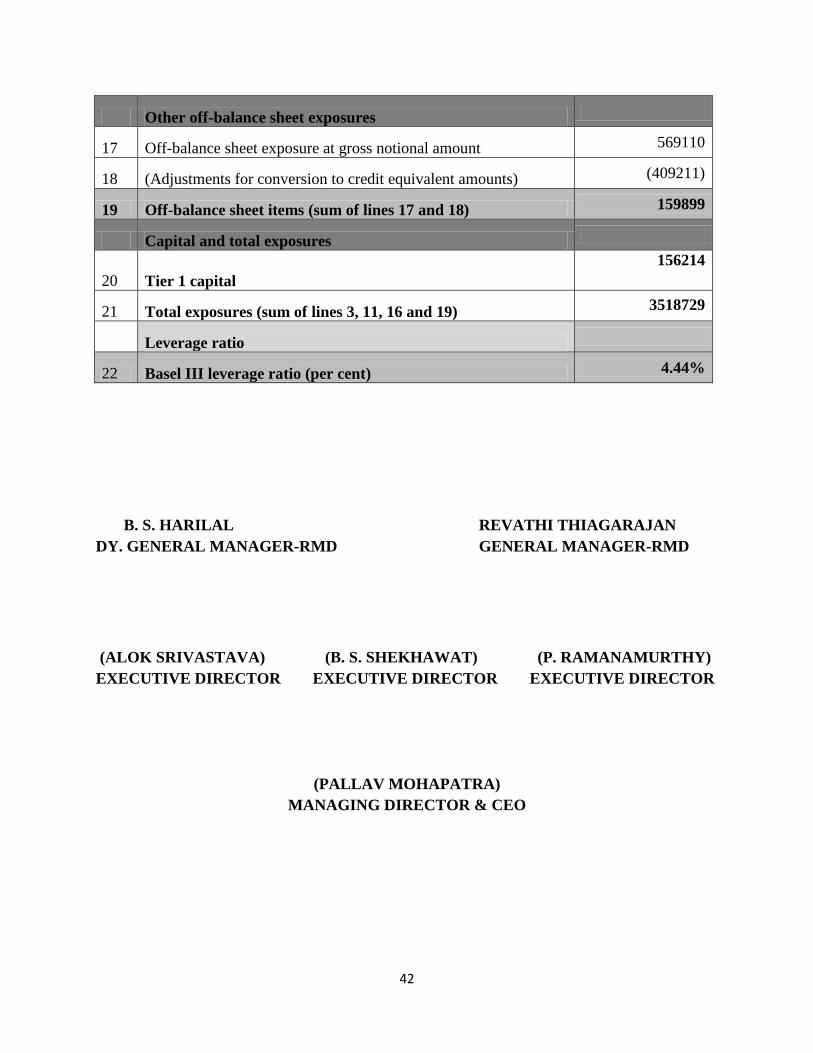
Other off-balance sheet exposures
17 Off-balance sheet exposure at gross notional amount 569110
18 (Adjustments for conversion to credit equivalent amounts) (409211)
19 Off-balance sheet items (sum of lines 17 and 18) 159899
Capital and total exposures
20 Tier 1 capital
156214
21 Total exposures (sum of lines 3, 11, 16 and 19) 3518729
Leverage ratio
22 Basel III leverage ratio (per cent) 4.44%
B. S. HARILAL REVATHI THIAGARAJAN
DY. GENERAL MANAGER-RMD GENERAL MANAGER-RMD
(ALOK SRIVASTAVA) (B. S. SHEKHAWAT) (P. RAMANAMURTHY)
EXECUTIVE DIRECTOR EXECUTIVE DIRECTOR EXECUTIVE DIRECTOR
(PALLAV MOHAPATRA)
MANAGING DIRECTOR & CEO
Recommended