
PI Vision – Beyond the Basics

2 | Pa g e
Operational IntelligenceCopyright Copyright & Trademark © Copyright 1995-2020 OSIsoft, LLC 1600 Alvarado Street San Leandro, CA 94577 © 2021 by OSIsoft, LLC. All rights reserved. All rights reserved. No part of this publication may be reproduced, stored in a retrieval system, or transmitted, in any form or by any means, mechanical, photocopying, recording, or otherwise, without the prior written permission of OSIsoft, LLC. OSIsoft, the OSIsoft logo and logotype, Managed PI, OSIsoft Advanced Services, OSIsoft Cloud Services, OSIsoft Connected Services, PI ACE, PI Advanced Computing Engine, PI AF SDK, PI API, PI Asset Framework, PI Audit Viewer, PI Builder, PI Cloud Connect, PI Connectors, PI Data Archive, PI DataLink, PI DataLink Server, PI Developers Club, PI Integrator for Business Analytics, PI Interfaces, PI JDBC Driver, PI Manual Logger, PI Notifications, PI ODBC Driver, PI OLEDB Enterprise, PI OLEDB Provider, PI OPC DA Server, PI OPC HDA Server, PI ProcessBook, PI SDK, PI Server, PI Square, PI System, PI System Access, PI Vision, PI Visualization Suite, PI Web API, PI WebParts, PI Web Services, RLINK and RtReports are all trademarks of OSIsoft, LLC. All other trademarks or trade names used herein are the property of their respective owners. U.S. GOVERNMENT RIGHTS Use, duplication or disclosure by the US Government is subject to restrictions set forth in the OSIsoft, LLC license agreement and/or as provided in DFARS 227.7202, DFARS 252.227-7013, FAR 12-212, FAR 52.227-19, or their successors, as applicable. Published: February 6, 2020

3 | Pa g e
4 | Pa g e
Table of Contents
Contents Table of Contents .................................................................................................................................................... 4
Contents .............................................................................................................................................................. 4
Introduction ............................................................................................................................................................. 5
Approach ................................................................................................................................................................. 5
Scenario: Energy Management Solutions ................................................................................................................ 6
Exercises .................................................................................................................................................................. 7
Exercise 1: Creating a Turbine Information Display ............................................................................................ 7
Exercise 2: Turbine Events Display ...................................................................................................................... 9
Exercise 3: Linking the displays ......................................................................................................................... 11
Exercise 4: Ad Hoc Trending in PI Vision ........................................................................................................... 13
Exercise 5: XY Plot with Reference Curve ......................................................................................................... 16
Solution Guide ....................................................................................................................................................... 17
Solution for Exercise 1: Creating a Turbine Information Display ....................................................................... 17
Solution for Exercise 2: Turbine Events Display ................................................................................................. 22
Solution for Exercise 3: Linking the displays ...................................................................................................... 24
Solution for Exercise 4: Ad Hoc Trending in PI Vision ........................................................................................ 29
Solution for Exercise 5: XY Plot with Reference Curve ...................................................................................... 30
PI Vision and PI ProcessBook ................................................................................................................................. 32
What is the PI ProcessBook to PI Vision Migration Utility? .............................................................................. 32
Installation Information .................................................................................................................................... 32
Feature Comparison: PI ProcessBook & PI Vision ............................................................................................. 33
View PI ProcessBook Display in PI Vision .......................................................................................................... 34
Scenario: Flynn River Hydro .............................................................................................................................. 36
Exercises ............................................................................................................................................................ 36
PI Vision Security ................................................................................................................................................... 47
Share Displays and Edit Access ......................................................................................................................... 47
Manage PI Vision Displays................................................................................................................................. 49
Editing PI Vision Displays ................................................................................................................................... 50
Reports .............................................................................................................................................................. 51
5 | Pa g e
Introduction This course is designed for people who already have already used PI Vision. Students should already be familiar with how to create displays in PI Vision and understand how PI Vision is able to leverage AF Templates.
Exercises can be solved using PI Vision and PI System Explorer. If you've not used PI Vision before that's okay. Just try and follow the solution guide that's at the end of the workbook and is after each exercise.
Approach Specific questions or scenarios will be presented to solve primarily using OSIsoft PI Vision as your visualization and analysis tool. More advanced features of PI Vision will have a strong reliance on AF so you will also need to use PI System Explorer (PSE). Each exercise can be completed with PI Vision and PSE. The scenario for this course is that you've just been hired as a consultant for energy management solutions. Your first client is a wind farm energy company, and you are tasked with creating some advanced PI Vision displays that employees can use to monitor their turbines.
6 | Pa g e
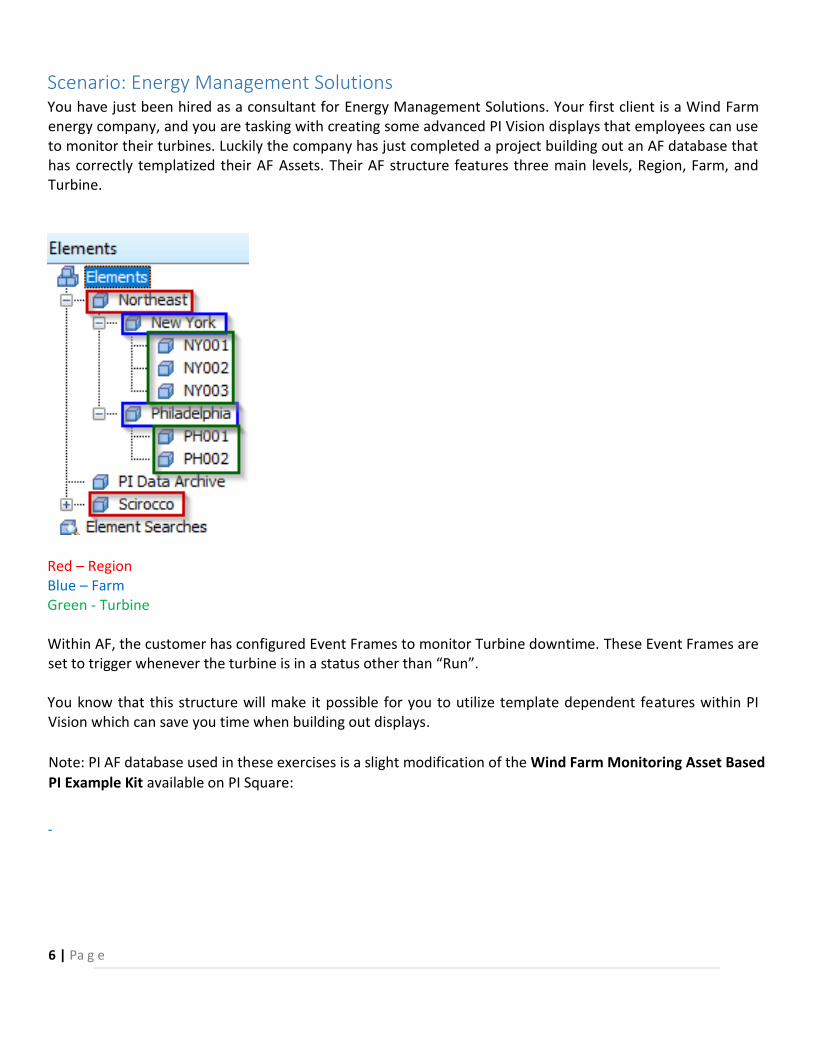
Scenario: Energy Management Solutions You have just been hired as a consultant for Energy Management Solutions. Your first client is a Wind Farm energy company, and you are tasking with creating some advanced PI Vision displays that employees can use to monitor their turbines. Luckily the company has just completed a project building out an AF database that has correctly templatized their AF Assets. Their AF structure features three main levels, Region, Farm, and Turbine.
Red – Region Blue – Farm Green - Turbine Within AF, the customer has configured Event Frames to monitor Turbine downtime. These Event Frames are set to trigger whenever the turbine is in a status other than “Run”. You know that this structure will make it possible for you to utilize template dependent features within PI Vision which can save you time when building out displays.
Note: PI AF database used in these exercises is a slight modification of the Wind Farm Monitoring Asset Based
PI Example Kit available on PI Square:
7 | Pa g e
Exercises
Exercise 1: Creating a Turbine Information Display
Exercise Objectives:
• Create a display showing Turbine level information
• Utilize a multi-level collection to navigate through their AF database
Scenario:
Your first assignment is to create a Turbine Information Display. The client would like to have a display that shows Power and Production information for each Turbine that is selected. The client has 22 turbines in total. With your knowledge of PI Vision, you know if you make a display using attributes from the same template you can use the Asset Drop Down box to make a reusable display that can be applied to all turbines. The client informs you though that they do not want to have users using the Asset Drop Down box. They would like to have an on-screen symbol that they can select to change the context of the display at various levels and only be able to see Turbines in the selected Region and Farm.
Approach:
1. Use the shortcut on the desktop to launch PI Vision using Chrome.
a. Alternatively, start Chrome and navigate to https://pivision/pivision
2. Click New Display in PI Vision.
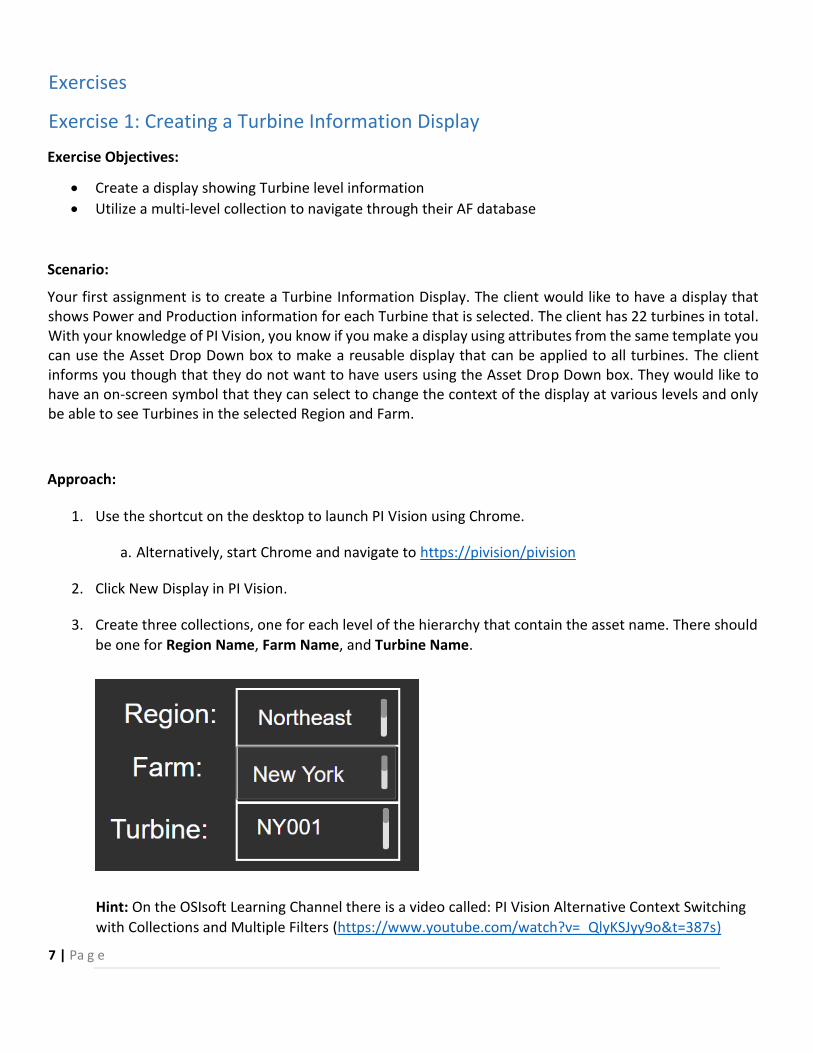
3. Create three collections, one for each level of the hierarchy that contain the asset name. There should
be one for Region Name, Farm Name, and Turbine Name.
Hint: On the OSIsoft Learning Channel there is a video called: PI Vision Alternative Context Switching
with Collections and Multiple Filters (https://www.youtube.com/watch?v=_QlyKSJyy9o&t=387s)
8 | Pa g e
4. Configure the collection’s navigation link to change the root context of the current display
5. Create symbols in PI Vision that can be used to monitor Power and Production of the Turbines.
Specifically, the Active Power, Apparent Power, and Lifetime Production attributes will be useful.
6. Once finished, select the drop-down arrow on the right hand side of the Asset Drop Down box and click
the gear icon. Then in the Configure Context Switching pane on the right select the option for “Do not
show”.
7. Save the display as Windfarm Turbine Overview.
Questions:
What is the Hourly Lifetime Production for Turbine GE004 in Santaella?
What is the difference in Active Power and Apparent Power for Turbine RB009 in Finisterre?
9 | Pa g e
Exercise 2: Turbine Events Display
Exercise Objectives:
• Use the Events Table to see recent Event Frames
• Analyze Event frames with the Details page
Scenario:
Your client loved your Turbine information display, but they would also like to see a display they can use to
better track their Event frames. Currently they are monitoring turbine downtime events and would like a
display to visualize that. They would like the display to contain all the most recent events from the selected
turbine.
Approach:
1. Create a new display in PI Vision.
2. Create symbols on the display showing the Turbine name and status.
a Only create the display using data from one turbine.
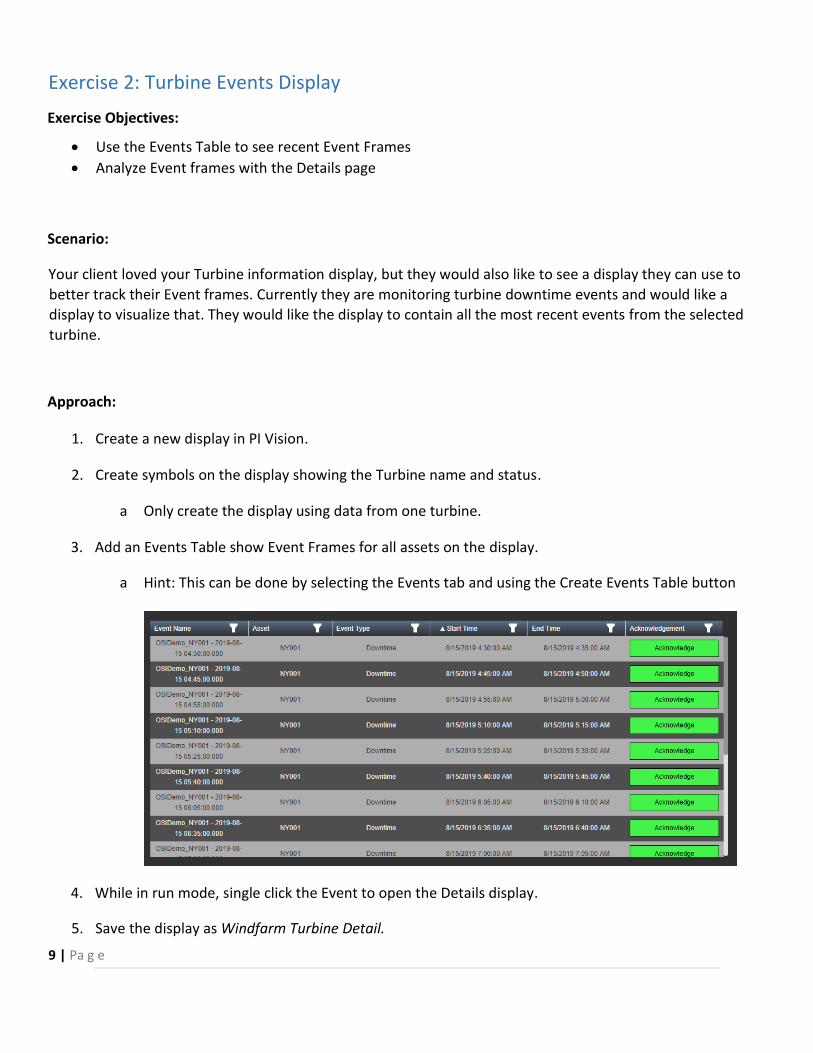
3. Add an Events Table show Event Frames for all assets on the display.
a Hint: This can be done by selecting the Events tab and using the Create Events Table button
4. While in run mode, single click the Event to open the Details display.
5. Save the display as Windfarm Turbine Detail.
10 | Pa g e
Questions:
When was the last time turbine PH002 in Philadelphia had a downtime Event?
What was the approximate peak Lost Revenue Rate in that time range?
What was the approximate minimum Apparent Power for that time range?
11 | Pa g e
Exercise 3: Linking the displays
Exercise Objectives:
• Use AF to dynamically build URLs to the Event Details display.
• Create an Asset Comparison table to display those URLs in PI Vision.
Scenario:
Again, your latest display was well received by the client. As you already know they do not like to have their
users go through the Asset Drop Down box to change the context of the display, so they are looking for an
alternate solution. What they would like to have is a way to navigate from the Information display to the
Events display and have that link provide the context for the Events display.
Approach:
1. Open PI System Explorer and select the Wind Farm Database
2. Navigate to Library and under Templates > Element Templates > Turbine
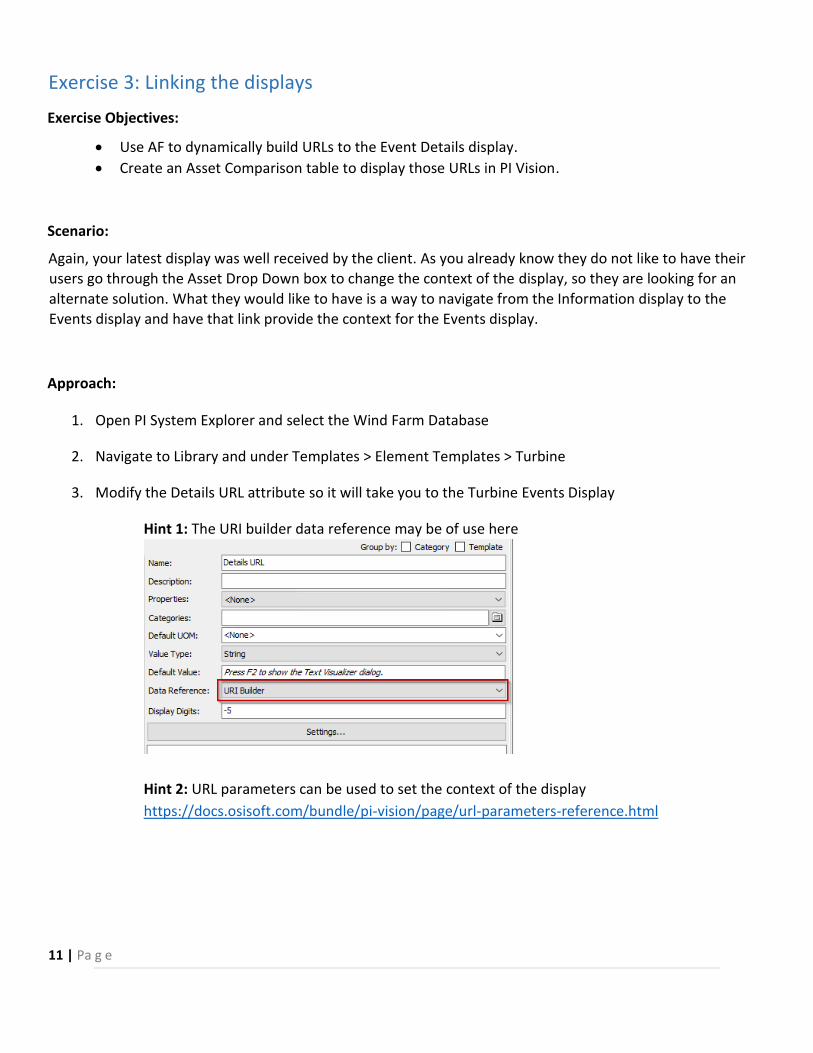
3. Modify the Details URL attribute so it will take you to the Turbine Events Display
Hint 1: The URI builder data reference may be of use here
Hint 2: URL parameters can be used to set the context of the display
https://docs.osisoft.com/bundle/pi-vision/page/url-parameters-reference.html
12 | Pa g e
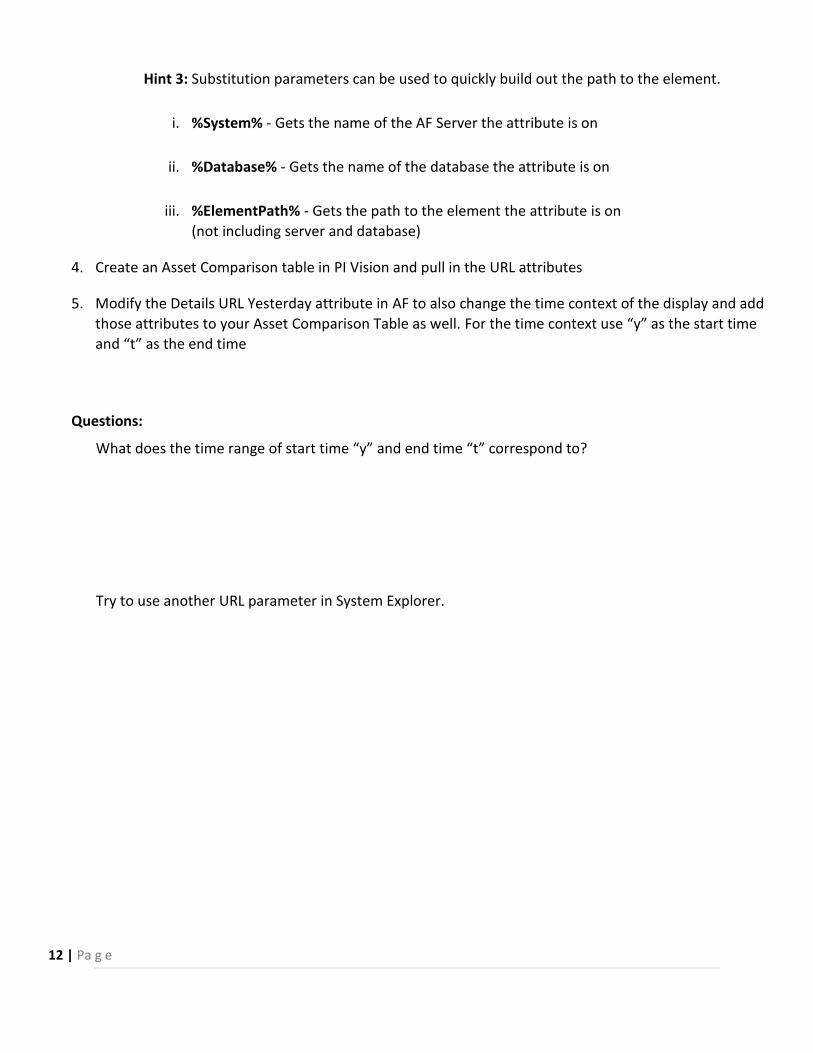
Hint 3: Substitution parameters can be used to quickly build out the path to the element.
i. %System% - Gets the name of the AF Server the attribute is on
ii. %Database% - Gets the name of the database the attribute is on
iii. %ElementPath% - Gets the path to the element the attribute is on
(not including server and database)
4. Create an Asset Comparison table in PI Vision and pull in the URL attributes
5. Modify the Details URL Yesterday attribute in AF to also change the time context of the display and add
those attributes to your Asset Comparison Table as well. For the time context use “y” as the start time
and “t” as the end time
Questions:
What does the time range of start time “y” and end time “t” correspond to?
Try to use another URL parameter in System Explorer.
13 | P a g e
Exercise 4: Ad Hoc Trending in PI Vision
Exercise Objective:
• Analyze an existing display using the Ad Hoc functionality of PI Vision
Scenario:
After seeing the advance displays you have been making your client has taken it upon themselves to make a
display of their own. They created a display called Wind Farm Overview but are having trouble analyzing the
display to answer specific questions about their operations.
Approach:
1. Open the display called Wind Farm Overview.
2. While in Run mode, hold the CTRL key and select the Wholesale Price attributes and Lost Power
attributes.
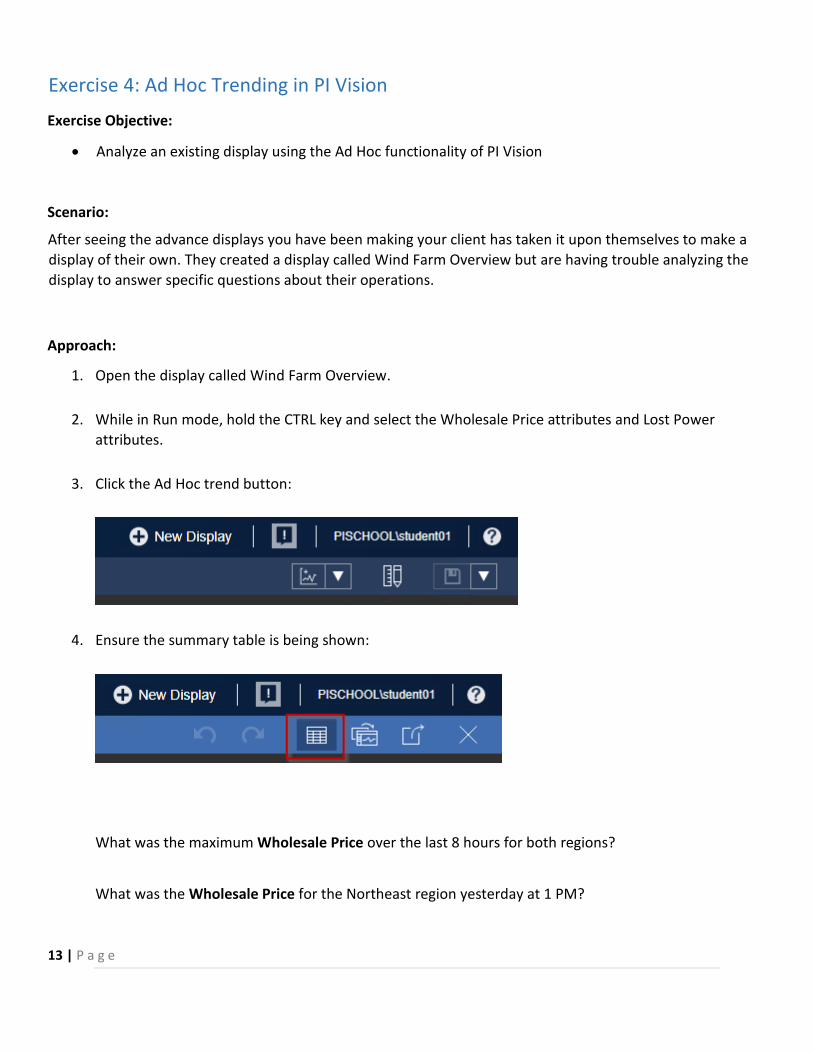
3. Click the Ad Hoc trend button:
4. Ensure the summary table is being shown:
What was the maximum Wholesale Price over the last 8 hours for both regions?
What was the Wholesale Price for the Northeast region yesterday at 1 PM?
14 | P a g e
5. Close the Ad Hoc display workspace and add the Total Revenue attributes which are shown in the
trend symbols to the Ad Hoc Trend workspace.
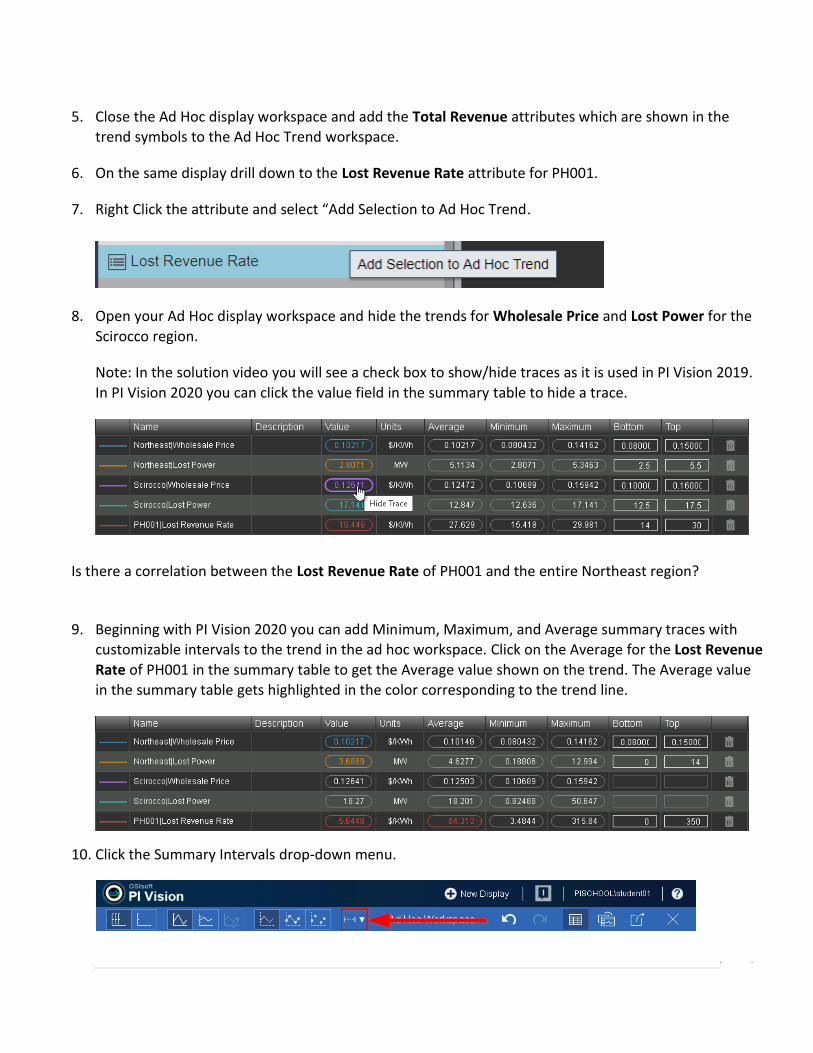
6. On the same display drill down to the Lost Revenue Rate attribute for PH001.
7. Right Click the attribute and select “Add Selection to Ad Hoc Trend.
8. Open your Ad Hoc display workspace and hide the trends for Wholesale Price and Lost Power for the
Scirocco region.
Note: In the solution video you will see a check box to show/hide traces as it is used in PI Vision 2019.
In PI Vision 2020 you can click the value field in the summary table to hide a trace.
Is there a correlation between the Lost Revenue Rate of PH001 and the entire Northeast region?
9. Beginning with PI Vision 2020 you can add Minimum, Maximum, and Average summary traces with
customizable intervals to the trend in the ad hoc workspace. Click on the Average for the Lost Revenue
Rate of PH001 in the summary table to get the Average value shown on the trend. The Average value
in the summary table gets highlighted in the color corresponding to the trend line.
10. Click the Summary Intervals drop-down menu.
15 | P a g e
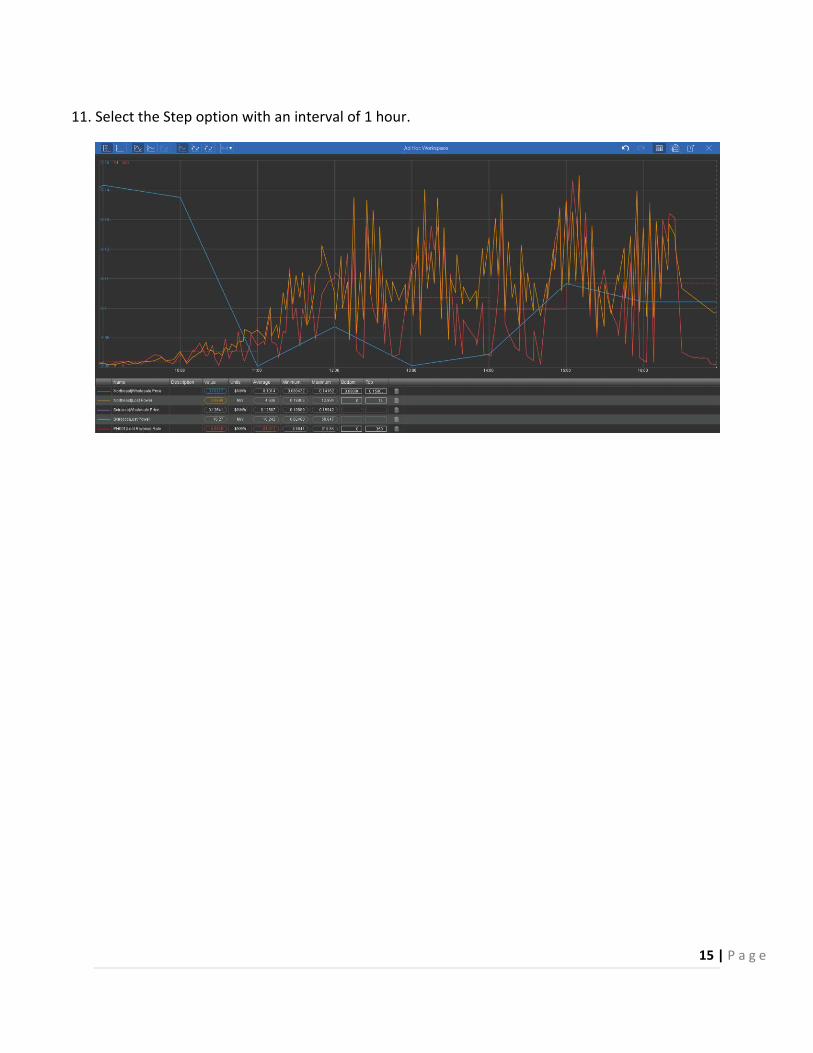
11. Select the Step option with an interval of 1 hour.
16 | P a g e
Exercise 5: XY Plot with Reference Curve
Exercise Objective:
• Create an XY Plot in PI Vision.
• Add a Reference Curve to the XY Plot
Scenario:
The client has now informed you that they would be interested in visualizing the relationship
between Active Power and Apparent Power on each of their turbines in the Turbine Events
Display. On the customer’s side they have set up an AF Analysis that is calculating a value for their
Apparent Power.
Approach:
1. Open the Windfarm Turbine Detail Display and drill down to the Turbine currently on the
display.
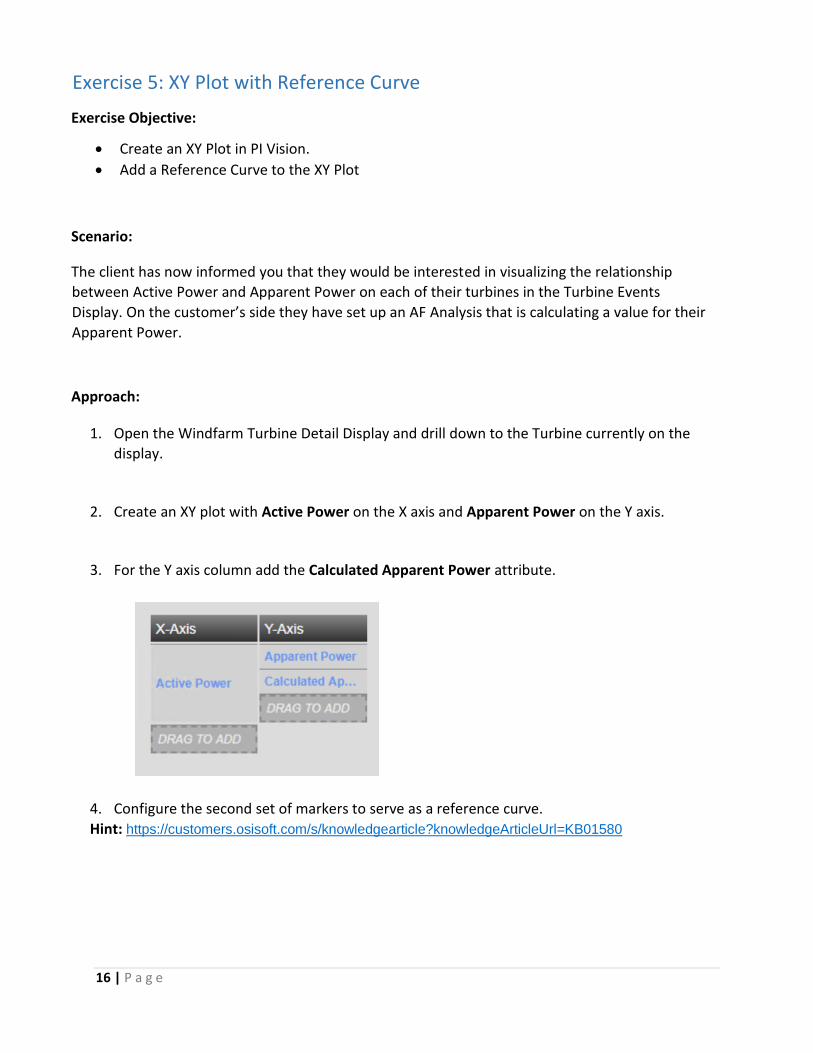
2. Create an XY plot with Active Power on the X axis and Apparent Power on the Y axis.
3. For the Y axis column add the Calculated Apparent Power attribute.
4. Configure the second set of markers to serve as a reference curve.
Hint: https://customers.osisoft.com/s/knowledgearticle?knowledgeArticleUrl=KB01580
17 | P a g e
Solution Guide
Solution for Exercise 1: Creating a Turbine Information Display
1. Connect to PI Vision by clicking the PI Vision shortcut on the desktop.
2. Click the New Display button.
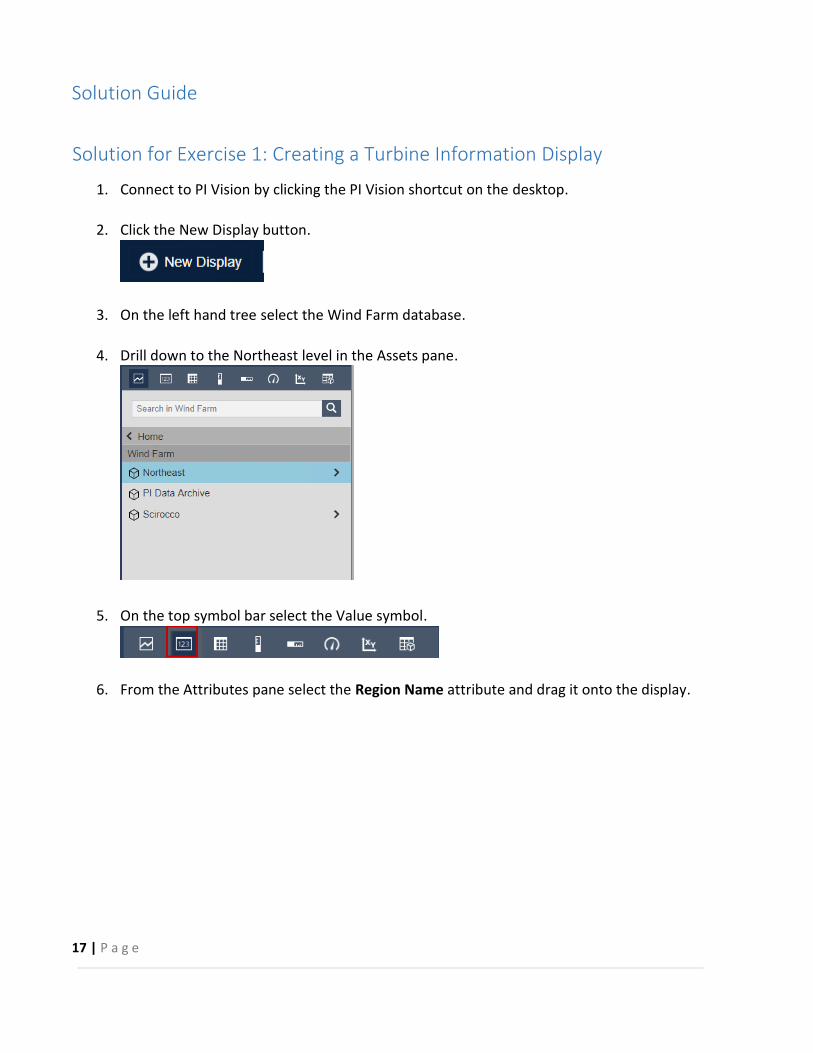
3. On the left hand tree select the Wind Farm database.
4. Drill down to the Northeast level in the Assets pane.
5. On the top symbol bar select the Value symbol.
6. From the Attributes pane select the Region Name attribute and drag it onto the display.
18 | P a g e
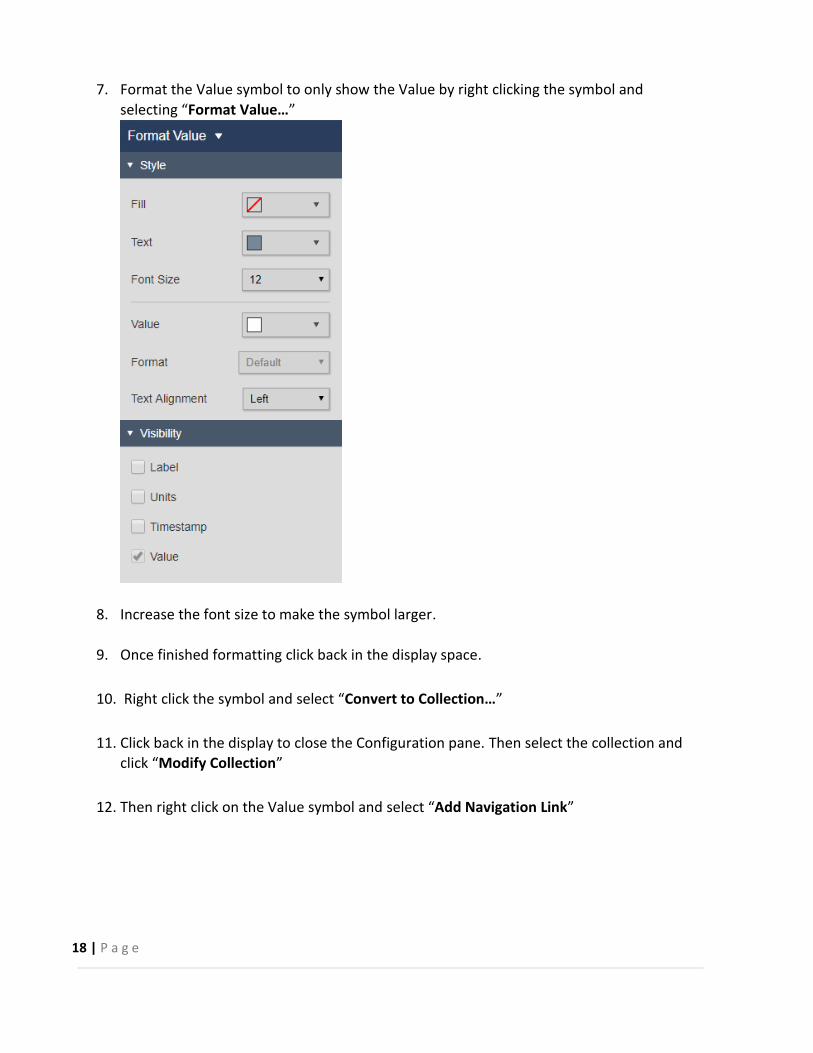
7. Format the Value symbol to only show the Value by right clicking the symbol and
selecting “Format Value…”
8. Increase the font size to make the symbol larger.
9. Once finished formatting click back in the display space.
10. Right click the symbol and select “Convert to Collection…”
11. Click back in the display to close the Configuration pane. Then select the collection and
click “Modify Collection”
12. Then right click on the Value symbol and select “Add Navigation Link”
19 | P a g e
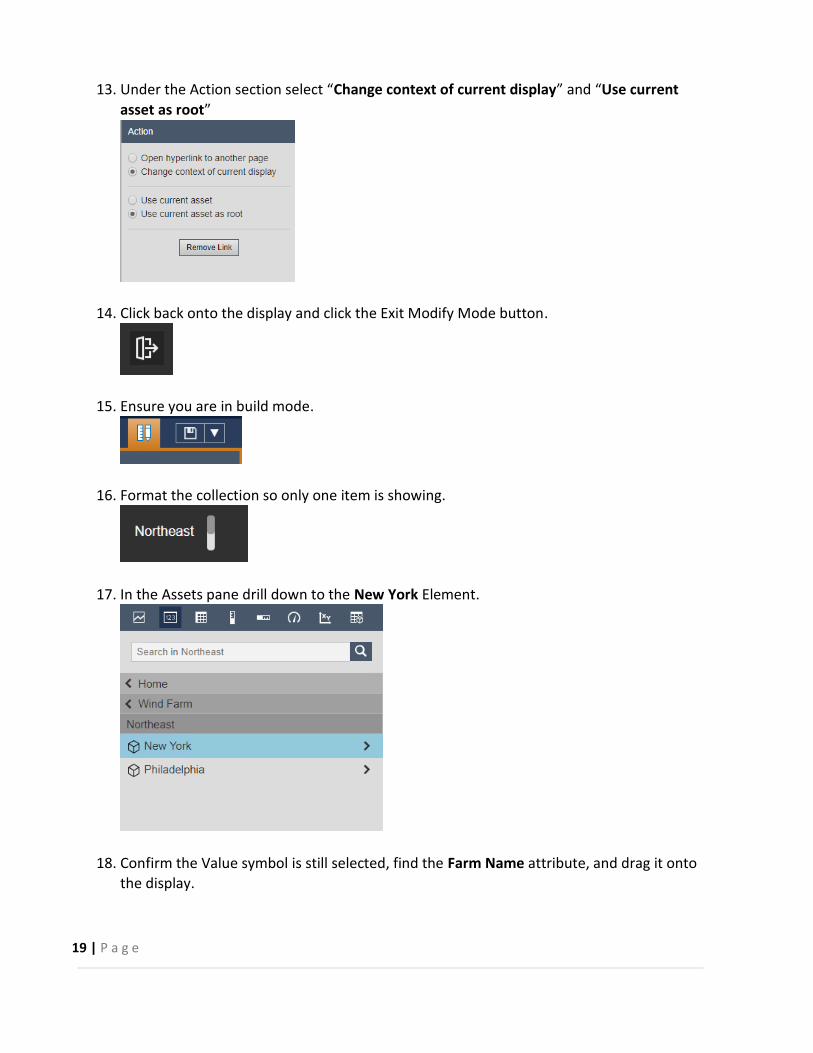
13. Under the Action section select “Change context of current display” and “Use current
asset as root”
14. Click back onto the display and click the Exit Modify Mode button.
15. Ensure you are in build mode.
16. Format the collection so only one item is showing.
17. In the Assets pane drill down to the New York Element.
18. Confirm the Value symbol is still selected, find the Farm Name attribute, and drag it onto
the display.
20 | P a g e
19. Repeat steps 7-15 to format the symbol, create a collection, and configure the navigation
for the symbol.
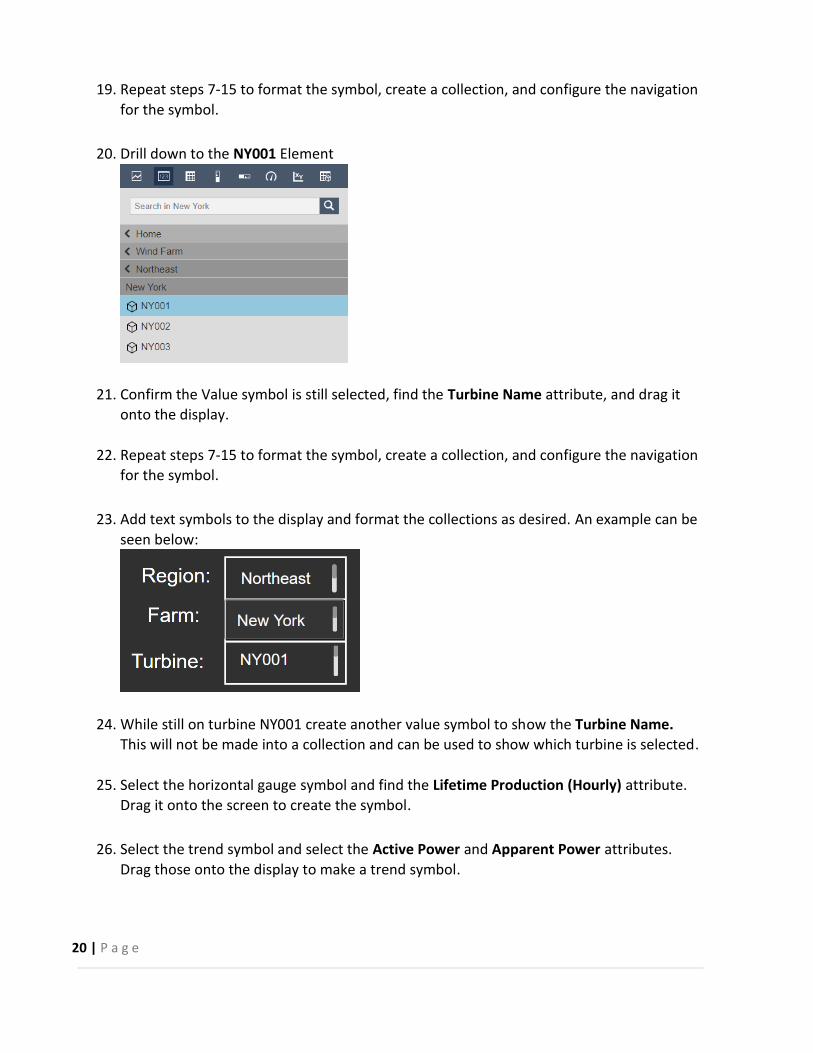
20. Drill down to the NY001 Element
21. Confirm the Value symbol is still selected, find the Turbine Name attribute, and drag it
onto the display.
22. Repeat steps 7-15 to format the symbol, create a collection, and configure the navigation
for the symbol.
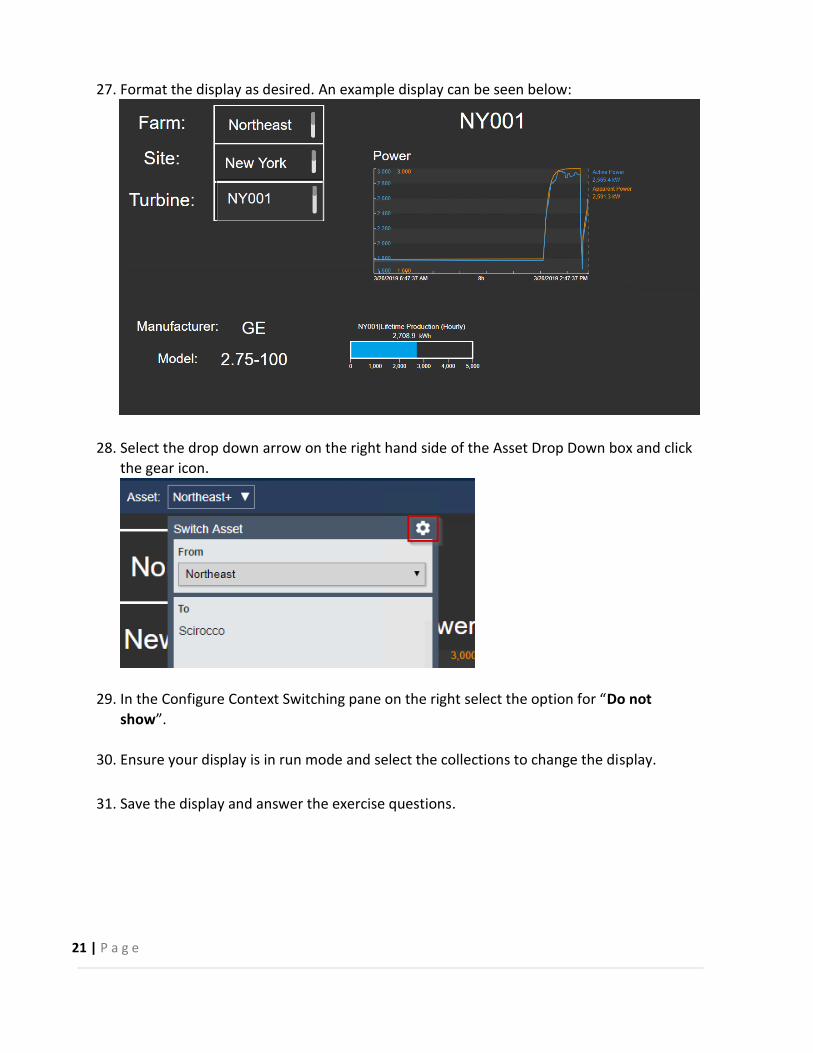
23. Add text symbols to the display and format the collections as desired. An example can be
seen below:
24. While still on turbine NY001 create another value symbol to show the Turbine Name.
This will not be made into a collection and can be used to show which turbine is selected.
25. Select the horizontal gauge symbol and find the Lifetime Production (Hourly) attribute.
Drag it onto the screen to create the symbol.
26. Select the trend symbol and select the Active Power and Apparent Power attributes.
Drag those onto the display to make a trend symbol.
21 | P a g e
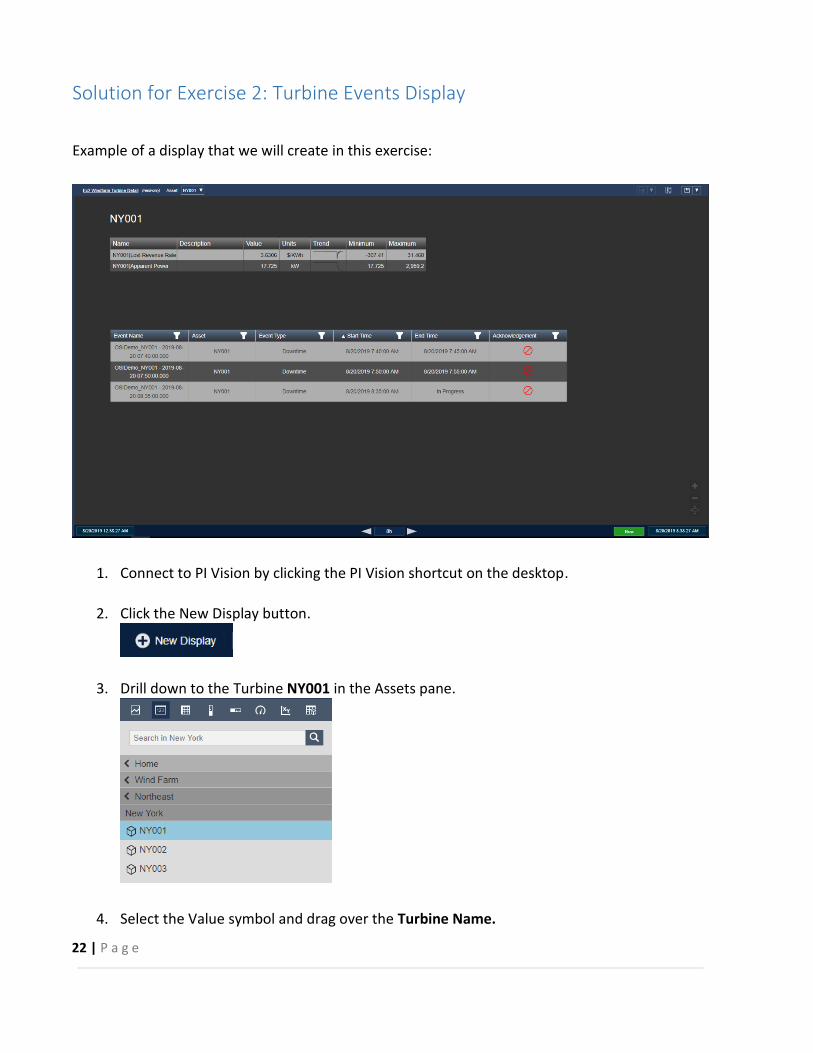
27. Format the display as desired. An example display can be seen below:
28. Select the drop down arrow on the right hand side of the Asset Drop Down box and click
the gear icon.
29. In the Configure Context Switching pane on the right select the option for “Do not
show”.
30. Ensure your display is in run mode and select the collections to change the display.
31. Save the display and answer the exercise questions.
22 | P a g e
Solution for Exercise 2: Turbine Events Display
Example of a display that we will create in this exercise:
1. Connect to PI Vision by clicking the PI Vision shortcut on the desktop.
2. Click the New Display button.
3. Drill down to the Turbine NY001 in the Assets pane.
4. Select the Value symbol and drag over the Turbine Name.
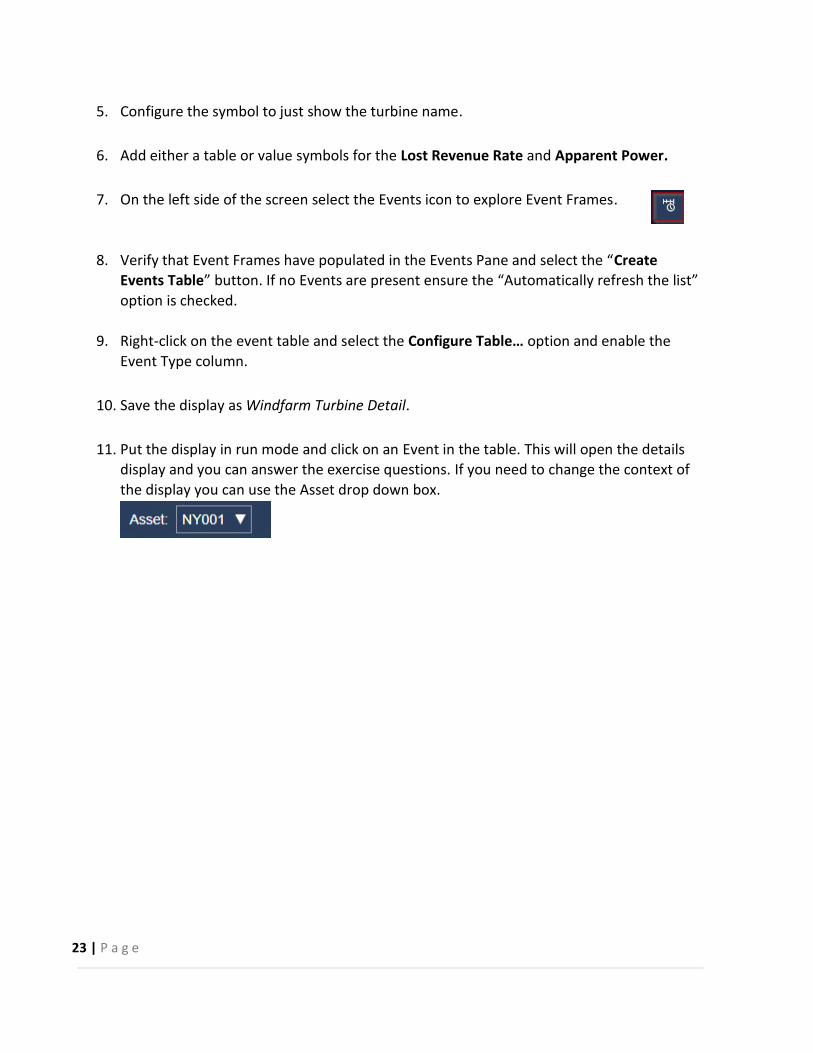
23 | P a g e
5. Configure the symbol to just show the turbine name.
6. Add either a table or value symbols for the Lost Revenue Rate and Apparent Power.
7. On the left side of the screen select the Events icon to explore Event Frames.
8. Verify that Event Frames have populated in the Events Pane and select the “Create
Events Table” button. If no Events are present ensure the “Automatically refresh the list”
option is checked.
9. Right-click on the event table and select the Configure Table… option and enable the
Event Type column.
10. Save the display as Windfarm Turbine Detail.
11. Put the display in run mode and click on an Event in the table. This will open the details
display and you can answer the exercise questions. If you need to change the context of
the display you can use the Asset drop down box.
24 | P a g e
Solution for Exercise 3: Linking the displays
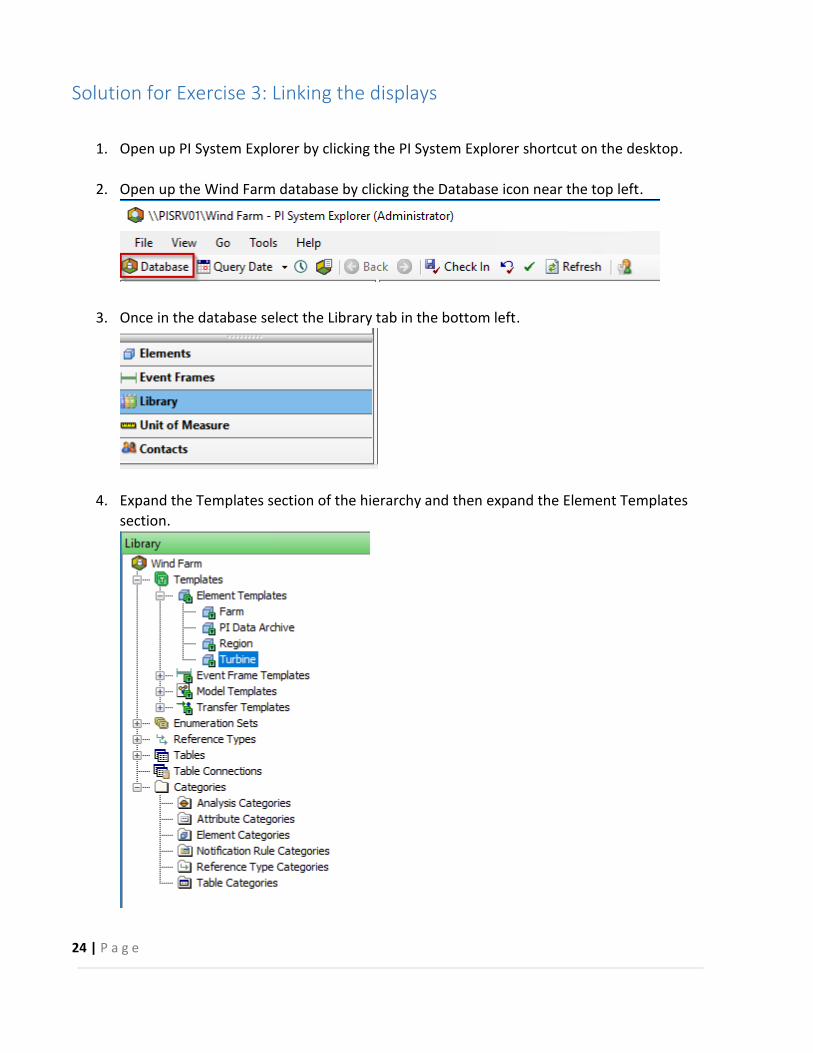
1. Open up PI System Explorer by clicking the PI System Explorer shortcut on the desktop.
2. Open up the Wind Farm database by clicking the Database icon near the top left.
3. Once in the database select the Library tab in the bottom left.
4. Expand the Templates section of the hierarchy and then expand the Element Templates
section.
25 | P a g e
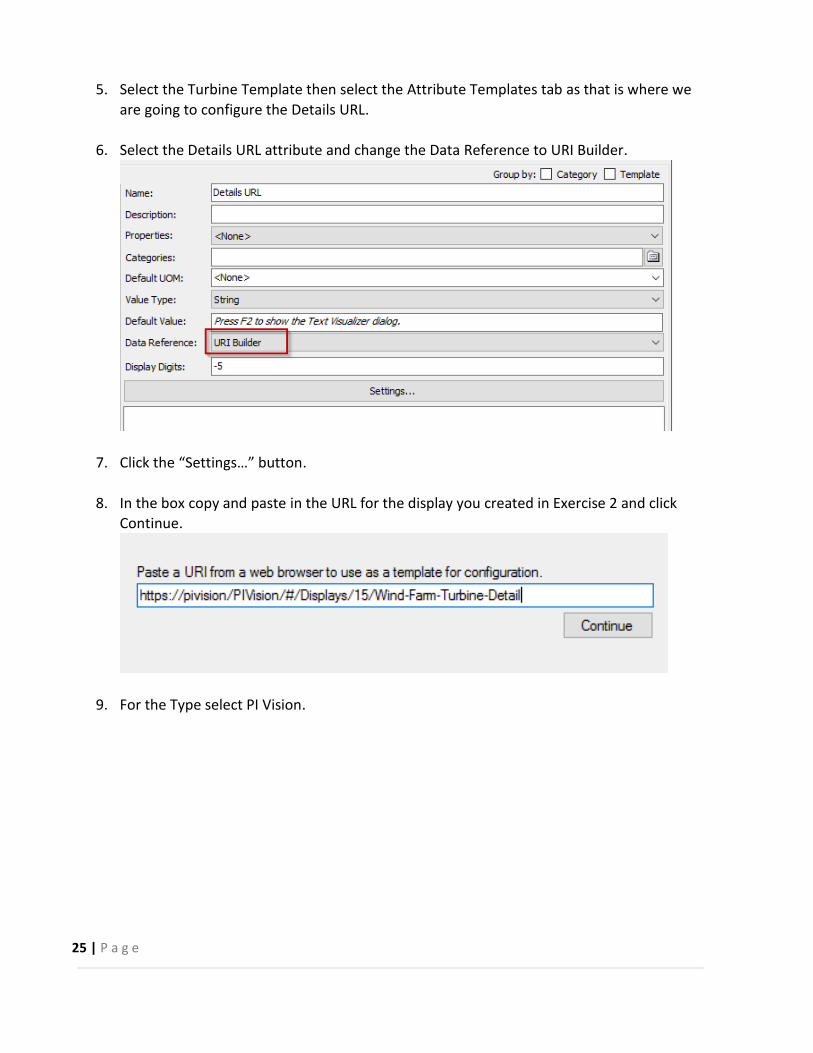
5. Select the Turbine Template then select the Attribute Templates tab as that is where we
are going to configure the Details URL.
6. Select the Details URL attribute and change the Data Reference to URI Builder.
7. Click the “Settings…” button.
8. In the box copy and paste in the URL for the display you created in Exercise 2 and click
Continue.
9. For the Type select PI Vision.
26 | P a g e
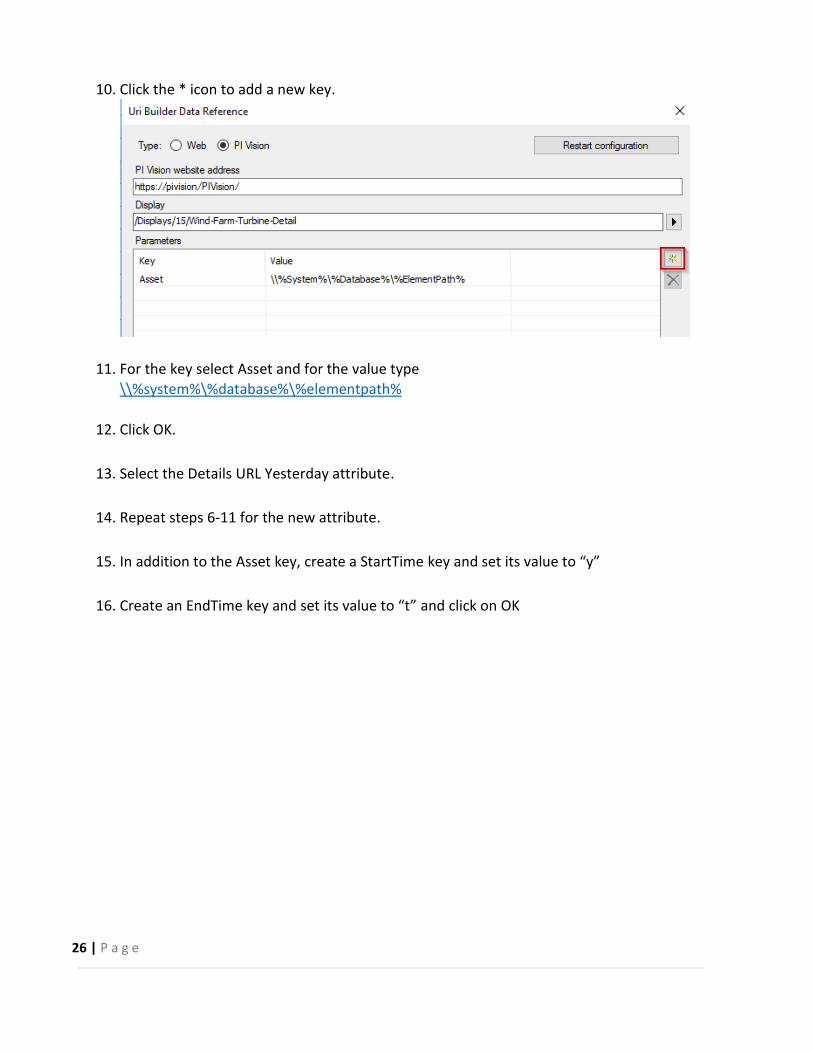
10. Click the * icon to add a new key.
11. For the key select Asset and for the value type
\\%system%\%database%\%elementpath%
12. Click OK.
13. Select the Details URL Yesterday attribute.
14. Repeat steps 6-11 for the new attribute.
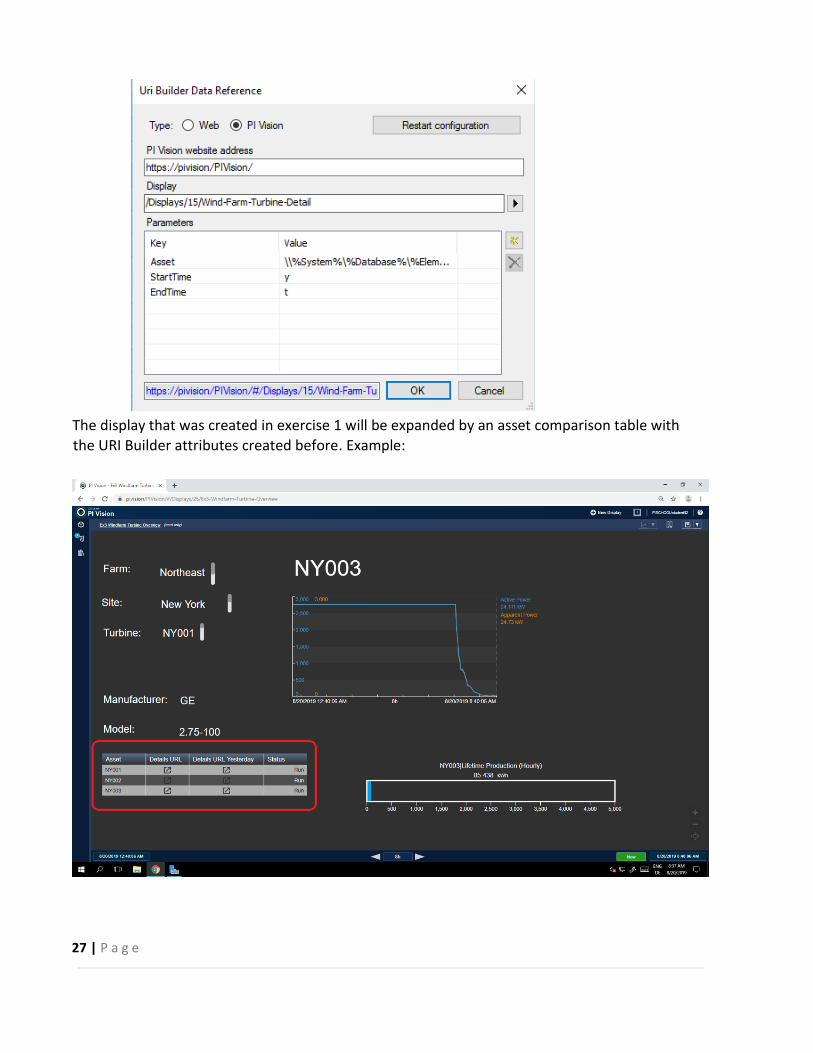
15. In addition to the Asset key, create a StartTime key and set its value to “y”
16. Create an EndTime key and set its value to “t” and click on OK
27 | P a g e
The display that was created in exercise 1 will be expanded by an asset comparison table with
the URI Builder attributes created before. Example:
28 | P a g e
17. Return to PI Vision and open the Windfarm Turbine Overview display you created in
Exercise 1.
18. Create an Asset Comparison Table Symbol on the display that includes the following
attributes:
a. Status
b. Details URL
c. Details URL Yesterday
19. Save the display and test the links by using Run mode and clicking on them.
20. For question 2, you can modify the Details URL Yesterday attribute by adding a new key.

29 | P a g e
Solution for Exercise 4: Ad Hoc Trending in PI Vision
This Exercise was written to already provide step-by-step instructions.
30 | P a g e
Solution for Exercise 5: XY Plot with Reference Curve
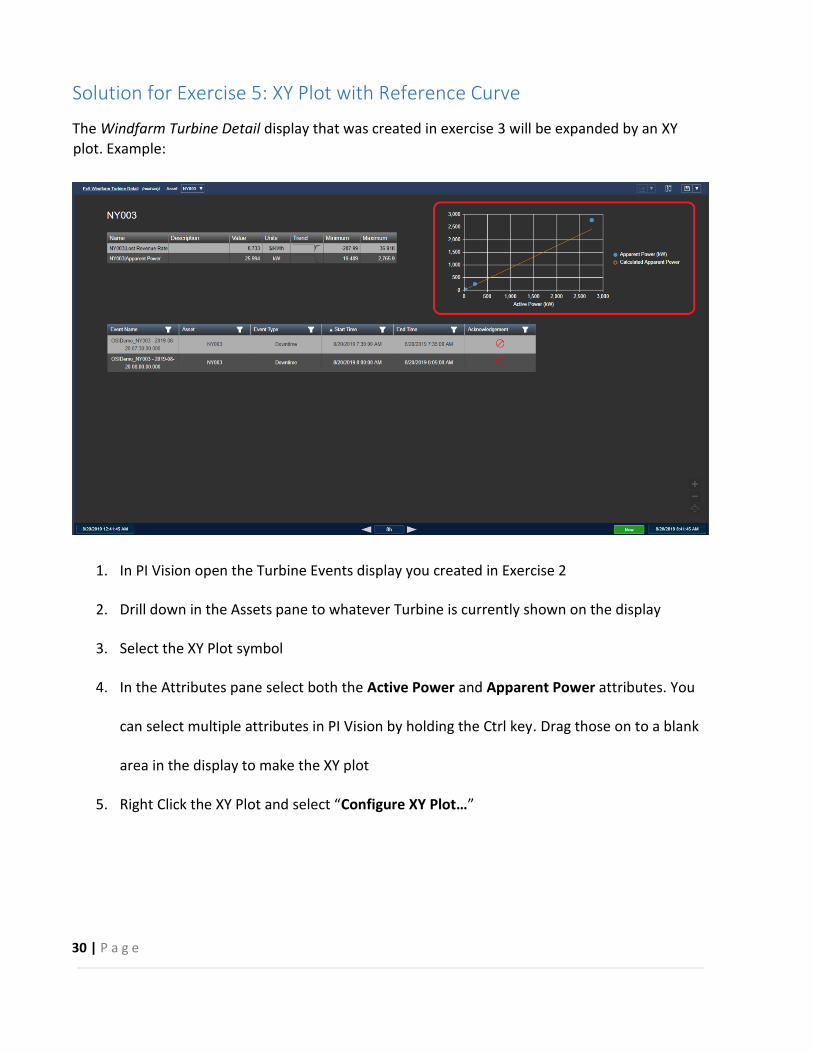
The Windfarm Turbine Detail display that was created in exercise 3 will be expanded by an XY
plot. Example:
1. In PI Vision open the Turbine Events display you created in Exercise 2
2. Drill down in the Assets pane to whatever Turbine is currently shown on the display
3. Select the XY Plot symbol
4. In the Attributes pane select both the Active Power and Apparent Power attributes. You
can select multiple attributes in PI Vision by holding the Ctrl key. Drag those on to a blank
area in the display to make the XY plot
5. Right Click the XY Plot and select “Configure XY Plot…”
31 | P a g e
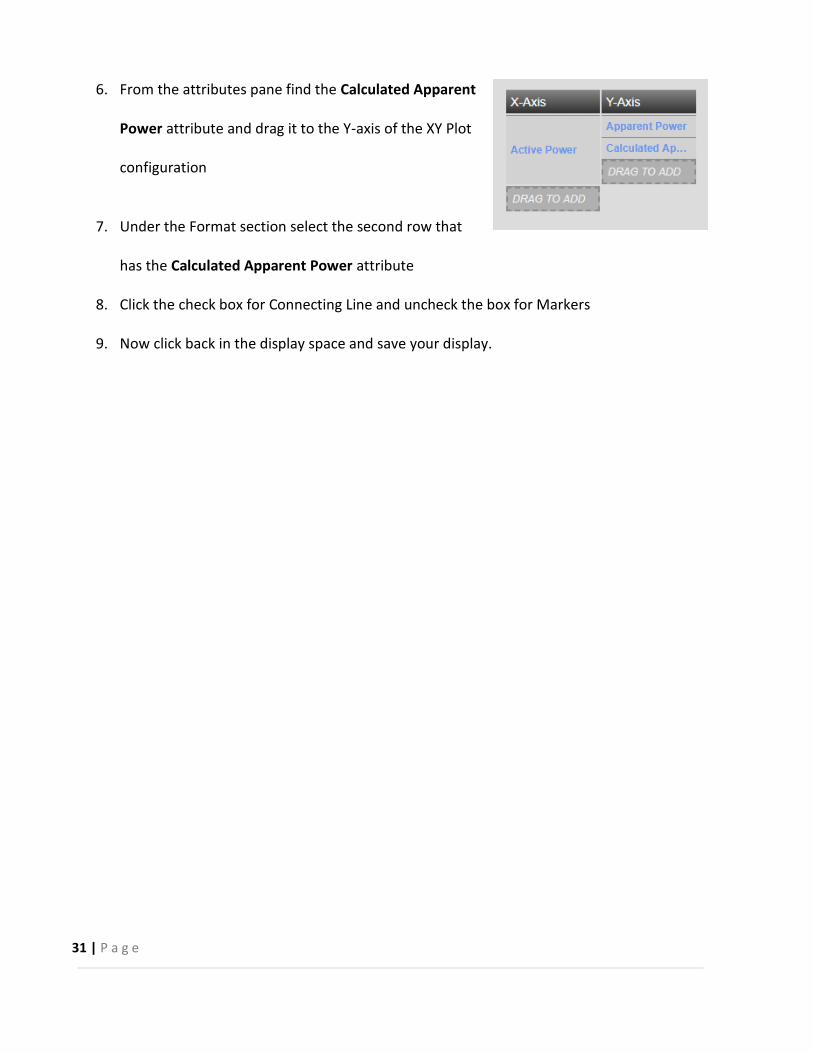
6. From the attributes pane find the Calculated Apparent
Power attribute and drag it to the Y-axis of the XY Plot
configuration
7. Under the Format section select the second row that
has the Calculated Apparent Power attribute
8. Click the check box for Connecting Line and uncheck the box for Markers
9. Now click back in the display space and save your display.

32 | P a g e
PI Vision and PI ProcessBook
PI ProcessBook is a 25-year-old product that has begun to show its age. PI Vision is our leading
visualization tool built to leverage the latest PI System capabilities where PI ProcessBook has
fallen behind.
We know it takes a lot of hard work to build out PI ProcessBook displays, and we want to help
move that work over to our modern visualization tool and take advantage of the benefits of PI
Vision.
While it may seem like a challenging task, this section will give you the knowledge and practice
to be confident in using the PI ProcessBook to PI Vision Migration Utility.
What is the PI ProcessBook to PI Vision Migration Utility?
PI Process Book to PI Vision Migration Utility allows you to analyze and migrate your PI
ProcessBook displays to PI Vision. Results are viewable in the utility itself and in generated
reports.
PI ProcessBook to PI Vision Migration Utility analyzes your selected PI ProcessBook .PDI and .PIW
files and provides information about which displays or portions of displays will or will not
migrate into PI Vision. Differences in the feature sets between PI ProcessBook and PI Vision
might affect the migration of some symbols, data types, and other drawing features. The
generated, migrated PI Vision displays match their source PI ProcessBook displays as closely as
possible in terms of size, position, and color of symbols and data items.
Migrated displays are editable and immediately usable in the most up to date OSIsoft
visualization infrastructure.
For more on this topic, watch the following video:
https://www.youtube.com/embed/yOzZJKvjXrQ
Installation Information
You can install PI ProcessBook to PI Vision Migration Utility 1.1 on many Windows operating
systems, including those running various versions of PI ProcessBook and PI Vision 2020. See the
Software Requirements below.
33 | P a g e
Software Requirements
You can install PI ProcessBook to PI Vision Migration Utility on any machine using the following
operating systems:
• Windows 8.1
• Windows 10
• Windows Server 2012
• Windows Server 2012 R2
• Windows Server 2016
• Windows Server 2019
You can use the PI ProcessBook to PI Vision Migration Utility to migrate PI ProcessBook displays
from versions 3.0.15.7 or later to PI Vision 2020.
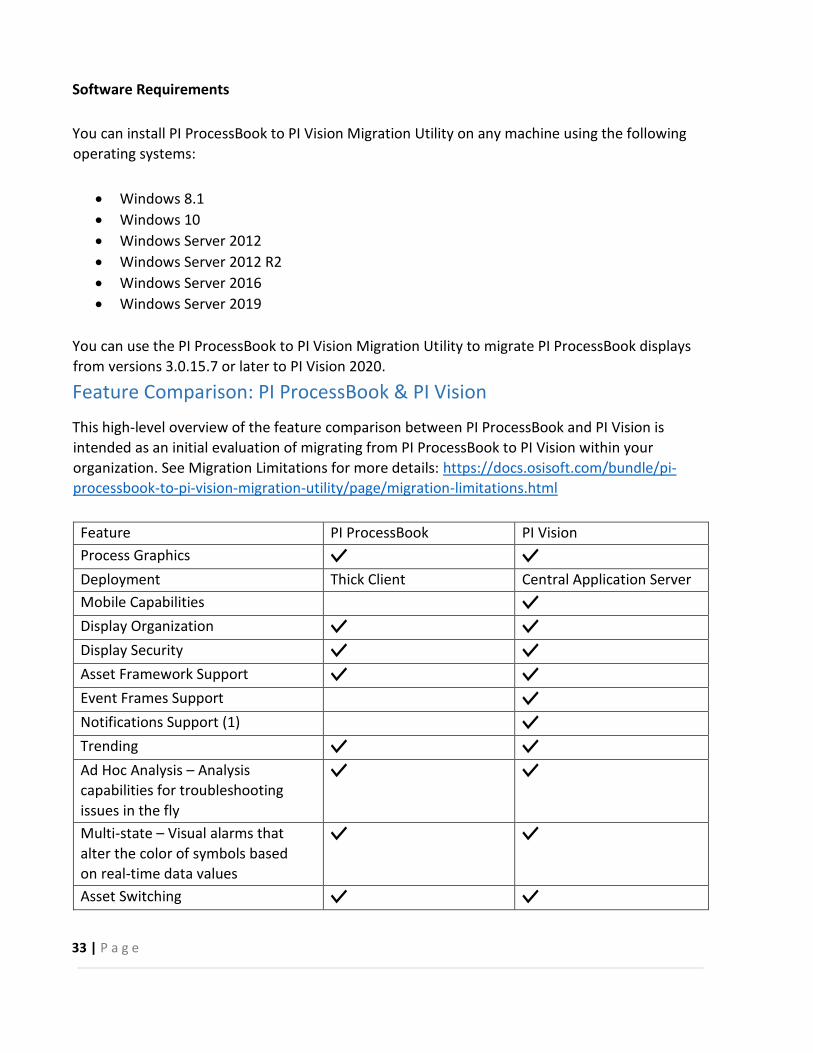
Feature Comparison: PI ProcessBook & PI Vision
This high-level overview of the feature comparison between PI ProcessBook and PI Vision is
intended as an initial evaluation of migrating from PI ProcessBook to PI Vision within your
organization. See Migration Limitations for more details: https://docs.osisoft.com/bundle/pi-
processbook-to-pi-vision-migration-utility/page/migration-limitations.html
Feature PI ProcessBook PI Vision
Process Graphics Deployment Thick Client Central Application Server
Mobile Capabilities Display Organization Display Security Asset Framework Support Event Frames Support Notifications Support (1) Trending Ad Hoc Analysis – Analysis
capabilities for troubleshooting
issues in the fly
Multi-state – Visual alarms that
alter the color of symbols based
on real-time data values
Asset Switching
34 | P a g e
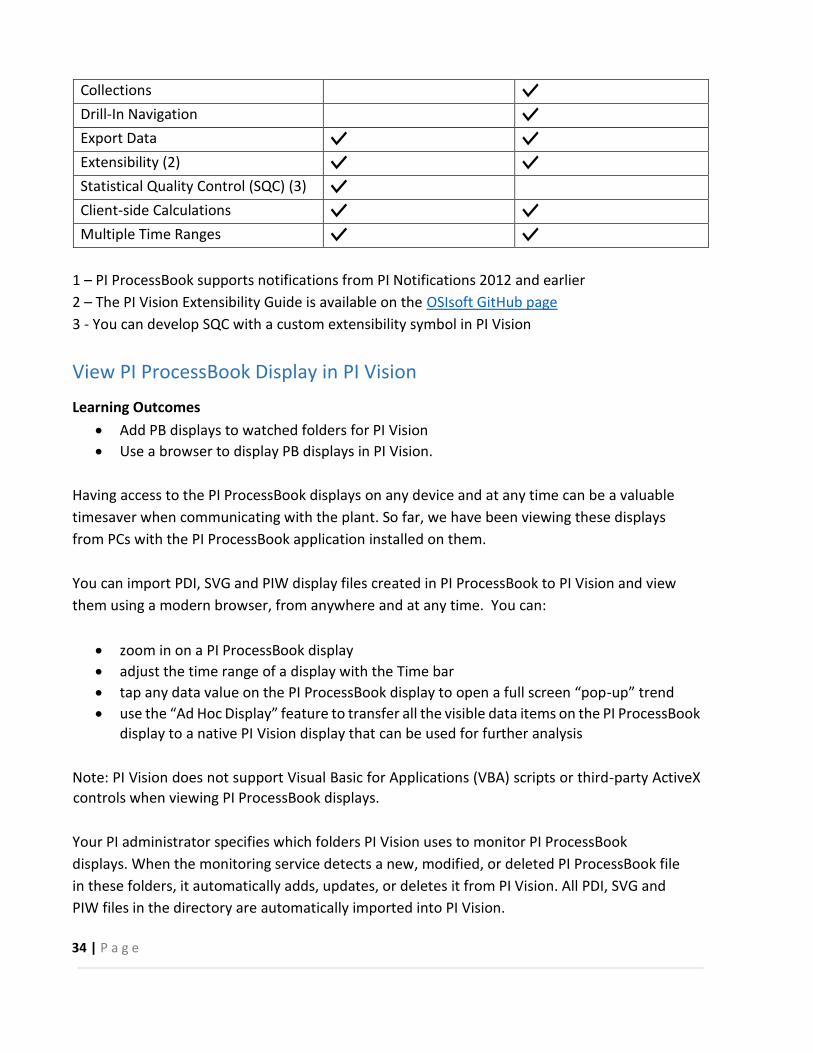
Collections Drill-In Navigation Export Data Extensibility (2) Statistical Quality Control (SQC) (3)
Client-side Calculations Multiple Time Ranges
1 – PI ProcessBook supports notifications from PI Notifications 2012 and earlier
2 – The PI Vision Extensibility Guide is available on the OSIsoft GitHub page
3 - You can develop SQC with a custom extensibility symbol in PI Vision
View PI ProcessBook Display in PI Vision
Learning Outcomes
• Add PB displays to watched folders for PI Vision
• Use a browser to display PB displays in PI Vision.
Having access to the PI ProcessBook displays on any device and at any time can be a valuable
timesaver when communicating with the plant. So far, we have been viewing these displays
from PCs with the PI ProcessBook application installed on them.
You can import PDI, SVG and PIW display files created in PI ProcessBook to PI Vision and view
them using a modern browser, from anywhere and at any time. You can:
• zoom in on a PI ProcessBook display
• adjust the time range of a display with the Time bar
• tap any data value on the PI ProcessBook display to open a full screen “pop-up” trend
• use the “Ad Hoc Display” feature to transfer all the visible data items on the PI ProcessBook display to a native PI Vision display that can be used for further analysis
Note: PI Vision does not support Visual Basic for Applications (VBA) scripts or third-party ActiveX
controls when viewing PI ProcessBook displays.
Your PI administrator specifies which folders PI Vision uses to monitor PI ProcessBook
displays. When the monitoring service detects a new, modified, or deleted PI ProcessBook file
in these folders, it automatically adds, updates, or deletes it from PI Vision. All PDI, SVG and
PIW files in the directory are automatically imported into PI Vision.
35 | P a g e
Directed Activity –View PI ProcessBook displays on Your Desktop Web Browser
Objectives
• View a PI ProcessBook display in PI Vision
Activity Description
A set of tablets were recently purchased for your process engineers. They find the <your
initials>_ElementRelativeTankDisplay display you built for them extremely helpful, so you want
to make this display accessible from their tablets (which do not have PI ProcessBook).
Approach
Step 1: Make a copy of your Element Relative Tank Display and name it <your
initials>_ElementRelativeTankDisplay_<your initials>.PDI file and move it to the PI
Vision shared folder.
Step 2: Check the PI Vision Homepage, under the ProcessBook Displays for PI Vision
folder. Make sure you see your PI ProcessBook display.
Step 3: Open this display and examine the historical data for the Internal and External
Temperature of Mixing Tank1. Click on the trend to maximize it.
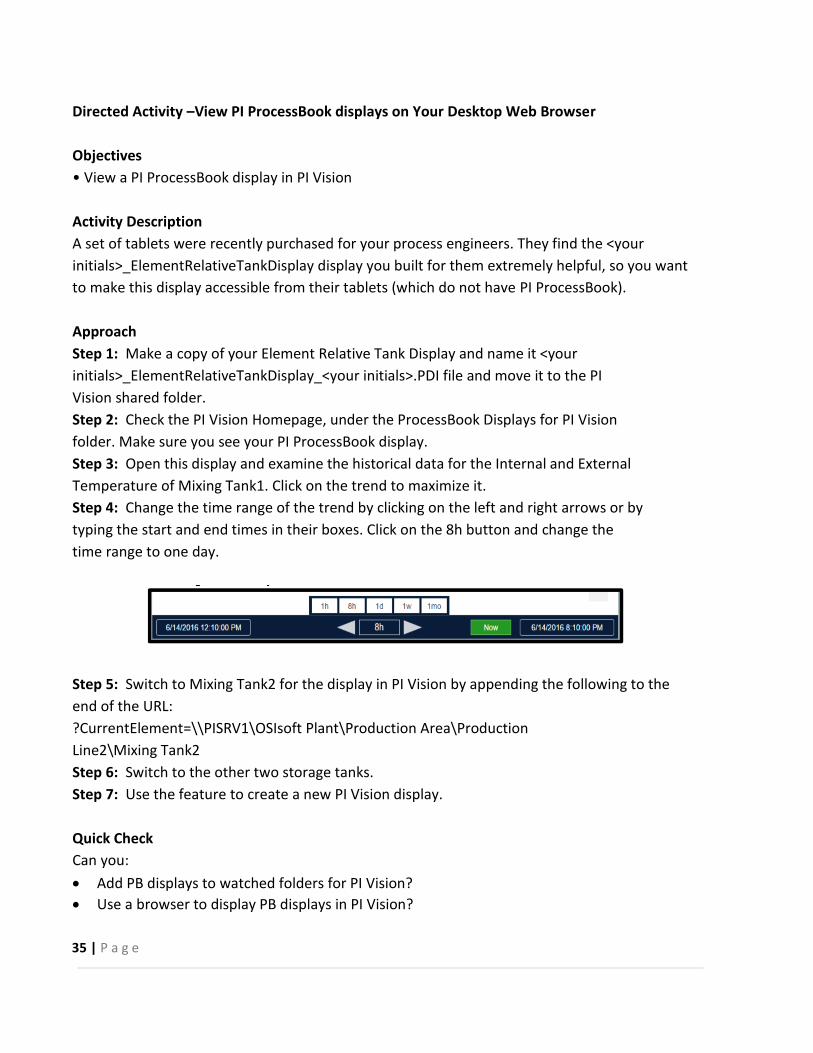
Step 4: Change the time range of the trend by clicking on the left and right arrows or by
typing the start and end times in their boxes. Click on the 8h button and change the
time range to one day.
Step 5: Switch to Mixing Tank2 for the display in PI Vision by appending the following to the
end of the URL:
?CurrentElement=\\PISRV1\OSIsoft Plant\Production Area\Production
Line2\Mixing Tank2
Step 6: Switch to the other two storage tanks.
Step 7: Use the feature to create a new PI Vision display.
Quick Check
Can you:
• Add PB displays to watched folders for PI Vision?
• Use a browser to display PB displays in PI Vision?
36 | P a g e
Scenario: Flynn River Hydro
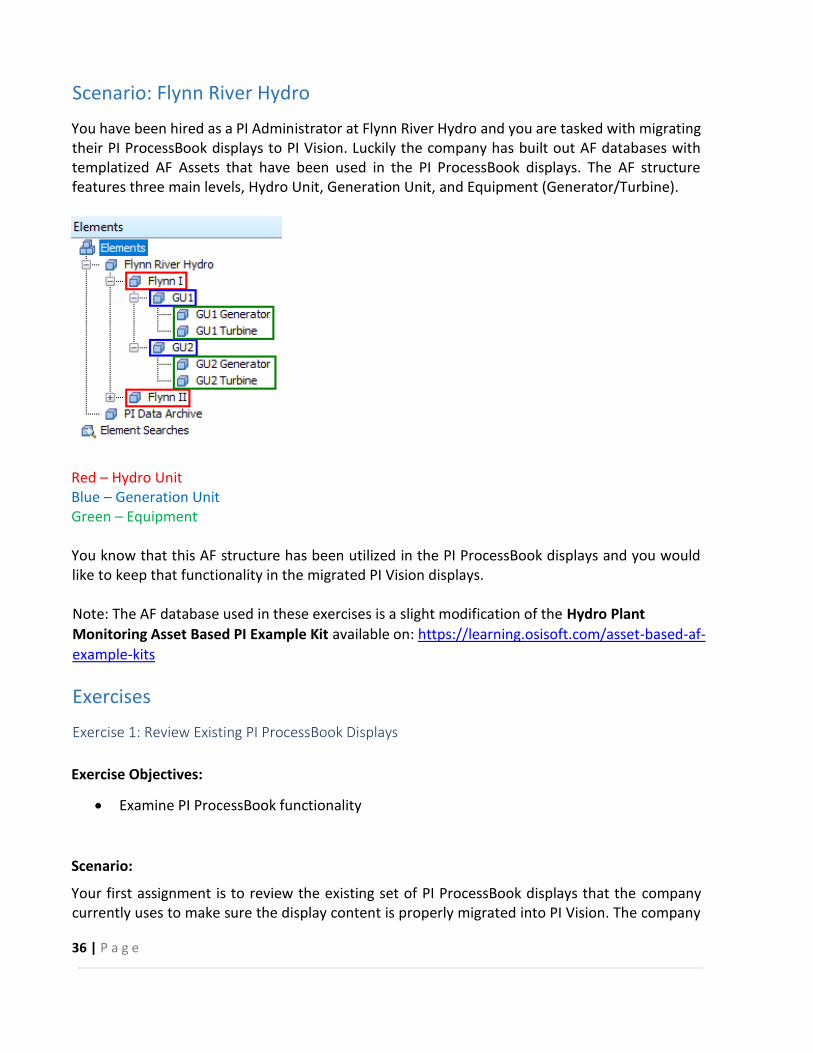
You have been hired as a PI Administrator at Flynn River Hydro and you are tasked with migrating their PI ProcessBook displays to PI Vision. Luckily the company has built out AF databases with templatized AF Assets that have been used in the PI ProcessBook displays. The AF structure features three main levels, Hydro Unit, Generation Unit, and Equipment (Generator/Turbine).
Red – Hydro Unit Blue – Generation Unit Green – Equipment You know that this AF structure has been utilized in the PI ProcessBook displays and you would like to keep that functionality in the migrated PI Vision displays. Note: The AF database used in these exercises is a slight modification of the Hydro Plant
Monitoring Asset Based PI Example Kit available on: https://learning.osisoft.com/asset-based-af-
example-kits
Exercises
Exercise 1: Review Existing PI ProcessBook Displays
Exercise Objectives:
• Examine PI ProcessBook functionality
Scenario:
Your first assignment is to review the existing set of PI ProcessBook displays that the company currently uses to make sure the display content is properly migrated into PI Vision. The company
37 | P a g e
has a set of displays which are used to monitor Flynn River Hydro plant and equipment, located in C:\ProcessBook\Flynn. The company also has a display which IT uses to monitor the health of the PI Data Archive, located in C:\ProcessBook\IT.
Part 1: PI Data Archive Monitoring Display
Approach:
8. Open the PI_Data_Archive_Monitoring.pdi display located in C:\ProcessBook\IT
9. Select Visual Basic Editor and double click on This Display under the
C:\ProcessBook\IT\ PI_Data_Archive_Monitoring.pdi VBAProject to open the VBA code.
What does this code do?
10. Close the Visual Basic Editor and use the PI_Data_Archive_Monitoring.pdi display to
answer the following questions
Questions:
1. How many Unflushed Events are currently in the write cache?
2. What is the Point Count in the Base Subsystem?
3. What is the approximate peak of the PI Server CPU over the last 20 minutes?
Hint: double-click the PI Server CPU trend to maximize it
Part 2: Flynn River Hydro Displays
Approach:
1. Open the PG_Flynn_Home.pdi display located in C:\ProcessBook\Flynn
2. Use the navigation buttons to open the other Flynn PI ProcessBook displays
3. Use the Flynn River Hydro displays to answer the following questions
Questions:
1. What is the current Penstock Flow at plant Flynn II?
38 | P a g e
2. Which Generation Unit currently has the highest Power Generated?
3. Which Generator currently has the lowest Oil Level?
4. What is the approximate peak Water pH Intake at GU3 Turbine in the last 8 hours?
Approximately when did this peak occur?
Hint: hover over the value to see the summary statistics
Exercise 2: Analyze and Migrate PI ProcessBook Displays
Exercise Objectives:
• Use the PI ProcessBook to PI Vision Migration Utility to migrate PI ProcessBook displays to
PI Vision
• Understand the configuration and reporting options available in the Migration Utility
Scenario:
Now that you have reviewed the PI ProcessBook displays that the client uses, you are ready to
use the PI ProcessBook to PI Vision Migration Utility to convert these displays to native PI Vision
displays. You would like to preserve the folder and navigation structure of the existing displays.
Note: The PI ProcessBook to PI Vision Migration Utility User Guide is available on Live Library and
as a bookmark in Chrome:
https://livelibrary.osisoft.com/LiveLibrary/web/ui.xql?action=html&resource=publist_home.html
&pub_category=PI-ProcessBook-to-PI-Vision-Migration-Utility
Approach:
Part 1: Analyze the PI ProcessBook Displays
1. Open the PI ProcessBook to PI Vision Migration Utility
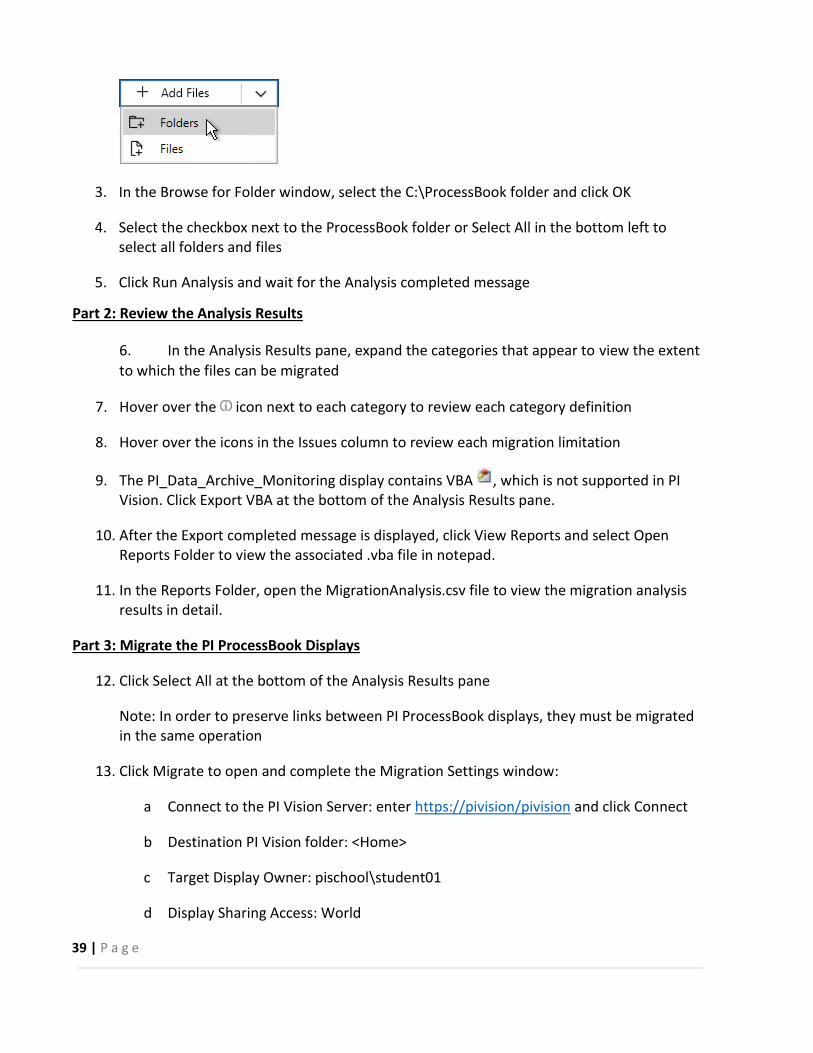
2. Click Add Files and select Folders:
39 | P a g e
3. In the Browse for Folder window, select the C:\ProcessBook folder and click OK
4. Select the checkbox next to the ProcessBook folder or Select All in the bottom left to select all folders and files
5. Click Run Analysis and wait for the Analysis completed message
Part 2: Review the Analysis Results
6. In the Analysis Results pane, expand the categories that appear to view the extent
to which the files can be migrated
7. Hover over the icon next to each category to review each category definition
8. Hover over the icons in the Issues column to review each migration limitation
9. The PI_Data_Archive_Monitoring display contains VBA , which is not supported in PI Vision. Click Export VBA at the bottom of the Analysis Results pane.
10. After the Export completed message is displayed, click View Reports and select Open Reports Folder to view the associated .vba file in notepad.
11. In the Reports Folder, open the MigrationAnalysis.csv file to view the migration analysis results in detail.
Part 3: Migrate the PI ProcessBook Displays
12. Click Select All at the bottom of the Analysis Results pane
Note: In order to preserve links between PI ProcessBook displays, they must be migrated in the same operation
13. Click Migrate to open and complete the Migration Settings window:
a Connect to the PI Vision Server: enter https://pivision/pivision and click Connect
b Destination PI Vision folder: <Home>
c Target Display Owner: pischool\student01
d Display Sharing Access: World
40 | P a g e
e Select Persist folder structure from migrated items
14. Click OK and wait for the Migration completed message
15. Click View Reports and select Migration Report to view the migration results in detail
Exercise 3: Review Migrated PI Vision Displays
Exercise Objectives:
• Examine PI Vision functionality
• Validate migration configuration options in PI Vision
Scenario:
Now that the PI ProcessBook displays have been migrated to PI Vision, you need to examine the
migrated PI Vision displays. The users are not very familiar with PI Vision, so you need to be able
to demonstrate how the new PI Vision displays work.
Part 1: PI Data Archive Monitoring Display
Approach:
6. Use the shortcut on the desktop to launch PI Vision using Chrome.
a Alternatively, start Chrome and navigate to https://pivision/pivision
7. Note the folder structure in the lower left panel. Did the folder structure persist from the
PI ProcessBook files? Select the IT folder within ProcessBook on the left side panel
8. Click Edit display settings in the PI_Data_Archive_Monitoring display to open the
Display Settings window. Did the migration settings apply to this display?
9. Close the Display Settings window. Click the PI_Data_Archive_Monitoring display to open
it and answer the questions below
Questions:
1. How many Unflushed Events are currently in the write cache?
2. What is the Point Count in the Base Subsystem?
41 | P a g e
3. What is the approximate peak of the PI Server CPU over the last 20 minutes?
Hint: double-click the PI Server CPU trend to maximize it
Part 2: Flynn River Hydro Displays
Approach:
1. Back in the PI Vision homepage, select the Flynn folder within ProcessBook on the left side
panel
2. Click Edit display settings in the PG_Flynn_Home display to open the Display Settings
window. Did the migration settings apply to this display?
3. Close the Display Settings window. Click the PG_Flynn_Home display to open it
4. Use the navigation buttons to open the other Flynn PI Vision displays
5. Use these Flynn displays to answer the following questions
Questions:
1. What is the current Penstock Flow at plant Flynn II?
2. Which Generation Unit currently has the highest Power Generated?
3. Which Generator currently has the lowest Oil Level?
4. What is the approximate peak Water pH Intake at GU3 Turbine in the last 8 hours?
Approximately when did this peak occur?
42 | P a g e
Exercise 4: Complete the PI Vision Displays
Exercise Objectives:
• Use AF to create analyses to add to the PI Vision display
• Use PI Vision to edit the migrated PI Vision displays
Scenario:
After examining the newly migrated PI Vision displays, you see that there is some data missing
from the original PI ProcessBook displays. Specifically, in the PG_Flynn_Plant PI Vision display,
there is some calculation data missing in the upper left corner. You know from the migration
results that there are datasets in the original PI ProcessBook display. Since you want to be able to
use these calculations in other client tools, you will create AF analyses for these calculations. You
also need to update the banner of the PI_Data_Archive_Monitoring display as it utilizes VBA.
Since the timebar in PI Vision shows us the time range of the display, you will replace this header
with a static header.
Approach:
Part 1: Update the PG_Flynn_Plant display using AF analysis
1. Open PI System Explorer and select the PG_HydroPlant database
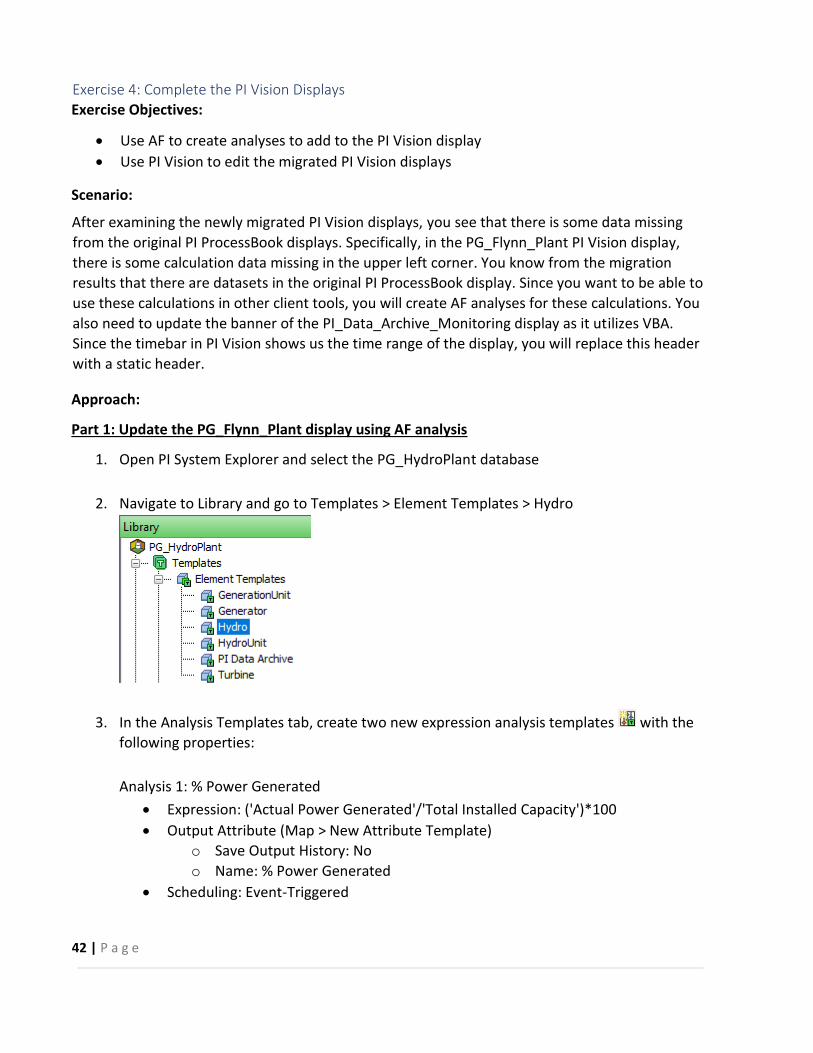
2. Navigate to Library and go to Templates > Element Templates > Hydro
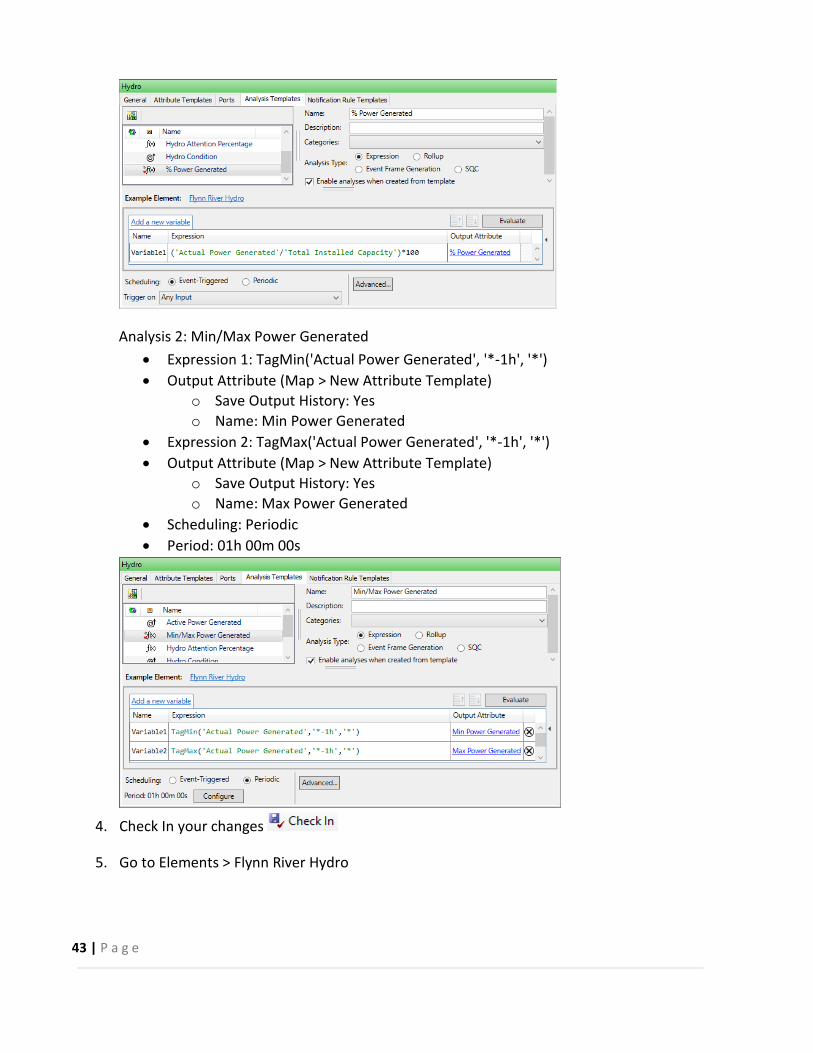
3. In the Analysis Templates tab, create two new expression analysis templates with the
following properties:
Analysis 1: % Power Generated
• Expression: ('Actual Power Generated'/'Total Installed Capacity')*100
• Output Attribute (Map > New Attribute Template)
o Save Output History: No
o Name: % Power Generated
• Scheduling: Event-Triggered
43 | P a g e
Analysis 2: Min/Max Power Generated
• Expression 1: TagMin('Actual Power Generated', '*-1h', '*')
• Output Attribute (Map > New Attribute Template)
o Save Output History: Yes
o Name: Min Power Generated
• Expression 2: TagMax('Actual Power Generated', '*-1h', '*')
• Output Attribute (Map > New Attribute Template)
o Save Output History: Yes
o Name: Max Power Generated
• Scheduling: Periodic
• Period: 01h 00m 00s
4. Check In your changes
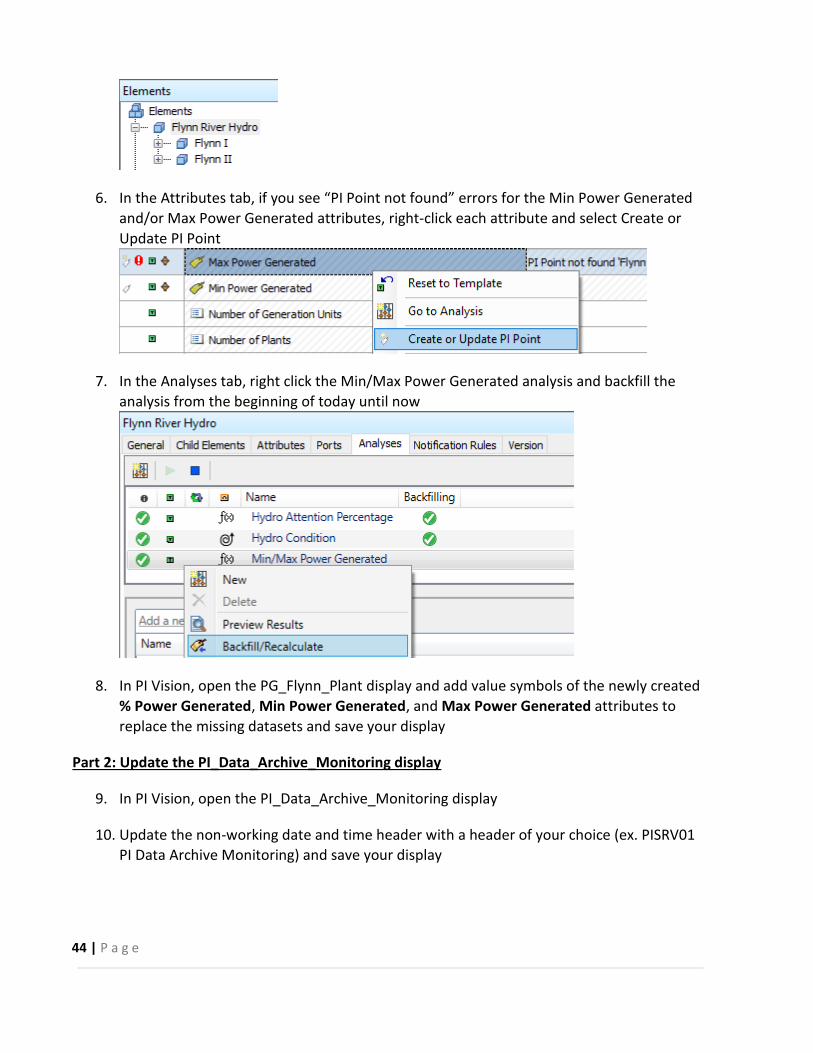
5. Go to Elements > Flynn River Hydro
44 | P a g e
6. In the Attributes tab, if you see “PI Point not found” errors for the Min Power Generated
and/or Max Power Generated attributes, right-click each attribute and select Create or
Update PI Point
7. In the Analyses tab, right click the Min/Max Power Generated analysis and backfill the
analysis from the beginning of today until now
8. In PI Vision, open the PG_Flynn_Plant display and add value symbols of the newly created
% Power Generated, Min Power Generated, and Max Power Generated attributes to
replace the missing datasets and save your display
Part 2: Update the PI_Data_Archive_Monitoring display
9. In PI Vision, open the PI_Data_Archive_Monitoring display
10. Update the non-working date and time header with a header of your choice (ex. PISRV01
PI Data Archive Monitoring) and save your display
45 | P a g e
Bonus: Edit the remaining PI Vision displays
As a bonus exercise, edit the other migrated PI Vision displays to better format the displays in PI
Vision. Some suggestions are below, but feel free to make any other adjustments! Be sure to
save the displays when finished.
PG_Flynn_Home
• Adjust the 4 links and 3 arrows to be evenly spaced by selecting the symbols and going to
Arrange > Align Middle
PG_Flynn_Plant
• Add the Generating Capacity attribute for the displayed Flynn I or Flynn II plant to the
display as a Value symbol under the trend
• Format the boxes surrounding Flynn River Hydro Power and Features to have different
Border colors
• Adjust the Penstock Opening and Penstock Flow value and text symbols so they are not
overlapping
PG_Flynn_GenerationUnit
• Increase the Font Size of the Generator Analysis and Turbine Analysis text symbols to 24
• Add the Generation Unit Number of Attention Systems attribute for the displayed
generation unit to the display as a Value symbol
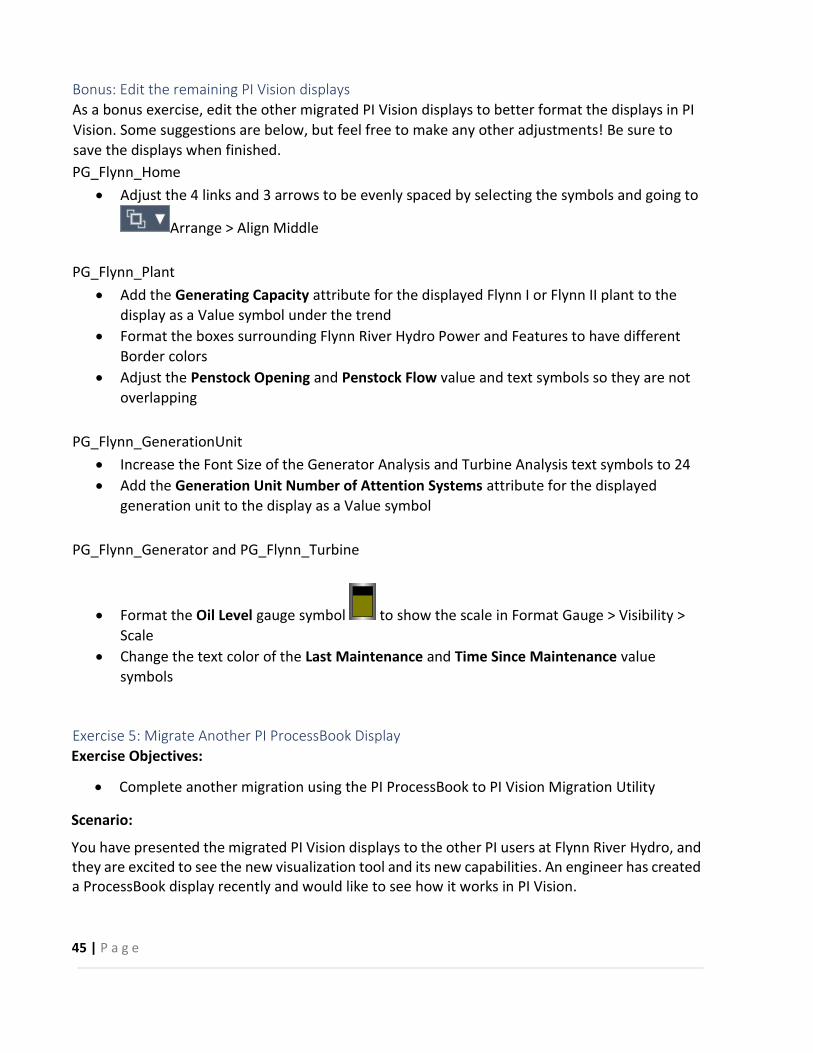
PG_Flynn_Generator and PG_Flynn_Turbine
• Format the Oil Level gauge symbol to show the scale in Format Gauge > Visibility >
Scale
• Change the text color of the Last Maintenance and Time Since Maintenance value
symbols
Exercise 5: Migrate Another PI ProcessBook Display
Exercise Objectives:
• Complete another migration using the PI ProcessBook to PI Vision Migration Utility
Scenario:
You have presented the migrated PI Vision displays to the other PI users at Flynn River Hydro, and they are excited to see the new visualization tool and its new capabilities. An engineer has created a ProcessBook display recently and would like to see how it works in PI Vision.
46 | P a g e
Approach:
1. Open the PowerGeneration.pdi file located on the Desktop. Examine this display in PI
ProcessBook
2. Use the PI ProcessBook to PI Vision Migration Utility to analyze and migrate the display.
This display should be located in the Flynn folder in PI Vision.
3. Review the migrated PowerGeneration display in PI Vision and verify the migration
settings and symbols have been preserved
4. Make any adjustments to the display in PI Vision, some suggestions are as follows:
o Edit the background and font colors of the display to match the other Flynn
displays
o Increase the font size of the Flynn I, Flynn II, and Total text and value symbols
o Add a Home text symbol to the display. Add a navigation link to this symbol to link
to the PG_Flynn_Home display
47 | P a g e
PI Vision Security
By default, any new display you create in PI Vision is private. Meaning that only you can view and
edit it. You can however share it with other users and even grant them access to edit and save
new versions. Let’s see how PI Vision 2020 streamlines the process of granting users read and
write access to displays.
Share Displays and Edit Access
The Display Settings window allows you to control a display's visibility and ownership. To access
the Display Settings window, browse to the Home page and click Edit display settings on the
display thumbnail that you want to edit. The options available on the Display Settings window
depend on your PI Vision user role.
Administrators have access to all Display Settings. Display Owners may only access some options.
The Keywords setting allows you to provide keywords separated by semi-colons. This makes it
easier for someone to search and find this display. Checking the Read-only box disables saving any
changes to the display by any user, including yourself. You must save the display under a different
name to make changes. If you are an administrator, you can change the owner for the selected
display. The display owner can make changes and save new versions of the original display. You
can remove displays by clicking on the delete button. You cannot undo this action so make sure
you are certain before you proceed.
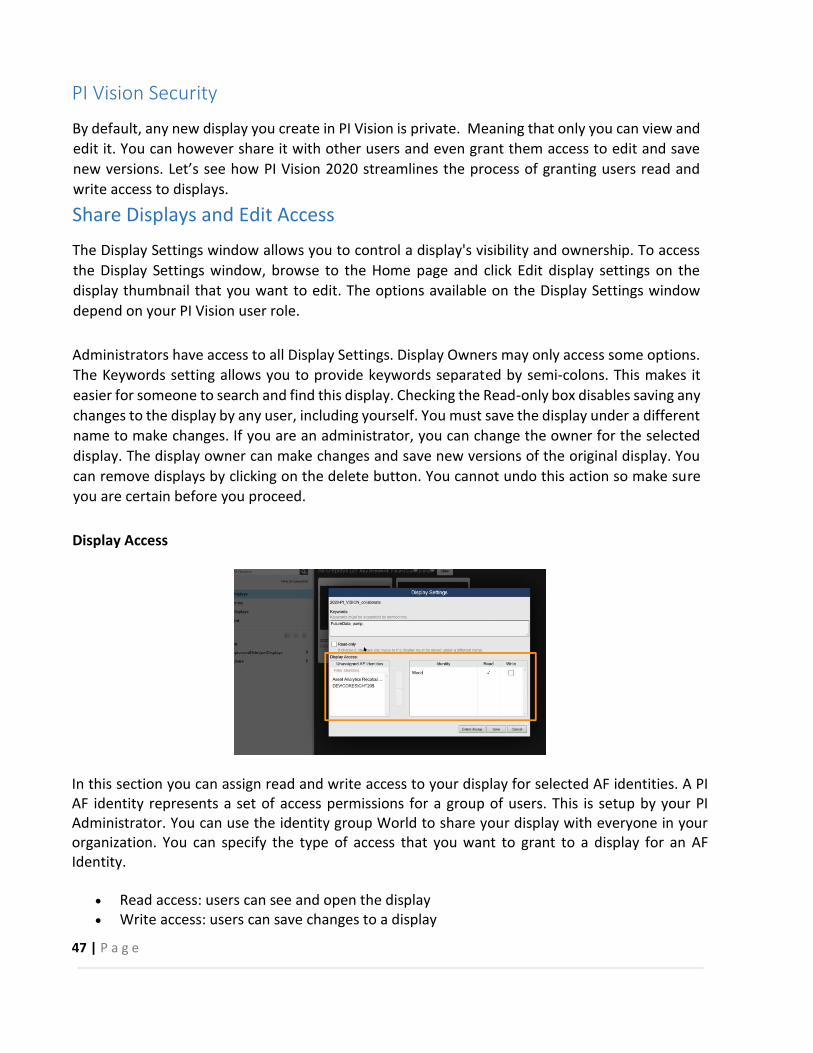
Display Access
In this section you can assign read and write access to your display for selected AF identities. A PI AF identity represents a set of access permissions for a group of users. This is setup by your PI Administrator. You can use the identity group World to share your display with everyone in your organization. You can specify the type of access that you want to grant to a display for an AF Identity.
• Read access: users can see and open the display • Write access: users can save changes to a display
48 | P a g e
Read access is granted by default to any AF identity added. To grant Write access you must check the appropriate box. Click an identity under Unassigned AF Identities and then click Add Permissions to grant that AF Identity access to the display.
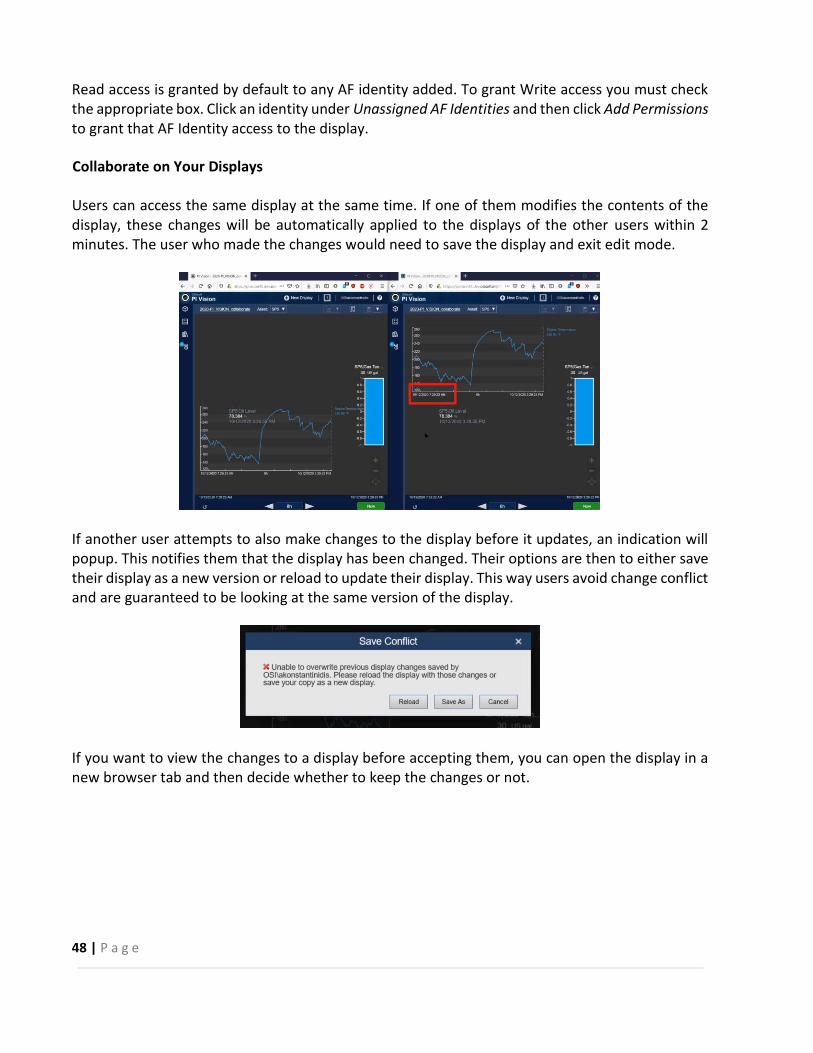
Collaborate on Your Displays
Users can access the same display at the same time. If one of them modifies the contents of the display, these changes will be automatically applied to the displays of the other users within 2 minutes. The user who made the changes would need to save the display and exit edit mode.
If another user attempts to also make changes to the display before it updates, an indication will popup. This notifies them that the display has been changed. Their options are then to either save their display as a new version or reload to update their display. This way users avoid change conflict and are guaranteed to be looking at the same version of the display.
If you want to view the changes to a display before accepting them, you can open the display in a new browser tab and then decide whether to keep the changes or not.
49 | P a g e
Manage PI Vision Displays
Manage Role-Based User Access Level
Your PI Vision Administrator can give users different level of access by assigning and managing
user roles on the PI Vision Administration website. PI Vision provides two access roles based on PI
AF identities:
• Publisher: users have full access to the application and can save displays.
• Explorer: users have access to the application but cannot save or share displays. An Explorer
can still export data from a display.
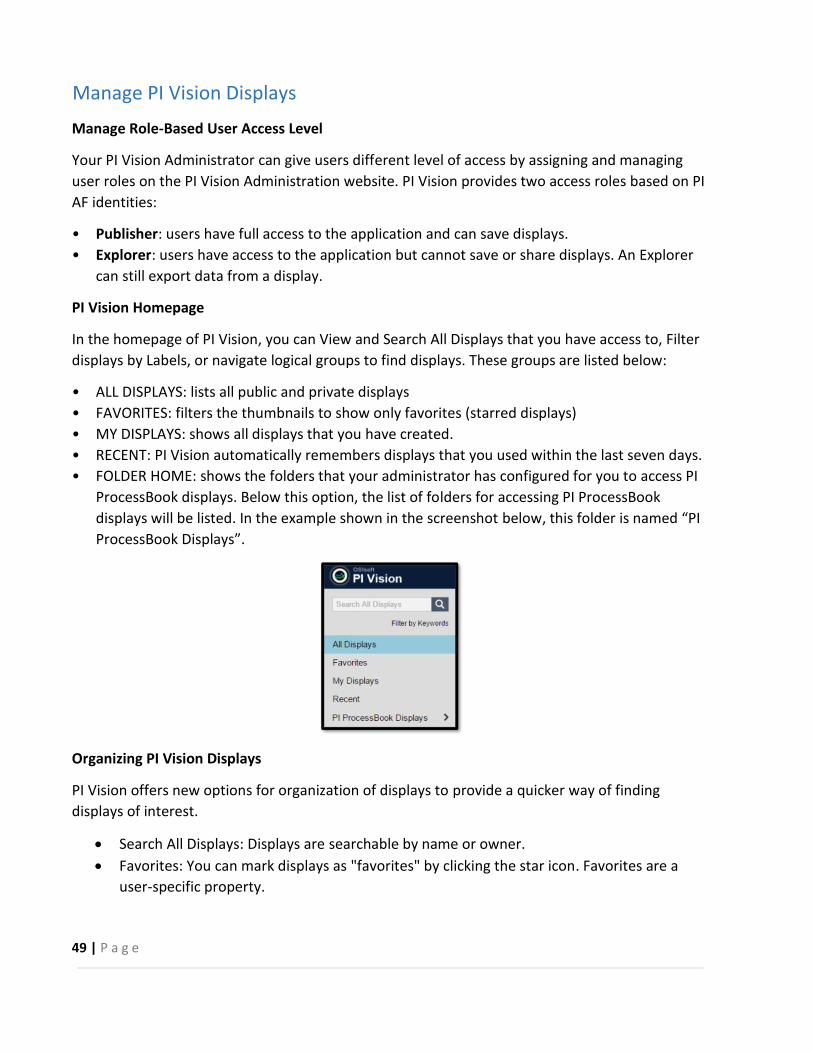
PI Vision Homepage
In the homepage of PI Vision, you can View and Search All Displays that you have access to, Filter
displays by Labels, or navigate logical groups to find displays. These groups are listed below:
• ALL DISPLAYS: lists all public and private displays
• FAVORITES: filters the thumbnails to show only favorites (starred displays)
• MY DISPLAYS: shows all displays that you have created.
• RECENT: PI Vision automatically remembers displays that you used within the last seven days.
• FOLDER HOME: shows the folders that your administrator has configured for you to access PI
ProcessBook displays. Below this option, the list of folders for accessing PI ProcessBook
displays will be listed. In the example shown in the screenshot below, this folder is named “PI
ProcessBook Displays”.
Organizing PI Vision Displays
PI Vision offers new options for organization of displays to provide a quicker way of finding
displays of interest.
• Search All Displays: Displays are searchable by name or owner.
• Favorites: You can mark displays as "favorites" by clicking the star icon. Favorites are a
user-specific property.
50 | P a g e
• Keywords: You can apply keywords to displays to categorize them. The keywords can be
viewed in a keyword cloud by selecting "Filter by Keywords." Within the keyword cloud,
the keywords are sorted alphabetically, and their size is determined by their relative
frequency. Keywords applied by one user are visible to the rest of the users.
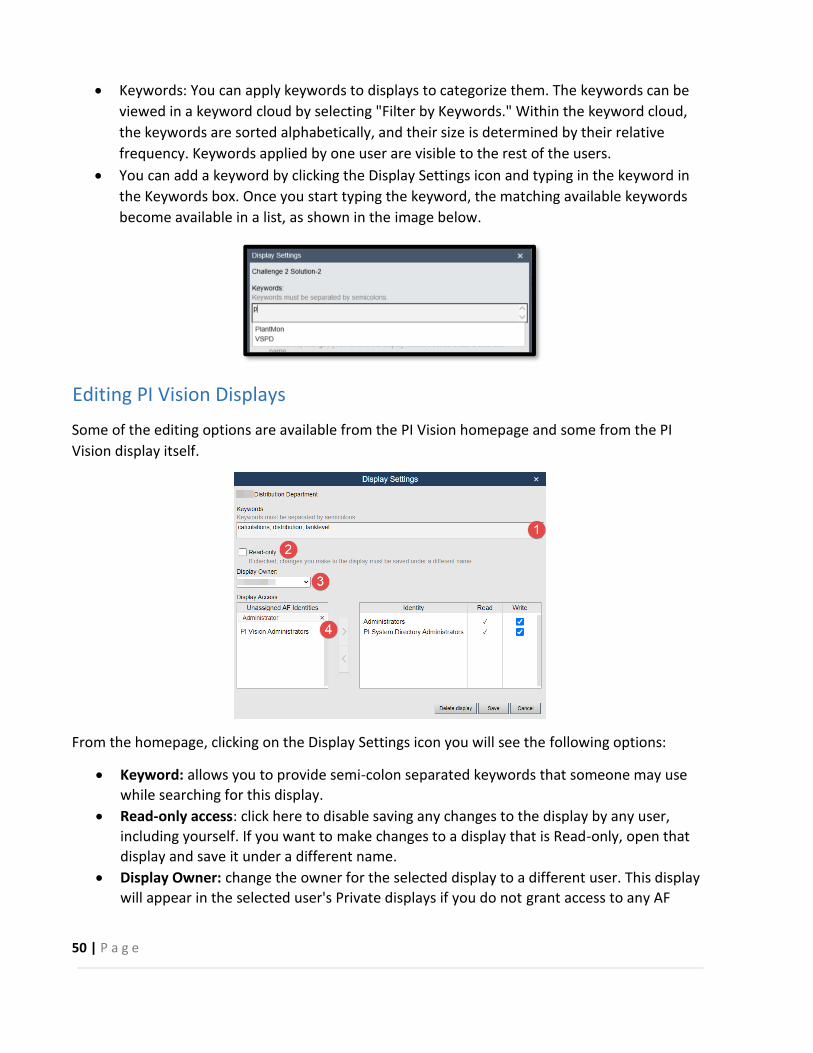
• You can add a keyword by clicking the Display Settings icon and typing in the keyword in
the Keywords box. Once you start typing the keyword, the matching available keywords
become available in a list, as shown in the image below.
Editing PI Vision Displays
Some of the editing options are available from the PI Vision homepage and some from the PI
Vision display itself.
From the homepage, clicking on the Display Settings icon you will see the following options:
• Keyword: allows you to provide semi-colon separated keywords that someone may use
while searching for this display.
• Read-only access: click here to disable saving any changes to the display by any user,
including yourself. If you want to make changes to a display that is Read-only, open that
display and save it under a different name.
• Display Owner: change the owner for the selected display to a different user. This display
will appear in the selected user's Private displays if you do not grant access to any AF
51 | P a g e
Identities when you click Save. You can make anyone else in your organization the owner
of any display. (Only visible to the Administrators).
• Delete Display: If you no longer need a display and want to remove it, click Delete
display. Make sure you are certain before you delete a display. You cannot undo this
action.
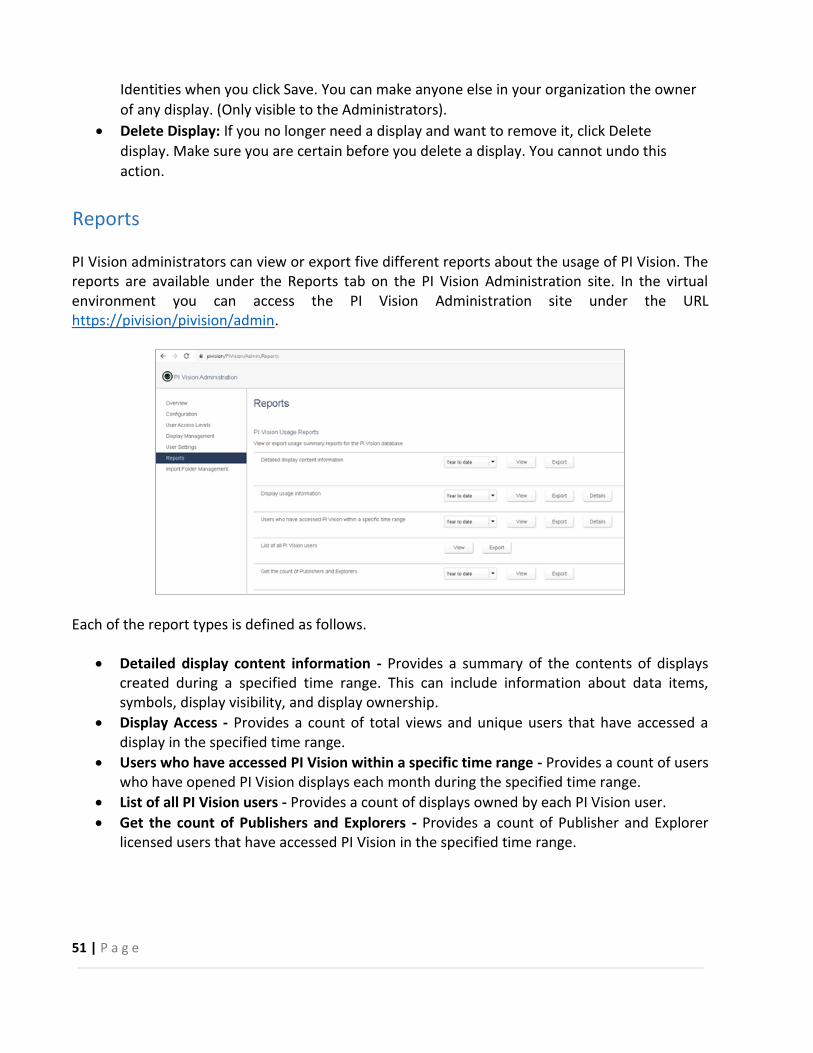
Reports
PI Vision administrators can view or export five different reports about the usage of PI Vision. The reports are available under the Reports tab on the PI Vision Administration site. In the virtual environment you can access the PI Vision Administration site under the URL https://pivision/pivision/admin.
Each of the report types is defined as follows.
• Detailed display content information - Provides a summary of the contents of displays created during a specified time range. This can include information about data items, symbols, display visibility, and display ownership.
• Display Access - Provides a count of total views and unique users that have accessed a display in the specified time range.
• Users who have accessed PI Vision within a specific time range - Provides a count of users who have opened PI Vision displays each month during the specified time range.
• List of all PI Vision users - Provides a count of displays owned by each PI Vision user.
• Get the count of Publishers and Explorers - Provides a count of Publisher and Explorer licensed users that have accessed PI Vision in the specified time range.

© Copyright 2021
OSIsoft, LLC
Recommended