Physical Properties
Discharge rate, temperature and other physical attributes of the stream.

Physical Properties of Streams:
Water Temperature Stream flow Turbidity Total Dissolved Solids:
Dissolved SolidsUndissolved Solids
Found at: ucc.ie

Stream Flow/Stream Discharge:
Amount of water flowing in a stream, river, or other flowing body of water
Key concept of a stream and its flow is its watershed
Stream flow is always changingmain influence precipitationsize of a river = size of its watershed

Effects of Stream Flow on a Ecosystem: Sufficient flow must be present to maintain
downstream ecosystems Changes to the natural flow regime affect stream
communities, species interactions, and ecosystem functioning
Flow can affect: abundance, distribution, and behavior of stream
organisms key ecological processes such as dispersal, habitat
use, resource acquisition, and competition
Found on US EPA’s National Center for Environmental Research Website
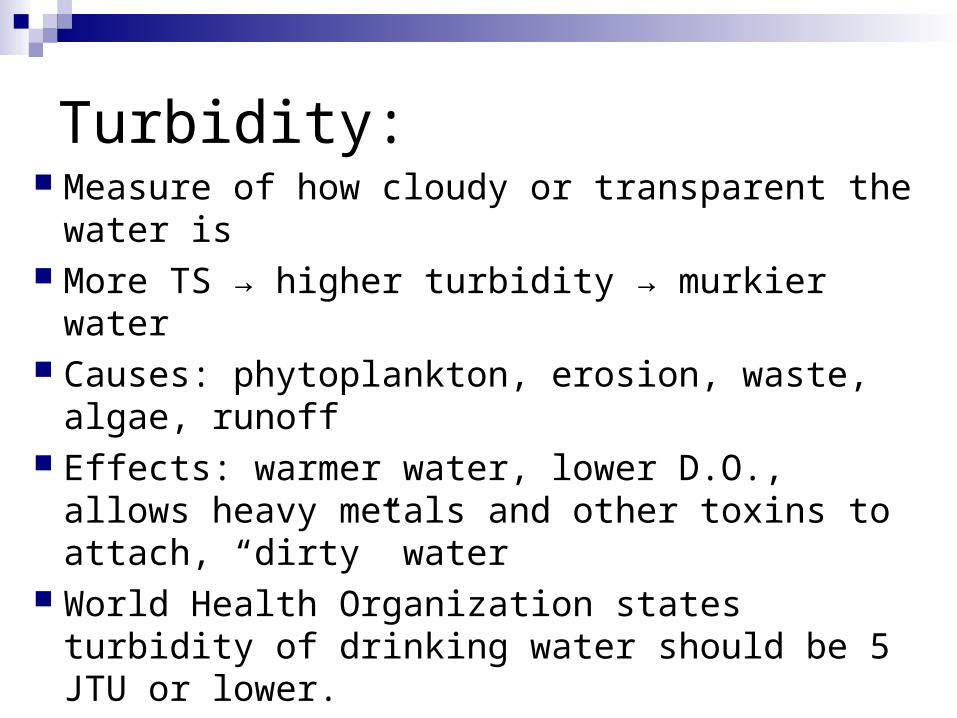
Turbidity: Measure of how cloudy or transparent the
water is More TS → higher turbidity → murkier water Causes: phytoplankton, erosion, waste,
algae, runoff Effects: warmer water, lower D.O., allows
heavy metals and other toxins to attach, “dirty” water
World Health Organization states turbidity of drinking water should be 5 JTU or lower.
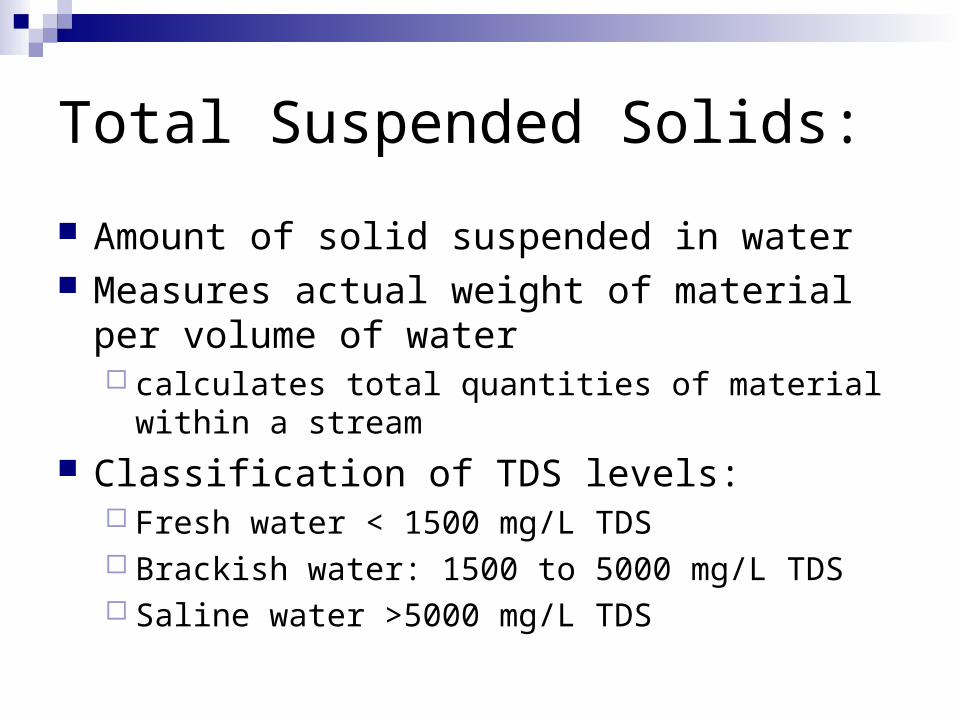
Total Suspended Solids:
Amount of solid suspended in water Measures actual weight of material per volume
of water calculates total quantities of material within a stream
Classification of TDS levels: Fresh water < 1500 mg/L TDS Brackish water: 1500 to 5000 mg/L TDS Saline water >5000 mg/L TDS

TDS Levels:High TDS caused by:
erosive heavy rains and fast-moving water soils and geology determine how much erosion
occurs can be affected slightly by changes in algae
populations and other microscopic life High levels can:
cause increased sedimentation and siltation in a stream
ruin important habitat areas for aquatic life Dissolved particles also provide attachment
places for other pollutants High TDS or turbidity readings can be used as
"indicators" of other potential pollutants

Possible Effects on TDS & Turbidity: Greatest Factor: Land Use
As watersheds develop, there is an increase in disturbed areas (e.g., cropland or construction sites), a decrease in vegetation, and increases in the rate of runoff.
These all cause increases in erosion, particulate matter, and nutrients, promote algal growth, and increase TDS and turbidity of water.

Physical Properties of the Leibert Creek:
Water Temp: 13.5°C
Turbidity: 0 JTU Total Dissolved
Solids: 195 ppm (mg/L); clear water!
Stream Discharge: 6.8176 cu ft/s 50.7229 gal/s 182,603 gal/hr 4,382,462 gal/day
Found at: dcnr.state.pa.us

Water Flow of the Leibert Creek Date: 10/28/10
Total Width of Stream: 13.5 ft
Section: Depth: Width: Area: Velocity: Flow:
1 1.25 ft 2.67 ft 3.34 sq ft .2 ft/s .6675 cu ft/s
2 1.04 ft 2.67 ft 2.78 sq ft .46 ft/s 1.2773 cu ft/s
3 1.38 ft 2.67 ft 3.68 sq ft .73 ft/s 2.6898 cu ft/s
4 1.46 ft 2.67 ft 3.90 sq ft .56 ft/s 2.1830 cu ft/s
5 1.42 ft 2.67 ft 3.79 sq ft 0 ft/s 0 cu ft/s
Total Flow: 6.8176 cu ft/s
Total Flow (gal/s): (6.8176 cu ft/s) (7.44 gal/ cu ft) 50.722944 gal/s
Total Flow (gal/hr): (50.7229 gal/s) (3600 s/hr) 182602.44 gal/hr
Total Flow (gal/day): (182,602.44 gal/hr) (24 hr/day) 4382458.56 gal/day
Leibert Creek Results:
The flow of the Leibert was as to be expected; no bad effects on the stream and its ecosystem. Examples of the calculations used to find stream flow
can be found on the handout given to you. There was no turbidity in the stream, showing
that the stream water is clear and unpolluted. There was a relatively low TDS level in the
Leibert, showing that there was only a normal amount of pollution in the stream, as can be caused naturally.
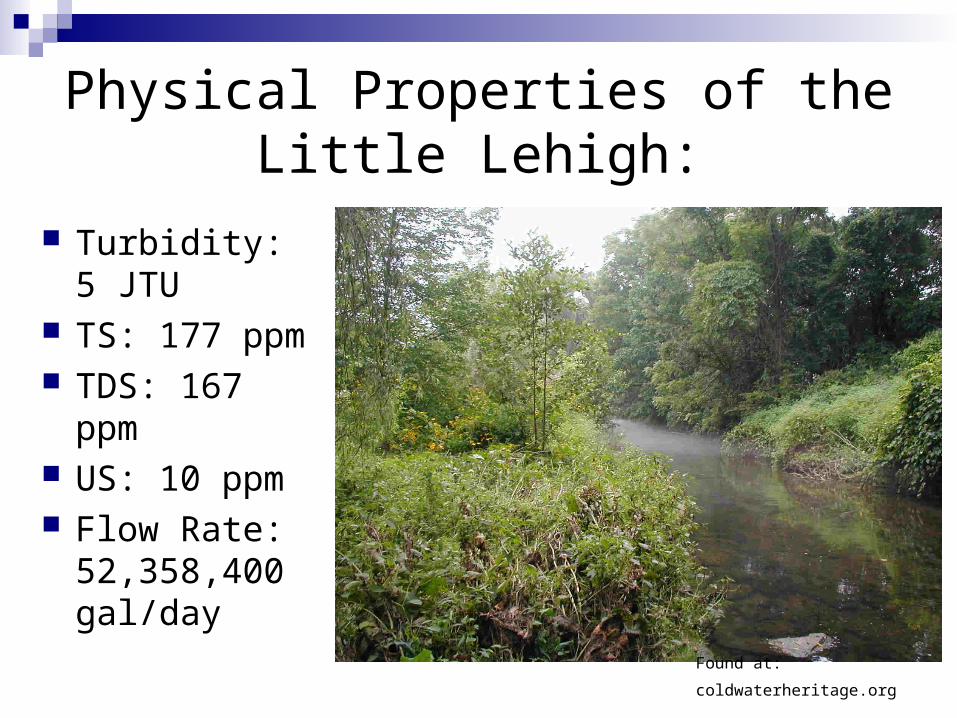
Physical Properties of the Little Lehigh:
Turbidity: 5 JTU
TS: 177 ppm TDS: 167 ppm US: 10 ppm Flow Rate:
52,358,400 gal/day
Found at: coldwaterheritage.org

Total Solids:
Empty Beaker Volume WaterBeaker + Dry Solids Total Solids
93.7613 g 250 mL 93.8146 g .0533 g
97.8944 g 250 mL 97.9403 g .0459 g
107.4720 g 250 mL 107.5195 g .0475 g
102.3277 g 220 mL 102.3751 g .0474 g
151.8621 g 350 mL 151.9400 g .0779 g
141.6998 g 350 mL 141.7712 g .0714 g
152.9136 g 350 mL 152.9832 g .0696 g
138.6401 g 350 mL 138.7037 g .0636 g
Total Volume:2690 mL or 2.69 L Total Solids:
.4766 g or 476.6 mg
Total Solid (mg/L): (476.6)/(2.69) 177 mg/L
Total Dissolved Solid: 167 mg/L
Total Undissolved Solid: 177-167 10 mg/L
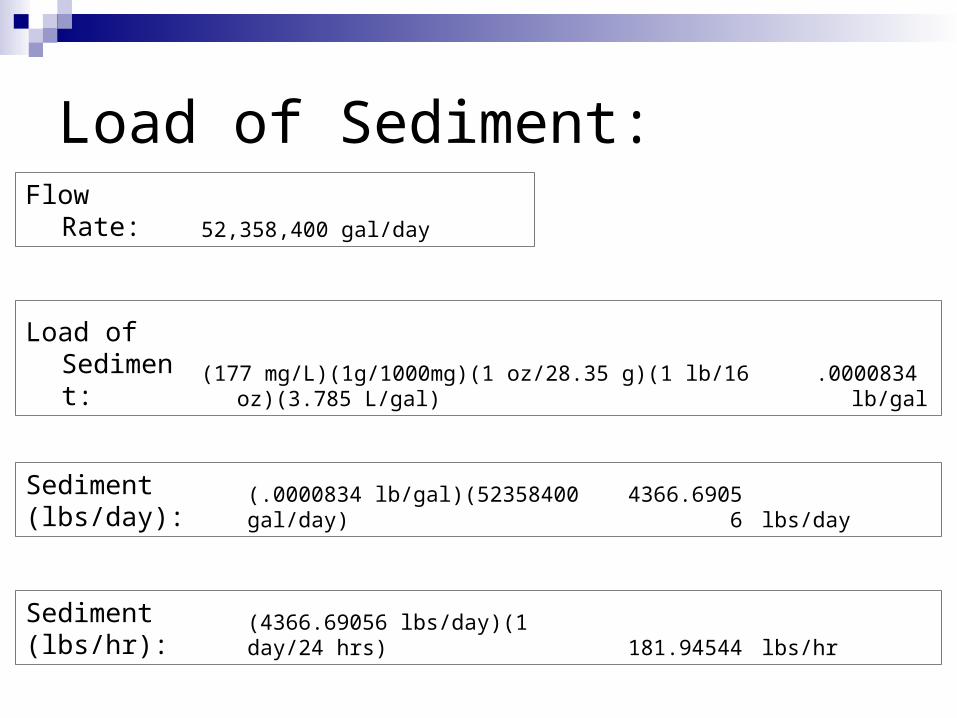
Load of Sediment:Flow Rate: 52,358,400 gal/day
Load of Sediment: (177 mg/L)(1g/1000mg)(1 oz/28.35 g)(1 lb/16 oz)(3.785 L/gal)
.0000834 lb/gal
Sediment (lbs/day): (.0000834 lb/gal)(52358400 gal/day) 4366.69056 lbs/day
Sediment (lbs/hr): (4366.69056 lbs/day)(1 day/24 hrs) 181.94544 lbs/hr
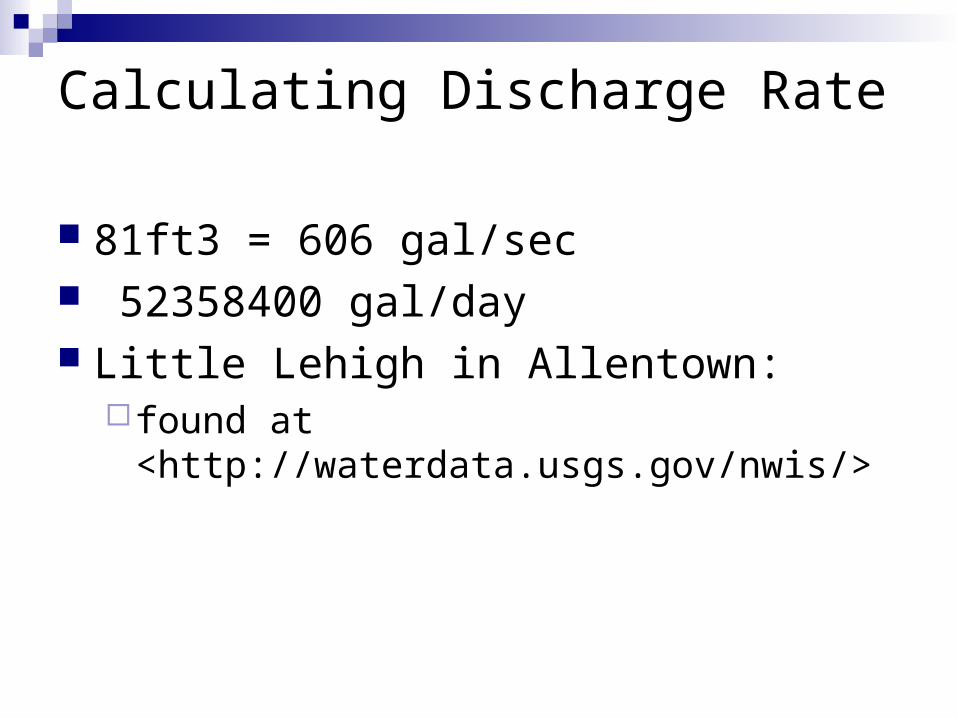
Calculating Discharge Rate
81ft3 = 606 gal/sec 52358400 gal/day Little Lehigh in Allentown:
found at <http://waterdata.usgs.gov/nwis/>

Works Cited:
"Investigating the Impact of Lowered Stream Flow on Stream Community Structure and Ecosystem Functioning|Research Project Database | NCER | ORD | US EPA." U.S. EPA ColdFusion Server. Web. 02 Nov. 2010. <http://cfpub.epa.gov/ncer_abstracts/index.cfm/fuseaction/display.abstractDetail/abstract/8153>.
"Stream Total Suspended Solids and Turbidity - Chapter 3 - Streams in A Citizen'sGuide to Understanding and Monitoring Lakes and Streams." Washington State Department of Ecology | Home Page | ECY WA DOE. Web. 02 Nov. 2010. <http://www.ecy.wa.gov/programs/wq/plants/management/joysmanual/streamtss.html>.
"The Water Cycle: Streamflow, from USGS Water Science for Schools." USGS Georgia Water Science Center - Home Page. Web. 02 Nov. 2010. <http://ga.water.usgs.gov/edu/watercyclestreamflow.html>.
Recommended