OR I G I N A L A R T I C L E
Physical fitness and activity level in Norwegian adultswith achondroplasia
Olga Marieke de Vries1 | Heidi Johansen1 | Svein Otto Fredwall1,2
1Sunnaas Rehabilitation Hospital, TRS National
Resource Centre for Rare Disorders,
Nesodden, Norway
2Faculty of Medicine, Institute of Clinical
Medicine, University of Oslo, Norway
Correspondence
Olga Marieke de Vries, Sunnaas Rehabilitation
Hospital, TRS National Resource Centre for
Rare Disorders, Nesodden Norway.
Email: [email protected]
Abstract
This cross-sectional Physical Fitness Study compared cardiorespiratory fitness (VO2
peak), six-minute walk test (6MWT), muscle strength (30sSTS), balance (BESS), and self-
reported physical activity level (IPAQ) in Norwegian adults with achondroplasia (ACH) to
reference values of average-statured individuals. The feasibility of the physical fitness
tests and IPAQ was explored. Forty-three adults (22 women) participated. Mean age was
38 years (range 16–69 years). Mean differences (95% CI) for men and women with ACH
compared to reference values were: VO2 peak. −7.0 m/min/kg (−13.6 to −0.5, p = .037),
and − 7.9 ml/kg/min (−11.6 to −4.3, p < .001); 6MWT −270.8 m (−340.4 to −201.2,
p < .001), and − 196.7 m (−244.3 to −149.0, p = .001); 30sSTS -4.6 repetitions (−7.8 to
−1.5, p = .006), and − 1.1 repetitions (−3.4 to 1.1, p = .335). There were no differences
within ACH participants, except for VO2 peak, where men performed better. Sufficient
physical activity (> 600 metabolic equivalent of task weekly) was achieved by 79% of the
participants. The feasibility of the 6MWT and 30sSTS was good. There was a strong cor-
relation between the VO2 peak and 6MWT (men: r = 0.63, p = .007; women: r = 0.71,
p < .001). The findings indicate that the 6MWT and 30sSTS test are useful in assessing
functional exercise capacity and muscle strength in adults with ACH.
K E YWORD S
achondroplasia, adult, muscle strength, physical fitness, six-minute walk test
1 | INTRODUCTION
Achondroplasia (ACH) is the most common skeletal dysplasia,
resulting in disproportionate short stature and rhizomelic shortening
of the limbs, in combination with an almost normal trunk length
(Horton, Hall, & Hecht, 2007; Pauli, 2019). A high prevalence of medi-
cal complications, such as foramen magnum stenosis, limb and spinal
deformities in childhood, and spinal stenosis and high prevalence of
pain later in life have been reported (Alade et al., 2013; Dhiman
et al., 2016; Hunter, Bankier, Rogers, Sillence, & Scott Jr., 1998;
Wright & Irving, 2012). Medical complications, disproportionate short
stature, and pain may negatively influence participation in physical
activity (Haga, 2004; Takken, van Bergen, Sakkers, Helders, &
Engelbert, 2007) and may affect physical activity levels and fitness.
Knowledge of physical fitness and activity levels in people with ACH
is limited. We only found three studies with focus on physical fitness
and strength, comparing healthy peers to people with ACH. One
study, in children with ACH, showed reduced physical fitness and low
participation in physical activity compared to age-matched peers
(Takken et al., 2007). Sims and coworkers (Sims, Onambele-Pearson,
Burden, Payton, & Morse, 2018b) showed that young male adults with
ACH had reduced muscle strength compared to healthy young males.
Received: 4 May 2020 Revised: 11 December 2020 Accepted: 13 December 2020
DOI: 10.1002/ajmg.a.62055
This is an open access article under the terms of the Creative Commons Attribution-NonCommercial-NoDerivs License, which permits use and distribution in any
medium, provided the original work is properly cited, the use is non-commercial and no modifications or adaptations are made.
© 2020 The Authors. American Journal of Medical Genetics Part A published by Wiley Periodicals LLC.
Am J Med Genet. 2020;1–10. wileyonlinelibrary.com/journal/ajmga 1
Stokes et al. (Stokes, Pyeritz, Wise, Fairclough, & Murphy, 1988;
Stokes, Wohl, Wise, Pyeritz, & Fairclough, 1990) found a slightly
reduced lung capacity in ACH compared to healthy adults, which they
did not consider influenced on physical capacity.
The importance of physical fitness, to extend the years of quality
living, is extensively justified in the literature for the general popula-
tion (Blair & Morris, 2009; Bouchard, Blair, & Haskell, 2012). Previous
studies have reported that people with ACH have an increased overall
mortality compared to the general American population, including
10 times increased heart disease-related mortality (Hecht, Fran-
comano, Horton, & Annegers, 1987; Wynn, King, Gambello, Waller, &
Hecht, 2007). Cardio-respiratory fitness (CRF) is well known as a pre-
dictor of health and cardiovascular disease in the general population
(Kodama et al., 2009; Ladenvall et al., 2016; Myers et al., 2002). A
maximum treadmill exercise test is regarded as the reference standard
for assessing CRF (Bassett & Howley, 2000) but is a time-consuming
and laboratory-dependent test, limiting the applicability in clinical
practice. In contrast, the six-minute walk test (6MWT) is a valid clinical
functional exercise capacity test (Bohannon & Crouch, 2017). In the
general population, studies have shown a high correlation between
the 6MWT and CRF (American Thoracic Society, 2002; Burr, Bredin,
Faktor, & Warburton, 2011; Enright, 2003).
To assess physical fitness and physical activity level in ACH, we
chose well-proven and commonly used clinical assessment tools, due
to the lack of instruments validated for ACH. Selection of the physical
fitness tests was based on good psychometric properties, the possibil-
ity of further use in clinical practice, and low cost without the need
for advanced technical equipment. We are not aware of other studies
examining physical fitness or levels of physical activity in adults
with ACH.
The main aim of this study was to investigate physical fitness and
level of physical activity in a Norwegian cohort of adults with ACH, to
compare men versus women with ACH, and ACH versus reference
values. We assessed the correlation between age, anthropometrics
and physical fitness measures. In addition, we evaluated the feasibility
of the 6MWT, the 30-second sit-to-stand test (30sSTS), the Balance
Error Scoring System (BESS), and the International Physical Activity
Questionnaire (IPAQ) in these individuals.
2 | METHODS
2.1 | Participants
This cross-sectional study was part of The Norwegian Adult Achon-
droplasia Study, conducted at Sunnaas Rehabilitation Hospital in col-
laboration with the National Resource Centre for Rare Disorders. All
participants were recruited from this study. Details of design, recruit-
ment, and representativeness of the study sample are presented else-
where (Fredwall et al., 2020). After inclusion in this study, all
participants underwent a medical safety check (medical history, gen-
eral health evaluation, blood pressure and a cardiopulmonary exami-
nation), to clarify for the physical fitness tests.
2.2 | Data collection
All physical fitness measures were carried out at Sunnaas Rehabilita-
tion Hospital. Experienced laboratory staff conducted the treadmill
and spirometry test, and a physiotherapist (OdV) performed the
remaining physical fitness tests. The participants completed the IPAQ,
confirmed by a face-to-face interview (OdV). Demographical data,
including age, gender, educational level, body measurements (weight,
height, sitting height), and smoking status were collected from The
Norwegian Adult Achondroplasia Study. Leg length was calculated by
subtracting sitting height from standing height.
2.3 | Measurements
2.3.1 | Spirometry
As part of the CRF test, all participants completed a spirometry test,
measuring Forced Vital Capacity (FVC) and Forced Expiratory Volume,
first second (FEV1). We used the instrument VO2 max
220 (Sensormedics Corporation, Yorba Linda, CA). The spirometry test
was conducted in accordance with the recommendations provided by
the European Respiratory Society and the American Thoracic Society
(Miller et al., 2005). Three technically satisfactory tests were con-
ducted, with the highest FVC and FEV1 used in the analyses. Cur-
rently, there are no established spirometry reference values for ACH.
However, Stokes et al published spirometry data on adults with ACH
(Stokes et al., 1988; Stokes et al., 1990). We used these data to guide
an individual clinical assessment of whether the respiratory function
could be a potential limiting factor of the physical fitness tests.
2.3.2 | Cardiorespiratory fitness
The CRF was measured by a maximum treadmill exercise test, considered
as the gold standard for exercise capacity measurement (Bassett &
Howley, 2000). We followed the modified Sunnaas protocol (Lundgaard,
Wouda, & Strom, 2017) and the clinician's guide from the American Heart
Association (Balady et al., 2010). The CRF outcome was measured as
VO2 peak. After a short warm-up, establishing the self-selected walking
speed, the inclination of the treadmill was increased by 2% every minute
up to 20% inclination, or until exhaustion. If exhaustion was not reached
at the self-selected speed and 20% inclination, the speed was increased
every minute by 0.5 km/hr until exhaustion. The test was terminated
when the participant achieved exhaustion, despite verbal encouragement.
During the test, heart rate (HR) was measured with a HR-monitor (Polar
Sports Tester, Polar Electro Inc., Kempele, Finland). Gas exchange vari-
ables were measured continuously with a computerized standard open-
circuit technique, breath-to-breath spirometer (Vmax Encore 229D,
CareFusion Corporation, San Diego, CA). The equipment was calibrated
before each test. Blood lactate concentration (mmol/l) was measured two
minutes into recovery. The preset criteria for maximal oxygen uptake was
set to the achievement of a VO2 plateau, a respiratory exchange ratio
2 de VRIES ET AL.
(RER) ≥ 1.05, lactate ≥5 mmoL/L, and 95% of predicted maximal HR, and
a Borg Scale ≥17. The Borg scale is a commonly used scale for assessing
level of self-perceived exertion, ranging from 6 to 20 points, starting from
no exertion to maximum exertion (Borg, 1990). To compare VO2 values
with the general population, we used the measurement unit ml/kg/min,
and the relative VO2 was calculated as the absolute value divided by
weight (Balady et al., 2010; Bassett & Howley, 2000). Conversion from
absolute measurements (liter/min) to ml/kg/min enables comparison,
despite differences in body size.
2.3.3 | Functional exercise capacity
The 6MWT was conducted according to the American Thoracic Soci-
ety guidelines (American Thoracic Society, 2002; Enright, 2003). Par-
ticipants were instructed to walk as fast as possible, without running,
back and forth between to cones with a distance of 30 m, on a flat
and hard surface for six minutes. We recorded the total walked dis-
tance in six minutes (6MWD) up to the nearest meter. After complet-
ing the test, participants were asked to rate their perceived exertion
on the Borg scale (Borg, 1990).
2.3.4 | Functional muscle strength
The 30sSTS test was used to assess functional muscle strength in the
lower extremities (Csuka & McCarty, 1985; Jones, Rikli, &
Beam, 1999; Tveter, Dagfinrud, Moseng, & Holm, 2014). The test was
modified to compensate for low body height. We lowered the chair
until the participants achieved 90� of flection in the hip and knee
while seated. Testing started in the sitting position, with arms folded
across the chest. Participants were instructed to do as many full
“stand-ups” as possible in 30 seconds.
2.3.5 | Balance
The BESS was conducted according to the manual (Brown
et al., 2014). BESS combines three stances (narrow double leg stance,
single leg stance, and tandem stance) on two footing surfaces (firm
and foam surface). Participants were asked to hold each stance, with
hands on hips and eyes closed, for 20 seconds. According to the scor-
ing manual, any kind of balance reaction (error) created one error-
point. A higher score represented a lower performance, with a maxi-
mum of 10 points in every stance (total maximum score 60 points). If
the participant could not restore balance within 5 seconds, a maxi-
mum amount of 10 points was given (Brown et al., 2014).
2.3.6 | Physical activity level
The International Physical Activity Questionnaire (IPAQ) is a self-
administered questionnaire (Craig et al., 2003; Kurtze, Rangul, &
Hustvedt, 2008). The participants were asked to recall all of their
activities during the last seven days, specified in minutes and intensity
level. The IPAQ instruction was explained orally to each participant as
the intensity concepts needed clarification. For minimizing the errors,
all answers were verified by a face-to-face interview with the physio-
therapist (OdV) after completing the IPAQ. To calculate the total
amount of activity, the reported minutes per activity were multiplied
by the number of days per week. Depending on intensity level of the
activity, minutes were multiplied by the actual values for the different
intensities; for walking, this value is 3.3, for moderate activity 4, and
for high intensity 8 (Kurtze et al., 2008). The total amount of activity
for a participant in a week is called the metabolic equivalent of task
(MET). According to the IPAQ manual, a total MET score of >960 min
per day (16 hr) should be excluded. A score exceeding >240 min per
day on every intensity value of physical activity was truncated to
240 min per activity value a day. This rule permits a maximum of
28 hours of activity reported for each activity level per week
(Schembre & Riebe, 2011; The IPAQ group, 2020).
The activity level per week was graded as insufficiently active
(< 600 MET), sufficiently active (≥ 600 MET), or health-enhancing
physical activity (HEPA) (> 3,000 MET) (Kurtze et al., 2008).
2.4 | Statistics
All data were analyzed using the Statistical Package for Social Sci-
ences (SPSS, IBM, Armonk, NY), version 25. Descriptive statistics for
continuous data are presented as mean and SD or as median and
range. The categorical data are presented as number (n) and propor-
tions (%). P values <.05 were considered statistically significant.
The independent sample t-test with 95% confidence intervals
(CI) was used to compare mean between groups (ACH men versus
women and ACH versus reference values). The assumptions of normal
distribution were assessed by histograms, QQ plot, box plot and the
Shapiro–Wilk test of normality. For data not normally distributed, the
non-parametric Mann–Whitney U Test was used.
Results for CRF, the 6MWT, and the 30sSTS test were compared
with reference values developed for the Norwegian general popula-
tion, matched for gender and age groups by decade (Edvardsen
et al., 2013; Tveter, Moseng, Dagfinrud, & Holm, 2013).
As there are no Norwegian reference values for BESS, we used the
reference values developed for the Canadian general population, mat-
ched for gender, and age groups by decade (Iverson & Koehle, 2013).
The Pearson correlation was used to explore associations between
the demographic (age, educational level) and anthropometric (height,
weight, leg length) characteristics for both participants (men and women)
and physical fitness variables (FVC, FEV1, VO2 peak, 6MWT, 30sSTS,
and IPAQ). Pearson's correlation was defined as small: r = 0.10–0.29,
medium: r = 0.30–0.49, and large: r = 0.50–1.0 (Cohen, 1988).
To evaluate the feasibility of the 6MWT, 30sSTS, BESS, and
IPAQ, we considered how many participants could perform each item,
according to the test manual, and whether any particular problems
arose while executing the tests. Using the scoring manual for each
de VRIES ET AL. 3
test, we considered the distribution of the results. We also gauged
how easy the test was to administer.
2.5 | Ethical considerations
The Regional Ethics Committee for Ethics for Medical Health
Research in Eastern Norway approved the study (approval number:
2016/2272). A written consent was obtained from all participants
prior to taking part in The Physical Fitness Study. The results are
reported in accordance with the STROBE guidelines for observational
studies (von Elm et al., 2014).
3 | RESULTS
3.1 | The study participants
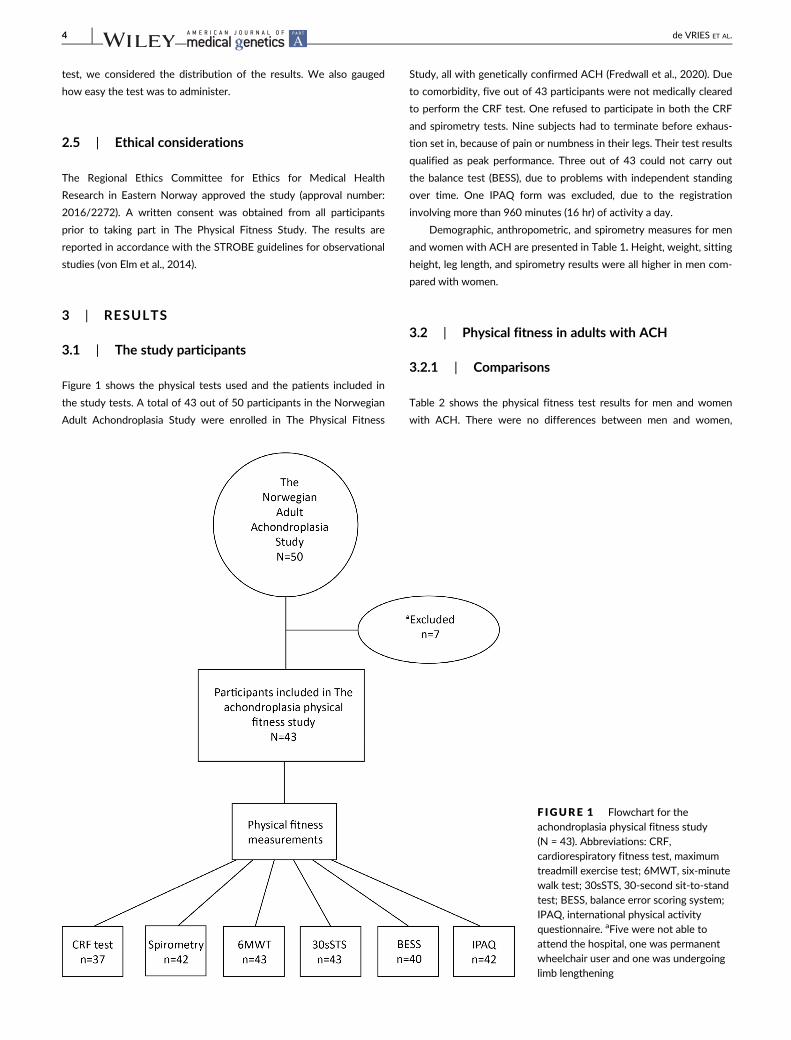
Figure 1 shows the physical tests used and the patients included in
the study tests. A total of 43 out of 50 participants in the Norwegian
Adult Achondroplasia Study were enrolled in The Physical Fitness
Study, all with genetically confirmed ACH (Fredwall et al., 2020). Due
to comorbidity, five out of 43 participants were not medically cleared
to perform the CRF test. One refused to participate in both the CRF
and spirometry tests. Nine subjects had to terminate before exhaus-
tion set in, because of pain or numbness in their legs. Their test results
qualified as peak performance. Three out of 43 could not carry out
the balance test (BESS), due to problems with independent standing
over time. One IPAQ form was excluded, due to the registration
involving more than 960 minutes (16 hr) of activity a day.
Demographic, anthropometric, and spirometry measures for men
and women with ACH are presented in Table 1. Height, weight, sitting
height, leg length, and spirometry results were all higher in men com-
pared with women.
3.2 | Physical fitness in adults with ACH
3.2.1 | Comparisons
Table 2 shows the physical fitness test results for men and women
with ACH. There were no differences between men and women,
F IGURE 1 Flowchart for theachondroplasia physical fitness study(N = 43). Abbreviations: CRF,cardiorespiratory fitness test, maximumtreadmill exercise test; 6MWT, six-minutewalk test; 30sSTS, 30-second sit-to-standtest; BESS, balance error scoring system;IPAQ, international physical activityquestionnaire. aFive were not able toattend the hospital, one was permanentwheelchair user and one was undergoinglimb lengthening
4 de VRIES ET AL.
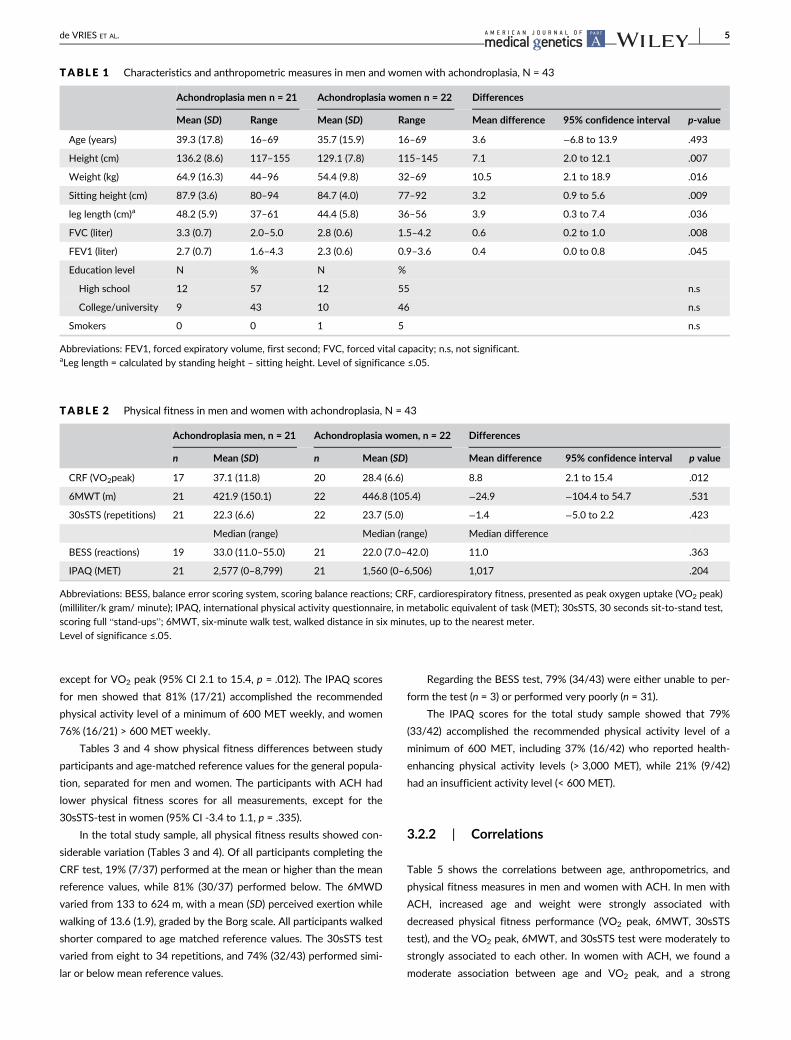
except for VO2 peak (95% CI 2.1 to 15.4, p = .012). The IPAQ scores
for men showed that 81% (17/21) accomplished the recommended
physical activity level of a minimum of 600 MET weekly, and women
76% (16/21) > 600 MET weekly.
Tables 3 and 4 show physical fitness differences between study
participants and age-matched reference values for the general popula-
tion, separated for men and women. The participants with ACH had
lower physical fitness scores for all measurements, except for the
30sSTS-test in women (95% CI -3.4 to 1.1, p = .335).
In the total study sample, all physical fitness results showed con-
siderable variation (Tables 3 and 4). Of all participants completing the
CRF test, 19% (7/37) performed at the mean or higher than the mean
reference values, while 81% (30/37) performed below. The 6MWD
varied from 133 to 624 m, with a mean (SD) perceived exertion while
walking of 13.6 (1.9), graded by the Borg scale. All participants walked
shorter compared to age matched reference values. The 30sSTS test
varied from eight to 34 repetitions, and 74% (32/43) performed simi-
lar or below mean reference values.
Regarding the BESS test, 79% (34/43) were either unable to per-
form the test (n = 3) or performed very poorly (n = 31).
The IPAQ scores for the total study sample showed that 79%
(33/42) accomplished the recommended physical activity level of a
minimum of 600 MET, including 37% (16/42) who reported health-
enhancing physical activity levels (> 3,000 MET), while 21% (9/42)
had an insufficient activity level (< 600 MET).
3.2.2 | Correlations
Table 5 shows the correlations between age, anthropometrics, and
physical fitness measures in men and women with ACH. In men with
ACH, increased age and weight were strongly associated with
decreased physical fitness performance (VO2 peak, 6MWT, 30sSTS
test), and the VO2 peak, 6MWT, and 30sSTS test were moderately to
strongly associated to each other. In women with ACH, we found a
moderate association between age and VO2 peak, and a strong
TABLE 1 Characteristics and anthropometric measures in men and women with achondroplasia, N = 43
Achondroplasia men n = 21 Achondroplasia women n = 22 Differences
Mean (SD) Range Mean (SD) Range Mean difference 95% confidence interval p-value
Age (years) 39.3 (17.8) 16–69 35.7 (15.9) 16–69 3.6 −6.8 to 13.9 .493
Height (cm) 136.2 (8.6) 117–155 129.1 (7.8) 115–145 7.1 2.0 to 12.1 .007
Weight (kg) 64.9 (16.3) 44–96 54.4 (9.8) 32–69 10.5 2.1 to 18.9 .016
Sitting height (cm) 87.9 (3.6) 80–94 84.7 (4.0) 77–92 3.2 0.9 to 5.6 .009
leg length (cm)a 48.2 (5.9) 37–61 44.4 (5.8) 36–56 3.9 0.3 to 7.4 .036
FVC (liter) 3.3 (0.7) 2.0–5.0 2.8 (0.6) 1.5–4.2 0.6 0.2 to 1.0 .008
FEV1 (liter) 2.7 (0.7) 1.6–4.3 2.3 (0.6) 0.9–3.6 0.4 0.0 to 0.8 .045
Education level N % N %
High school 12 57 12 55 n.s
College/university 9 43 10 46 n.s
Smokers 0 0 1 5 n.s
Abbreviations: FEV1, forced expiratory volume, first second; FVC, forced vital capacity; n.s, not significant.aLeg length = calculated by standing height – sitting height. Level of significance ≤.05.
TABLE 2 Physical fitness in men and women with achondroplasia, N = 43
Achondroplasia men, n = 21 Achondroplasia women, n = 22 Differences
n Mean (SD) n Mean (SD) Mean difference 95% confidence interval p value
CRF (VO2peak) 17 37.1 (11.8) 20 28.4 (6.6) 8.8 2.1 to 15.4 .012
6MWT (m) 21 421.9 (150.1) 22 446.8 (105.4) −24.9 −104.4 to 54.7 .531
30sSTS (repetitions) 21 22.3 (6.6) 22 23.7 (5.0) −1.4 −5.0 to 2.2 .423
Median (range) Median (range) Median difference
BESS (reactions) 19 33.0 (11.0–55.0) 21 22.0 (7.0–42.0) 11.0 .363
IPAQ (MET) 21 2,577 (0–8,799) 21 1,560 (0–6,506) 1,017 .204
Abbreviations: BESS, balance error scoring system, scoring balance reactions; CRF, cardiorespiratory fitness, presented as peak oxygen uptake (VO2 peak)
(milliliter/k gram/ minute); IPAQ, international physical activity questionnaire, in metabolic equivalent of task (MET); 30sSTS, 30 seconds sit-to-stand test,
scoring full “stand-ups”; 6MWT, six-minute walk test, walked distance in six minutes, up to the nearest meter.
Level of significance ≤.05.
de VRIES ET AL. 5
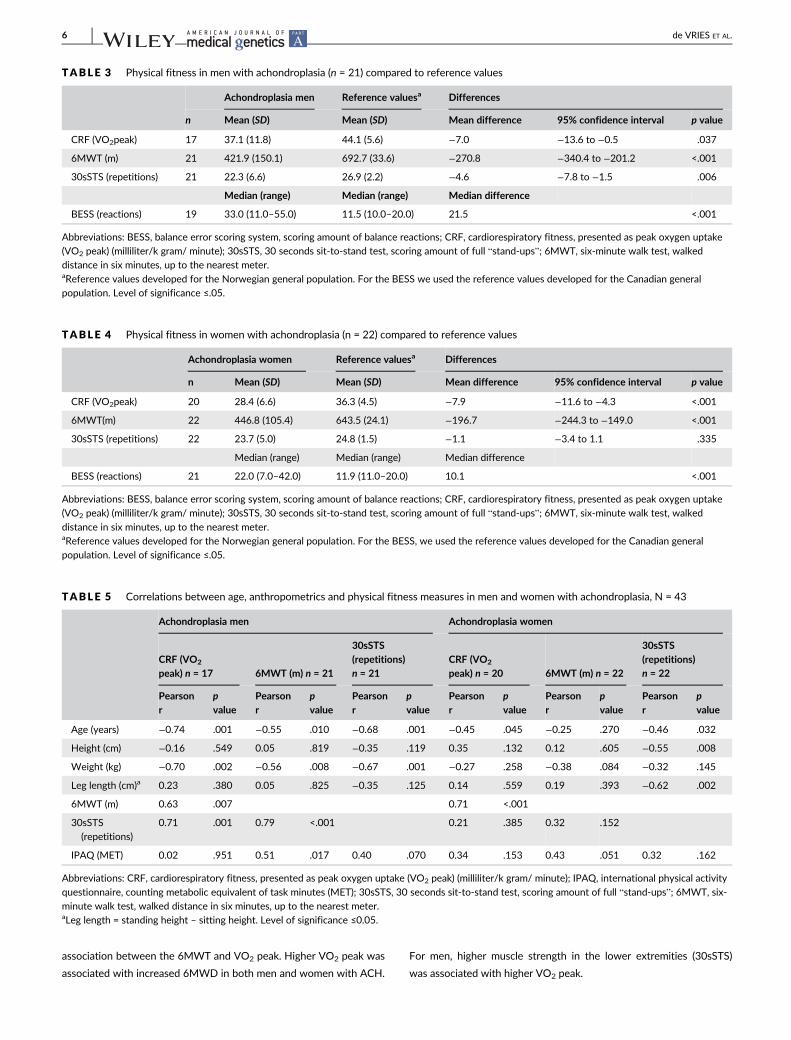
association between the 6MWT and VO2 peak. Higher VO2 peak was
associated with increased 6MWD in both men and women with ACH.
For men, higher muscle strength in the lower extremities (30sSTS)
was associated with higher VO2 peak.
TABLE 3 Physical fitness in men with achondroplasia (n = 21) compared to reference values
Achondroplasia men Reference valuesa Differences
n Mean (SD) Mean (SD) Mean difference 95% confidence interval p value
CRF (VO2peak) 17 37.1 (11.8) 44.1 (5.6) −7.0 −13.6 to −0.5 .037
6MWT (m) 21 421.9 (150.1) 692.7 (33.6) −270.8 −340.4 to −201.2 <.001
30sSTS (repetitions) 21 22.3 (6.6) 26.9 (2.2) −4.6 −7.8 to −1.5 .006
Median (range) Median (range) Median difference
BESS (reactions) 19 33.0 (11.0–55.0) 11.5 (10.0–20.0) 21.5 <.001
Abbreviations: BESS, balance error scoring system, scoring amount of balance reactions; CRF, cardiorespiratory fitness, presented as peak oxygen uptake
(VO2 peak) (milliliter/k gram/ minute); 30sSTS, 30 seconds sit-to-stand test, scoring amount of full “stand-ups”; 6MWT, six-minute walk test, walked
distance in six minutes, up to the nearest meter.aReference values developed for the Norwegian general population. For the BESS we used the reference values developed for the Canadian general
population. Level of significance ≤.05.
TABLE 4 Physical fitness in women with achondroplasia (n = 22) compared to reference values
Achondroplasia women Reference valuesa Differences
n Mean (SD) Mean (SD) Mean difference 95% confidence interval p value
CRF (VO2peak) 20 28.4 (6.6) 36.3 (4.5) −7.9 −11.6 to −4.3 <.001
6MWT(m) 22 446.8 (105.4) 643.5 (24.1) −196.7 −244.3 to −149.0 <.001
30sSTS (repetitions) 22 23.7 (5.0) 24.8 (1.5) −1.1 −3.4 to 1.1 .335
Median (range) Median (range) Median difference
BESS (reactions) 21 22.0 (7.0–42.0) 11.9 (11.0–20.0) 10.1 <.001
Abbreviations: BESS, balance error scoring system, scoring amount of balance reactions; CRF, cardiorespiratory fitness, presented as peak oxygen uptake
(VO2 peak) (milliliter/k gram/ minute); 30sSTS, 30 seconds sit-to-stand test, scoring amount of full “stand-ups”; 6MWT, six-minute walk test, walked
distance in six minutes, up to the nearest meter.aReference values developed for the Norwegian general population. For the BESS, we used the reference values developed for the Canadian general
population. Level of significance ≤.05.
TABLE 5 Correlations between age, anthropometrics and physical fitness measures in men and women with achondroplasia, N = 43
Achondroplasia men Achondroplasia women
CRF (VO2
peak) n = 17 6MWT (m) n = 21
30sSTS(repetitions)n = 21
CRF (VO2
peak) n = 20 6MWT (m) n = 22
30sSTS(repetitions)n = 22
Pearsonr
pvalue
Pearsonr
pvalue
Pearsonr
pvalue
Pearsonr
pvalue
Pearsonr
pvalue
Pearsonr
pvalue
Age (years) −0.74 .001 −0.55 .010 −0.68 .001 −0.45 .045 −0.25 .270 −0.46 .032
Height (cm) −0.16 .549 0.05 .819 −0.35 .119 0.35 .132 0.12 .605 −0.55 .008
Weight (kg) −0.70 .002 −0.56 .008 −0.67 .001 −0.27 .258 −0.38 .084 −0.32 .145
Leg length (cm)a 0.23 .380 0.05 .825 −0.35 .125 0.14 .559 0.19 .393 −0.62 .002
6MWT (m) 0.63 .007 0.71 <.001
30sSTS
(repetitions)
0.71 .001 0.79 <.001 0.21 .385 0.32 .152
IPAQ (MET) 0.02 .951 0.51 .017 0.40 .070 0.34 .153 0.43 .051 0.32 .162
Abbreviations: CRF, cardiorespiratory fitness, presented as peak oxygen uptake (VO2 peak) (milliliter/k gram/ minute); IPAQ, international physical activity
questionnaire, counting metabolic equivalent of task minutes (MET); 30sSTS, 30 seconds sit-to-stand test, scoring amount of full “stand-ups”; 6MWT, six-
minute walk test, walked distance in six minutes, up to the nearest meter.aLeg length = standing height – sitting height. Level of significance ≤0.05.
6 de VRIES ET AL.
3.3 | Feasibility
All participants were able to perform the 6MWT without pausing,
including those three participants who used walking aids (two men
and one woman). During the project, we became aware that several
participants stumbled or tripped, although none fell. Their total per-
ceived exertion on the Borg scale ranged from eight to 18. We
observed that those with good walking speed had high step frequency
(steps/min).
After individual chair adjustment, all participants could perform
the 30sSTS test. Even those with some balance issues were able to
complete the test with a satisfying degree of quality, and in accor-
dance with the manual.
We experienced several challenges in performing the balance test
(BESS). The BESS results were low; 78% (31/40) performed poorly or
very poorly, and three participants were not able to perform the test
at all. Only 13% (5/40) achieved performances within the predicted
range or above. The participants had particular difficulties in per-
forming the more advanced one-foot positions and tandem stance on
the foam pad. On the one-foot stand, 85% (33/40) had a maximum
amount of error, while 58% (23/40) experienced largely the same with
the tandem stance; this stance's starting position was demonstrated
to be difficult, due to short legs and broad thighs.
We found the 6MWT and 30sSTS test easy to assess and score
in adults with ACH, while BESS was technically difficult to both per-
form and score.
All participants needed assistance in filling out the IPAQ. Particu-
larly difficult was grading the intensity of the reported activity, or the
amount of time spent on physical activity for the last seven days. We
experienced that the participants had difficulty in recalling their daily
life activities, although regular exercise seemed to be easier. More-
over, the IPAQ items 3a and 3b, inquiring about walking habits, were
not applicable to wheelchair users.
4 | DISCUSSION
This study investigated physical fitness and level of physical activity in
a Norwegian cohort of adults with ACH, including feasibility of use of
the physical fitness tests. We found low levels of physical fitness in
adults with ACH compared to reference values, and with considerable
variance, despite a relatively high reported level of physical activity.
The 6MWT and 30sSTS tests were feasible, and appeared to be useful
in assessing exercise capacity and muscle strength in this population.
To our knowledge, this is the first study to investigate physical fitness,
activity level, and feasibility of commonly used physical fitness tests in
adults with ACH.
4.1 | Physical fitness
The respiratory function was assessed by spirometry, and compared
with values reported by Stokes et al. (Stokes et al., 1988; Stokes
et al., 1990). Based on this comparison, and the clinical interpretation
of the absolute spirometry results (in liter), we considered that lung
capacity did not limit the performance of the physical fitness tests in
this study.
The mean VO2 peak was significantly lower for both men and
women, compared with reference values matched for age groups and
gender (Edvardsen et al., 2013), and with a pronounced variation. Our
results are consistent with Takken et al. (2007), who found a low
mean VO2 peak in children with ACH. As for the general population,
the VO2 peak values in ACH were influenced by age and gender
(Bouchard et al., 2012). When body weight increases, the amount of
oxygen per kilo (VO2 peak measured in ml/kg/min.) decreases. Sims,
Onambélé-Pearson, Burden, Payton, and Morse (2019) found a higher
body fat percentage in people with ACH. This might explain the rela-
tive low VO2 peak, potentially reflecting high body fat instead of low
VO2 peak. Comparing VO2 peak results based on fat free mass would
therefore have been relevant.
An interesting finding was that men had a higher VO2 peak com-
pared to women with ACH, but there was no gender difference in the
6MWD. This might be explained by the higher body weight of men,
which is associated with shorter walking distance and lower oxygen
uptake per kilo. The women in this study sample were also slightly
younger. As symptomatic spinal stenosis influences on walking dis-
tance, and spinal stenosis becomes significantly more prevalent with
increasing age (Fredwall et al., 2020), this may be the cause of relative
short 6MWD for men in this study.
The strong correlation (men: r = 0.63; women: r = 0.71) between
the VO2 peak and the 6MWD in our study population is consistent with
the general population (Burr et al., 2011), indicating that the 6MWT is
applicable for assessing exercise capacity in adults with ACH.
As expected, the mean 6MWD was significantly lower in the both
men and women with ACH, compared with matched reference values
(Enright et al., 2003; Tveter et al., 2013). Surprisingly, we found no
association between body height, sitting height, or leg length and
walking distance in our study sample. One possible explanation might
be the observed increased step frequency, compensating for the short
stride length. Walking speed is determined by step length and step
frequency (speed m/s) (Whittle, 2007, p.57). Hence, increased step
frequency might compensate for short legs (Sims, Onambele-Pearson,
Burden, Payton, & Morse, 2018a). To achieve high step frequency,
muscle strength plays a central role. In men with ACH, the 6MWD
increased with good muscle strength. This is consistent with Gurses,
Zeren, Denizoglu Kulli, and Durgut (2018), who found a moderate cor-
relation between 6MWD and muscle strength (30sSTS) in healthy
young adults.
While the mean muscle strength for men with ACH was reduced
compared to the reference values, women with ACH had results simi-
lar to the reference values, both for absolute values and range (Tveter
et al., 2013). Takken et al. (2007) explained reduced muscle strength
in children with ACH by differences in biomechanical conditions,
reduced muscle volume, and inactivity. Sims et al. (2018b) found
reduced muscle volume and high muscle fat infiltration. These findings
require further studies.
de VRIES ET AL. 7
4.2 | Physical activity level
Self-reported physical activity levels were relatively high in our study
population, as 79% reported ≥600 MET, and with a particularly high
amount of high-intensity activities. Despite the relatively high inten-
sity activity reported in our material, we found low values of VO2
peak, which is surprising, given that high-intensity activities should
result in high VO2 peak values. A possible explanation might be that
individuals with ACH tend to report their strenuous everyday activi-
ties as high-intensity activities, as described by Johansen, Andresen,
Naess, and Hagen (2007). Recall bias and coincidental high reporting
of activity could also affect our results. Also notable is the fact that
we did not present our oxygen uptake results based on fat free mass.
Eliminating high body fat percentage could decrease the difference
between the ACH group and the general population, as suggested by
Sims et al. (2019).
4.3 | Feasibility of the physical fitness testsfor ACH
The 6MWT was technically easy to perform and well tolerated for
adults with ACH. The possibility of using walking aids made it possible
for all participants to walk for six minutes. We found a somewhat low
Borg scale score, which could indicate low level of intensity. The
strong correlation between the 6MWT and VO2 peak in adults with
ACH, including feasibility, suggests that the 6MWT could be a useful
instrument in assessing functional exercise capacity in adults
with ACH.
The 30sSTS test was also well tolerated and easy to perform in
adults with ACH. No advanced or specialized equipment was neces-
sary, and the 30sSTS results showed a normal distribution. In contrast,
the BESS test was technically difficult to administer and resulted in
only 13% of participants scoring within the normal range. According
to the test manual, there is no distinction between small and big bal-
ance reaction “errors”. Some starting positions were impossible for
participants due to short legs and broad thighs, creating difficulties in
keeping the balance and increasing the total score. Hence, BESS
appeared not to be feasible for use in the ACH population. The test is
designed for athletes, and does not seem to be valid for testing bal-
ance in adults with ACH.
To our knowledge, balance has not previously been reported as a
problem in ACH. In several of the participants, we noticed a waddling
and wide-based gait, and some stumbling while performing the
6MWT. This might be a sign of decreased balance or altered gate, as
described by Sims et al. (2018a). We are not aware of other studies
investigating balance in adults with ACH.
4.4 | Strengths and limitations
Strengths of this study are the broad recruitment of participants,
including 50% of the total estimated Norwegian adult ACH
population, and all participants being genetically confirmed (Fredwall
et al., 2020). The sample's anthropometric measurements (height,
weight, and sitting height) are representative of adults with ACH in
Europe (Merker et al., 2018a; Merker et al., 2018b).
There are also limitations to this study. Assessing physical fitness
and activity level in ACH is challenging, due to the complexity of the
concept of physical fitness. The impact of several of the physiological
factors in ACH, and the lack of knowledge about psychometric prop-
erties for physical fitness measures, are unknown and could affect the
results. To overcome these challenges, we applied clinically well-
established and commonly used measurements, along with the gold
standard laboratory CRF test.
Self-reported physical activity level (IPAQ) is well known to pose
a risk of recall bias, leading to under- or overestimation of physical
activity (Kowalski, Rhodes, Naylor, Tuokko, & Macdonald, 2012;
Kurtze, Gundersen, & Holmen, 2003; Prince et al., 2008). The high
amount of reported activity minutes in our study suggest low validity
of the IPAQ for adults with ACH. Further studies are needed to
explore the validity of IPAQ for adults with ACH, before this test is
applied in other clinical studies of this condition.
There is also a risk of selection bias, which includes having rec-
ruited the healthiest participants, since those with a comorbidity were
excluded from the CRF test. However, by including them, the physical
fitness level would likely have been even lower. Five young partici-
pants (aged 16–18 years) were included in the study. Excluding these
participants in the analysis did not have considerable effect on the
outcome, but would have reduced the statistical power.
Despite having recruited a large proportion of the total estimated
Norwegian population of ACH adults, the sample size limits the possi-
bilities of statistical analyses, and the associations should therefore be
interpreted with caution.
5 | CONCLUSIONS
This cohort of Norwegian adults with ACH had overall low physical
fitness levels, with achievements within a wide range, compared to
Norwegian population reference values. There were no gender differ-
ences within the ACH study sample, except for VO2 peak, where men
performed better. There was a high correlation between VO2 peak
and the 6MWT. The 6MWT and 30sSTS test were feasible to admin-
ister in this population, and appeared to be useful in assessing exer-
cise capacity and muscle strength in adults with ACH.
ACKNOWLEDGEMENTS
We wish to thank all participants who generously donated their time
for this research. Without their involvement, this study would not
have been possible.
Special thanks to the clinical physiology laboratory at Sunnaas
Rehabilitation Hospital for conducting the cardiorespiratory treadmill
test, my internal peer reviewers Kerstin Lundberg Larsen (PT),
Ingeborg Lidal (MD) and to Prof. Ravi Savarirayan for proofreading the
paper.
8 de VRIES ET AL.
CONFLICT OF INTEREST
The authors declare no conflict of interest.
DATA AVAILABILITY STATEMENT
The Norwegian South Eastern Regional Committee for Medical and
Health Research Ethics restrict the data for this study. Due to these
restrictions, potentially identifying patient`s information, data are not
available.
ORCID
Olga Marieke de Vries https://orcid.org/0000-0001-7397-0321
Heidi Johansen https://orcid.org/0000-0002-1396-6715
Svein Otto Fredwall https://orcid.org/0000-0002-2804-5783
REFERENCES
Alade, Y., Tunkel, D., Schulze, K., McGready, J., Jallo, G., Ain, M., …Hoover-Fong, J. (2013). Cross-sectional assessment of pain and physi-
cal function in skeletal dysplasia patients. Clinical Genetics, 84(3),
237–243. https://doi.org/10.1111/cge.12045American Thoracic Society. (2002). ATS statement: Guidelines for the six-
minute walk test. American Journal of Respiratory and Critical Care Med-
icine, 166(1), 111–117. https://doi.org/10.1164/ajrccm.166.1.at1102
Balady, G. J., Arena, R., Sietsema, K., Myers, J., Coke, L., Fletcher, G. F., …Milani, R. V. (2010). Clinician's guide to cardiopulmonary exercise test-
ing in adults: A scientific statement from the American Heart Associa-
tion. Circulation, 122(2), 191–225. https://doi.org/10.1161/CIR.
0b013e3181e52e69
Bassett, D. R., & Howley, E. T. (2000). Limiting factors for maximum oxy-
gen uptake and determinants of endurance performance. Medicine and
Science in Sports and Exercise, 32(1), 70–84.Blair, S. N., & Morris, J. N. (2009). Healthy hearts and the universal bene-
fits of being physically active: Physical activity and health. Annals of
Epidemiology, 19(4), 253–256. https://doi.org/10.1016/j.annepidem.
2009.01.019
Bohannon, R. W., & Crouch, R. (2017). Minimal clinically important differ-
ence for change in 6-minute walk test distance of adults with pathol-
ogy: A systematic review. Journal of Evaluation in Clinical Practice, 23
(2), 377–381. https://doi.org/10.1111/jep.12629Borg, G. (1990). Psychophysical scaling with applications in physical work
and the perception of exertion. Scandinavian Journal of Work, Environ-
ment and Health, 16(Suppl 1), 55–58. https://doi.org/10.5271/sjweh.
1815
Bouchard, C., Blair, S. N., & Haskell, W. L. (2012). Physical activity and
health (2nd ed.). Champaign, IL: Human Kenetics, Inc.
Brown, J. H., Siegmund, P. G., Guskiewicz, M. K., Van Den Doel, M. K.,
Cretu, M. E., & Blouin, M. J.-S. (2014). Development and validation of
an objective balance error scoring system. Medicine and Science in
Sports and Exercise, 46(8), 1610–1616. https://doi.org/10.1249/MSS.
0000000000000263
Burr, J. F., Bredin, S. S., Faktor, M. D., & Warburton, D. E. (2011). The
6-minute walk test as a predictor of objectively measured aerobic fit-
ness in healthy working-aged adults. The Physician and Sportsmedicine,
39(2), 133–139. https://doi.org/10.3810/psm.2011.05.1904
Cohen, J. W. (1988). Statistical power analysis for the behavioral sciences.
Hillsdale, NJ: Lawrence Erlbaum Associates.
Craig, C. L., Marshall, A. L., Sjostrom, M., Bauman, A. E., Booth, M. L.,
Ainsworth, B. E., … Oja, P. (2003). International physical activity ques-
tionnaire: 12-country reliability and validity. Medicine and Science in
Sports and Exercise, 35(8), 1381–1395. https://doi.org/10.1249/01.
Mss.0000078924.61453.Fb
Csuka, M., & McCarty, D. J. (1985). Simple method for measurement of
lower extremity muscle strength. American Journal of Medicine, 78(1),
77–81.Dhiman, N., Albaghdadi, A., Zogg, C. K., Sharma, M., Hoover-Fong, J. E.,
Ain, M. C., & Haider, A. H. (2016). Factors associated with health-
related quality of life (HRQOL) in adults with short stature skeletal
dysplasias. Quality of Life Research, 26, 1–12. https://doi.org/10.1007/s11136-016-1455-7
Edvardsen, E., Scient, C., Hansen, B. H., Holme, I. M., Dyrstad, S. M., &
Anderssen, S. A. (2013). Reference values for cardiorespiratory
response and fitness on the treadmill in a 20- to 85-year-old popula-
tion. Chest, 144(1), 241–248. https://doi.org/10.1378/chest.12-1458Enright, P. L. (2003). The six-minute walk test. Respiratory Care, 48(8),
783–785.Enright, P. L., McBurnie, M. A., Bittner, V., Tracy, R. P., McNamara, R.,
Arnold, A., & Newman, A. B. (2003). The 6-min walk test: A quick mea-
sure of functional status in elderly adults. Chest, 123(2), 387–398.https://doi.org/10.1378/chest.123.2.387
Fredwall, S. O., Steen, U., de Vries, O. M., Rustad, C. F., Eggesbø, H. B.,
Weedon-Fekjær, H., … Maanum, G. (2020). High prevalence of symp-
tomatic spinal stenosis in Norwegian adults with achondroplasia: A
population-based study. Orphanet Journal of Rare Diseases, 15(1), 123.
https://doi.org/10.1186/s13023-020-01397-6.
Gurses, H. N., Zeren, M., Denizoglu Kulli, H., & Durgut, E. (2018). The rela-
tionship of sit-to-stand tests with 6-minute walk test in healthy young
adults. Medicine (Baltimore), 97(1), 1–5. https://doi.org/10.1097/md.
0000000000009489
Haga, N. (2004). Management of disabilities associated with achondropla-
sia. Journal of Orthopaedic Science, 9(1), 103–107. https://doi.org/10.1007/s00776-003-0729-4
Hecht, J. T., Francomano, C. A., Horton, W. A., & Annegers, J. F. (1987).
Mortality in achondroplasia. American Journal of Human Genetics, 41
(3), 454–464.Horton, W. A., Hall, J. G., & Hecht, J. T. (2007). Achondroplasia. The Lancet,
370(9582), 162–172. https://doi.org/10.1016/S0140-6736(07)
61090-3
Hunter, A. G., Bankier, A., Rogers, J. G., Sillence, D., & Scott, C. I., Jr.
(1998). Medical complications of achondroplasia: A multicentre patient
review. Journal of Medical Genetics, 35(9), 705–712.Iverson, G. L., & Koehle, M. S. (2013). Normative data for the balance error
scoring system in adults. Rehabilitation Research and Practice, 2013,
1–5. https://doi.org/10.1155/2013/846418Johansen, H., Andresen, I.-L., Naess, E. E., & Hagen, K. B. (2007). Health
status of adults with short stature: A comparison with the normal pop-
ulation and one well-known chronic disease (rheumatoid arthritis).
Orphanet Journal of Rare Diseases, 2, 10. https://doi.org/10.1186/
1750-1172-2-10.
Jones, C. J., Rikli, R. E., & Beam, W. C. (1999). A 30-s chair-stand test as a
measure of lower body strength in community-residing older adults.
Research Quarterly for Exercise and Sport, 70(2), 113–119. https://doi.org/10.1080/02701367.1999.10608028
Kodama, S., Saito, K., Tanaka, S., Maki, M., Yachi, Y., Asumi, M., … Sone, H.
(2009). Cardiorespiratory fitness as a quantitative predictor of all-
cause mortality and cardiovascular events in healthy men and women:
A meta-analysis. The Journal of the American Medical Association, 301
(19), 2024–2035. https://doi.org/10.1001/jama.2009.681
Kowalski, K., Rhodes, R., Naylor, P., Tuokko, H., & Macdonald, S. (2012).
Direct and indirect measurement of physical activity in older adults: A
systematic review of the literature. International Journal of Behavioral
Nutrition and Physical Activity, 9, 148. https://doi.org/10.1186/1479-
5868-9-148
Kurtze, N., Gundersen, K. T., & Holmen, J. (2003). Selvrapportert fysisk
aktivitet i norske befolkningsundersøkelser-et metodeproblem. Norsk
Epidemiologi, 13(1), 163–170.
de VRIES ET AL. 9
Kurtze, N., Rangul, V., & Hustvedt, B. E. (2008). Reliability and validity of
the international physical activity questionnaire in the Nord-Trondelag
health study (HUNT) population of men. BMC Medical Research Meth-
odology, 8, 63. https://doi.org/10.1186/1471-2288-8-63
Ladenvall, P., Persson, C. U., Mandalenakis, Z., Wilhelmsen, L., Grimby, G.,
Svärdsudd, K., & Hansson, P.-O. (2016). Low aerobic capacity in
middle-aged men associated with increased mortality rates during
45 years of follow-up. European Journal of Preventive Cardiology, 23
(14), 1557–1564. https://doi.org/10.1177/2047487316655466Lundgaard, E., Wouda, M. F., & Strom, V. (2017). A comparative study of
two protocols for treadmill walking exercise testing in ambulating sub-
jects with incomplete spinal cord injury. Spinal Cord, 55(10), 935–939.https://doi.org/10.1038/sc.2017.34
Merker, A., Neumeyer, L., Hertel, N. T., Grigelioniene, G., Makitie, O.,
Mohnike, K., & Hagenas, L. (2018a). Growth in achondroplasia: Devel-
opment of height, weight, head circumference, and body mass index in
a European cohort. American Journal of Medical Genetics. Part A, 176
(8), 1723–1734. https://doi.org/10.1002/ajmg.a.38853
Merker, A., Neumeyer, L., Hertel, N. T., Grigelioniene, G., Mohnike, K., &
Hagenas, L. (2018b). Development of body proportions in achondro-
plasia: Sitting height, leg length, arm span, and foot length. American
Journal of Medical Genetics. Part A, 176(9), 1819–1829. https://doi.org/10.1002/ajmg.a.40356
Miller, M. R., Hankinson, J., Brusasco, V., Burgos, F., Casaburi, R.,
Coates, A., … Wanger, J. (2005). Standardisation of spirometry.
European Respiratory Journal, 26(2), 319–338. https://doi.org/10.
1183/09031936.05.00034805
Myers, J., Prakash, M., Froelicher, V., Do, D., Partington, S., & Atwood, J. E.
(2002). Exercise capacity and mortality among men referred for exer-
cise testing. New England Journal of Medicine, 346(11), 793–801.https://doi.org/10.1056/NEJMoa011858
Pauli, R. M. (2019). Achondroplasia: A comprehensive clinical review.
Orphanet Journal of Rare Diseases, 14, 1. https://doi.org/10.1186/
s13023-018-0972-6
Prince, S. A., Adamo, K., Hamel, M. E., Hardt, J., Gorber, S. C., &
Tremblay, M. (2008). A comparison of direct versus self-report mea-
sures for assessing physical activity in adults: A systematic review.
International Journal of Behavioral Nutrition and Physical Activity, 5, 56.
https://doi.org/10.1186/1479-5868-5-56
Schembre, S. M., & Riebe, D. A. (2011). Non-exercise estimation of VO(2)
max using the international physical activity questionnaire. Measure-
ment in Physical Education and Exercise Science, 15(3), 168–181.https://doi.org/10.1080/1091367x.2011.568369
Sims, D., Onambélé-Pearson, G., Burden, A., Payton, C., & Morse, C.
(2019). Whole-body and segmental analysis of body composition in
adult males with achondroplasia using dual X-ray absorptiometry.
PLoS One, 14(3), e0213806. https://doi.org/10.1371/journal.pone.
0213806
Sims, D. T., Onambele-Pearson, G. L., Burden, A., Payton, C., & Morse, C. I.
(2018a). The oxygen consumption and metabolic cost of walking and
running in adults with Achondroplasia. Frontiers in Physiology, 9, 410.
https://doi.org/10.3389/fphys.2018.00410
Sims, D. T., Onambele-Pearson, G. L., Burden, A., Payton, C., & Morse, C. I.
(2018b). Specific force of the vastus lateralis in adults with achondro-
plasia. Journal of Applied Physiology, 124(3), 696–703. https://doi.org/10.1152/japplphysiol.00638.2017
Stokes, D. C., Pyeritz, R. E., Wise, R. A., Fairclough, D., & Murphy, E. A.
(1988). Spirometry and chest wall dimensions in achondroplasia. Chest,
93(2), 364–369.Stokes, D. C., Wohl, M. E., Wise, R. A., Pyeritz, R. E., & Fairclough, D. L.
(1990). The lungs and airways in achondroplasia. Do little people have
little lungs? Chest, 98(1), 145–152.Takken, T., van Bergen, M. W., Sakkers, R. J., Helders, P. J., &
Engelbert, R. H. (2007). Cardiopulmonary exercise capacity, muscle
strength, and physical activity in children and adolescents with achon-
droplasia. Journal of Pediatrics, 150(1), 26–30. https://doi.org/10.
1016/j.jpeds.2006.10.058
The IPAQ group. (2020) International physical activity questionnaire.
Retrieved from http://www.ipaq.ki.se
Tveter, A. T., Dagfinrud, H., Moseng, T., & Holm, I. (2014). Measuring
health-related physical fitness in physiotherapy practice: Reliability,
validity, and feasibility of clinical field tests and a patient-reported
measure. Journal of Orthopaedic and Sports Physical Therapy, 44(3),
206–216. https://doi.org/10.2519/jospt.2014.5042Tveter, A. T., Moseng, T., Dagfinrud, H., & Holm, I. (2013). Health-related
physical fitness testing in physiotherapy practice-reference values.
Annals of the Rheumatic Diseases, 72, 1095–1095.von Elm, E., Altman, D. G., Egger, M., Pocock, S. J., Gotzsche, P. C., &
Vandenbroucke, J. P. (2014). The strengthening the reporting of observa-
tional studies in epidemiology (STROBE) statement: Guidelines for
reporting observational studies. International Journal of Surgery (London,
England), 12(12), 1495–1499. https://doi.org/10.1016/j.ijsu.2014.07.013Whittle, m. w. (2007). Gait analysis an introduction (4th ed.). London, UK:
Butterworth Heinemann.
Wright, M. J., & Irving, M. D. (2012). Clinical management of achondropla-
sia. Archives of Disease in Childhood, 97(2), 129–134. https://doi.org/10.1136/adc.2010.189092
Wynn, J., King, T. M., Gambello, M. J., Waller, D. K., & Hecht, J. T. (2007).
Mortality in achondroplasia study: A 42-year follow-up. American Jour-
nal of Medical Genetics. Part A, 143a(21), 2502–2511. https://doi.org/10.1002/ajmg.a.31919
How to cite this article: de Vries OM, Johansen H,
Fredwall SO. Physical fitness and activity level in Norwegian
adults with achondroplasia. Am J Med Genet Part A. 2020;
1–10. https://doi.org/10.1002/ajmg.a.62055
10 de VRIES ET AL.
Recommended