Physical and economic analysis of energy transition scenarios*
Methodology & first results
Sandra Bouneau, Laurent Audouin, Xavier Doligez, Marc Ernoult, Lise Eychène, Abdoul-Aziz Zakari-Issoufou Institut de Physique Nucléaire d’Orsay – Université Paris Sud / IN2P3 – CNRS Gaël Giraud Centre d’économie de la Sorbonne – INSHS / CNRS Anthony Dufour, Marie-Noëlle Pons, Jean-François Portha Laboratoire Réactions & Génie des Procédés – Université de Lorraine / INSIS – CNRS * financial support APESE Project 2015-2017 / mission for interdisciplinarity - CNRS
Les Houches 2018
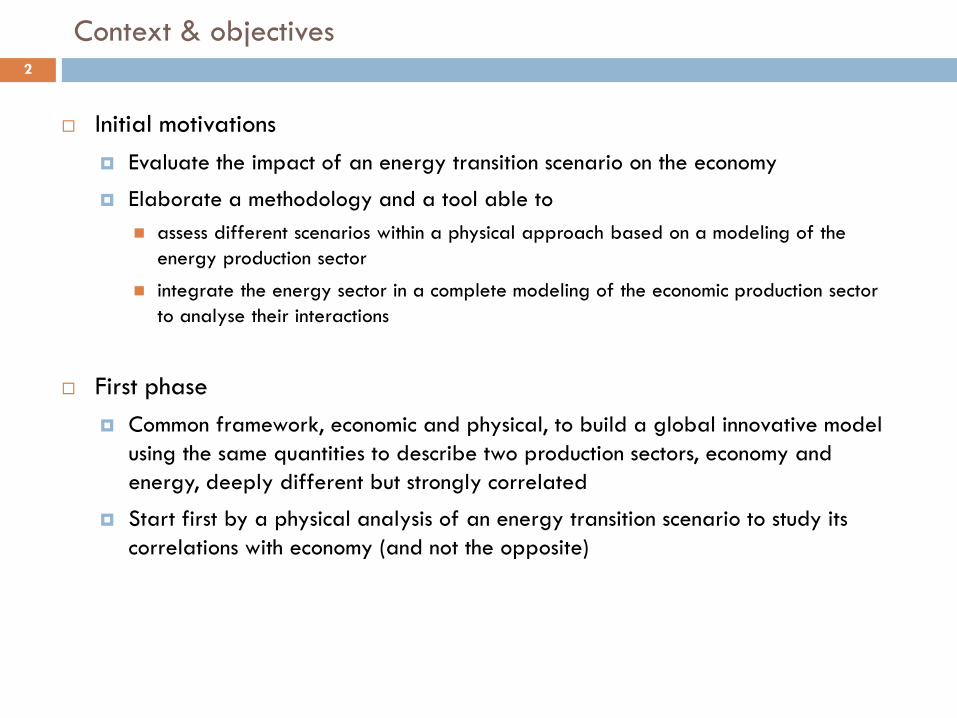
Context & objectives
Initial motivations Evaluate the impact of an energy transition scenario on the economy
Elaborate a methodology and a tool able to assess different scenarios within a physical approach based on a modeling of the
energy production sector
integrate the energy sector in a complete modeling of the economic production sector to analyse their interactions
First phase Common framework, economic and physical, to build a global innovative model
using the same quantities to describe two production sectors, economy and energy, deeply different but strongly correlated
Start first by a physical analysis of an energy transition scenario to study its correlations with economy (and not the opposite)
2
Model basis
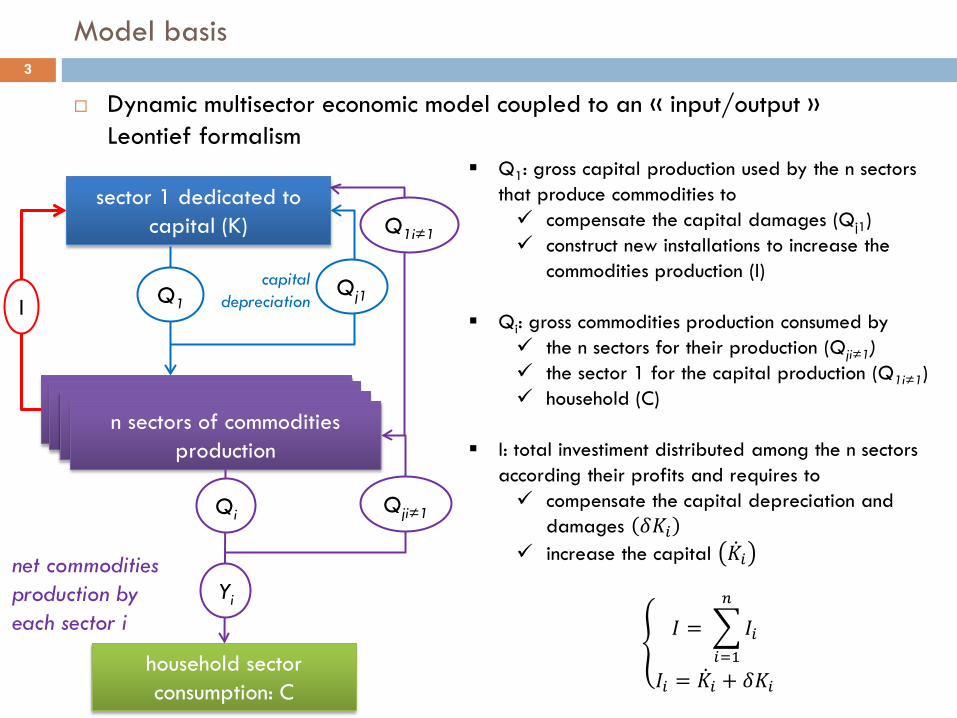
Dynamic multisector economic model coupled to an « input/output » Leontief formalism
3
sector 1 dedicated to capital (K)
n secteurs de productions de biens de consommation
n secteurs de productions de biens de consommation
n secteurs de productions de biens de consommation n sectors of commodities
production
household sector consumption: C
Q1 Qj1
Qi Qji≠1
Q1i≠1
I capital
depreciation
Q1: gross capital production used by the n sectors that produce commodities to compensate the capital damages (Qj1) construct new installations to increase the
commodities production (I)
Qi: gross commodities production consumed by the n sectors for their production (Qji≠1) the sector 1 for the capital production (Q1i≠1) household (C)
I: total investiment distributed among the n sectors according their profits and requires to compensate the capital depreciation and
damages 𝛿𝛿𝐾𝐾𝑖𝑖 increase the capital �̇�𝐾𝑖𝑖
�𝐼𝐼 = �𝐼𝐼𝑖𝑖
𝑛𝑛
𝑖𝑖=1𝐼𝐼𝑖𝑖 = �̇�𝐾𝑖𝑖 + 𝛿𝛿𝐾𝐾𝑖𝑖
Yi
net commodities production by each sector i
Model basis 4
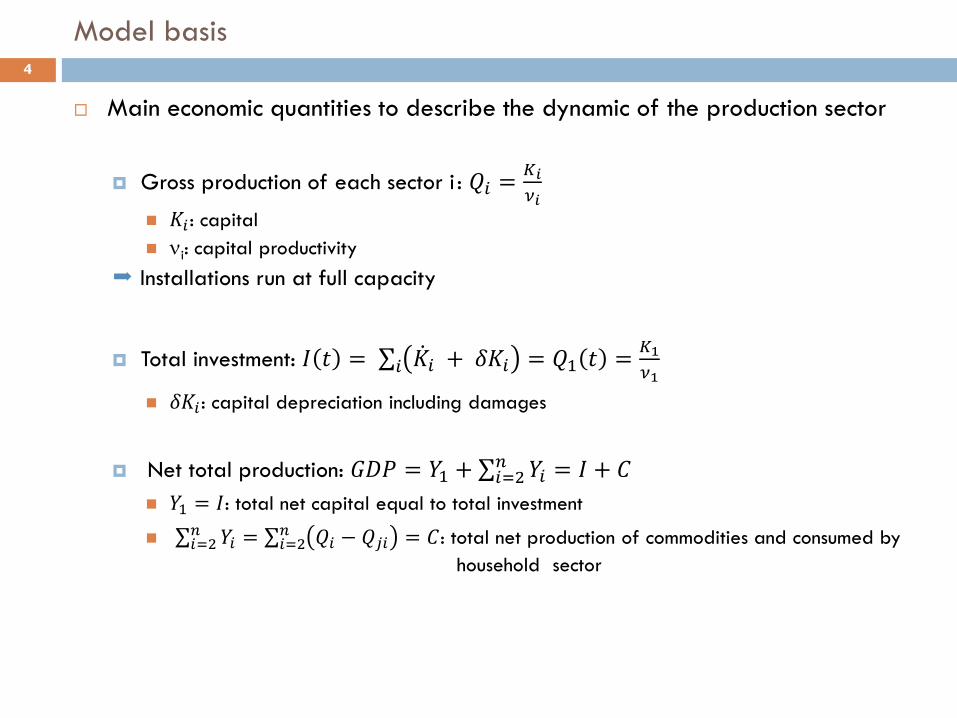
Main economic quantities to describe the dynamic of the production sector
Gross production of each sector i : 𝑄𝑄𝑖𝑖 = 𝐾𝐾𝑖𝑖𝜈𝜈𝑖𝑖
𝐾𝐾𝑖𝑖 : capital νi: capital productivity
Installations run at full capacity
Total investment: 𝐼𝐼 𝑡𝑡 = ∑ �̇�𝐾𝑖𝑖 + 𝛿𝛿𝐾𝐾𝑖𝑖𝑖𝑖 = 𝑄𝑄1 𝑡𝑡 = 𝐾𝐾1𝜈𝜈1
𝛿𝛿𝐾𝐾𝑖𝑖 : capital depreciation including damages
Net total production: 𝐺𝐺𝐺𝐺𝐺𝐺 = 𝑌𝑌1 + ∑ 𝑌𝑌𝑖𝑖 = 𝐼𝐼 + 𝐶𝐶𝑛𝑛𝑖𝑖=2
𝑌𝑌1 = 𝐼𝐼: total net capital equal to total investment
∑ 𝑌𝑌𝑖𝑖𝑛𝑛𝑖𝑖=2 = ∑ 𝑄𝑄𝑖𝑖 − 𝑄𝑄𝑗𝑗𝑖𝑖 = 𝐶𝐶𝑛𝑛
𝑖𝑖=2 : total net production of commodities and consumed by household sector
Energy sector description 5
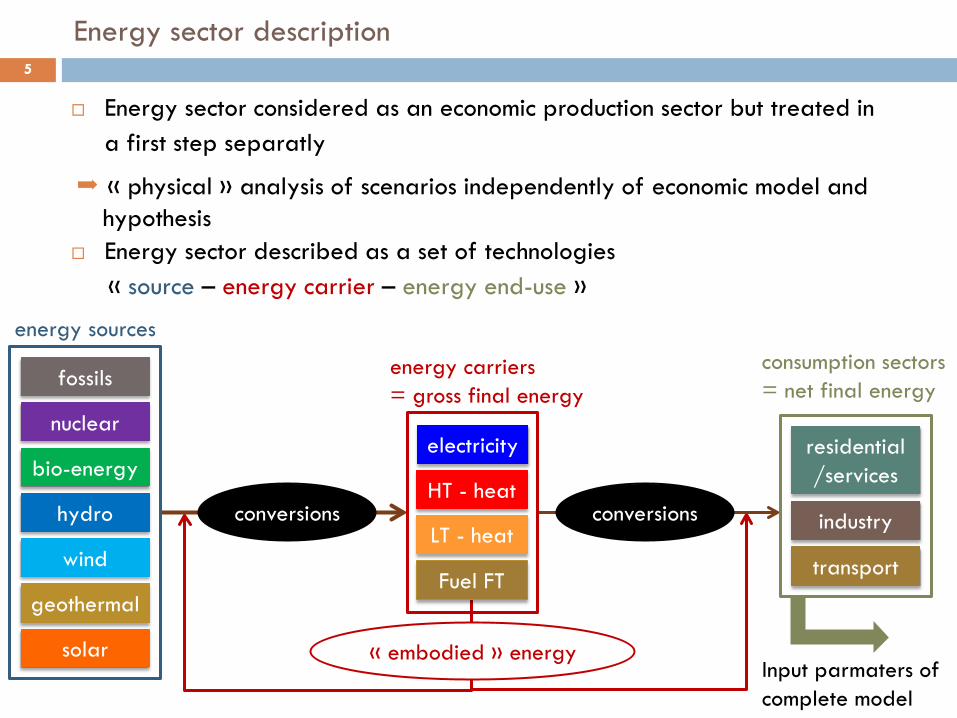
Energy sector considered as an economic production sector but treated in a first step separatly
« physical » analysis of scenarios independently of economic model and hypothesis
Energy sector described as a set of technologies « source – energy carrier – energy end-use »
energy sources
energy carriers = gross final energy
consumption sectors = net final energy
electricity
HT - heat
LT - heat
Fuel FT geothermal
fossils
hydro
wind
bio-energy
nuclear
solar
residential/services
industry
transport
conversions conversions
« embodied » energy Input parmaters of complete model
Energy sector modeling 6
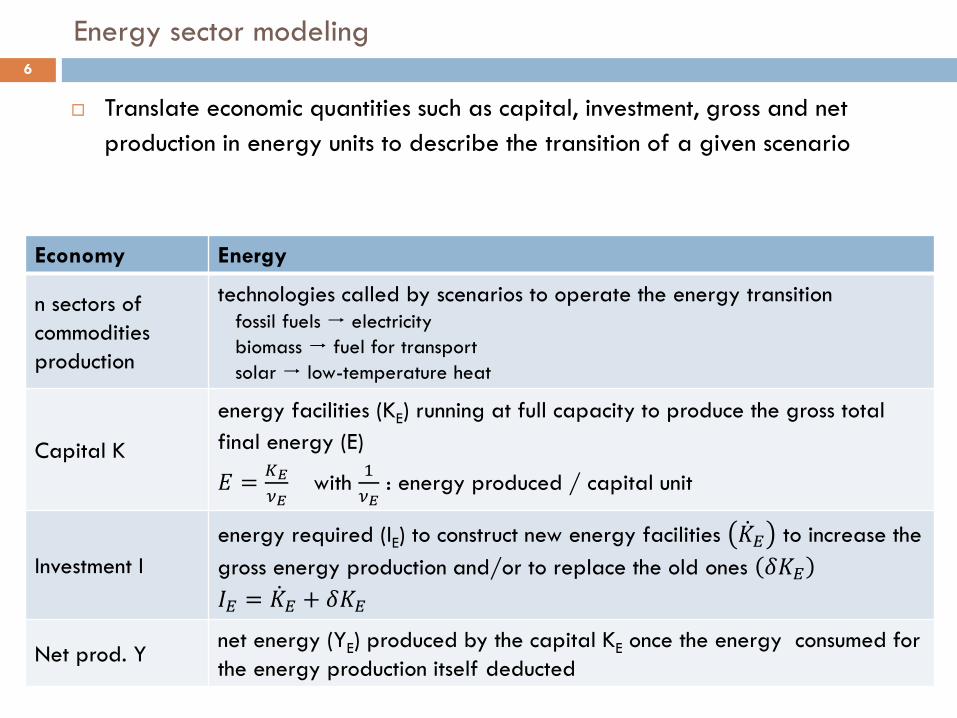
Translate economic quantities such as capital, investment, gross and net production in energy units to describe the transition of a given scenario
Economy Energy
n sectors of commodities production
technologies called by scenarios to operate the energy transition fossil fuels electricity biomass fuel for transport solar low-temperature heat
Capital K
energy facilities (KE) running at full capacity to produce the gross total final energy (E)
𝐸𝐸 = 𝐾𝐾𝐸𝐸𝜈𝜈𝐸𝐸
with 1𝜈𝜈𝐸𝐸
: energy produced / capital unit
Investment I energy required (IE) to construct new energy facilities �̇�𝐾𝐸𝐸 to increase the gross energy production and/or to replace the old ones 𝛿𝛿𝐾𝐾𝐸𝐸 𝐼𝐼𝐸𝐸 = �̇�𝐾𝐸𝐸 + 𝛿𝛿𝐾𝐾𝐸𝐸
Net prod. Y net energy (YE) produced by the capital KE once the energy consumed for the energy production itself deducted
n secteurs de productions de biens de consommation
n secteurs de productions de biens de consommation
n secteurs de productions de biens de consommation technologies for source end-use energy conversion
Energy sector modeling / Energy transition scenario analysis
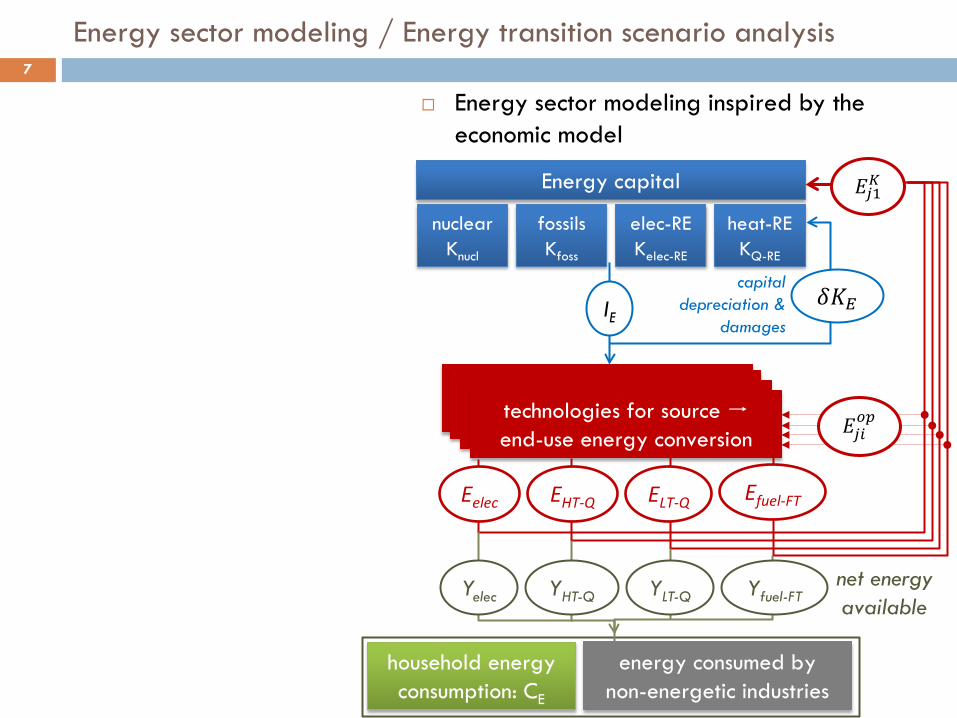
Energy sector modeling inspired by the economic model
7
Energy capital
nuclear Knucl
fossils Kfoss
elec-RE Kelec-RE
heat-RE KQ-RE
IE 𝛿𝛿𝐾𝐾𝐸𝐸
𝐸𝐸𝑗𝑗𝑖𝑖𝑜𝑜𝑜𝑜
𝐸𝐸𝑗𝑗1𝐾𝐾
household energy consumption: CE
energy consumed by non-energetic industries
capital depreciation &
damages
EHT-Q Eelec ELT-Q Efuel-FT
net energy available
Yelec Yfuel-FT YHT-Q YLT-Q
n secteurs de productions de biens de consommation
n secteurs de productions de biens de consommation
n secteurs de productions de biens de consommation technologies for source end-use energy conversion
Energy sector modeling / Energy transition scenario analysis
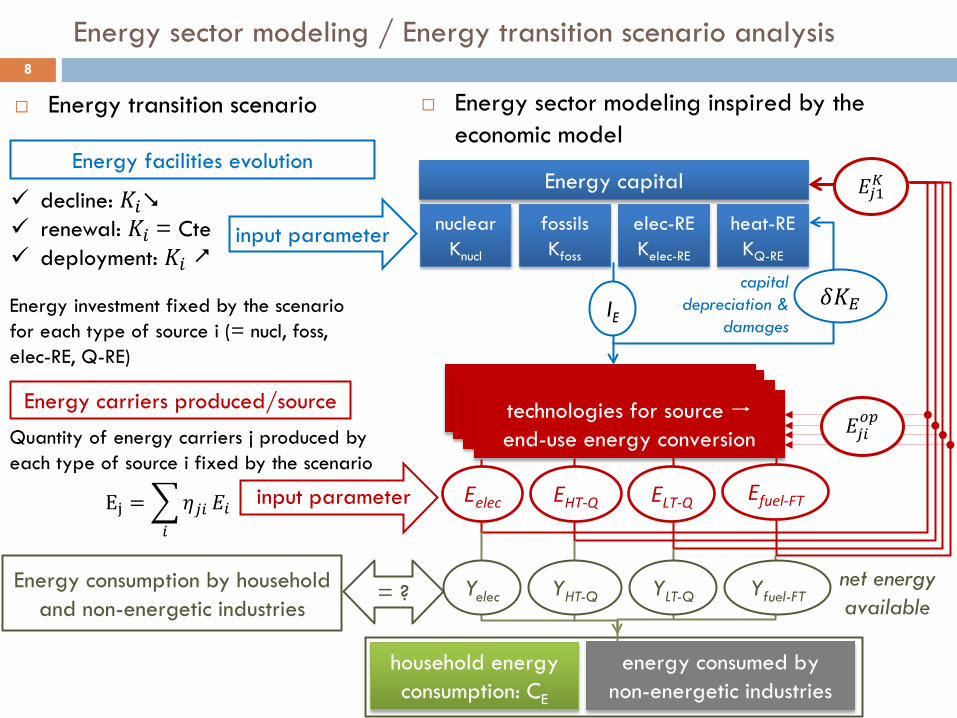
Energy sector modeling inspired by the economic model
8
Energy capital
nuclear Knucl
fossils Kfoss
elec-RE Kelec-RE
heat-RE KQ-RE
IE 𝛿𝛿𝐾𝐾𝐸𝐸
𝐸𝐸𝑗𝑗𝑖𝑖𝑜𝑜𝑜𝑜
𝐸𝐸𝑗𝑗1𝐾𝐾
household energy consumption: CE
energy consumed by non-energetic industries
capital depreciation &
damages
EHT-Q Eelec ELT-Q Efuel-FT
net energy available
Yelec Yfuel-FT YHT-Q YLT-Q
Energy facilities evolution
Energy investment fixed by the scenario for each type of source i (= nucl, foss, elec-RE, Q-RE)
Energy carriers produced/source Quantity of energy carriers j produced by each type of source i fixed by the scenario
Ej = �𝜂𝜂𝑗𝑗𝑖𝑖𝑖𝑖
𝐸𝐸𝑖𝑖
Energy consumption by household and non-energetic industries
decline: 𝐾𝐾𝑖𝑖 renewal: 𝐾𝐾𝑖𝑖 = Cte deployment: 𝐾𝐾𝑖𝑖
input parameter
input parameter
Energy transition scenario
= ?
Energy sector modeling / Energy transition scenario analysis 9
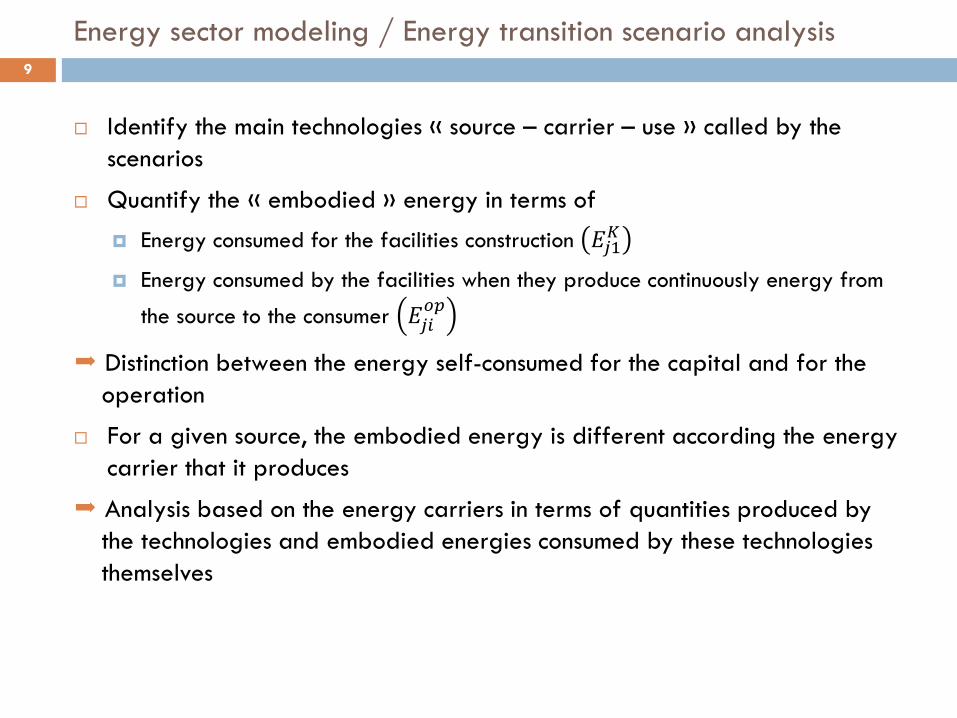
Identify the main technologies « source – carrier – use » called by the scenarios
Quantify the « embodied » energy in terms of Energy consumed for the facilities construction 𝐸𝐸𝑗𝑗1𝐾𝐾
Energy consumed by the facilities when they produce continuously energy from
the source to the consumer 𝐸𝐸𝑗𝑗𝑖𝑖𝑜𝑜𝑜𝑜
Distinction between the energy self-consumed for the capital and for the operation
For a given source, the embodied energy is different according the energy carrier that it produces
Analysis based on the energy carriers in terms of quantities produced by the technologies and embodied energies consumed by these technologies themselves
Energy sector modeling / « Embodied » energy 10
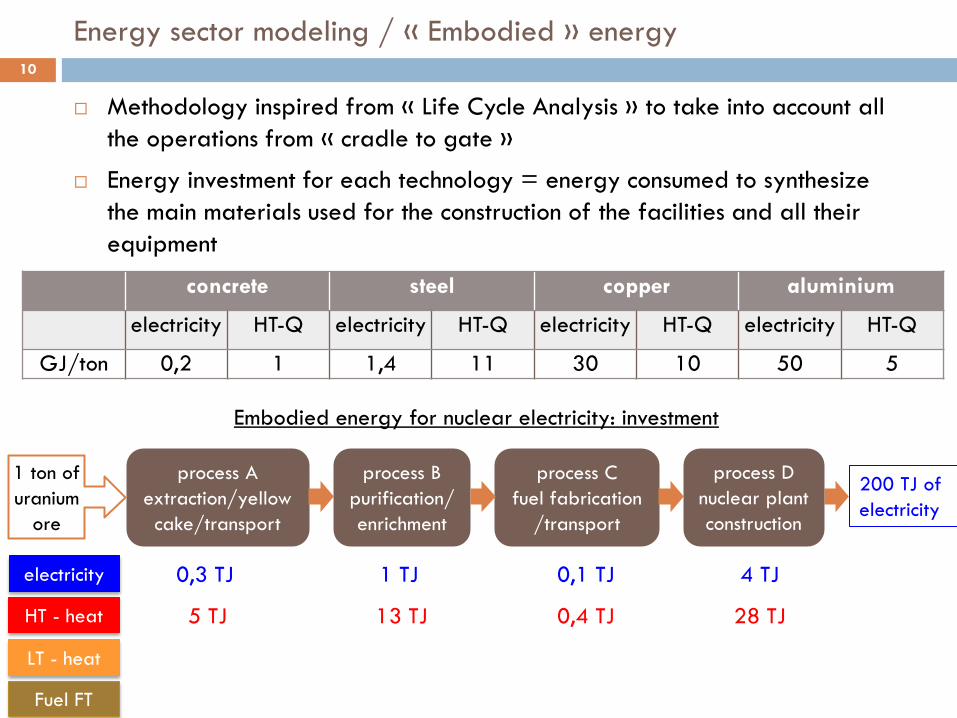
Methodology inspired from « Life Cycle Analysis » to take into account all the operations from « cradle to gate »
Energy investment for each technology = energy consumed to synthesize the main materials used for the construction of the facilities and all their equipment
concrete steel copper aluminium
electricity HT-Q electricity HT-Q electricity HT-Q electricity HT-Q
GJ/ton 0,2 1 1,4 11 30 10 50 5
process A extraction/yellow cake/transport
process B purification/ enrichment
process C fuel fabrication
/transport
1 ton of uranium
ore
process D nuclear plant construction
200 TJ of electricity
electricity
HT - heat
LT - heat
Fuel FT
0,3 TJ
Embodied energy for nuclear electricity: investment
1 TJ 0,1 TJ 4 TJ
5 TJ 13 TJ 0,4 TJ 28 TJ
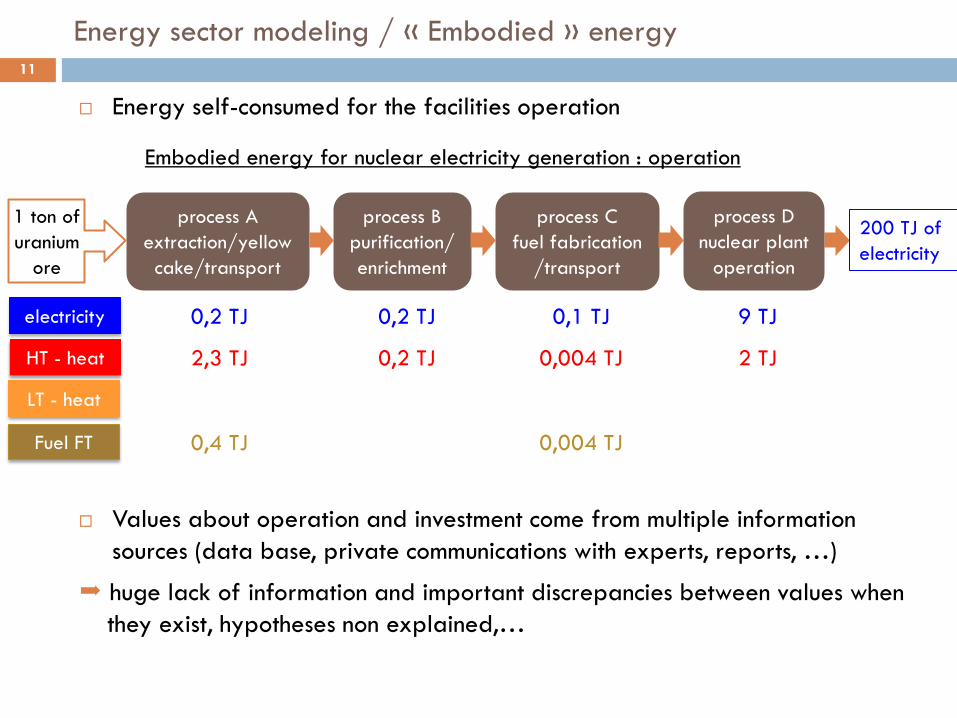
Energy sector modeling / « Embodied » energy 11
Energy self-consumed for the facilities operation
Values about operation and investment come from multiple information sources (data base, private communications with experts, reports, …)
huge lack of information and important discrepancies between values when they exist, hypotheses non explained,…
process A extraction/yellow cake/transport
process B purification/ enrichment
process C fuel fabrication
/transport
1 ton of uranium
ore
process D nuclear plant
operation
200 TJ of electricity
electricity
HT - heat
LT - heat
Fuel FT
Embodied energy for nuclear electricity generation : operation
0,2 TJ 0,2 TJ 0,1 TJ 9 TJ
0,4 TJ
2,3 TJ 0,2 TJ
0,004 TJ
0,004 TJ 2 TJ
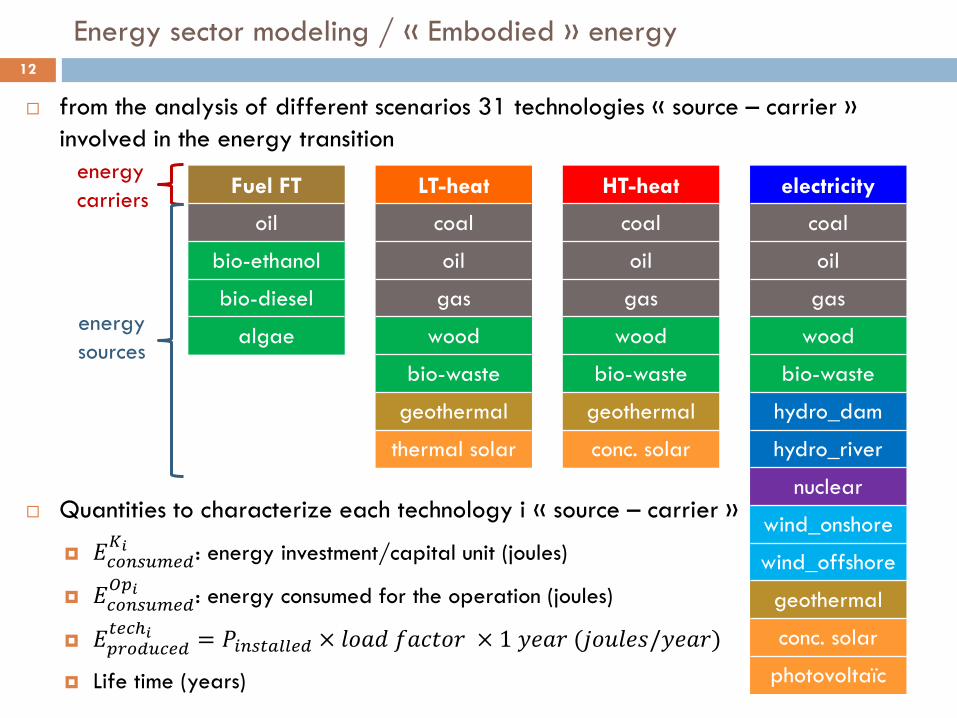
Energy sector modeling / « Embodied » energy 12
from the analysis of different scenarios 31 technologies « source – carrier » involved in the energy transition
Quantities to characterize each technology i « source – carrier »
𝐸𝐸𝑐𝑐𝑜𝑜𝑛𝑛𝑐𝑐𝑐𝑐𝑐𝑐𝑐𝑐𝑐𝑐𝐾𝐾𝑖𝑖 : energy investment/capital unit (joules)
𝐸𝐸𝑐𝑐𝑜𝑜𝑛𝑛𝑐𝑐𝑐𝑐𝑐𝑐𝑐𝑐𝑐𝑐𝑂𝑂𝑜𝑜𝑖𝑖 : energy consumed for the operation (joules)
𝐸𝐸𝑜𝑜𝑝𝑝𝑜𝑜𝑐𝑐𝑐𝑐𝑐𝑐𝑐𝑐𝑐𝑐𝑡𝑡𝑐𝑐𝑐𝑐𝑡𝑖𝑖 = 𝐺𝐺𝑖𝑖𝑛𝑛𝑐𝑐𝑡𝑡𝑖𝑖𝑖𝑖𝑖𝑖𝑐𝑐𝑐𝑐 × 𝑙𝑙𝑙𝑙𝑙𝑙𝑙𝑙 𝑓𝑓𝑙𝑙𝑓𝑓𝑡𝑡𝑙𝑙𝑓𝑓 × 1 𝑦𝑦𝑦𝑦𝑙𝑙𝑓𝑓 (𝑗𝑗𝑙𝑙𝑗𝑗𝑙𝑙𝑦𝑦𝑗𝑗/𝑦𝑦𝑦𝑦𝑙𝑙𝑓𝑓)
Life time (years)
Fuel FT
oil bio-ethanol bio-diesel
algae
LT-heat
coal oil gas
wood bio-waste
geothermal thermal solar
energy carriers HT-heat
coal oil gas
wood bio-waste
geothermal conc. solar
electricity
coal oil gas
wood bio-waste
hydro_dam hydro_river
nuclear wind_onshore wind_offshore
geothermal conc. solar
photovoltaïc
energy sources
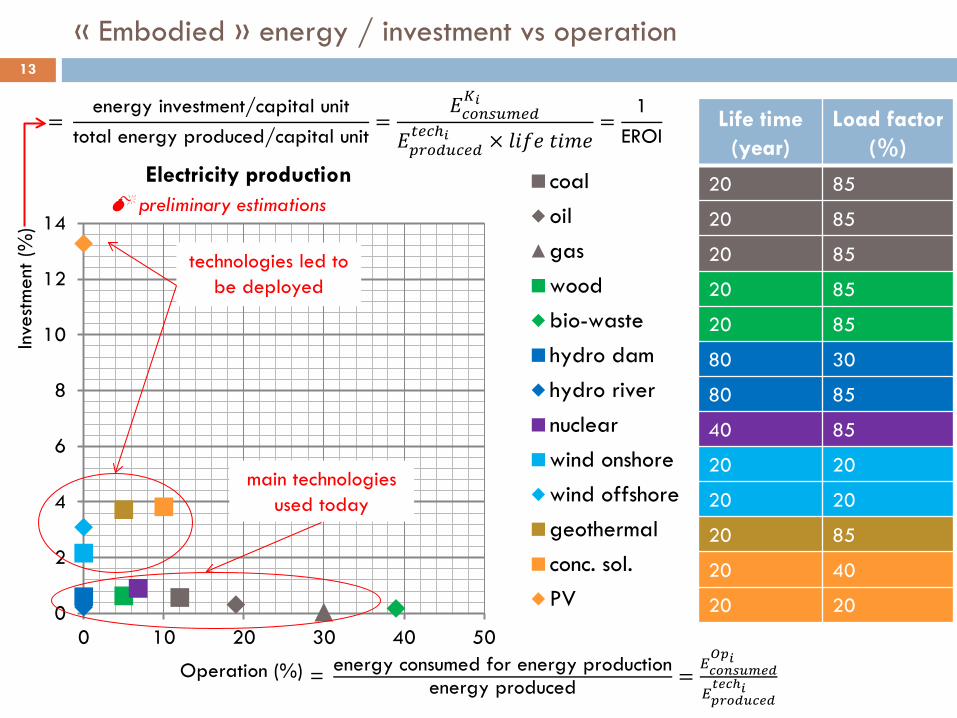
« Embodied » energy / investment vs operation 13
Life time (year)
Load factor (%)
20 85
20 85
20 85
20 85
20 85
80 30
80 85
40 85
20 20
20 20
20 85
20 40
20 20 0
2
4
6
8
10
12
14
0 10 20 30 40 50
Inve
stm
ent (
%)
Operation (%)
Electricity production coaloilgaswoodbio-wastehydro damhydro rivernuclearwind onshorewind offshoregeothermalconc. sol.PV
technologies led to be deployed
= energy investment/capital unit
total energy produced/capital unit=
𝐸𝐸𝑐𝑐𝑜𝑜𝑛𝑛𝑐𝑐𝑐𝑐𝑐𝑐𝑐𝑐𝑐𝑐𝐾𝐾𝑖𝑖
𝐸𝐸𝑜𝑜𝑝𝑝𝑜𝑜𝑐𝑐𝑐𝑐𝑐𝑐𝑐𝑐𝑐𝑐𝑡𝑡𝑐𝑐𝑐𝑐𝑡𝑖𝑖 × 𝑙𝑙𝑙𝑙𝑓𝑓𝑦𝑦 𝑡𝑡𝑙𝑙𝑡𝑡𝑦𝑦
=1
EROI
main technologies used today
= energy consumed for energy productionenergy produced =
𝐸𝐸𝑐𝑐𝑐𝑐𝑐𝑐𝑐𝑐𝑐𝑐𝑐𝑐𝑐𝑐𝑐𝑐𝑂𝑂𝑂𝑂𝑖𝑖
𝐸𝐸𝑂𝑂𝑝𝑝𝑐𝑐𝑐𝑐𝑐𝑐𝑐𝑐𝑐𝑐𝑐𝑐𝑡𝑡𝑐𝑐𝑐𝑐𝑡𝑖𝑖
preliminary estimations
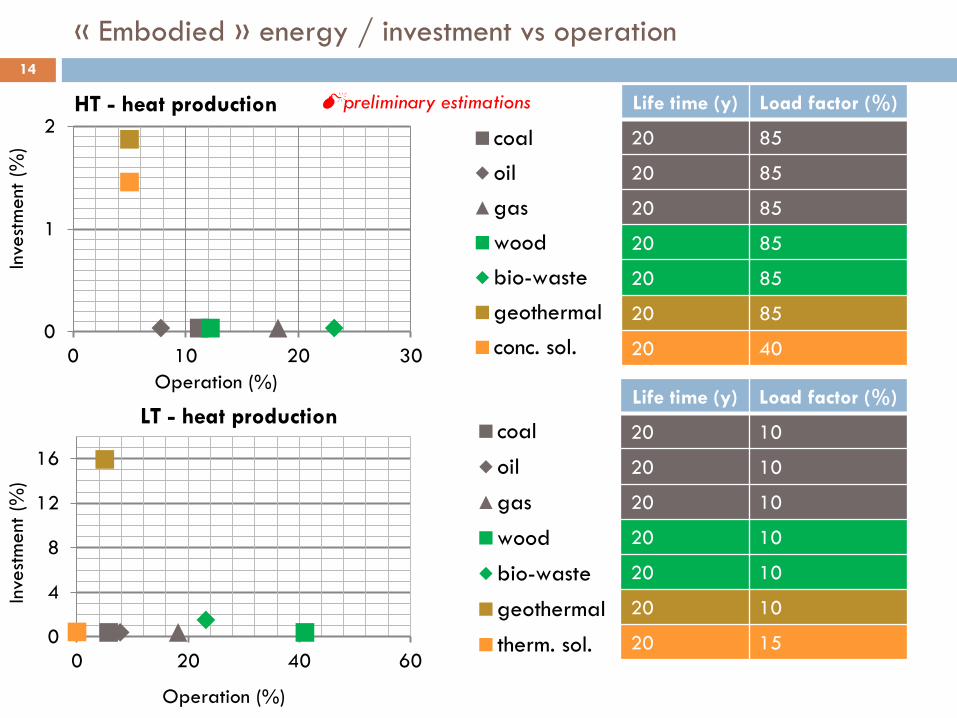
« Embodied » energy / investment vs operation 14
0
1
2
0 10 20 30
Inve
stm
ent (
%)
Operation (%)
HT - heat production coaloilgaswoodbio-wastegeothermalconc. sol.
0
4
8
12
16
0 20 40 60
Inve
stm
ent (
%)
Operation (%)
LT - heat production coaloilgaswoodbio-wastegeothermaltherm. sol.
Life time (y) Load factor (%)
20 85
20 85
20 85
20 85
20 85
20 85
20 40
Life time (y) Load factor (%)
20 10
20 10
20 10
20 10
20 10
20 10
20 15
preliminary estimations
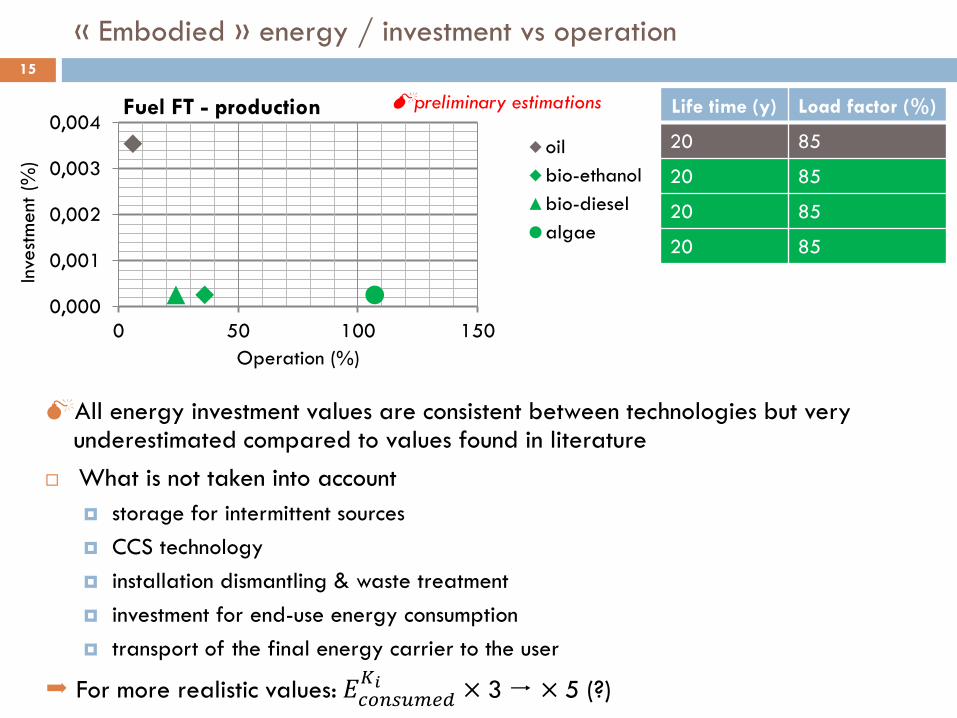
« Embodied » energy / investment vs operation 15
Life time (y) Load factor (%)
20 85
20 85
20 85
20 85
0,000
0,001
0,002
0,003
0,004
0 50 100 150
Inve
stm
ent (
%)
Operation (%)
Fuel FT - production
oilbio-ethanolbio-dieselalgae
All energy investment values are consistent between technologies but very underestimated compared to values found in literature
What is not taken into account storage for intermittent sources CCS technology installation dismantling & waste treatment investment for end-use energy consumption transport of the final energy carrier to the user
For more realistic values: 𝐸𝐸𝑐𝑐𝑜𝑜𝑛𝑛𝑐𝑐𝑐𝑐𝑐𝑐𝑐𝑐𝑐𝑐𝐾𝐾𝑖𝑖 × 3 × 5 (?)
preliminary estimations
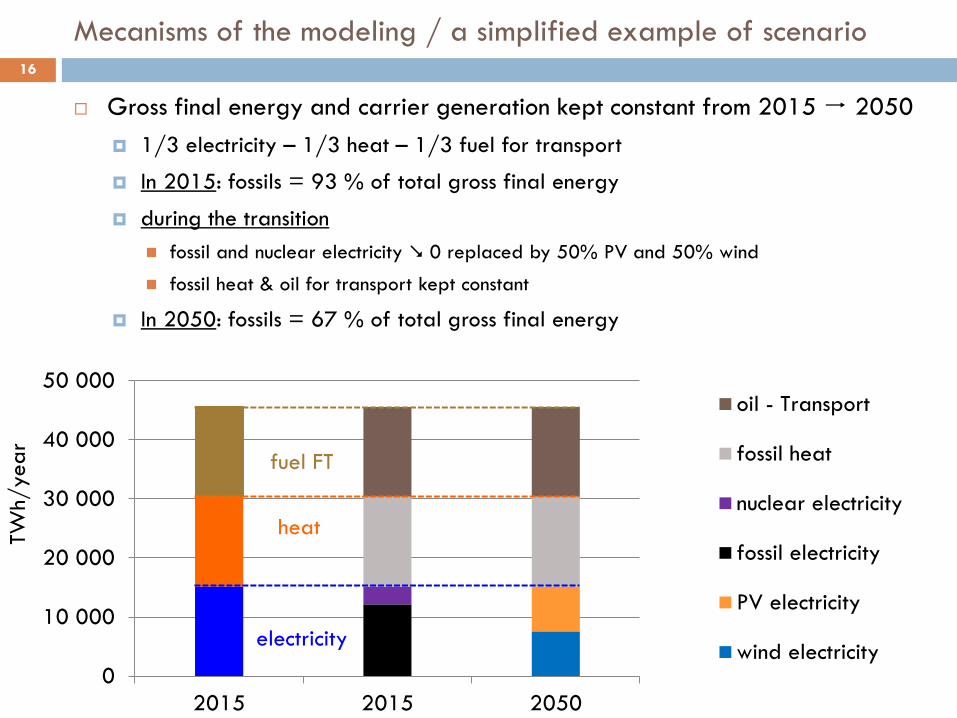
16
Gross final energy and carrier generation kept constant from 2015 2050 1/3 electricity – 1/3 heat – 1/3 fuel for transport
In 2015: fossils = 93 % of total gross final energy
during the transition fossil and nuclear electricity 0 replaced by 50% PV and 50% wind
fossil heat & oil for transport kept constant
In 2050: fossils = 67 % of total gross final energy
0
10 000
20 000
30 000
40 000
50 000
2015 2015 2050
TWh/
year
oil - Transport
fossil heat
nuclear electricity
fossil electricity
PV electricity
wind electricityelectricity
heat
fuel FT
Mecanisms of the modeling / a simplified example of scenario
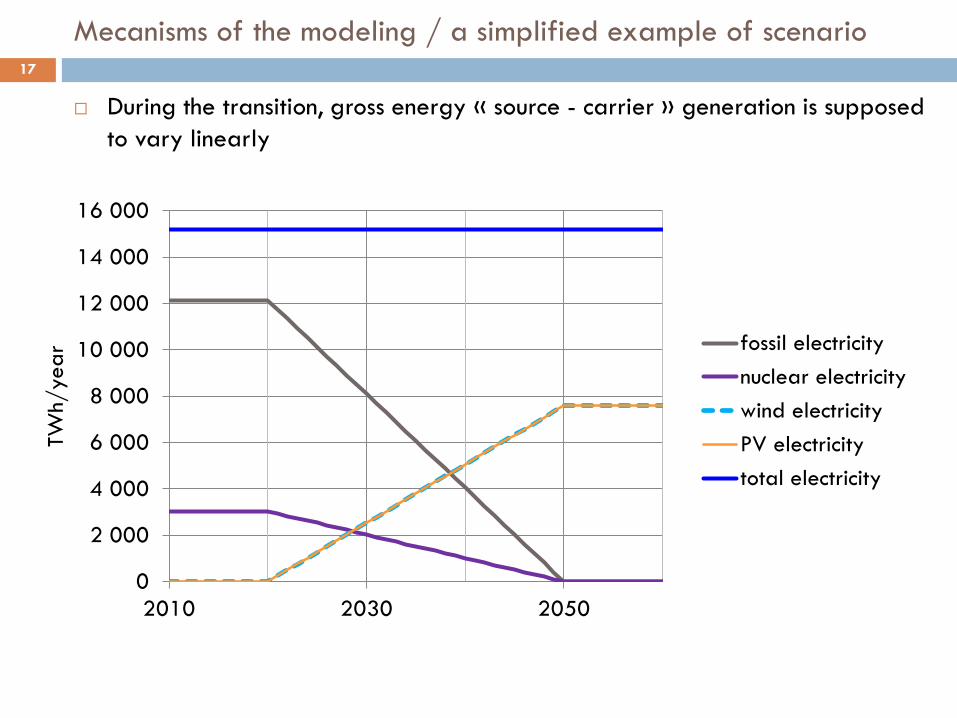
17
0
2 000
4 000
6 000
8 000
10 000
12 000
14 000
16 000
2010 2030 2050
TWh/
year
fossil electricitynuclear electricitywind electricityPV electricitytotal electricity
During the transition, gross energy « source - carrier » generation is supposed to vary linearly
Mecanisms of the modeling / a simplified example of scenario
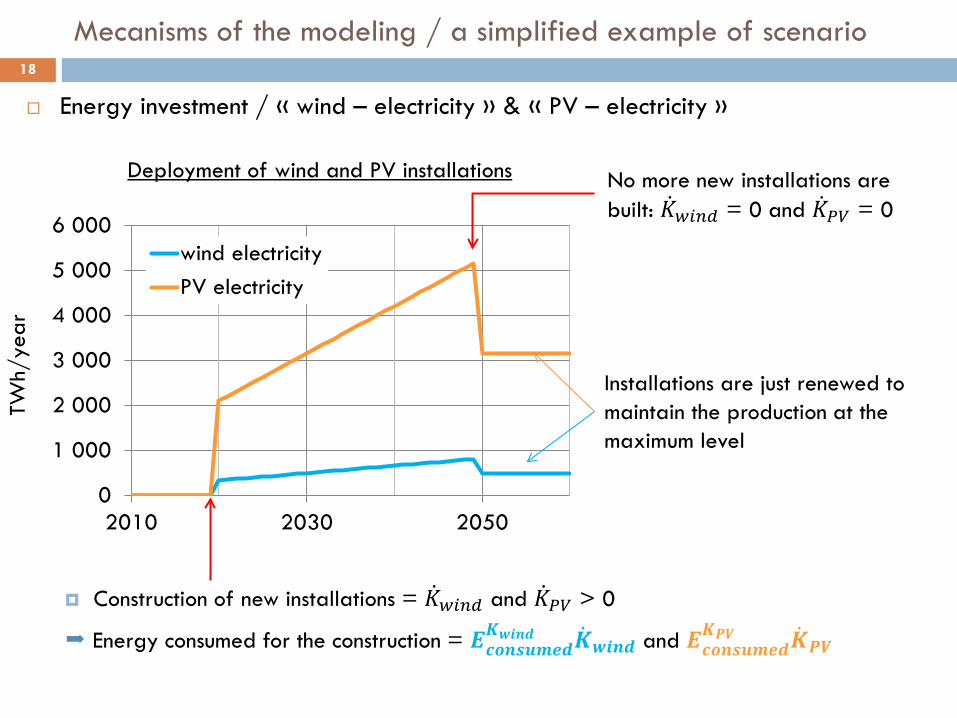
Energy investment / « wind – electricity » & « PV – electricity »
Construction of new installations = �̇�𝐾𝑤𝑤𝑖𝑖𝑛𝑛𝑐𝑐 and �̇�𝐾𝑃𝑃𝑃𝑃 > 0
Energy consumed for the construction = 𝑬𝑬𝒄𝒄𝒄𝒄𝒄𝒄𝒄𝒄𝒄𝒄𝒄𝒄𝒄𝒄𝒄𝒄𝑲𝑲𝒘𝒘𝒘𝒘𝒄𝒄𝒄𝒄 �̇�𝑲𝒘𝒘𝒘𝒘𝒄𝒄𝒄𝒄 and 𝑬𝑬𝒄𝒄𝒄𝒄𝒄𝒄𝒄𝒄𝒄𝒄𝒄𝒄𝒄𝒄𝒄𝒄
𝑲𝑲𝑷𝑷𝑷𝑷 �̇�𝑲𝑷𝑷𝑷𝑷
18
0
1 000
2 000
3 000
4 000
5 000
6 000
2010 2030 2050
TWh/
year
wind electricityPV electricity
Deployment of wind and PV installations No more new installations are built: �̇�𝐾𝑤𝑤𝑖𝑖𝑛𝑛𝑐𝑐 = 0 and �̇�𝐾𝑃𝑃𝑃𝑃 = 0
Installations are just renewed to maintain the production at the maximum level
Mecanisms of the modeling / a simplified example of scenario
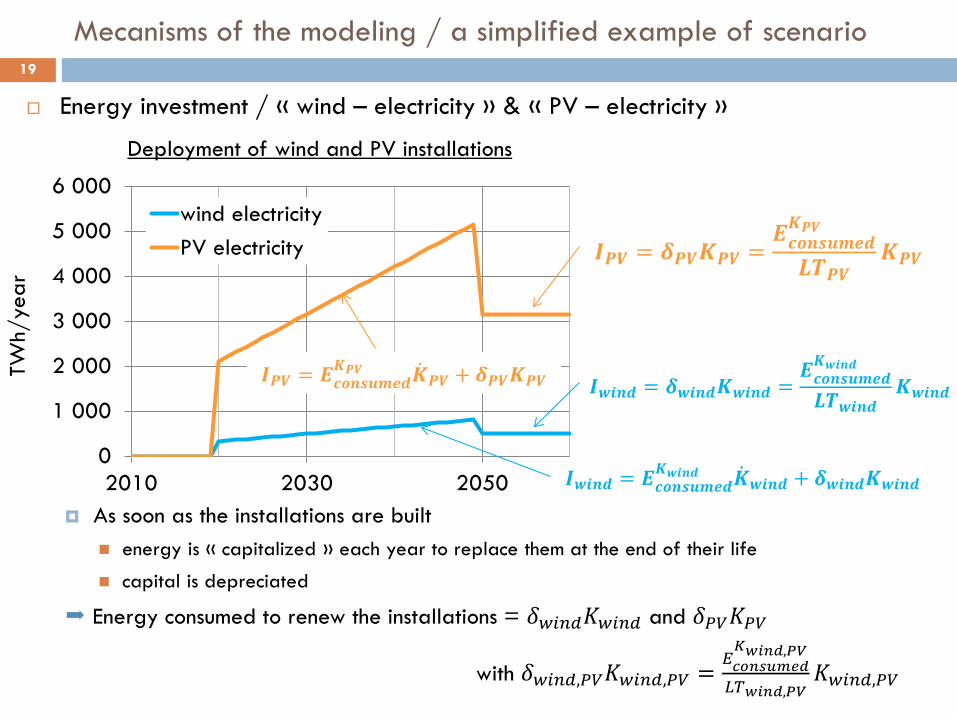
Energy investment / « wind – electricity » & « PV – electricity »
As soon as the installations are built
energy is « capitalized » each year to replace them at the end of their life
capital is depreciated
Energy consumed to renew the installations = 𝛿𝛿𝑤𝑤𝑖𝑖𝑛𝑛𝑐𝑐𝐾𝐾𝑤𝑤𝑖𝑖𝑛𝑛𝑐𝑐 and 𝛿𝛿𝑃𝑃𝑃𝑃𝐾𝐾𝑃𝑃𝑃𝑃
with 𝛿𝛿𝑤𝑤𝑖𝑖𝑛𝑛𝑐𝑐,𝑃𝑃𝑃𝑃𝐾𝐾𝑤𝑤𝑖𝑖𝑛𝑛𝑐𝑐,𝑃𝑃𝑃𝑃 = 𝐸𝐸𝑐𝑐𝑐𝑐𝑐𝑐𝑐𝑐𝑐𝑐𝑐𝑐𝑐𝑐𝑐𝑐𝐾𝐾𝑤𝑤𝑖𝑖𝑐𝑐𝑐𝑐,𝑃𝑃𝑃𝑃
𝐿𝐿𝐿𝐿𝑤𝑤𝑖𝑖𝑐𝑐𝑐𝑐,𝑃𝑃𝑃𝑃𝐾𝐾𝑤𝑤𝑖𝑖𝑛𝑛𝑐𝑐,𝑃𝑃𝑃𝑃
19
0
1 000
2 000
3 000
4 000
5 000
6 000
2010 2030 2050
TWh/
year
wind electricityPV electricity
Deployment of wind and PV installations
𝑰𝑰𝒘𝒘𝒘𝒘𝒄𝒄𝒄𝒄 = 𝑬𝑬𝒄𝒄𝒄𝒄𝒄𝒄𝒄𝒄𝒄𝒄𝒄𝒄𝒄𝒄𝒄𝒄𝑲𝑲𝒘𝒘𝒘𝒘𝒄𝒄𝒄𝒄 �̇�𝑲𝒘𝒘𝒘𝒘𝒄𝒄𝒄𝒄 + 𝜹𝜹𝒘𝒘𝒘𝒘𝒄𝒄𝒄𝒄𝑲𝑲𝒘𝒘𝒘𝒘𝒄𝒄𝒄𝒄
𝑰𝑰𝑷𝑷𝑷𝑷 = 𝑬𝑬𝒄𝒄𝒄𝒄𝒄𝒄𝒄𝒄𝒄𝒄𝒄𝒄𝒄𝒄𝒄𝒄𝑲𝑲𝑷𝑷𝑷𝑷 �̇�𝑲𝑷𝑷𝑷𝑷 + 𝜹𝜹𝑷𝑷𝑷𝑷𝑲𝑲𝑷𝑷𝑷𝑷 𝑰𝑰𝒘𝒘𝒘𝒘𝒄𝒄𝒄𝒄 = 𝜹𝜹𝒘𝒘𝒘𝒘𝒄𝒄𝒄𝒄𝑲𝑲𝒘𝒘𝒘𝒘𝒄𝒄𝒄𝒄 =
𝑬𝑬𝒄𝒄𝒄𝒄𝒄𝒄𝒄𝒄𝒄𝒄𝒄𝒄𝒄𝒄𝒄𝒄𝑲𝑲𝒘𝒘𝒘𝒘𝒄𝒄𝒄𝒄
𝑳𝑳𝑳𝑳𝒘𝒘𝒘𝒘𝒄𝒄𝒄𝒄𝑲𝑲𝒘𝒘𝒘𝒘𝒄𝒄𝒄𝒄
Mecanisms of the modeling / a simplified example of scenario
𝑰𝑰𝑷𝑷𝑷𝑷 = 𝜹𝜹𝑷𝑷𝑷𝑷𝑲𝑲𝑷𝑷𝑷𝑷 =𝑬𝑬𝒄𝒄𝒄𝒄𝒄𝒄𝒄𝒄𝒄𝒄𝒄𝒄𝒄𝒄𝒄𝒄𝑲𝑲𝑷𝑷𝑷𝑷
𝑳𝑳𝑳𝑳𝑷𝑷𝑷𝑷𝑲𝑲𝑷𝑷𝑷𝑷
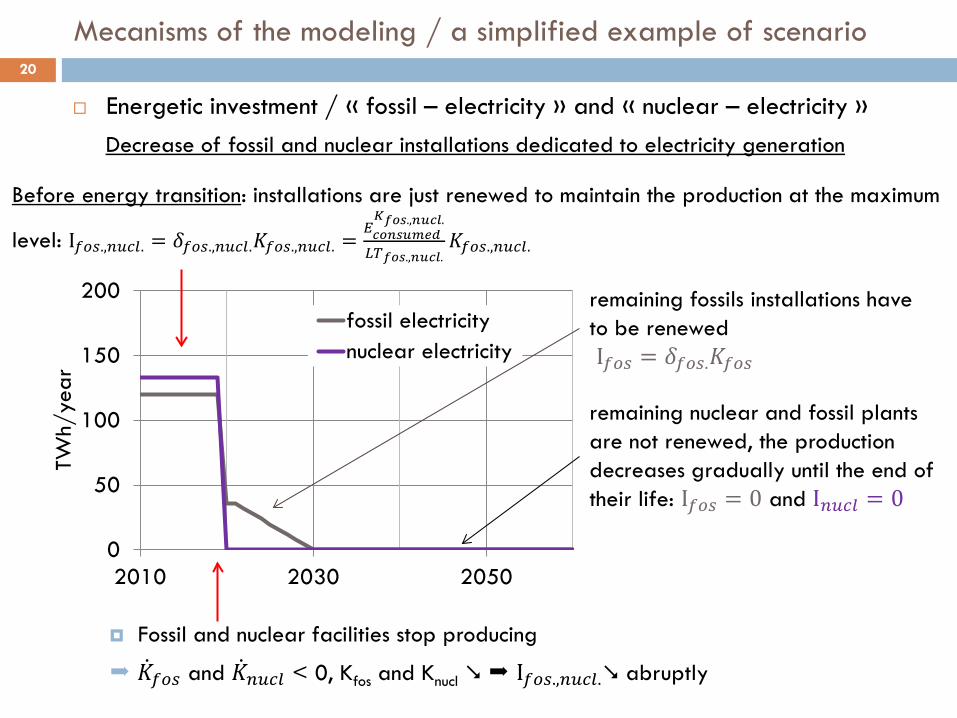
Energetic investment / « fossil – electricity » and « nuclear – electricity »
Fossil and nuclear facilities stop producing
�̇�𝐾𝑓𝑓𝑜𝑜𝑐𝑐 and �̇�𝐾𝑛𝑛𝑐𝑐𝑐𝑐𝑖𝑖 < 0, Kfos and Knucl I𝑓𝑓𝑜𝑜𝑐𝑐.,𝑛𝑛𝑐𝑐𝑐𝑐𝑖𝑖. abruptly
0
50
100
150
200
2010 2030 2050
TWh/
year
fossil electricitynuclear electricity
20
Decrease of fossil and nuclear installations dedicated to electricity generation
Before energy transition: installations are just renewed to maintain the production at the maximum
level: I𝑓𝑓𝑜𝑜𝑐𝑐.,𝑛𝑛𝑐𝑐𝑐𝑐𝑖𝑖. = 𝛿𝛿𝑓𝑓𝑜𝑜𝑐𝑐.,𝑛𝑛𝑐𝑐𝑐𝑐𝑖𝑖.𝐾𝐾𝑓𝑓𝑜𝑜𝑐𝑐.,𝑛𝑛𝑐𝑐𝑐𝑐𝑖𝑖. =𝐸𝐸𝑐𝑐𝑐𝑐𝑐𝑐𝑐𝑐𝑐𝑐𝑐𝑐𝑐𝑐𝑐𝑐𝐾𝐾𝑓𝑓𝑐𝑐𝑐𝑐.,𝑐𝑐𝑐𝑐𝑐𝑐𝑛𝑛.
𝐿𝐿𝐿𝐿𝑓𝑓𝑐𝑐𝑐𝑐.,𝑐𝑐𝑐𝑐𝑐𝑐𝑛𝑛.𝐾𝐾𝑓𝑓𝑜𝑜𝑐𝑐.,𝑛𝑛𝑐𝑐𝑐𝑐𝑖𝑖.
remaining fossils installations have to be renewed I𝑓𝑓𝑜𝑜𝑐𝑐 = 𝛿𝛿𝑓𝑓𝑜𝑜𝑐𝑐.𝐾𝐾𝑓𝑓𝑜𝑜𝑐𝑐
remaining nuclear and fossil plants are not renewed, the production decreases gradually until the end of their life: I𝑓𝑓𝑜𝑜𝑐𝑐 = 0 and I𝑛𝑛𝑐𝑐𝑐𝑐𝑖𝑖 = 0
Mecanisms of the modeling / a simplified example of scenario
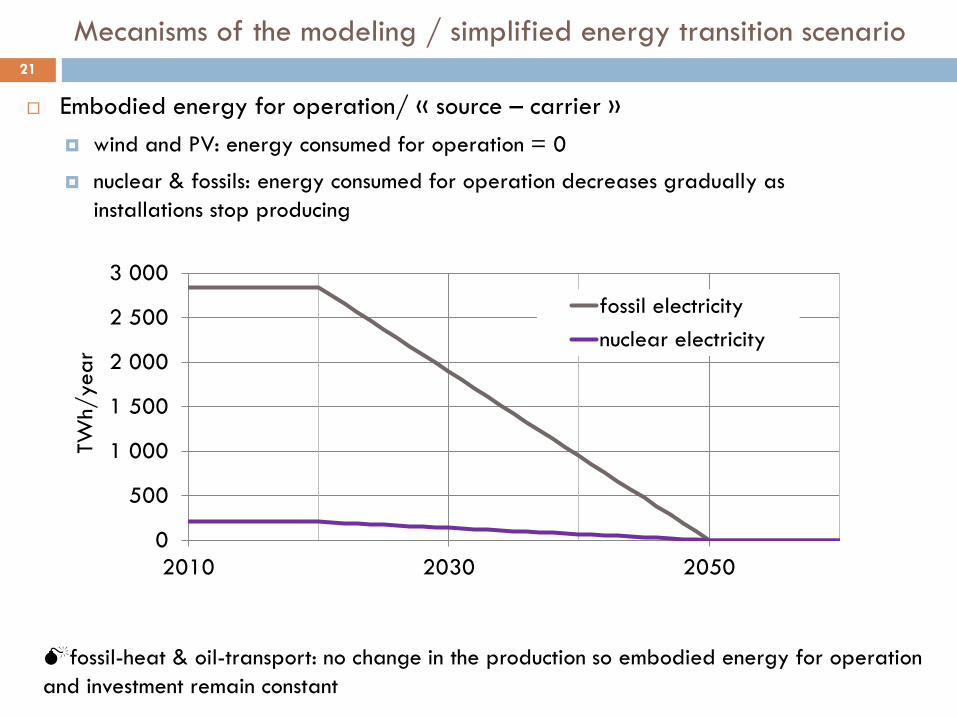
Embodied energy for operation/ « source – carrier » wind and PV: energy consumed for operation = 0
nuclear & fossils: energy consumed for operation decreases gradually as installations stop producing
21
0
500
1 000
1 500
2 000
2 500
3 000
2010 2030 2050
TWh/
year
fossil electricitynuclear electricity
Mecanisms of the modeling / simplified energy transition scenario
fossil-heat & oil-transport: no change in the production so embodied energy for operation and investment remain constant
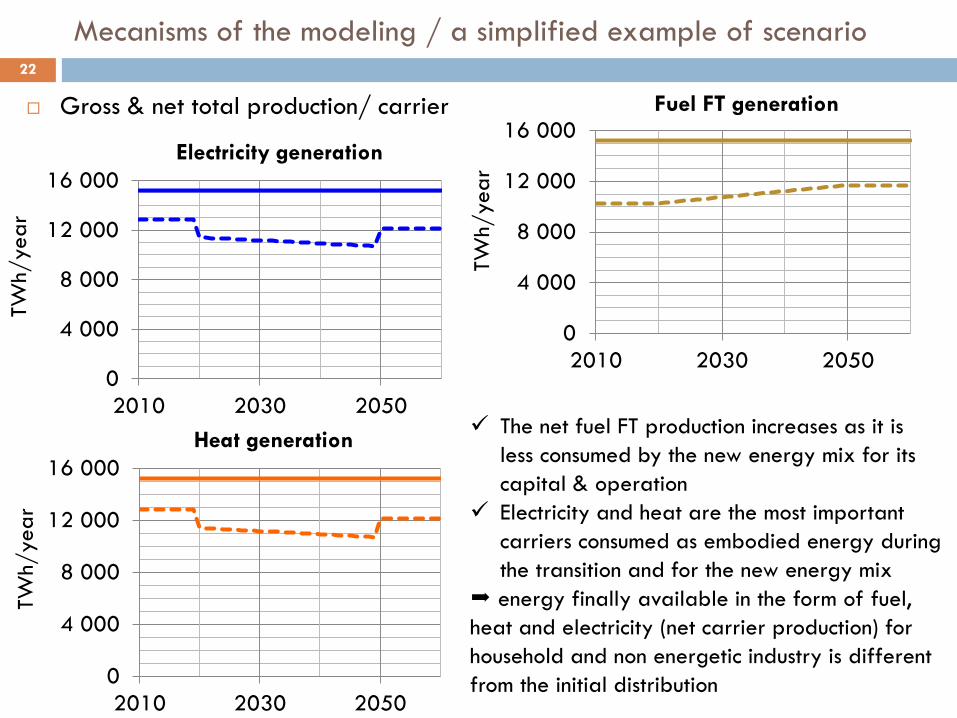
Gross & net total production/ carrier
22
0
4 000
8 000
12 000
16 000
2010 2030 2050
TWh/
year
Heat generation The net fuel FT production increases as it is
less consumed by the new energy mix for its capital & operation
Electricity and heat are the most important carriers consumed as embodied energy during the transition and for the new energy mix
energy finally available in the form of fuel, heat and electricity (net carrier production) for household and non energetic industry is different from the initial distribution
0
4 000
8 000
12 000
16 000
2010 2030 2050
TWh/
year
Electricity generation
0
4 000
8 000
12 000
16 000
2010 2030 2050
TWh/
year
Fuel FT generation
Mecanisms of the modeling / a simplified example of scenario
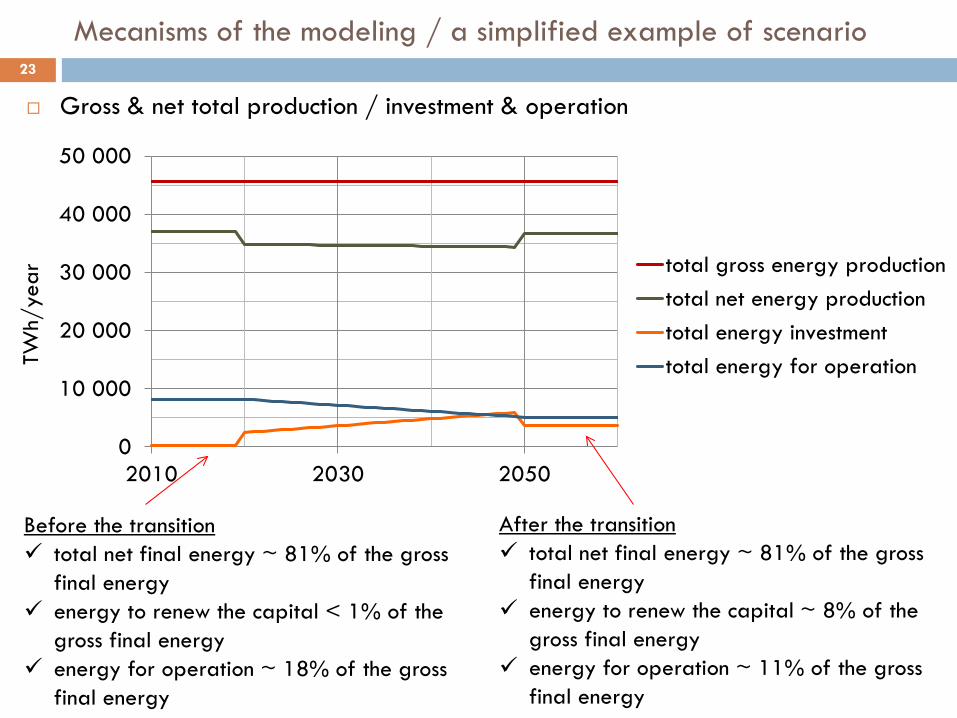
Gross & net total production / investment & operation
23
0
10 000
20 000
30 000
40 000
50 000
2010 2030 2050
TWh/
year
total gross energy productiontotal net energy productiontotal energy investmenttotal energy for operation
Before the transition total net final energy ~ 81% of the gross
final energy energy to renew the capital < 1% of the
gross final energy energy for operation ~ 18% of the gross
final energy
After the transition total net final energy ~ 81% of the gross
final energy energy to renew the capital ~ 8% of the
gross final energy energy for operation ~ 11% of the gross
final energy
Mecanisms of the modeling / a simplified example of scenario
Sensitivity to different energy transition scenarios 24
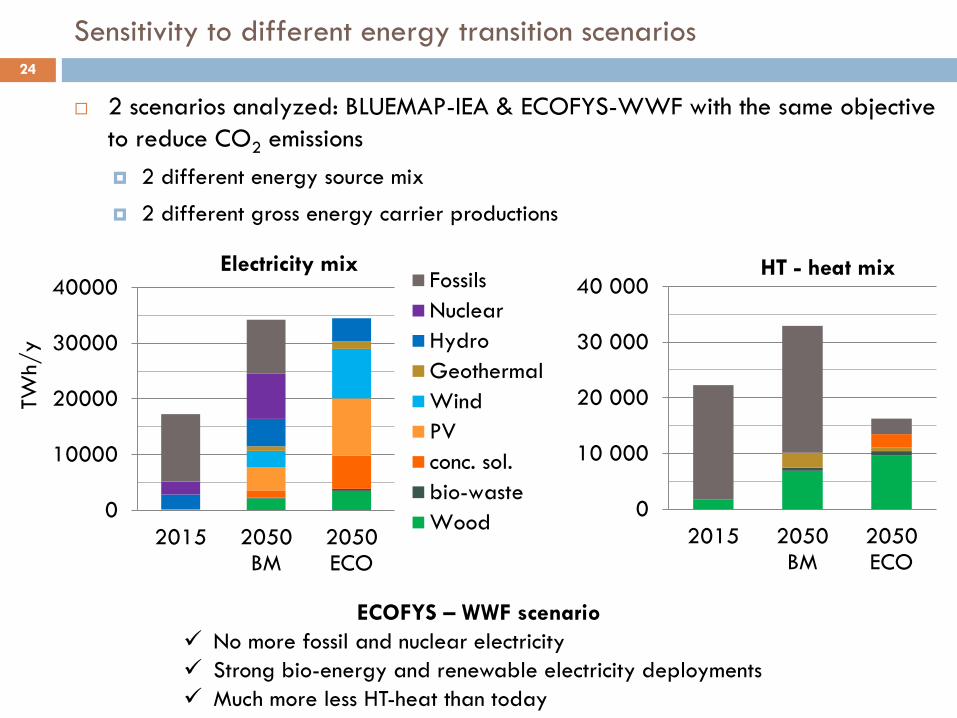
2 scenarios analyzed: BLUEMAP-IEA & ECOFYS-WWF with the same objective to reduce CO2 emissions 2 different energy source mix
2 different gross energy carrier productions
0
10000
20000
30000
40000
2015 2050BM
2050ECO
TWh/
y
Electricity mix FossilsNuclearHydroGeothermalWindPVconc. sol.bio-wasteWood 0
10 000
20 000
30 000
40 000
2015 2050BM
2050ECO
HT - heat mix
ECOFYS – WWF scenario No more fossil and nuclear electricity Strong bio-energy and renewable electricity deployments Much more less HT-heat than today
Sensitivity to different energy transition scenarios 25
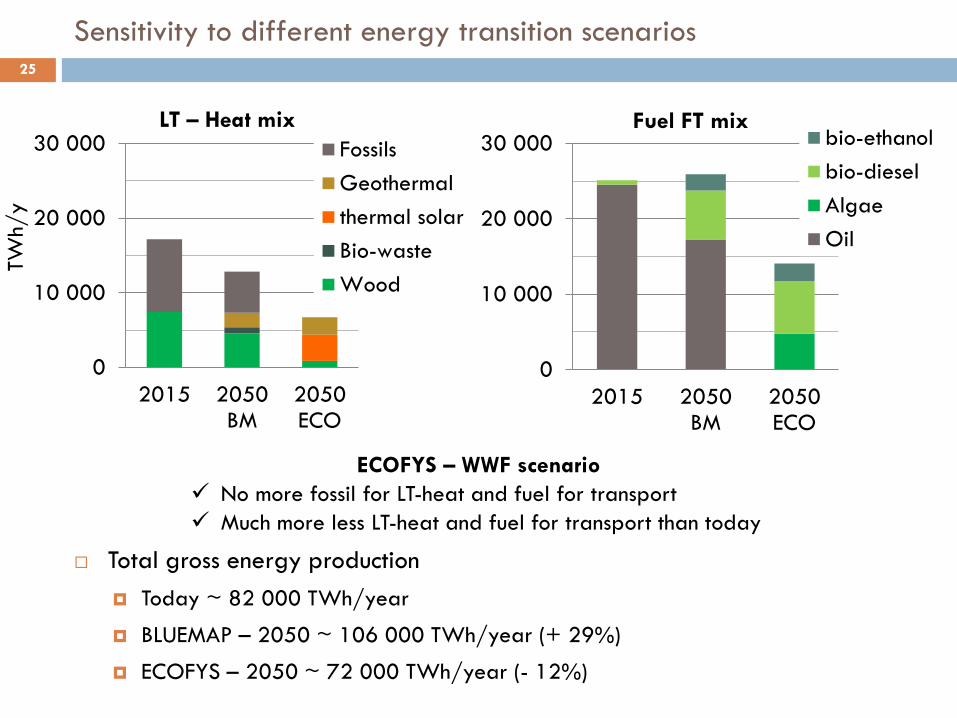
Total gross energy production Today ~ 82 000 TWh/year
BLUEMAP – 2050 ~ 106 000 TWh/year (+ 29%)
ECOFYS – 2050 ~ 72 000 TWh/year (- 12%)
ECOFYS – WWF scenario No more fossil for LT-heat and fuel for transport Much more less LT-heat and fuel for transport than today
0
10 000
20 000
30 000
2015 2050BM
2050ECO
TWh/
y
LT – Heat mix FossilsGeothermalthermal solarBio-wasteWood
0
10 000
20 000
30 000
2015 2050BM
2050ECO
Fuel FT mix bio-ethanolbio-dieselAlgaeOil
Sensitivity to different energy transition scenarios 26
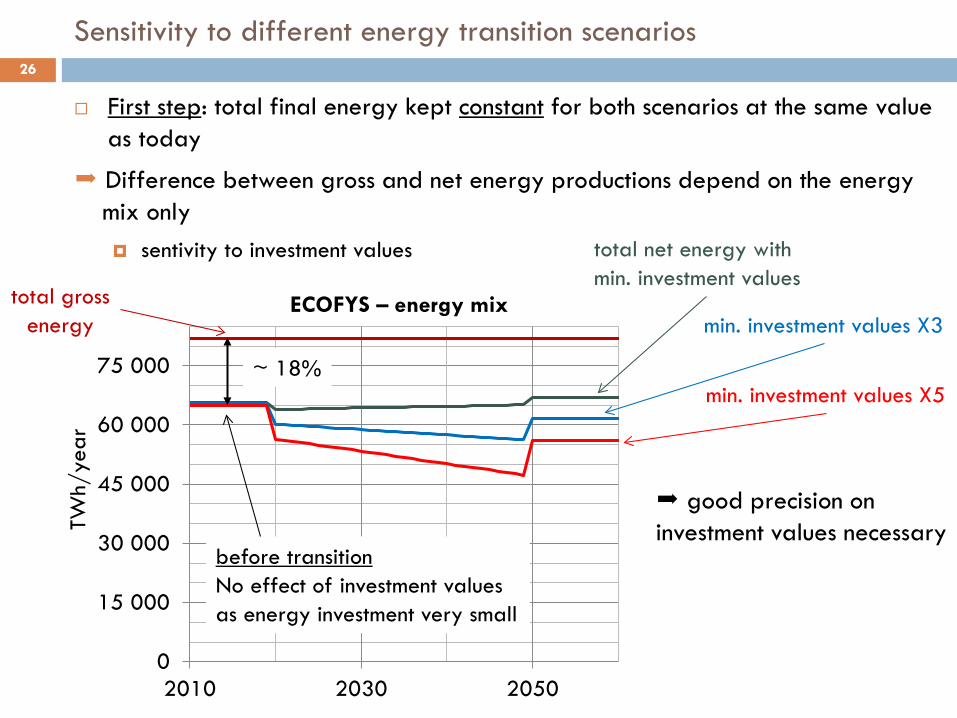
First step: total final energy kept constant for both scenarios at the same value as today
Difference between gross and net energy productions depend on the energy mix only sentivity to investment values
0
15 000
30 000
45 000
60 000
75 000
2010 2030 2050
TWh/
year
ECOFYS – energy mix total gross energy
total net energy with min. investment values
min. investment values X3
min. investment values X5
before transition No effect of investment values as energy investment very small
good precision on investment values necessary
~ 18%
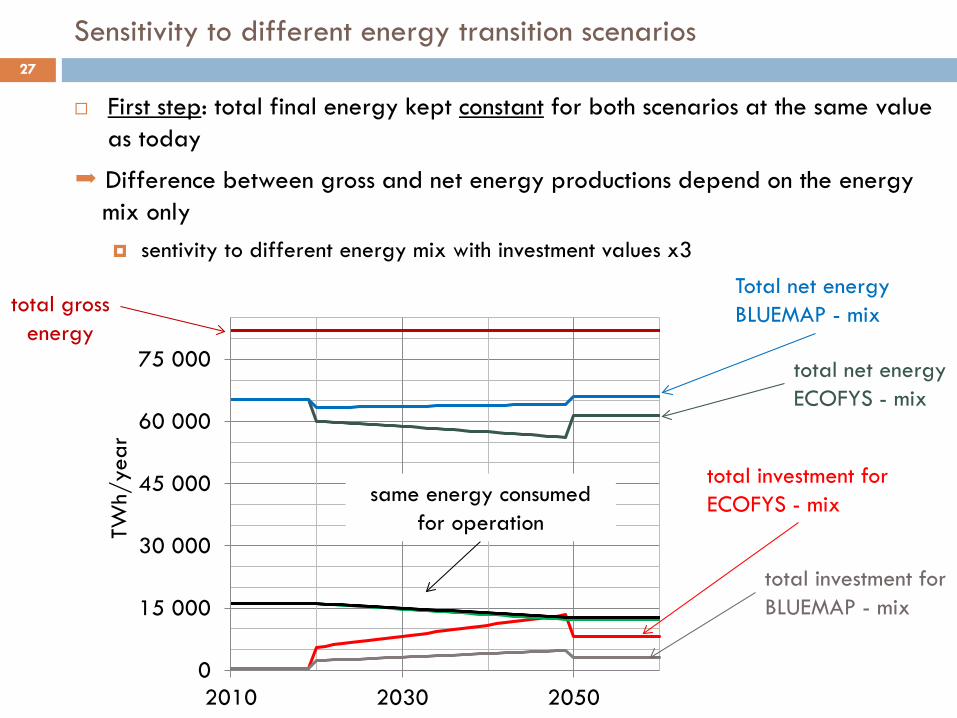
Sensitivity to different energy transition scenarios 27
First step: total final energy kept constant for both scenarios at the same value as today
Difference between gross and net energy productions depend on the energy mix only sentivity to different energy mix with investment values x3
0
15 000
30 000
45 000
60 000
75 000
2010 2030 2050
TWh/
year
total gross energy
total net energy ECOFYS - mix
Total net energy BLUEMAP - mix
same energy consumed for operation
total investment for ECOFYS - mix
total investment for BLUEMAP - mix
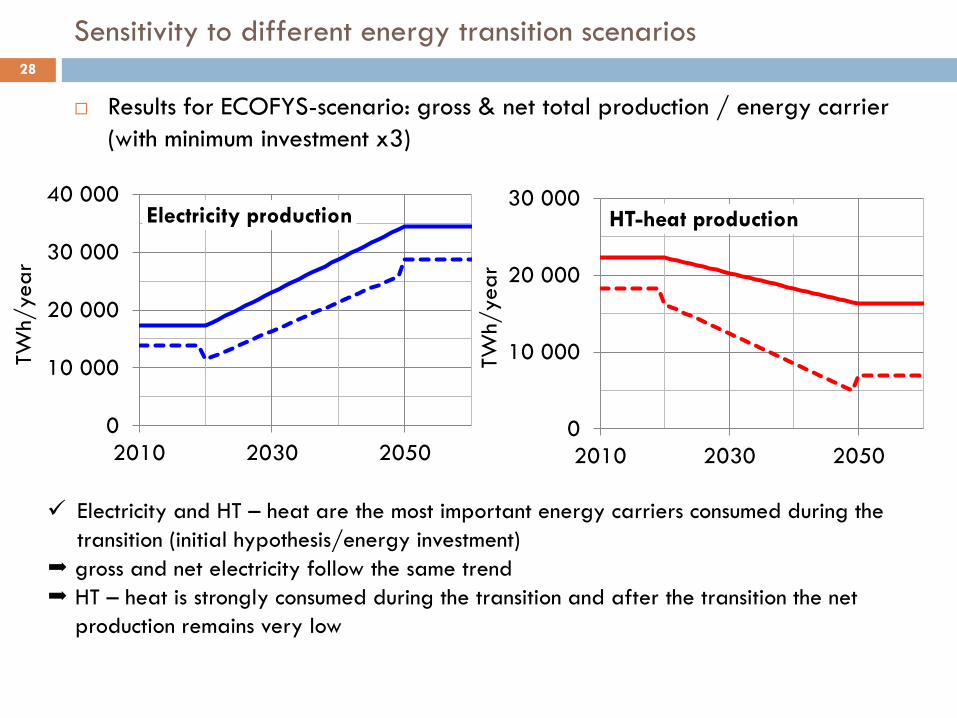
Sensitivity to different energy transition scenarios 28
Results for ECOFYS-scenario: gross & net total production / energy carrier (with minimum investment x3)
0
10 000
20 000
30 000
40 000
2010 2030 2050
TWh/
year
Electricity production
0
10 000
20 000
30 000
2010 2030 2050TW
h/ye
ar
HT-heat production
Electricity and HT – heat are the most important energy carriers consumed during the transition (initial hypothesis/energy investment)
gross and net electricity follow the same trend HT – heat is strongly consumed during the transition and after the transition the net
production remains very low
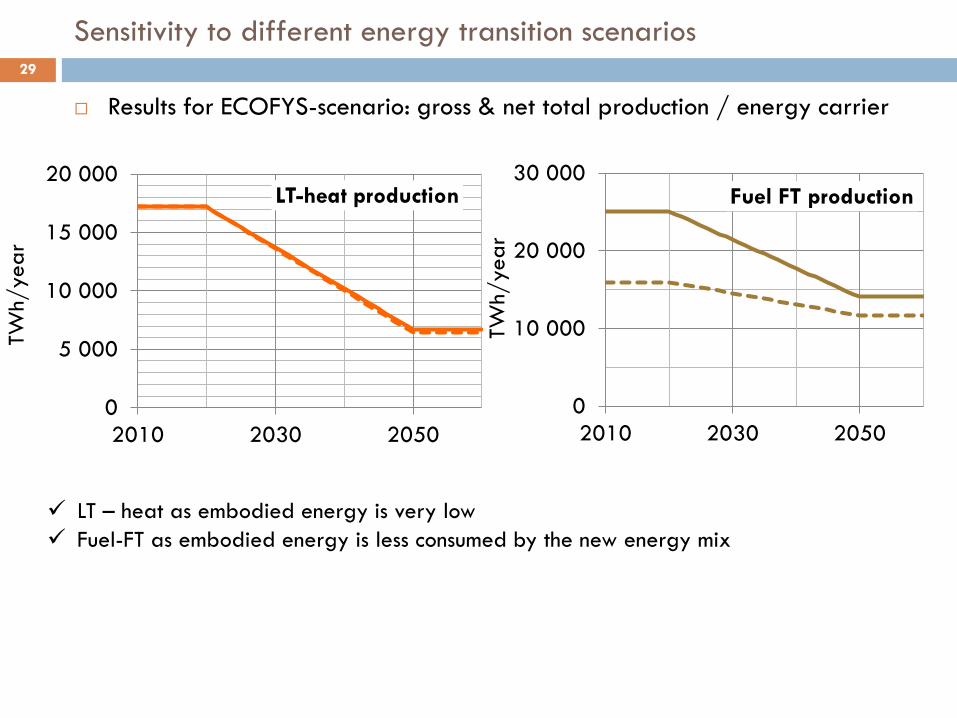
Sensitivity to different energy transition scenarios 29
Results for ECOFYS-scenario: gross & net total production / energy carrier
0
5 000
10 000
15 000
20 000
2010 2030 2050
TWh/
year
LT-heat production
0
10 000
20 000
30 000
2010 2030 2050
TWh/
year
Fuel FT production
LT – heat as embodied energy is very low Fuel-FT as embodied energy is less consumed by the new energy mix
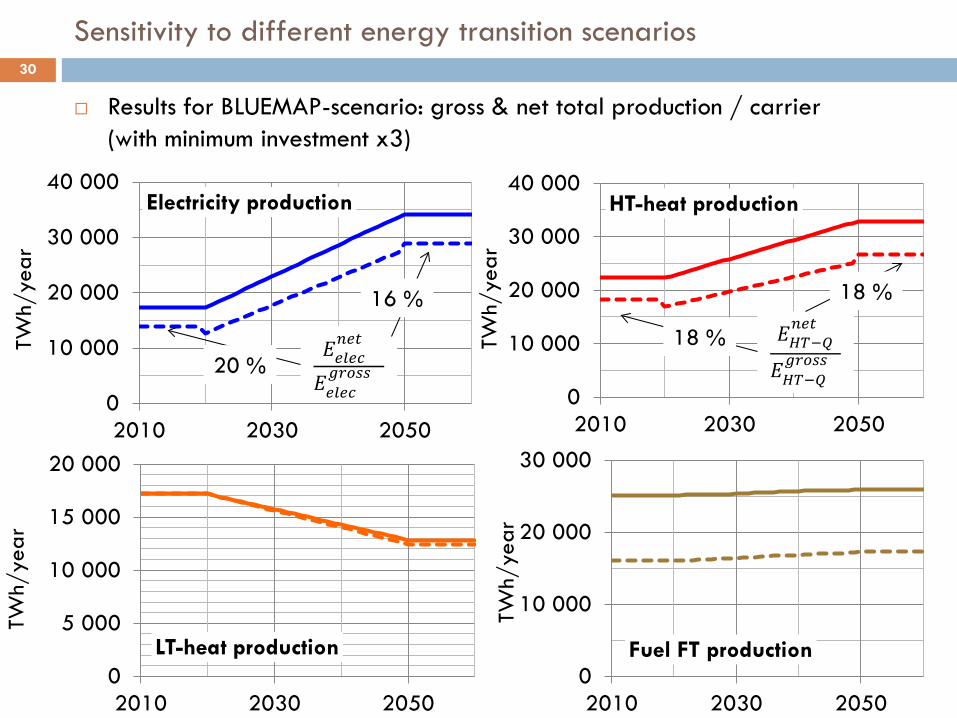
Sensitivity to different energy transition scenarios 30
Results for BLUEMAP-scenario: gross & net total production / carrier (with minimum investment x3)
0
10 000
20 000
30 000
40 000
2010 2030 2050
TWh/
year
Electricity production
0
10 000
20 000
30 000
40 000
2010 2030 2050
TWh/
year
HT-heat production
𝐸𝐸𝑐𝑐𝑖𝑖𝑐𝑐𝑐𝑐𝑛𝑛𝑐𝑐𝑡𝑡
𝐸𝐸𝑐𝑐𝑖𝑖𝑐𝑐𝑐𝑐𝑔𝑔𝑝𝑝𝑜𝑜𝑐𝑐𝑐𝑐
𝐸𝐸𝐻𝐻𝐿𝐿−𝑄𝑄𝑛𝑛𝑐𝑐𝑡𝑡
𝐸𝐸𝐻𝐻𝐿𝐿−𝑄𝑄𝑔𝑔𝑝𝑝𝑜𝑜𝑐𝑐𝑐𝑐
0
5 000
10 000
15 000
20 000
2010 2030 2050
TWh/
year
LT-heat production 0
10 000
20 000
30 000
2010 2030 2050
TWh/
year
Fuel FT production
16 %
20 % 18 %
18 %
Sensitivity to different energy transition scenarios 31
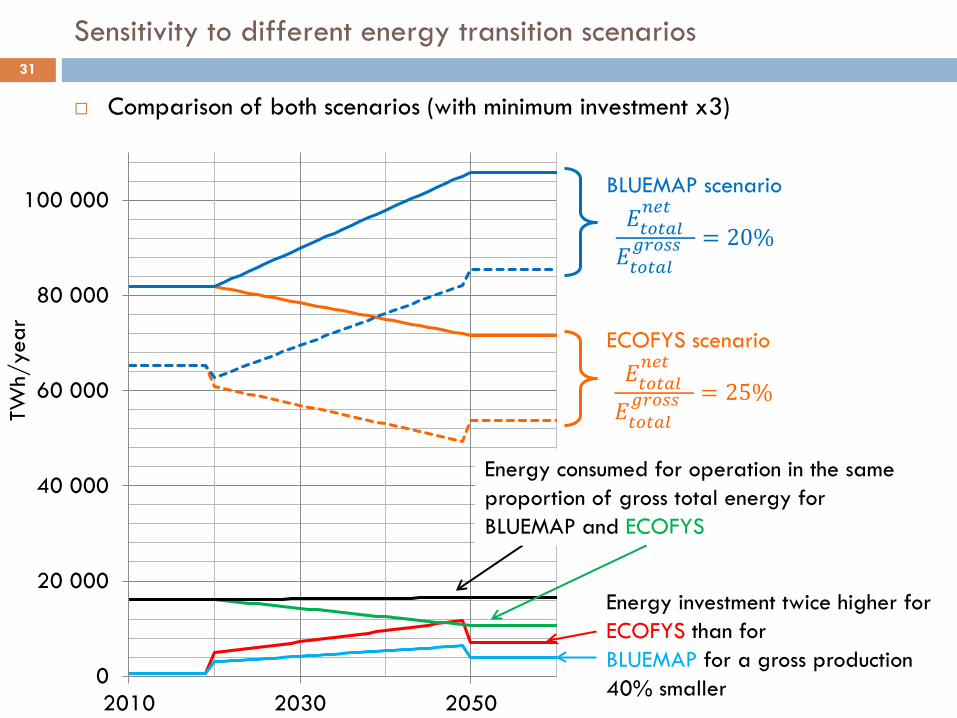
Comparison of both scenarios (with minimum investment x3)
0
20 000
40 000
60 000
80 000
100 000
2010 2030 2050
TWh/
year
BLUEMAP scenario 𝐸𝐸𝑡𝑡𝑜𝑜𝑡𝑡𝑖𝑖𝑖𝑖𝑛𝑛𝑐𝑐𝑡𝑡
𝐸𝐸𝑡𝑡𝑜𝑜𝑡𝑡𝑖𝑖𝑖𝑖𝑔𝑔𝑝𝑝𝑜𝑜𝑐𝑐𝑐𝑐 = 20%
ECOFYS scenario 𝐸𝐸𝑡𝑡𝑜𝑜𝑡𝑡𝑖𝑖𝑖𝑖𝑛𝑛𝑐𝑐𝑡𝑡
𝐸𝐸𝑡𝑡𝑜𝑜𝑡𝑡𝑖𝑖𝑖𝑖𝑔𝑔𝑝𝑝𝑜𝑜𝑐𝑐𝑐𝑐 = 25%
Energy consumed for operation in the same proportion of gross total energy for BLUEMAP and ECOFYS
Energy investment twice higher for ECOFYS than for BLUEMAP for a gross production 40% smaller
Perspectives & conclusion 1: Energy part 32
Embodied energy is a key point to analyse transition energy scenario Huge lack of data on energy intensity of construction materials, on global
energy consumed for investment and operation, specially for new technologies Build a network of experts to
validate the values for all the technologies complete the analysis of embodied energy by including
storage of electricity and heat energy grids CCS technologies Installations used by consumers
evaluate the realistic uncertainties to make sensitivity calculations
Necessity to analyze the energy mix and the corresponding embodied energy in the form of the different energy carriers
Compare different options to store the energy investment to renew facilities on the time of the transition on the life time of facilities …
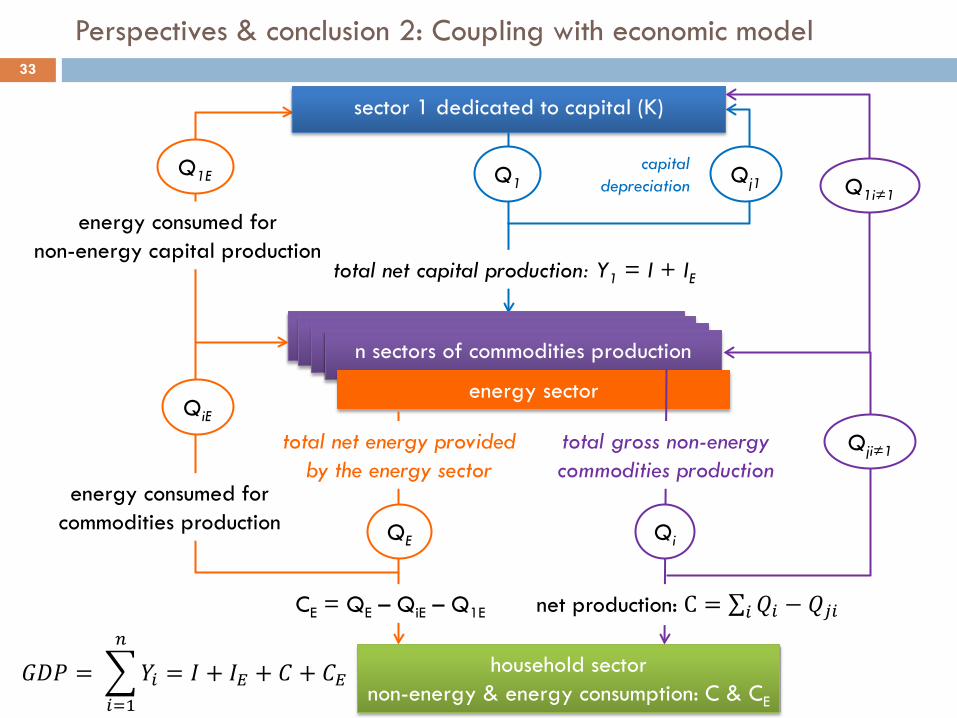
33
sector 1 dedicated to capital (K)
household sector non-energy & energy consumption: C & CE
Q1 Qj1 capital
depreciation
n secteurs de productions de biens de consommation
n secteurs de productions de biens de consommation
n secteurs de productions de biens de consommation
n sectors of commodities production
energy sector
Qi QE
Q1E
energy consumed for non-energy capital production
CE = QE – QiE – Q1E
total net capital production: Y1 = I + IE
total net energy provided by the energy sector
total gross non-energy commodities production
energy consumed for commodities production
QiE
Qji≠1
Q1i≠1
net production: C = ∑ 𝑄𝑄𝑖𝑖 − 𝑄𝑄𝑗𝑗𝑖𝑖𝑖𝑖
𝐺𝐺𝐺𝐺𝐺𝐺 = �𝑌𝑌𝑖𝑖 = 𝐼𝐼 + 𝐼𝐼𝐸𝐸 + 𝐶𝐶 + 𝐶𝐶𝐸𝐸
𝑛𝑛
𝑖𝑖=1
Perspectives & conclusion 2: Coupling with economic model

34
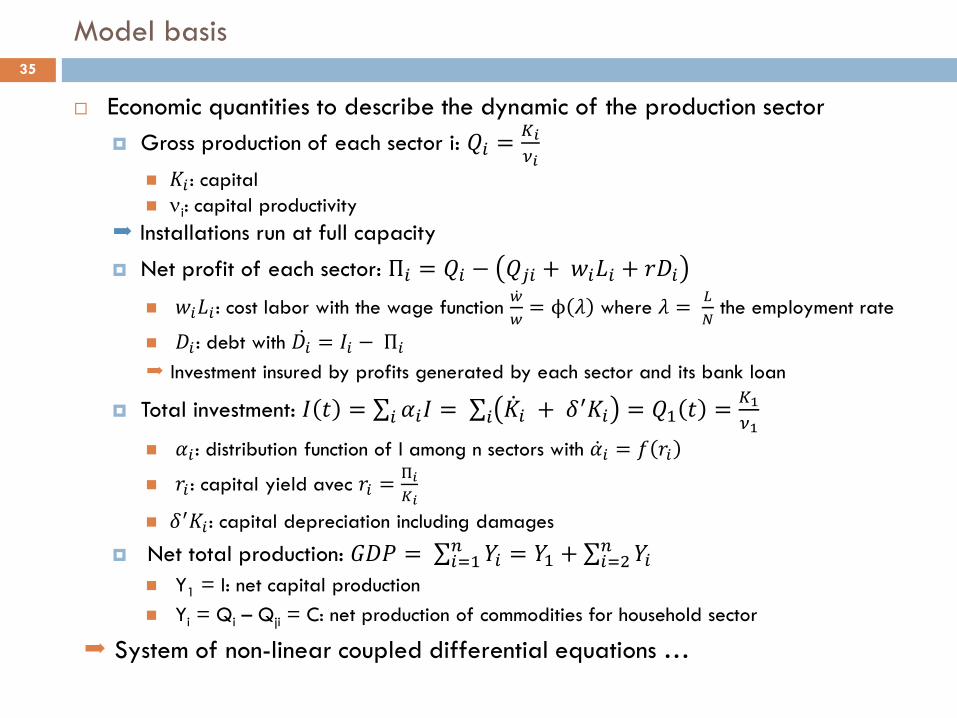
Model basis 35
Economic quantities to describe the dynamic of the production sector Gross production of each sector i: 𝑄𝑄𝑖𝑖 = 𝐾𝐾𝑖𝑖
𝜈𝜈𝑖𝑖
𝐾𝐾𝑖𝑖 : capital νi: capital productivity
Installations run at full capacity
Net profit of each sector: Π𝑖𝑖 = 𝑄𝑄𝑖𝑖 − 𝑄𝑄𝑗𝑗𝑖𝑖 + 𝑤𝑤𝑖𝑖𝐿𝐿𝑖𝑖 + 𝑓𝑓𝐺𝐺𝑖𝑖
𝑤𝑤𝑖𝑖𝐿𝐿𝑖𝑖 : cost labor with the wage function �̇�𝑤𝑤𝑤
= ϕ 𝜆𝜆 where 𝜆𝜆 = 𝐿𝐿𝑁𝑁
the employment rate
𝐺𝐺𝑖𝑖 : debt with 𝐺𝐺𝑖𝑖̇ = 𝐼𝐼𝑖𝑖 − Π𝑖𝑖 Investment insured by profits generated by each sector and its bank loan
Total investment: 𝐼𝐼 𝑡𝑡 = ∑ 𝛼𝛼𝑖𝑖𝐼𝐼𝑖𝑖 = ∑ �̇�𝐾𝑖𝑖 + 𝛿𝛿′𝐾𝐾𝑖𝑖𝑖𝑖 = 𝑄𝑄1 𝑡𝑡 = 𝐾𝐾1𝜈𝜈1
𝛼𝛼𝑖𝑖 : distribution function of I among n sectors with �̇�𝛼𝑖𝑖 = 𝑓𝑓 𝑓𝑓𝑖𝑖
𝑓𝑓𝑖𝑖 : capital yield avec 𝑓𝑓𝑖𝑖 = Π𝑖𝑖𝐾𝐾𝑖𝑖
𝛿𝛿′𝐾𝐾𝑖𝑖 : capital depreciation including damages
Net total production: 𝐺𝐺𝐺𝐺𝐺𝐺 = ∑ 𝑌𝑌𝑖𝑖 = 𝑌𝑌1𝑛𝑛𝑖𝑖=1 + ∑ 𝑌𝑌𝑖𝑖𝑛𝑛
𝑖𝑖=2 Y1 = I: net capital production Yi = Qi – Qji = C: net production of commodities for household sector
System of non-linear coupled differential equations …
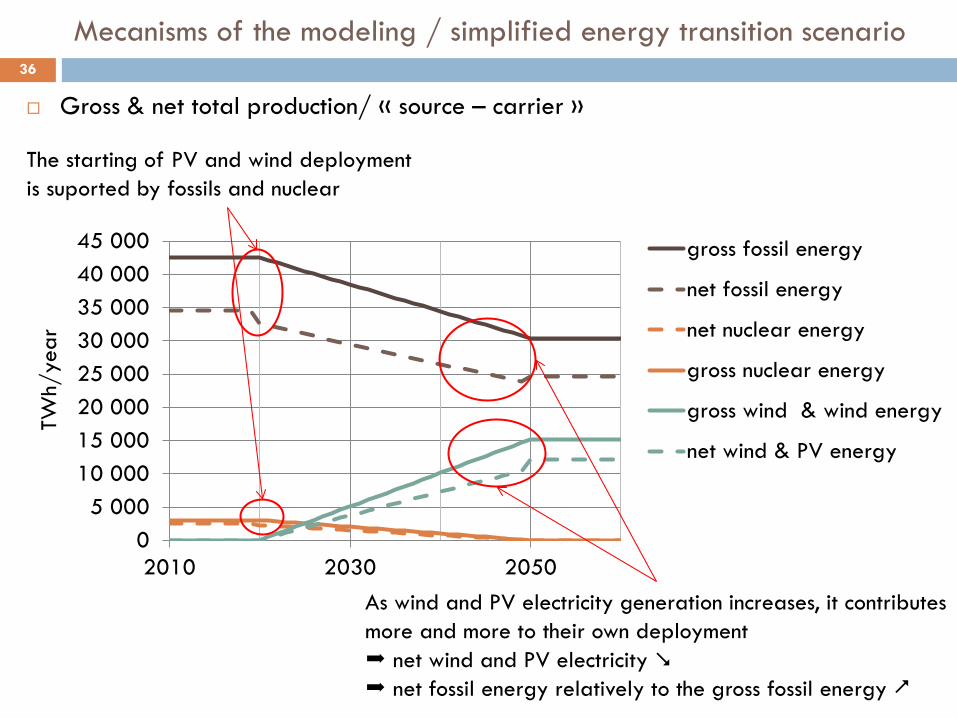
Gross & net total production/ « source – carrier »
36
05 000
10 00015 00020 00025 00030 00035 00040 00045 000
2010 2030 2050
TWh/
year
gross fossil energy
net fossil energy
net nuclear energy
gross nuclear energy
gross wind & wind energy
net wind & PV energy
The starting of PV and wind deployment is suported by fossils and nuclear
As wind and PV electricity generation increases, it contributes more and more to their own deployment net wind and PV electricity net fossil energy relatively to the gross fossil energy
Mecanisms of the modeling / simplified energy transition scenario
Recommended