PHILIPPI COMMUNITY
PROFILE
Final Report
2009
Valerie Anderson
Sepideh Azari
Anya van Wyk
Table of Contents
Introduction p. 1
South African Education and Environment Project p. 1
Rationale for Current Research p. 2
Research Outputs p. 3
Output One: History of Philippi p. 4
Output Two: Map p. 8
Output Three: Demographics p. 10
General Statistics p. 13
Comparison between 1996 and 2001 p. 13
Children between Ages 0-5 p. 14
Employment p. 15
Education Levels p. 17
Type of Dwelling p. 19
Type of Sanitation p. 20
Access to Electricity p. 22
Service Profile p. 23
Summary p. 24
Output Four: Scope of NGO and CBO Sector p. 25
Recommendations p. 26
References p. 31
Appendix A – Census 2001 p. 34
Appendix B – Contact List p. 41
1
Introduction
In August 2009, the SAEP commissioned a study of Philippi to be conducted with the aim of
producing a profile of the community. The importance of this lies in understanding the
community in all its facets and in doing so to be able to address the needs of SAEP students that
come from the area through a more holistic view of their lives and living conditions. It is
intended that the research outputs will enable the SAEP to pursue its function of development
through a better understanding of the community and navigational tools (maps), and will
increase the capacity of the SAEP through strategic connections with NGOs and CBOs. This
lends itself to the ethos of participation and capacity-building that is central to the SAEP’s
success.
The South African Education and Environment Project
The South African Education and Environment Project (SAEP) is a non-governmental
organisation (NGO), founded in 1994 and based in Cape Town. The SAEP has been dedicated to
supporting children and youth in South African townships through every level of their academic
careers. This has been achieved through the establishment of educational support programmes
in township schools. These programmes provide “the tools necessary to develop academic and
life skills, raise environmental awareness, obtain productive employment, and make influential
contributions to the socio-economic development of their communities and their country”
(SAEP, 2009, p. 6). The ultimate vision behind the educational programmes is that the academic
support will translate into the creation of leaders who will actively contribute to the economic
and social development of their communities. SAEP seeks to achieve its objectives through the
capacity-building of Community Based Organisations and the participation of students and
community leaders. SAEP’s educational programmes are therefore shaped to create structural,
sustainable environmental development and systemic change through education and
community leadership.
SAEP’s historic mission to “achieve environmentally sustainable development through
improvement of living conditions, development of skills, and use of South Africa's natural
2
environment to create economic opportunities” (www.saep.org.za), is realized through four
educational programmes1. The Early Childhood Development (ECD) Programme improves the
infrastructural and human resources capacity of ECD centres in Philippi informal settlement.
Currently the SAEP supports 15 independently run township educare centres and assist
principals with assist the principals “to prepare budgets and fundraising proposals, manage
finances, organize trainings for staff, collect and deliver donations, and organize volunteers to
help in the crèches” (SAEP, 2009, p. 6). The High School Programme provides tutoring and arts
programmes in six under-resourced township schools, providing computer literacy training;
advanced tutoring in mathematics, science and English; personal development and mentorship;
intensive after-school tutoring and test preparation to Matric students; and extracurricular
activities including poetry, journalism, debating, drama, arts, music, media and
outdoor/environmental education. This programme is run together with University of Cape
Town student organisations such as Ubunye, Inkanyezi, TeachOut, and the Township Debating
League. The SAEP Bridging Programme helps high school graduates prepare for tertiary
education by providing a year of guidance and academic support. Finally, the Tertiary Support
Programme continues mentorship to former bridging year students who are now continuing
their studies at tertiary institutions. This programme also provides financial support through
small bursaries. Philippi is one of the largest townships in Cape Town and this is where the SAEP
focuses much of its work and energies.
Rationale for Current Research
Philippi, like many townships in Cape Town, faces many social problems, including lack of
education, violent crime, substance abuse, environmental degradation and a rise in the number
of residents with HIV/AIDS2. These abject social conditions are arguably rooted in the structural
violence – violation of human rights through governmental structures – that the apartheid
system created in many townships throughout the Western Cape3. While the SAEP has affected
1SAEP. (2007/2008). Educating and Inspiring a Brighter Future: SAEP Annual Report 2007/2008.
2 Public information available on the Urban Matters website, www.urbanmatters.com
3 Ibid.
3
change in Philippi through the above mentioned educational programmes, the township
presents a number of unique challenges to SAEP. They are as follows:
• Philippi has gone through several periods of rapid expansion, with people from the rest
of South Africa and surrounding townships moving into the area in large numbers. This
expansive growth has been hard to track, thus there are no reliable population figures
and locals say the Census South Africa estimates are gross underestimates. In addition,
rapid expansion places extensive strain on already stretched public resources, services,
and infrastructure4.
• Due to this expansion, the size and parameters of Philippi are not known. Maps have
not kept up with the changes and are therefore inadequate at present. They fail to
indicate where all schools, facilities and boundaries are.
• Due to the size of Philippi the SAEP does not know all the Non-Governmental
Organisations (NGOs), Community Based Organisations (CBOs) and resources available
in the township. This makes effective networking hard to achieve.
The SAEP’s aims to support all children in Philippi through education and the capacity-building
of CBOs is somewhat hindered due to a lack of demographical and infrastructural information
on the area.
Research Outputs
This research report is a community profile of Philippi, constructing an informative, concise, and
clear image of this community. This profile includes a brief history of Philippi, several maps of
the area, the most recent demographic statistics, and a Resource Manual of NGOs and CBOs
working in Philippi. In addition, recommendations are made in regards to strategic
organisational relationships which should be formed in order to maximize SAEP’s impact in the
community. In particular, the final report will produce the following:
4 City of Cape Town. (1998). Socioeconomic Characteristics: Philippi. Urban Policy Report.
4
Community Overview: a brief description of Philippi and its history.
1. Physical Map: an accurate and detailed map of Philippi demarcating the ward
boundaries and zones, locating facilities and landmarks including, but not limited to,
NGOs and CBOs, clinics, police stations, schools, religious centres, community centres,
parks or green areas, social security services, business centres, and major transportation
links and routes.
2. Demographics: the most recent statistics and estimates of population, gender split, age
categories, education level, unemployment rates, economic sector split, income,
housing type, and sanitation.
3. Scope of Non-Profit Organisation sector: the NGO and CBO sector operating in Philippi is
described in detail, including who is working in the area, the size of the organisation,
and what they are doing in the community. This data is compiled in a Resource Manual.
4. Recommendations: based on the above, recommendations are made to the SAEP about
useful resources in the community and which organisations they could be forming
strategic networks with.
Output One: History of Philippi
The following history is largely taken from Gerry Adlard’s 2009 historical profile of Philippi. All
page references refer to that work, except where otherwise specified. Philippi today is one of
the largest townships in Cape Town. Its boundaries follow along Lansdowne Road, Duinefontein
Road, Vanguard Drive and the R300 (Adlard, 2009) and the area is situated in what is referred
to as the Cape Flats. Philippi’s history starts from the nineteenth century; the first community
of local residents is recorded in 1833, however its developments and substantial residential
growth emerged in the early 1980s. Originally called “Die Duine”, (the Dunes), Philippi was
mainly used for grazing until the 1970s and a few farms existed in the area. Like most black
South African Townships, the history and development of Philippi is linked to apartheid policies.
Most people in Philippi townships came from the former Ciskei and Transkei homelands and
settled Nyanga, Langa, Gugulethu and later in new squatter areas such as Crossroads, Browns
Farm and Samora Machel. Philippi increasingly became a place of refuge from the political
5
conflict and violence in the former homelands (City of Cape Town, 2007). Another one of the
major factors contributing to the growth in the number of residents in the Philippi area was
when farms in Mitchells Plein were eliminated. This resulted in a large number of labourers
being deposed and having to move elsewhere as they did not fall under categories of the
apartheid state’s racial housing relocation process (Adlard, 2009).
Crossroads
In 1974 the first shacks were put up in the northern parts of Philippi. Crossroads is a triangular
piece of land approximately 90 hectares in extent, near to Cape Town International Airport and
the adjacent Philippi industrial area. In addition to new residents moving from the adjacent
Browns Farm area, in the mid-1970s Black immigration from the newly independent Transkei
Republic to the Cape took place at an accelerated rate. Under the apartheid laws these new
arrivals were treated as illegal immigrants. In fact, “virtually no new land or houses had been
made available for Blacks for nearly 13 years prior to the early 1980s” (Goldstone Commission,
1993). These new arrivals faced a great need to find a place to live and work in the Western
Cape and thus settled in Crossroads. They quickly erected homes which were essentially shacks,
constructed from wood, corrugated iron sheets and plastic. By August 1975 there were 1100
people living in Crossroads, and by 1977 the number had grown to 18 000. As the influx of
immigrants continued over the next few years, demand for space in Crossroads grew
substantially. In 1978 Crossroads was declared by the Cape Supreme Court an ‘emergency
camp’, with the State being responsible for providing water and refuse removal for a fee. This
was a result of Save the Crossroads campaign. The aim of the campaign was to change
Crossroads status as a temporary camp to an ‘emergency camp’ and so receive better service
delivery. By 1981, 1100 houses were built as Phase 1 of the project New Crossroads as
promised by Koornhof, then Minister of Co-operation and Development, as the demand for
housing and space was increasing. People who qualified under certain criteria of the Koornhof
Agreement (Goldstone Commission, 1993) received temporary urban rights which included
receiving formal housing in the Crossroad area. However, “Phases 2 & 3 were not constructed
because in 1983 the government decided to create Khayelitsha and establish it as the home of
6
the entire ‘legal’ Black population of Cape Town” (Adlard, 2009:5). This was done with the
intentions of moving Crossroads residents to be the first residents of Khayelitsha. This was not
successful as more squatters moved to Crossroads and conflicts and internal group conflicts
escalated. The conflicts were not only a consequence of internal group clashes but also a
reaction or demand to the up keeping of the Koornhof ‘promise’. As the number of squatters
grew the Crossroad area expanded. Philippi, like other areas of the Cape Flats, experienced
chaotic occupation. However these occupations were a threat to the ‘original’ residents of
Philippi as well as to the area’s development. Philippi had turned into an apartheid
battleground characterised by Black urbanism. As there existed no local authority the provincial
government took charge by getting in discussions with the squatter leaders, and “in 1987
Crossroads was declared an African local authority” (Adlard, 2009: 6) whereby one of the
squatter leaders became the first mayor of Philippi.
Weltevreden Valley
Weltevreden Valley is situated in the south-west corner of Philippi. This informal settlement
was not affected by the conflicts and events - internal group conflict, uprising, and violence -
that characterised Crossroads. Squatters in the Weltevreden Valley did not lay claims on the
land. Weltevreden Valley had a small group of inhabitants living in the north-west site, referred
to as Samora Machel (Adlard, 2009). The informal settlement in Samora Machel did not exist
before 1993, yet in February 1994 it was estimated that Samora Machel had 245 households
and rapidly expanded from there. By June the same year the number had increased to 425
households, and by November 735 shacks existed. Half a year later, in June 1995, the number
of shacks had risen to 1010. Informal settlers were asked to move to temporary locations while
the housing project was undertaken. Disagreement with regards to relocation, availability of
land, employment of labour, access and affordability of private land arose. In 1995 the
Provincial Housing Board started on Phase 1 of the first large scale housing subsidy, with the
aim of creating a serviced township. The project turned out to be more costly than expected,
however the project could not be abandoned. Instead, costs were cut whereby only the bare
7
legal minimum housing safety requirements were met. Phase 3 and 4 of the housing project
received more subsidies leading to better product delivery.
Philippi East
Philippi East was created as demand for space increased and residents had to settle down in
Lower Crossroads in temporary camps (Adlard, 2009). Residents in the Lower Crossroads transit
camp waited for an opportunity to move in to Philippi, but never found the opportunity. The
development of Philippi East underwent strong contestation, and as a result all that could be
done in the area was to clear and level the land. Political faction fighting and divisions
threatened to disrupt the site development at any time. By 1996 all political parties sat
together to plan for the development of Philippi East. The beneficiaries of these development
plans were mainly Browns Farm, Langa and the transit camp. The plan to build RDP houses was
abandoned and the second phase of the plan was instituted in which these sites were equipped
with toilet pans and standpipes. The housing project in Philippi East provided “4535 single
residential units and 969 double storey medium density houses” (p. 10). The single land plots
were fairly large size-wise, but the size of dwellings was small; medium land plots were half the
size of the single residential plots. These homes housed residents in the original transit camp.
Adlard does not elaborate on whether or not this housing project was sufficient for all
residents. Schools were built in the area; however, the hospital which was part of the plan for
the development of Philippi East never came to fruition (Adlard, 2009).
Browns Farm
The development of Browns Farm was planned from 1986 (Adlard, 2009: 11). The development
of Browns Farm, undertaken by the Cape Provincial Administration, first saw Villages 2B, 3 & 4
benefitting from the development plans. At that time the gross residential density was 25
dwelling units per hectare. The next site of development was village 4A. During the first
democratic elections in 1994, site 4A was raided and within the space of a weekend shacks had
been built on 500 sites; the entire space was now occupied. Browns Farm, like Crossroads was
characterized and marked by internal grouping disputes and conflicts. What happened on site
8
A4 was a result of conflicting political parties clashing. The rapid influx of new residents was a
reaction to fears of losing housing space, whereby members where mobilized in order to
prevent ‘claimed’ land from being ‘stolen’ (p. 12). Browns Farm continues to be marked by
power play.
The development of specific areas in Philippi explains how the overall area was shaped by
political, social and economic factors. The constant interplay between residents and
government led to infrastructural development, or lack thereof, that is evident in Philippi today.
A historical look at this development can enable the SAEP to trace how Philippi was developed
and if significant changes have occurred since 1994.
Output Two: Map
Research Aim
The search for a recent and detailed physical map over Philippi seemed, in the early phases of
the research process, to be a difficult task to overcome. We got in touch with Urban Matters
who referred us to Gita Govan of arG Design, a company which had produced a map of Philippi.
The map from Govan is an aerial photograph of the Philippi area. It encompasses social
facilities, including schools, libraries, Educare centres, community halls, churches, circumcision
areas, council and municipal offices, industrial and manufacturing sites, shopping and retail
amenities, places of business, informal trading areas, clinics, police stations, crime hot spots,
taxi ranks, bus stations, train stations, sports and recreation amenities, public open space,
gardens, and urban agriculture areas.
Process
One of the research aims was to provide further detail for this map. In doing so we faced sever
time and resource restrictions. The map provided by Govan – and the map which the SAEP has
thus far been using - was blurred, making it difficult to locate road names. Initially we
considered driving around Philippi and plotting social facilities on the map; however, this would
have been too time consuming, and resource intensive – we simply did not have the time or the
9
financial resources at hand to create and produce an entirely new map. We approached several
people whom we thought could direct regarding GIS and layered mapping. These contacts
repeatedly turned out to be dead-ends. At one point it seemed as if the mapping part of our
project would have to be cut out.
Eventually, via Gerry Adlard, we got in touch with Natasha Murray who works for the City of
Cape Town as the Head of Planning for Informal Settlements. From Murray we were able to get
the most recent aerial photography map of Philippi, updated in 2009. The map contains clear
routes and roads, as well as facilities of all kinds, including schools, community halls, water
pipes, sewer points, unregistered property and more. As we had no use for many of the details
that featured on the map, Murray assisted in only plotting what we needed. We included:
stadiums, sport facilities, schools and education departments, pre-primary schools, post offices,
places of worship, libraries, housing offices, halls, entertainment, buildings, churches,
cemeteries, police stations, government hospitals, and clinics. In addition we included clear
boundaries of suburbs and wards, and main roads. Regretfully, Natasha Murray was unable to
provide us with the final electronic and printed maps in time for this report. We strongly
recommend that the SAEP remains in contact with Murray to receive this valuable resource.
In the last minute of this project, we were contacted by the City of Cape Town’s GIS Mapping
Department. We had tried to get in touch with them some time ago, but had not received any
‘immediate’ response. We had emailed them our profiling description informing them of what
we were looking for. The GIS Department, and in particular Nontembeko Poswa, provided us
with extensive maps of the Philippi area and Samora Machel. The maps which we received from
them included demographics of Philippi, and were produced in 2007. They indicate a number of
social amenities. The quality of the maps is very high, and the maps are large, making them
ideal for the SAEP work. Compared to the original map that we started with, these maps are far
clearer in quality, and contain the important amenities that are of interest to the SAEP. They
clearly demarcate roads, making it a more useful tool for volunteers and staff members to
orientate themselves to and navigate around Philippi. The maps which we received from GIS
10
are a valuable supplement to the maps that Murray has produced (see Appendix B for contact
details.)
Recommendations
It is our recommendation that the SAEP in future make use of GoogleEarth, as the web site is
more detailed than the map provided by Govan or the new map which we have provided. While
the map included in this report clearly marks big roads, the street names for smaller roads are
blurred. GoogleEarth corrects this.
Secondly, the SAEP could get in touch with Natasha Murray for further assistance5. Murray has
indicated that she would be willing to plot new information provided by the SAEP into the
layering of the Philippi map, as this would also aid the City of Cape Town in their data
collection. This would require a volunteer or staff member walking the streets of Philippi and
demarcating new points of interest on a physical map. It is imperative that this be done
responsibly and accurately since the information would not only be used for the SAEP, but for
the City and other organisations as well. We suggest that this manual plotting include all formal
crèches, physical premises of other NGOs/CBOs known to be working in Philippi, and less high
profile service centres (i.e. other than government offices and clinics).
Output Three: Demographics
Research Aim
The research aim was to find the most recent statistics and estimates of population, gender
split, age categories, unemployment rates, economic sector split, income, housing type, crime
statistics and family make-up, including the number of single parent and child-headed
households. Unfortunately, severe time constraints inhibited us from sourcing crime statistics,
health data, and family make-up, including the number of single parent and child-headed
households.
5 See Appendix B for contact details
11
Importance of Statistical Analysis
Statistics, once analysed, serve to create a holistic view of any given social context. The
manifestation of social problems (such as lack of access to decent education) can be
understood through an analysis of the intricate web of social experiences and social structures,
which at the point of intersection reveal the sum of the individual’s social reality and behaviour.
In turn, we cannot understand a social problem in isolation from the daily lived experiences of
the individual, structures of opportunity, and access to service delivery. When a student enters
an educational space, they bring with them the issues that accompany low family income,
unemployment, poor living conditions and lack of service delivery. An analysis of the statistics
of unemployment, income, housing type and service delivery become integral in trying to
understand the conditions under which an individual is denied access to education. We can also
begin to comprehend the structural nature of opportunity and how this affects and shapes
prospective students and their educational endeavours.
We have used the 2001 Census to analyse the socioeconomic conditions in Philippi and to
assess how this may relate to the work of the SAEP. The SAEP can make its educational
programmes stronger through an understanding of the socioeconomic conditions in Philippi
and by responding to these through strategic networking strategies and assessment of
educational projects.
Process
The process of collecting statistical data on Philippi involved Internet research work and
contacting government workers and officials who have access to the most recent statistical
information for South Africa. The last South African census was conducted in 2001. Therefore,
our aim was to find the most recent demographics available in order to up-date the figures on
Philippi. Our first contact was made with Lynn Woolfrey who heads up Datafirst at the
University of Cape Town (UCT). Datafirst contains all statistical information, surveys and
datasets for South Africa. After informing Lynn Woolfrey about the details of our project she
searched the database and found that the last census was conducted in 2001 and stated that
12
would be the most useful source for our project. However, we still pursued the idea of getting
hold of more recent statistics. We then got hold of the contact details of the City Planners in
Cape Town. We were directed to Karen Small. She proved to be exceedingly helpful, although
she needed us to name the specific areas we wanted in Browns Farm and Samora Machel. She
gave us maps, indicating these areas. However, she went away on a business trip and therefore,
sent us the 2001 Census, the 2007 population estimate figures for Philippi and the figures of the
informal dwellings in Philippi.
It is important that the SAEP remains in contact with the City Planners because they are
constantly updating their statistical information. We also contacted Kambidima Wotela, a
postdoctoral fellow in Demography from UCT and he gave us a contact in government - Nesbert
Zinyakatira, a Population Analyst at the Western Cape Provincial Population Unit - and said that
they conduct community surveys. Unfortunately, we could not get hold of Nesbert Zinyakatira
and due to time constraints could not pursue this much further. However, this would be a
useful contact for the SAEP to have because they focus on conducting community surveys in
South Africa. Kambidima also stated that the most useful resource at the moment would be the
2001 Census.
We have therefore used statistical information from the Statistics South Africa 2001 Census
(GIS, 2001) and the City of Cape Town 2007 population estimate figures for Philippi (GIS, 2007),
as well as the City of Cape Town Socioeconomic Profiles of Wards 33 and 80 (City of Cape Town,
2006a; 2006b) . Below is an analysis of the statistical information that would be most useful and
relevant to the SAEP. Refer to the Appendix A to find a copy of the Philippi data from the 2001
Census (GIS, 2001).
General information
The following statistical analysis indicates the socio-economic profile of Philippi. The largest
areas that make up Philippi are Philippi East, Philippi West, Browns Farm and Samora Machel,
Weltervreden Valley. This report will discuss a number of issues pertaining to service delivery.
13
One of the services focused on will be the sanitation of Philippi and reference will be made to
the bucket system. The bucket system refers a system of flush toilet sewage sanitation in
communities that lack a water-borne sewage system. The bucket sits under a wooden frame
affixed with a toilet seat lid, and “sludge is collected (weekly, monthly and six monthly basis
depending on the size of the container used), transported and emptied into the main sewer”
(Midrand State Environment Report, 1999: 26). The bucket toilet system is unhygienic at best,
and more so when poor service delivery results in the buckets not being emptied for weeks,
and is the cause of many diseases such as diarrhoea, intestinal helminth infestation,
poliomyelitis, typhoid, schistosomiasis and cholera (Manona, 2004).
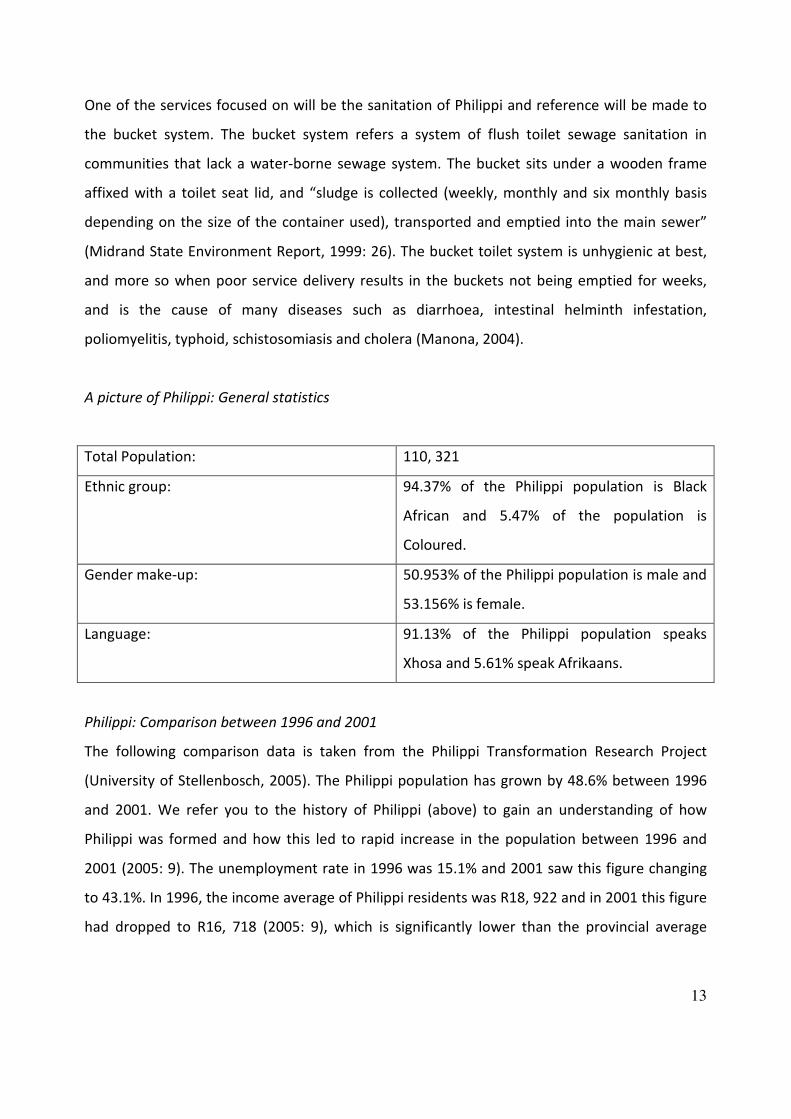
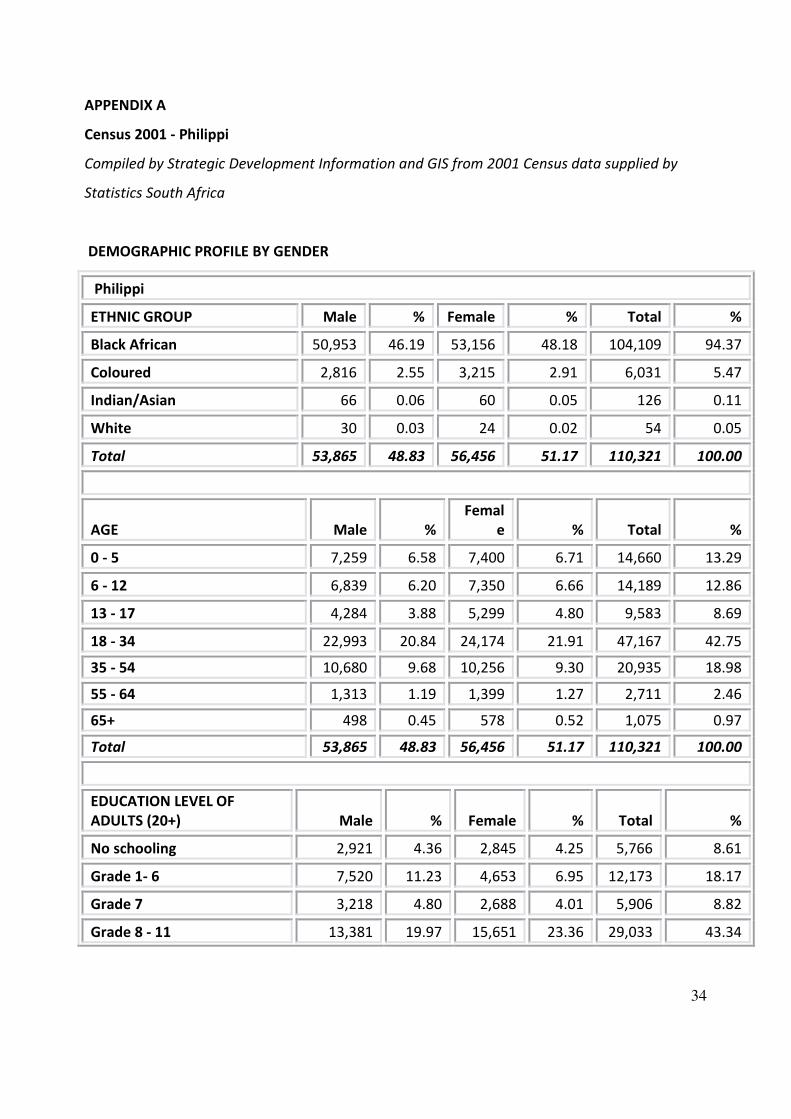
A picture of Philippi: General statistics
Total Population: 110, 321
Ethnic group: 94.37% of the Philippi population is Black
African and 5.47% of the population is
Coloured.
Gender make-up: 50.953% of the Philippi population is male and
53.156% is female.
Language: 91.13% of the Philippi population speaks
Xhosa and 5.61% speak Afrikaans.
Philippi: Comparison between 1996 and 2001
The following comparison data is taken from the Philippi Transformation Research Project
(University of Stellenbosch, 2005). The Philippi population has grown by 48.6% between 1996
and 2001. We refer you to the history of Philippi (above) to gain an understanding of how
Philippi was formed and how this led to rapid increase in the population between 1996 and
2001 (2005: 9). The unemployment rate in 1996 was 15.1% and 2001 saw this figure changing
to 43.1%. In 1996, the income average of Philippi residents was R18, 922 and in 2001 this figure
had dropped to R16, 718 (2005: 9), which is significantly lower than the provincial average
14
income of R76, 000 a year (2005: 9). In terms of service delivery, 8.5% of people have water in
their dwellings, 53. 2% have access to piped water on site and 32.7% access water from public
taps (2005: 9). Aids or Aids related deaths account for 17.55% to 31. 48% of deaths in Philippi
(2005: 25).
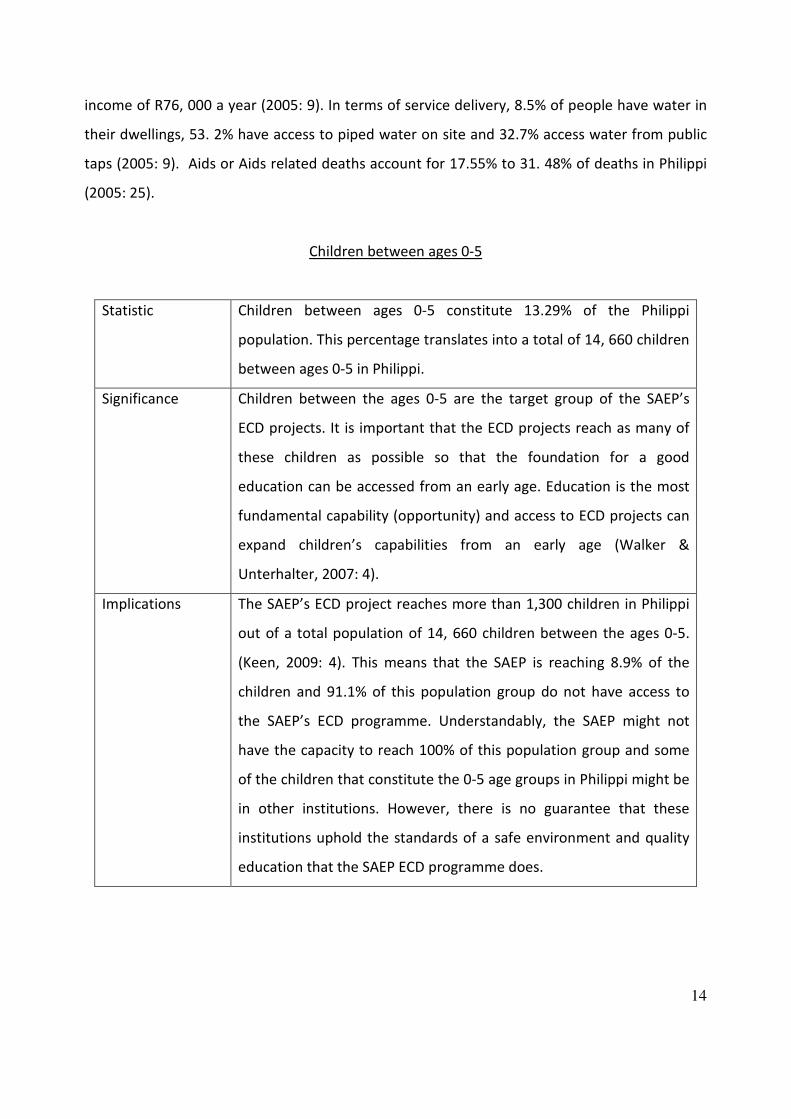
Children between ages 0-5
Statistic Children between ages 0-5 constitute 13.29% of the Philippi
population. This percentage translates into a total of 14, 660 children
between ages 0-5 in Philippi.
Significance Children between the ages 0-5 are the target group of the SAEP’s
ECD projects. It is important that the ECD projects reach as many of
these children as possible so that the foundation for a good
education can be accessed from an early age. Education is the most
fundamental capability (opportunity) and access to ECD projects can
expand children’s capabilities from an early age (Walker &
Unterhalter, 2007: 4).
Implications The SAEP’s ECD project reaches more than 1,300 children in Philippi
out of a total population of 14, 660 children between the ages 0-5.
(Keen, 2009: 4). This means that the SAEP is reaching 8.9% of the
children and 91.1% of this population group do not have access to
the SAEP’s ECD programme. Understandably, the SAEP might not
have the capacity to reach 100% of this population group and some
of the children that constitute the 0-5 age groups in Philippi might be
in other institutions. However, there is no guarantee that these
institutions uphold the standards of a safe environment and quality
education that the SAEP ECD programme does.
15
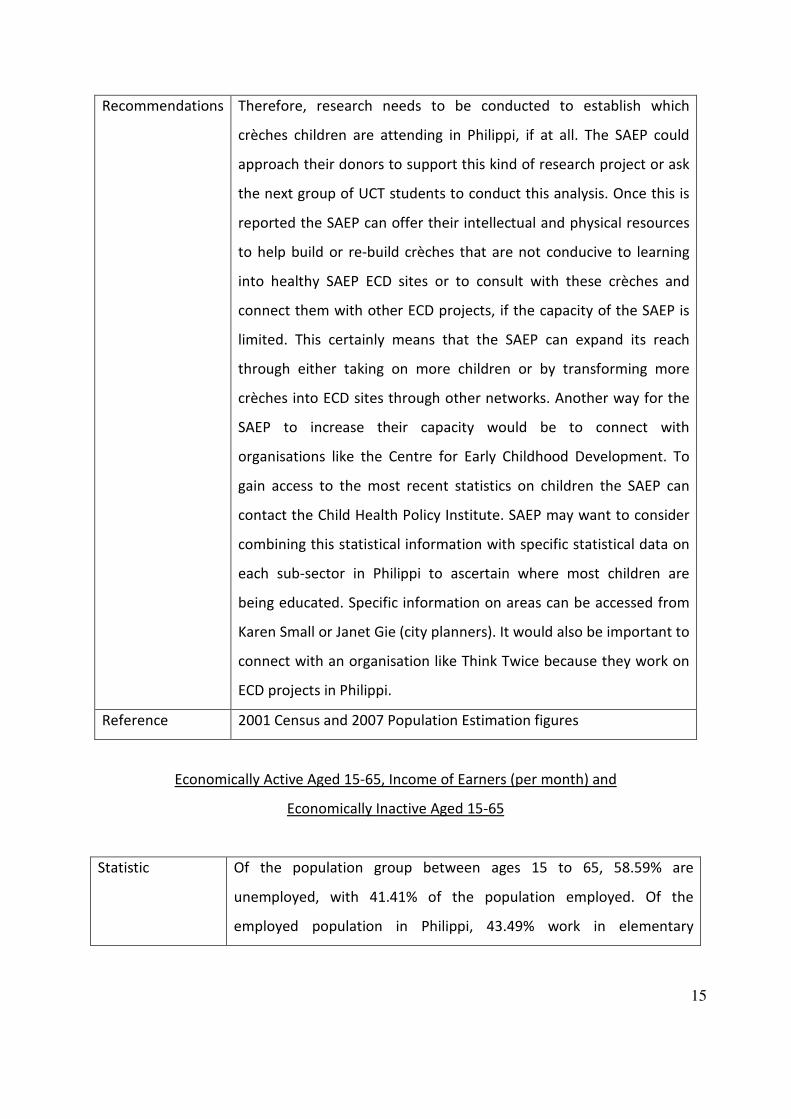
Recommendations Therefore, research needs to be conducted to establish which
crèches children are attending in Philippi, if at all. The SAEP could
approach their donors to support this kind of research project or ask
the next group of UCT students to conduct this analysis. Once this is
reported the SAEP can offer their intellectual and physical resources
to help build or re-build crèches that are not conducive to learning
into healthy SAEP ECD sites or to consult with these crèches and
connect them with other ECD projects, if the capacity of the SAEP is
limited. This certainly means that the SAEP can expand its reach
through either taking on more children or by transforming more
crèches into ECD sites through other networks. Another way for the
SAEP to increase their capacity would be to connect with
organisations like the Centre for Early Childhood Development. To
gain access to the most recent statistics on children the SAEP can
contact the Child Health Policy Institute. SAEP may want to consider
combining this statistical information with specific statistical data on
each sub-sector in Philippi to ascertain where most children are
being educated. Specific information on areas can be accessed from
Karen Small or Janet Gie (city planners). It would also be important to
connect with an organisation like Think Twice because they work on
ECD projects in Philippi.
Reference 2001 Census and 2007 Population Estimation figures
Economically Active Aged 15-65, Income of Earners (per month) and
Economically Inactive Aged 15-65
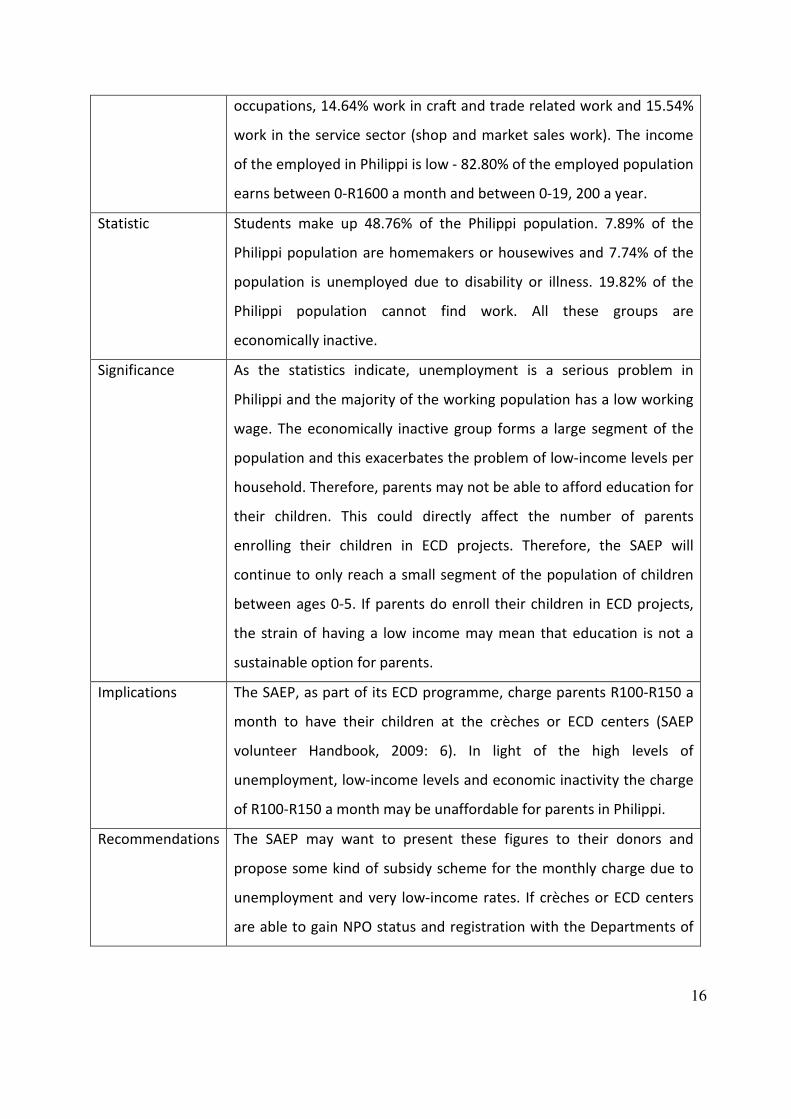
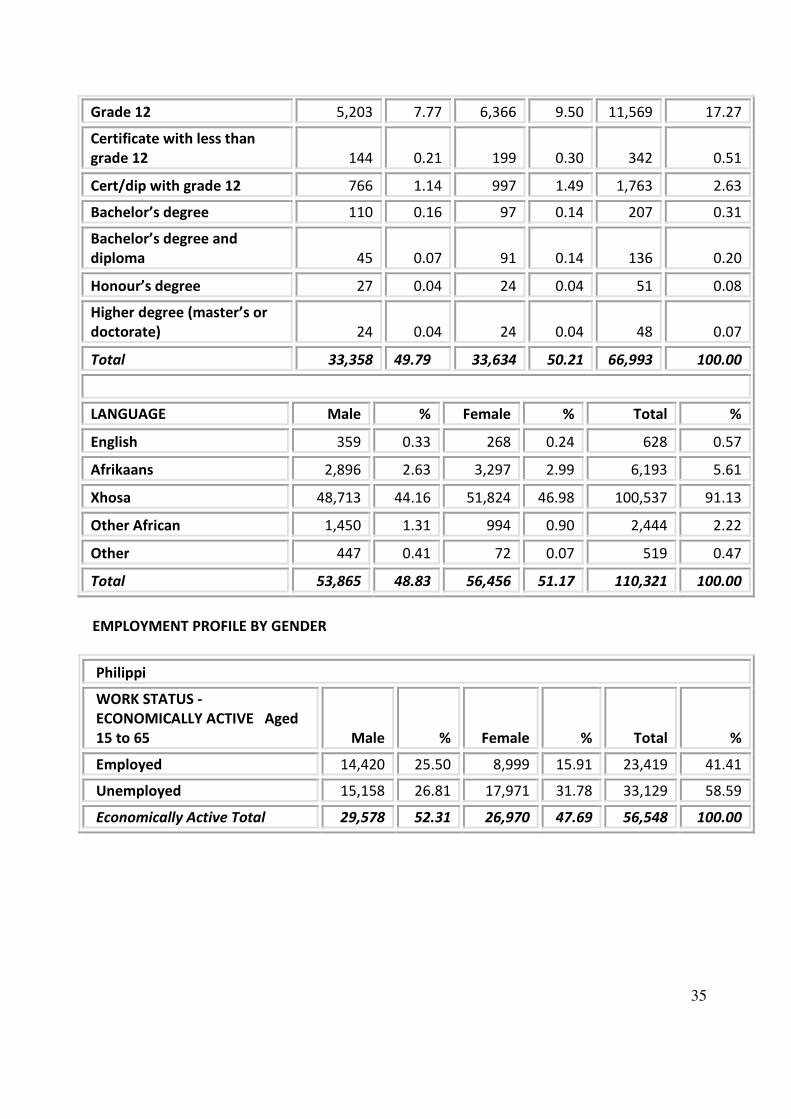
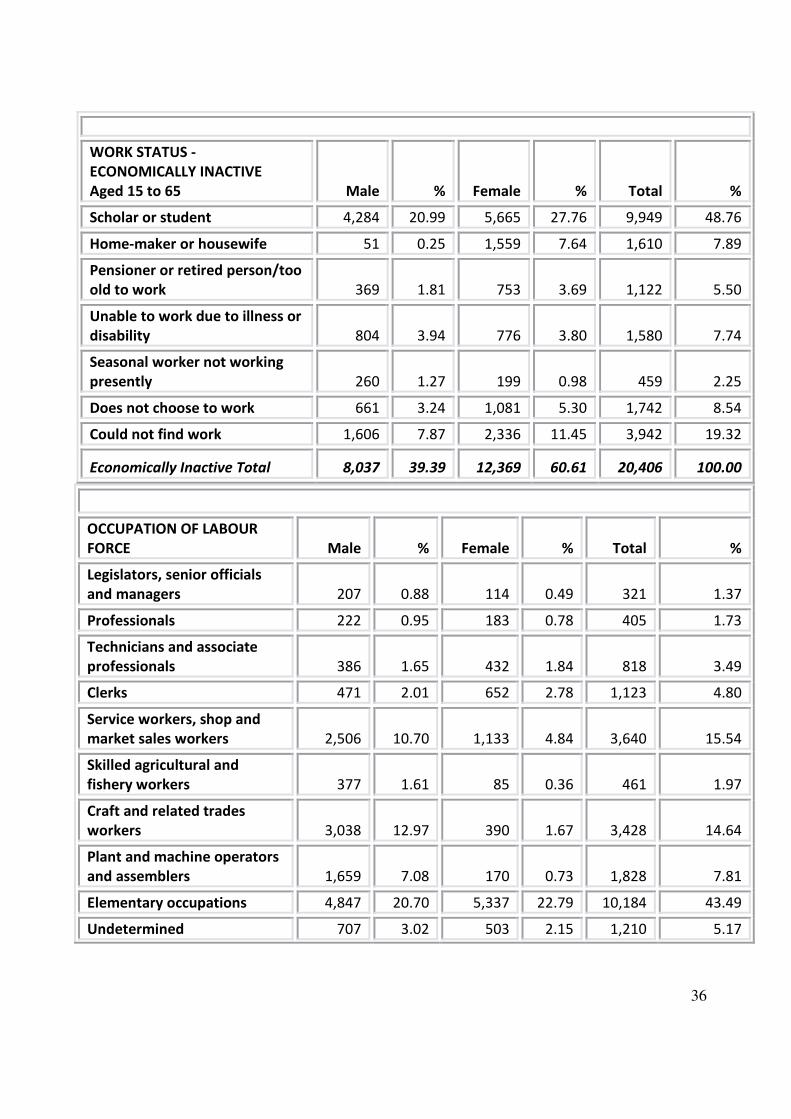
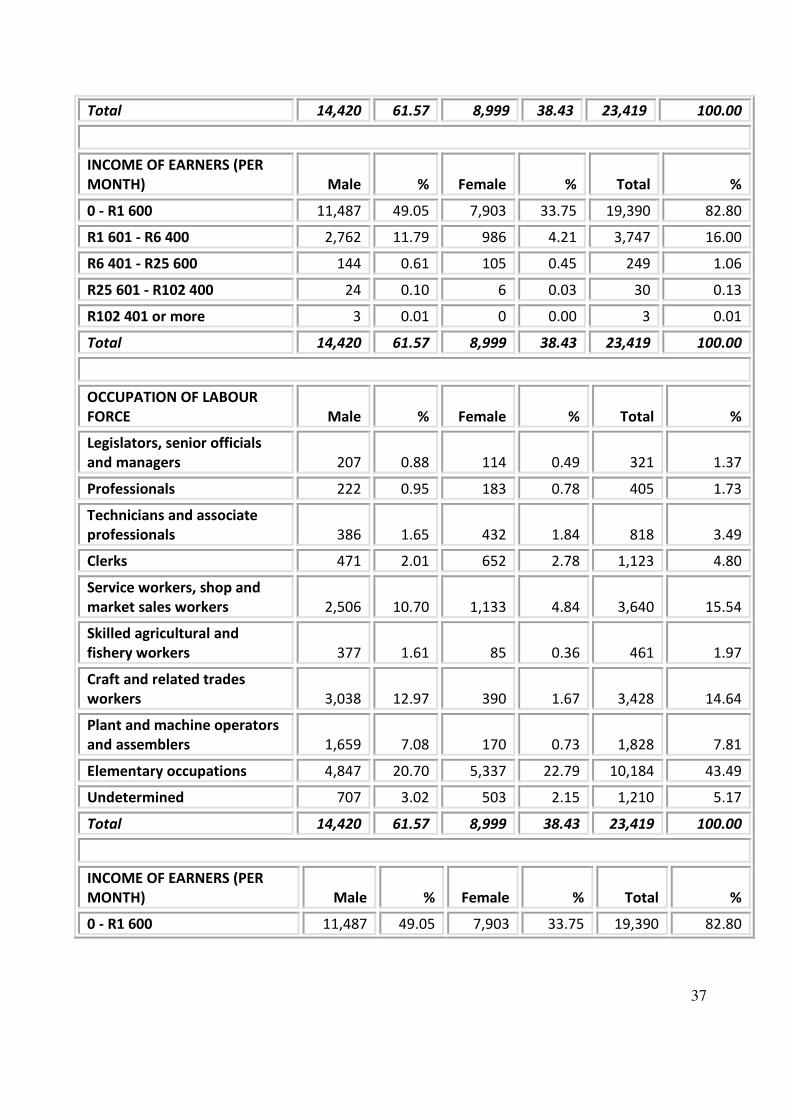
Statistic Of the population group between ages 15 to 65, 58.59% are
unemployed, with 41.41% of the population employed. Of the
employed population in Philippi, 43.49% work in elementary
16
occupations, 14.64% work in craft and trade related work and 15.54%
work in the service sector (shop and market sales work). The income
of the employed in Philippi is low - 82.80% of the employed population
earns between 0-R1600 a month and between 0-19, 200 a year.
Statistic Students make up 48.76% of the Philippi population. 7.89% of the
Philippi population are homemakers or housewives and 7.74% of the
population is unemployed due to disability or illness. 19.82% of the
Philippi population cannot find work. All these groups are
economically inactive.
Significance As the statistics indicate, unemployment is a serious problem in
Philippi and the majority of the working population has a low working
wage. The economically inactive group forms a large segment of the
population and this exacerbates the problem of low-income levels per
household. Therefore, parents may not be able to afford education for
their children. This could directly affect the number of parents
enrolling their children in ECD projects. Therefore, the SAEP will
continue to only reach a small segment of the population of children
between ages 0-5. If parents do enroll their children in ECD projects,
the strain of having a low income may mean that education is not a
sustainable option for parents.
Implications The SAEP, as part of its ECD programme, charge parents R100-R150 a
month to have their children at the crèches or ECD centers (SAEP
volunteer Handbook, 2009: 6). In light of the high levels of
unemployment, low-income levels and economic inactivity the charge
of R100-R150 a month may be unaffordable for parents in Philippi.
Recommendations The SAEP may want to present these figures to their donors and
propose some kind of subsidy scheme for the monthly charge due to
unemployment and very low-income rates. If crèches or ECD centers
are able to gain NPO status and registration with the Departments of
17
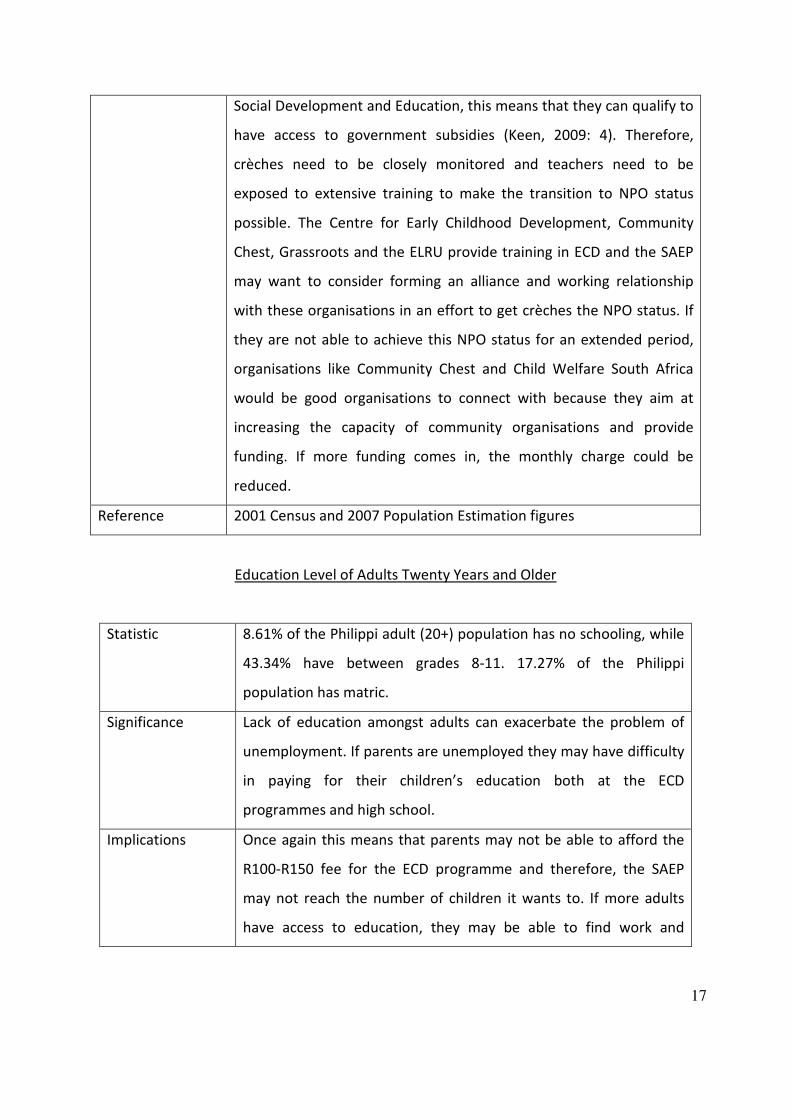
Social Development and Education, this means that they can qualify to
have access to government subsidies (Keen, 2009: 4). Therefore,
crèches need to be closely monitored and teachers need to be
exposed to extensive training to make the transition to NPO status
possible. The Centre for Early Childhood Development, Community
Chest, Grassroots and the ELRU provide training in ECD and the SAEP
may want to consider forming an alliance and working relationship
with these organisations in an effort to get crèches the NPO status. If
they are not able to achieve this NPO status for an extended period,
organisations like Community Chest and Child Welfare South Africa
would be good organisations to connect with because they aim at
increasing the capacity of community organisations and provide
funding. If more funding comes in, the monthly charge could be
reduced.
Reference 2001 Census and 2007 Population Estimation figures
Education Level of Adults Twenty Years and Older
Statistic 8.61% of the Philippi adult (20+) population has no schooling, while
43.34% have between grades 8-11. 17.27% of the Philippi
population has matric.
Significance Lack of education amongst adults can exacerbate the problem of
unemployment. If parents are unemployed they may have difficulty
in paying for their children’s education both at the ECD
programmes and high school.
Implications Once again this means that parents may not be able to afford the
R100-R150 fee for the ECD programme and therefore, the SAEP
may not reach the number of children it wants to. If more adults
have access to education, they may be able to find work and
18
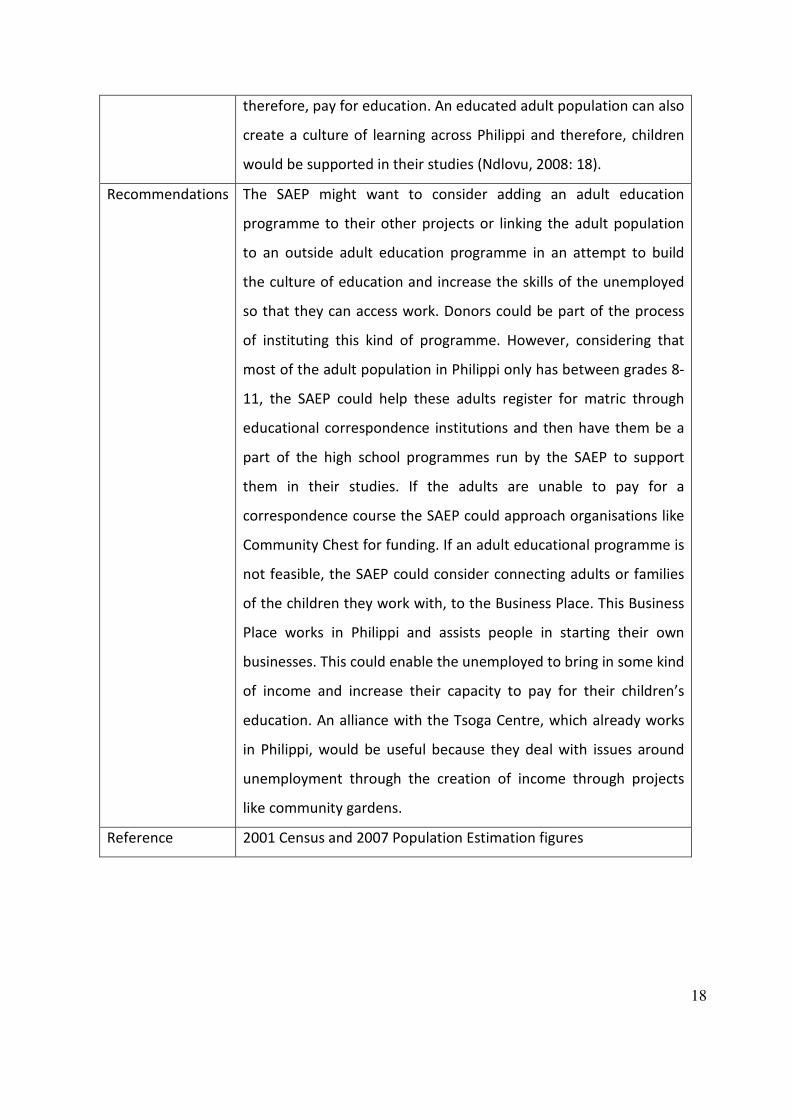
therefore, pay for education. An educated adult population can also
create a culture of learning across Philippi and therefore, children
would be supported in their studies (Ndlovu, 2008: 18).
Recommendations The SAEP might want to consider adding an adult education
programme to their other projects or linking the adult population
to an outside adult education programme in an attempt to build
the culture of education and increase the skills of the unemployed
so that they can access work. Donors could be part of the process
of instituting this kind of programme. However, considering that
most of the adult population in Philippi only has between grades 8-
11, the SAEP could help these adults register for matric through
educational correspondence institutions and then have them be a
part of the high school programmes run by the SAEP to support
them in their studies. If the adults are unable to pay for a
correspondence course the SAEP could approach organisations like
Community Chest for funding. If an adult educational programme is
not feasible, the SAEP could consider connecting adults or families
of the children they work with, to the Business Place. This Business
Place works in Philippi and assists people in starting their own
businesses. This could enable the unemployed to bring in some kind
of income and increase their capacity to pay for their children’s
education. An alliance with the Tsoga Centre, which already works
in Philippi, would be useful because they deal with issues around
unemployment through the creation of income through projects
like community gardens.
Reference 2001 Census and 2007 Population Estimation figures
19
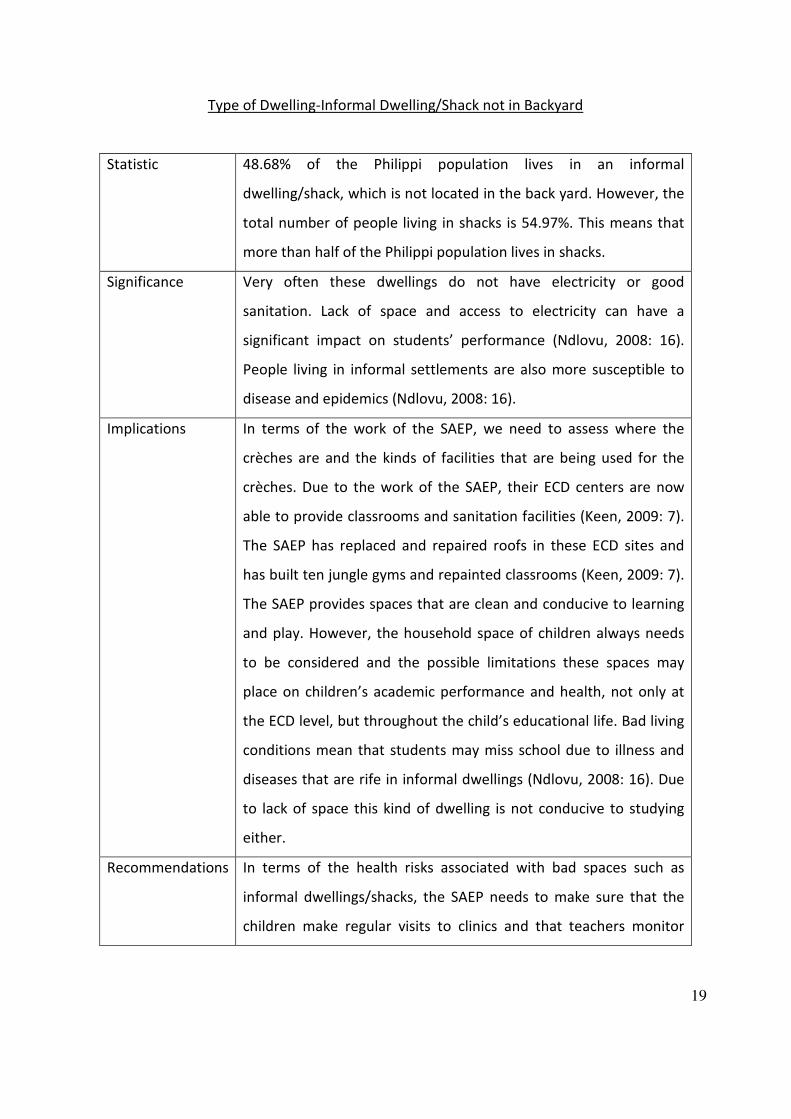
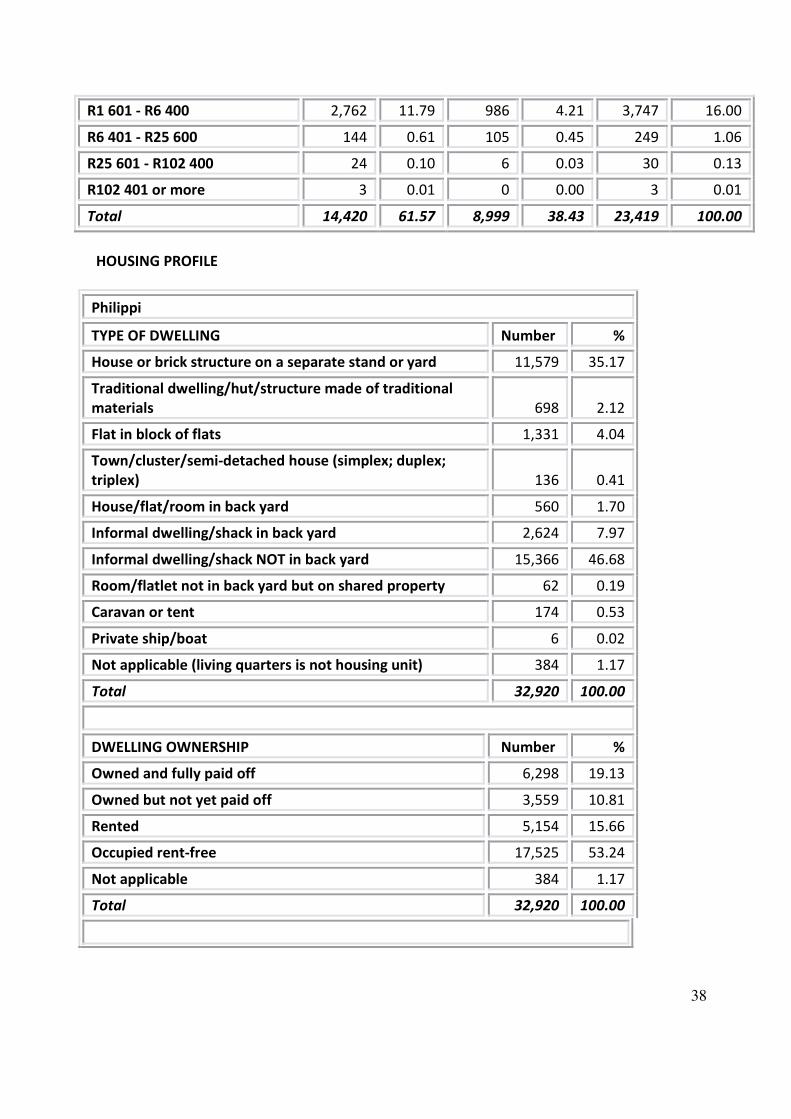
Type of Dwelling-Informal Dwelling/Shack not in Backyard
Statistic 48.68% of the Philippi population lives in an informal
dwelling/shack, which is not located in the back yard. However, the
total number of people living in shacks is 54.97%. This means that
more than half of the Philippi population lives in shacks.
Significance Very often these dwellings do not have electricity or good
sanitation. Lack of space and access to electricity can have a
significant impact on students’ performance (Ndlovu, 2008: 16).
People living in informal settlements are also more susceptible to
disease and epidemics (Ndlovu, 2008: 16).
Implications In terms of the work of the SAEP, we need to assess where the
crèches are and the kinds of facilities that are being used for the
crèches. Due to the work of the SAEP, their ECD centers are now
able to provide classrooms and sanitation facilities (Keen, 2009: 7).
The SAEP has replaced and repaired roofs in these ECD sites and
has built ten jungle gyms and repainted classrooms (Keen, 2009: 7).
The SAEP provides spaces that are clean and conducive to learning
and play. However, the household space of children always needs
to be considered and the possible limitations these spaces may
place on children’s academic performance and health, not only at
the ECD level, but throughout the child’s educational life. Bad living
conditions mean that students may miss school due to illness and
diseases that are rife in informal dwellings (Ndlovu, 2008: 16). Due
to lack of space this kind of dwelling is not conducive to studying
either.
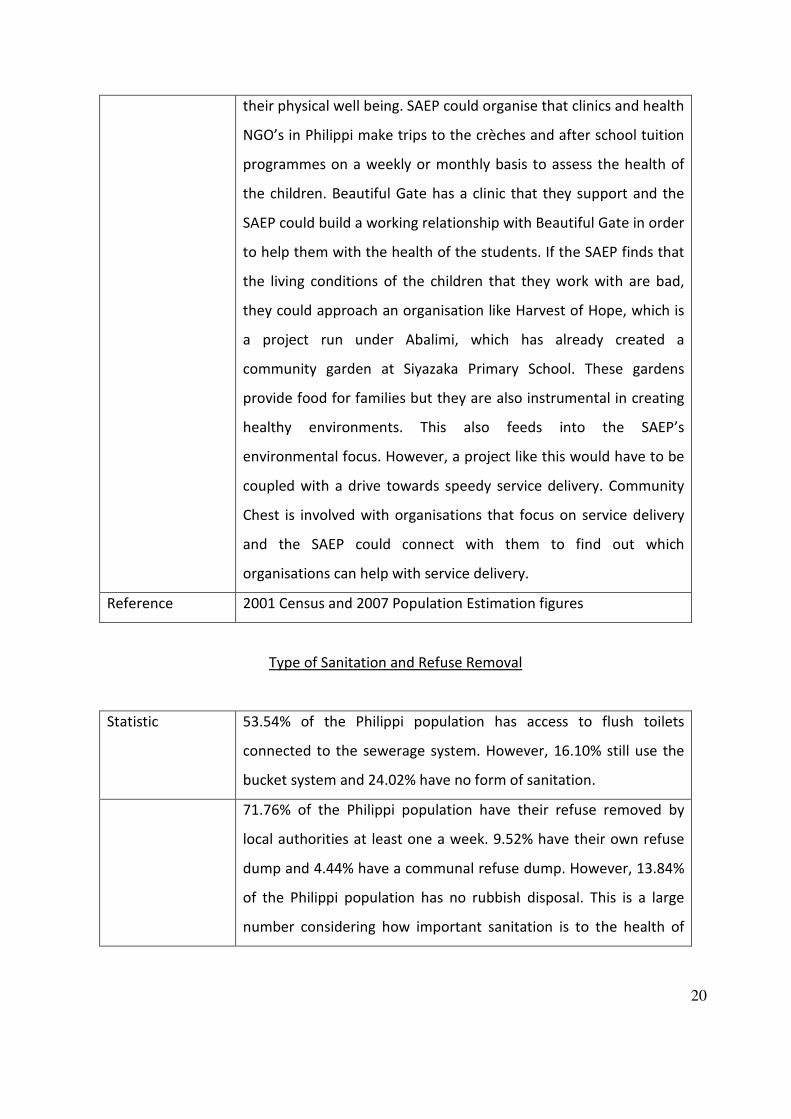
Recommendations In terms of the health risks associated with bad spaces such as
informal dwellings/shacks, the SAEP needs to make sure that the
children make regular visits to clinics and that teachers monitor
20
their physical well being. SAEP could organise that clinics and health
NGO’s in Philippi make trips to the crèches and after school tuition
programmes on a weekly or monthly basis to assess the health of
the children. Beautiful Gate has a clinic that they support and the
SAEP could build a working relationship with Beautiful Gate in order
to help them with the health of the students. If the SAEP finds that
the living conditions of the children that they work with are bad,
they could approach an organisation like Harvest of Hope, which is
a project run under Abalimi, which has already created a
community garden at Siyazaka Primary School. These gardens
provide food for families but they are also instrumental in creating
healthy environments. This also feeds into the SAEP’s
environmental focus. However, a project like this would have to be
coupled with a drive towards speedy service delivery. Community
Chest is involved with organisations that focus on service delivery
and the SAEP could connect with them to find out which
organisations can help with service delivery.
Reference 2001 Census and 2007 Population Estimation figures
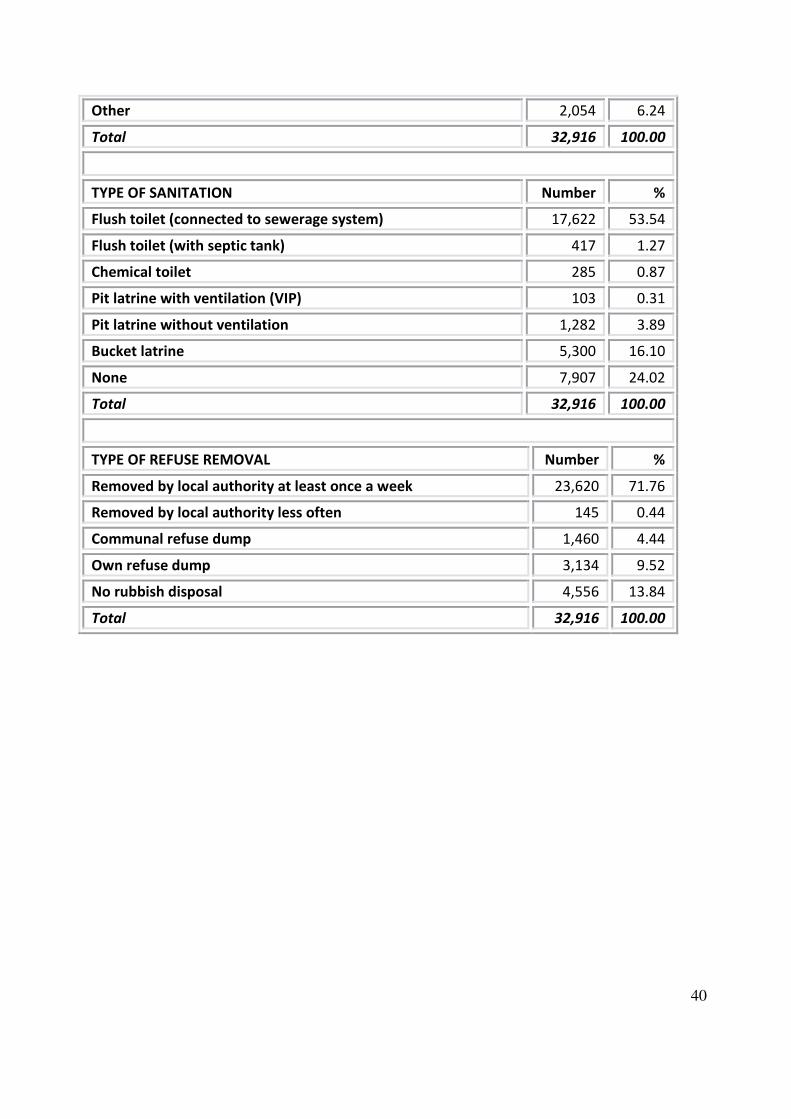
Type of Sanitation and Refuse Removal
Statistic 53.54% of the Philippi population has access to flush toilets
connected to the sewerage system. However, 16.10% still use the
bucket system and 24.02% have no form of sanitation.
71.76% of the Philippi population have their refuse removed by
local authorities at least one a week. 9.52% have their own refuse
dump and 4.44% have a communal refuse dump. However, 13.84%
of the Philippi population has no rubbish disposal. This is a large
number considering how important sanitation is to the health of
21
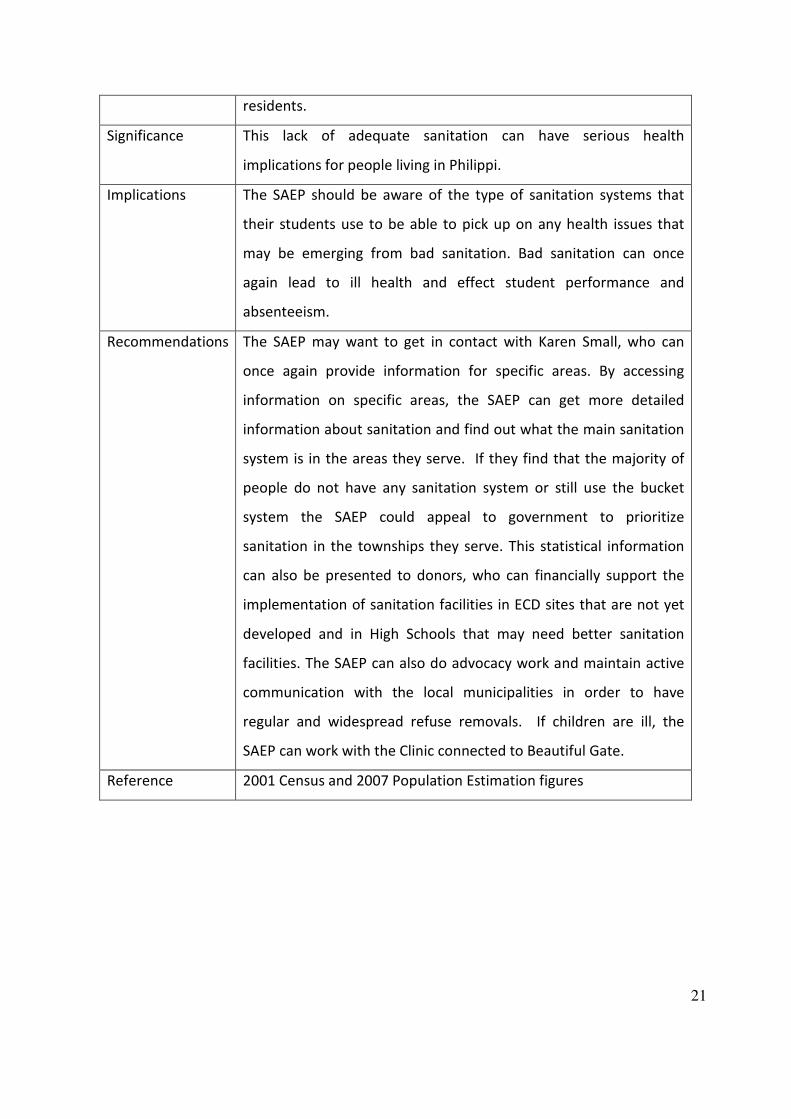
residents.
Significance This lack of adequate sanitation can have serious health
implications for people living in Philippi.
Implications The SAEP should be aware of the type of sanitation systems that
their students use to be able to pick up on any health issues that
may be emerging from bad sanitation. Bad sanitation can once
again lead to ill health and effect student performance and
absenteeism.
Recommendations The SAEP may want to get in contact with Karen Small, who can
once again provide information for specific areas. By accessing
information on specific areas, the SAEP can get more detailed
information about sanitation and find out what the main sanitation
system is in the areas they serve. If they find that the majority of
people do not have any sanitation system or still use the bucket
system the SAEP could appeal to government to prioritize
sanitation in the townships they serve. This statistical information
can also be presented to donors, who can financially support the
implementation of sanitation facilities in ECD sites that are not yet
developed and in High Schools that may need better sanitation
facilities. The SAEP can also do advocacy work and maintain active
communication with the local municipalities in order to have
regular and widespread refuse removals. If children are ill, the
SAEP can work with the Clinic connected to Beautiful Gate.
Reference 2001 Census and 2007 Population Estimation figures
22
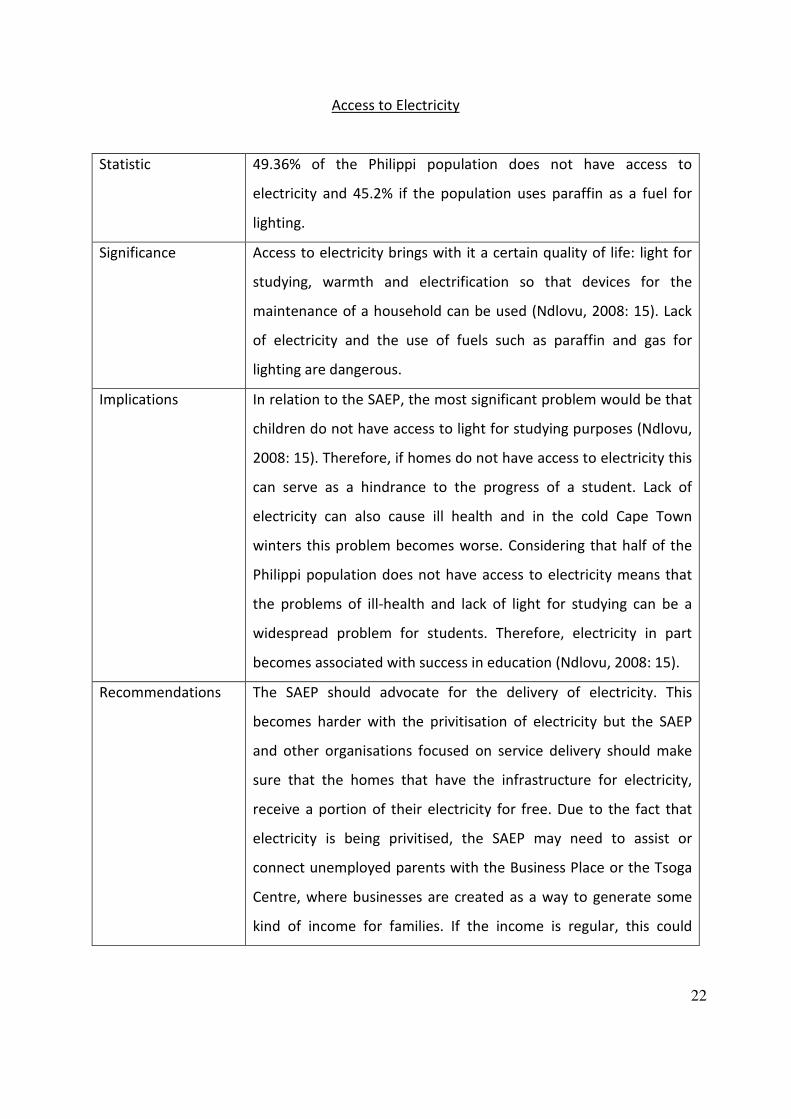
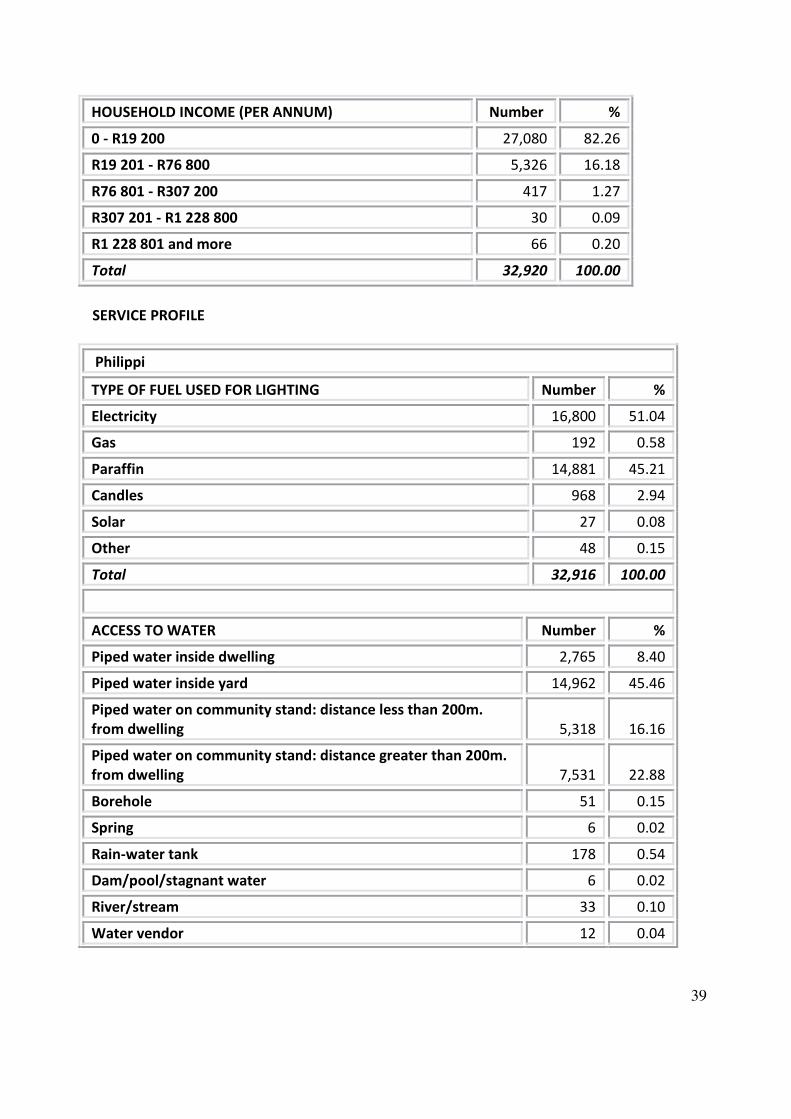
Access to Electricity
Statistic 49.36% of the Philippi population does not have access to
electricity and 45.2% if the population uses paraffin as a fuel for
lighting.
Significance Access to electricity brings with it a certain quality of life: light for
studying, warmth and electrification so that devices for the
maintenance of a household can be used (Ndlovu, 2008: 15). Lack
of electricity and the use of fuels such as paraffin and gas for
lighting are dangerous.
Implications In relation to the SAEP, the most significant problem would be that
children do not have access to light for studying purposes (Ndlovu,
2008: 15). Therefore, if homes do not have access to electricity this
can serve as a hindrance to the progress of a student. Lack of
electricity can also cause ill health and in the cold Cape Town
winters this problem becomes worse. Considering that half of the
Philippi population does not have access to electricity means that
the problems of ill-health and lack of light for studying can be a
widespread problem for students. Therefore, electricity in part
becomes associated with success in education (Ndlovu, 2008: 15).
Recommendations The SAEP should advocate for the delivery of electricity. This
becomes harder with the privitisation of electricity but the SAEP
and other organisations focused on service delivery should make
sure that the homes that have the infrastructure for electricity,
receive a portion of their electricity for free. Due to the fact that
electricity is being privitised, the SAEP may need to assist or
connect unemployed parents with the Business Place or the Tsoga
Centre, where businesses are created as a way to generate some
kind of income for families. If the income is regular, this could
23
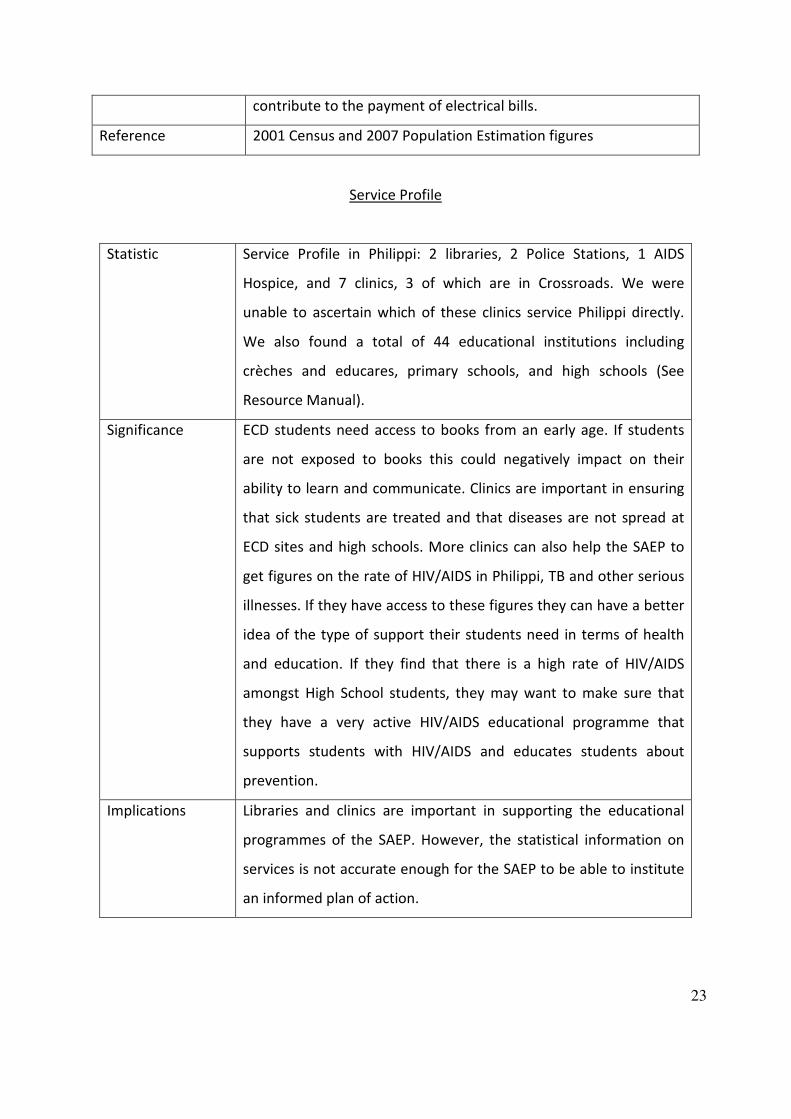
contribute to the payment of electrical bills.
Reference 2001 Census and 2007 Population Estimation figures
Service Profile
Statistic Service Profile in Philippi: 2 libraries, 2 Police Stations, 1 AIDS
Hospice, and 7 clinics, 3 of which are in Crossroads. We were
unable to ascertain which of these clinics service Philippi directly.
We also found a total of 44 educational institutions including
crèches and educares, primary schools, and high schools (See
Resource Manual).
Significance ECD students need access to books from an early age. If students
are not exposed to books this could negatively impact on their
ability to learn and communicate. Clinics are important in ensuring
that sick students are treated and that diseases are not spread at
ECD sites and high schools. More clinics can also help the SAEP to
get figures on the rate of HIV/AIDS in Philippi, TB and other serious
illnesses. If they have access to these figures they can have a better
idea of the type of support their students need in terms of health
and education. If they find that there is a high rate of HIV/AIDS
amongst High School students, they may want to make sure that
they have a very active HIV/AIDS educational programme that
supports students with HIV/AIDS and educates students about
prevention.
Implications Libraries and clinics are important in supporting the educational
programmes of the SAEP. However, the statistical information on
services is not accurate enough for the SAEP to be able to institute
an informed plan of action.
24
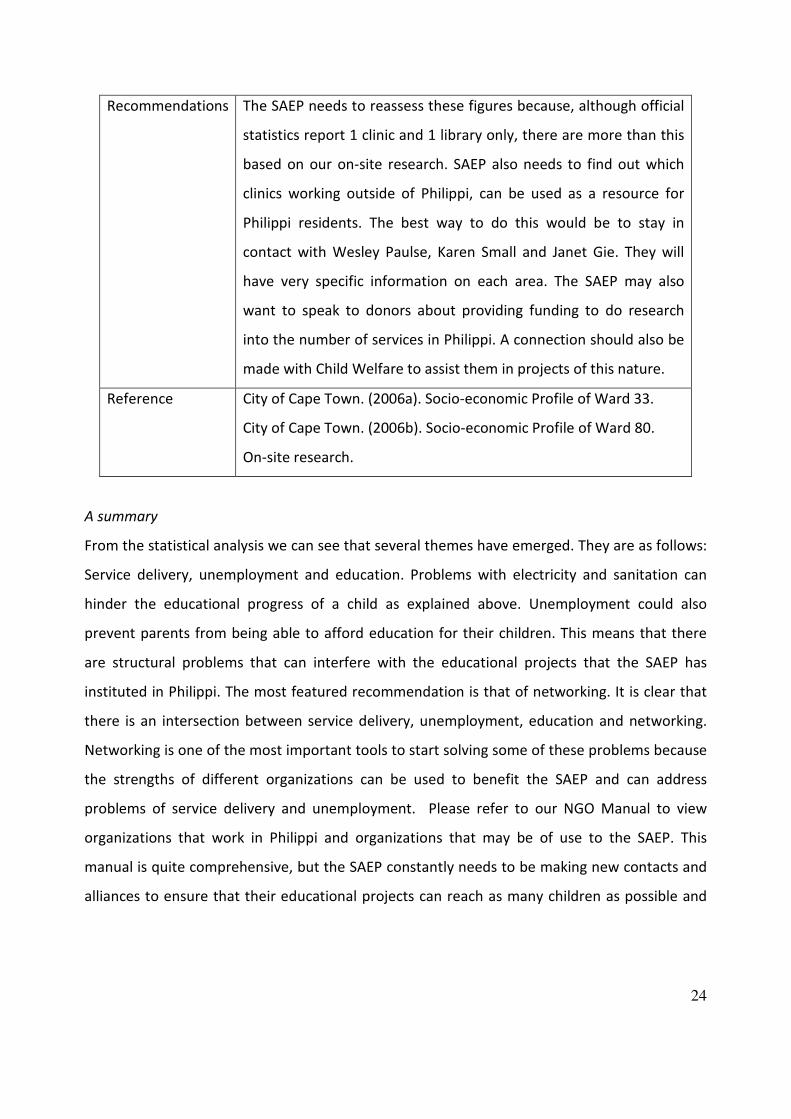
Recommendations The SAEP needs to reassess these figures because, although official
statistics report 1 clinic and 1 library only, there are more than this
based on our on-site research. SAEP also needs to find out which
clinics working outside of Philippi, can be used as a resource for
Philippi residents. The best way to do this would be to stay in
contact with Wesley Paulse, Karen Small and Janet Gie. They will
have very specific information on each area. The SAEP may also
want to speak to donors about providing funding to do research
into the number of services in Philippi. A connection should also be
made with Child Welfare to assist them in projects of this nature.
Reference City of Cape Town. (2006a). Socio-economic Profile of Ward 33.
City of Cape Town. (2006b). Socio-economic Profile of Ward 80.
On-site research.
A summary
From the statistical analysis we can see that several themes have emerged. They are as follows:
Service delivery, unemployment and education. Problems with electricity and sanitation can
hinder the educational progress of a child as explained above. Unemployment could also
prevent parents from being able to afford education for their children. This means that there
are structural problems that can interfere with the educational projects that the SAEP has
instituted in Philippi. The most featured recommendation is that of networking. It is clear that
there is an intersection between service delivery, unemployment, education and networking.
Networking is one of the most important tools to start solving some of these problems because
the strengths of different organizations can be used to benefit the SAEP and can address
problems of service delivery and unemployment. Please refer to our NGO Manual to view
organizations that work in Philippi and organizations that may be of use to the SAEP. This
manual is quite comprehensive, but the SAEP constantly needs to be making new contacts and
alliances to ensure that their educational projects can reach as many children as possible and
25
that issues of service delivery and unemployment that impact on education can be addressed
by outside organizations. For more suggestions, see below (Output Four: Recommendations).
Output Four: Scope of NGO and CBO sector
Research Aim
The fourth output including in this project is a description of the non-governmental and
community based organisation sector operating in Philippi. Like the sections above, this output
was inhibited by time-constraints. In addition, as the research proceeded, we became aware
that the scope of the NGO/CBO sector in Philippi was much larger than we had expected. We
do not believe that the list of organisations included in the “Resource Manual” is exhaustive,
but it does provide a substantial base from which to locate other organisations in the future.
Several key contacts did not respond to our numerous requests for information –
telephonically, via email, or in person. Counsellor Monwabisi Mbaliswana (Ward 33) was
unavailable, and several contacts referred him as a particularly useful resource for this section
of the project. Wesley Paulse, project manager for the 2005/2006 City of Cape Town Philippi
Profile also did not reply to email correspondence. Several other potential resource people are
included in Appendix B and we strongly advise the SAEP to pursue contact with these resources
in the continual assessment of this output.
Process
A primary list of organisations was compiled after talking with several SAEP volunteers and staff
members, including Jane Keen, Norton Tennille, Shep Willis, Charles Hamnett, and Isabel
Babenschneider. This list was surprisingly small and highlighted the potential value of the
Resource Manual to the SAEP. Next, we consulted a web-based resource site, Greater Good
South Africa (www.myggsa.co.za). The site aims to bring good causes and committed givers
together and has a database of 1600 good causes – including NGOs, Faith-based organisations,
and CBOs. A search of the site, for organisations working in Cape Town, yielded several other
results. An email was sent to all organisations on this primary list, describing the project and
requesting four pieces of information: the organisation’s physical address, a description of the
26
organisation’s work in Philippi, a list of other organisations or service providers known to be
working in Philippi, and further contacts which could be of help to the project. Of particular use
in this respect were Beautiful Gate, whom we interviewed at their premises in Lower
Crossroads, and The Warehouse who provided excellent mapping and statistics contacts as well
as a rudimentary profile of Sweet Home Farm, Philippi. Additional NGOs, CBOs and government
organisations working in Philippi were gathered from newspaper articles, archival research and
reports, personal contacts and web searches. With the aid of organisation’s websites and
personal communication, the final Resource Manual was compiled. The manual consists of two
parts: Community Service Organisations and Educational/Tutoring Organisations, as per Shep
Willis’ suggestion. The manual is arranged alphabetically and includes the organisation’s
purpose, projects, contact details (including website, address, email, phone number, and
contact person), and NBO/PBO status and number. There are 41 organisations included in the
manual, all of whom are currently active in Philippi, except for several tutoring organisations
who are working in schools which are in the Philippi school catchment area. In addition, there
are a further 11 organisations, included at the back of the manual, which we refer to in making
recommendations for new SAEP strategic networking.
Recommendations
Martha Lagace (2005) discusses the work Harvard Business School professor, Jane Wei-Skillern,
has undertaken in exploring the role that strategic networking can play in increasing a NPOs
social impact. Wei-Skillern’s research (Lagace, 2005) suggests that a focus on building network
relationships with like-minded groups – including competitors – can increase an organisation’s
ability to serve more people, more effectively. Ad hoc networking is fairly common in non-profit
and commercial sectors, where organisations partner around a specific goal, but they do not
play as big a role in the day-to-day operations of NPOs. However, Wei-Skillern (Lagace, 2005)
notes that networks are useful in three respects: parties discuss and work through problems
rather than simply abandoning the relationship; there is a high level of trust; there is a “norm of
reciprocity” as parties share with and help each other. Thus, networks aid communication,
cooperation and co-ordination. Other benefits include: “mutual learning; enhanced legitimacy
27
and status for the members; economic power; and an enhanced ability to manage uncertainty”
(Lagace, 2005) The author goes on to note that because the issues NPOs are trying to solve are
large, complex problems that can't be addressed by any single entity, their task lends itself to
networking.
Here we make some suggestions for potential relationships and networking possibilities,
emerging from our understanding of the SAEP’s mission and knowledge of other organisations
working in Philippi. Kaplan (1994), writing at an important juncture in South African history,
questioned whether small NGOs providing resources and services had the resource capacity to
really make a dent in the overwhelming issues facing the new democracy or whether they were
merely alleviating symptoms of distress. Edwards and Hulme (1998) argue that the pressure on
NPOs to ‘fill the gap left by the state in service delivery comes at the expense of their advocacy
and social watchdog role. Small NPOs especially lack the financial and human resources,
organization skills, and – importantly – appropriate networks to engage with the state (Kaplan,
1994; Swilling & Russell, 2002). They may also lack the financial and skill capacity to make a
noticeable difference to the communities in which they operate, often merely putting plasters
on social ills. However, their proximity to communities at the grassroots level is invaluable to
government departments and while CBOs lack the capacity to communicate their privileged
knowledge to the state, strategic links with larger, professional NGOs who do have the
necessary skills to communicate with government should be sought. The SAEP has crucial
resources which can be used to strengthen ‘small’ NGOs and CBOs working in Philippi,
enhancing the overall effectiveness of service delivery in the area. In addition, the SAEP can
draw on the strengths, resources, and organizational capabilities of other large NPOs in the
area, to enhance its own service deliver and maximize its effectiveness.
Tutoring Organisations: There are several tutoring organisations working in high schools in the
Philippi area, including Inkanyezi, Go for Gold, LEAP Maths and Science School, Ubunye and
Yabonga. In addition, ASSET, Ikamva Youth and Siyakhula are providing tutoring in schools in
surrounding townships such as Nyanga, Langa and Khayelitsha. There is substantial overlap in
28
the services offered and organisational structure of these organisations. We believe the SAEP is
aware of this overlap and the need to form stronger links between these organisations, to avoid
service duplication and strain on already stretched resources.
Environmental Programmes: Several environmental organisations are running in Philippi. In
particular, Harvest of Hope and Abalimi, the Tsoga Centre, PASCaP, and Ikamva Labantu are
involved in the establishment of community food gardens to encourage food security and to
enhance environmental rights and responsibilities. Many of these gardens serve as micro-
enterprise poverty alleviation initiatives. Ikamva Labantu works with communities to access
land, water, fencing, storage and supplies and food gardens have already been placed in many
Ikamva projects. The gardens produce nutritious food for children in child care centres, elderly
people in senior clubs, and orphans in foster care homes. Abalimi established a food garden at
Nontsebenziswano Educare which provides fresh for 119 children. Educare staff members work
in the garden and excess produce is donated to the poorest families and to Mzomomhle Clinic.
In addition, Harvest of Hope is an Abalimi distribution organisation which either sells locally or
gives away the excess produce from Abalimi gardens. The SAEP could consider partnering with
these organizations in establishing food gardens at all their Educare centres. The produce will
not only provide additional nutrition to children at the crèche, but provides useful skills to staff
members and parents, and may be used as an alternative income generating scheme to help
make the crèches more financially sustainable. This is an ideal area for SAEP volunteers to
initiate and work on.
The FoodBank: The FoodBank, based in Philippi, redistributes excess food from supermarkets,
restaurants, and food manufacturers to communities in need. Two of its programmes in
particular may be of use to the SAEP. The Lunch Buddies Programme distributes sandwiches
and fruit on a weekly basis to schools where children arrive at school hungry. The Nutrition
Development Programme trains beneficiaries in good food use and nutrition principles and
works toward community food security through a variety of methods including food gardening.
The SAEP could consider partnering with the FoodBank as a beneficiary either of food
29
redistribution directly, or through the Lunch Buddies Programme, while at the same time
receiving training from the FoodBank in setting up food gardens, in collaboration with the other
environmental organizations mentioned above.
Mobile InfoCentres: Inkanyezi runs Mobile InfoCentre which cater for learners through a drop-
in system where learners can find out information and get advice. Mobile internet and resource
file facilities, with assistants on hand, are available to help learners with the technology. The
SAEP might network with Inkanyezi in operating and extending the scope of these Centres.
Beautiful Gate: The SAEP could make use of Beautiful Gate’s Community Development Centre -
a resource centre aiming to support children and families by providing a training facility with
accommodation. In addition, Beautiful Gate has extensive premises and lends out several of its
rooms to NGOs and CBOs working in Philippi and Crossroads. Secondly, Beautiful Gate runs
ongoing youth development activities in the Crossroads and Philippi areas. The youth learn and
perform dramas, play sports, do life-skills programmes and actively “give back” to their own
community through community clean-up days, assisting in running holiday clubs for younger
kids, and so forth. Beautiful Gate is a significant NGO service provider in the Philippi area and
has good networks with other organizations. The SAEP should develop relationship with them –
not only to share resources, but the youth programme could be coupled with SAEP’s own work
in Philippi schools.
Business Place: The Accounting Mentorship Programme (AMPS) run by The Business Place is
designed to help clients develop a proper computerized bookkeeping system through a
“learning-by-doing” approach. The SAEP could approach the Business Place to help with SAEP-
aided crèches and educare centres in providing financial management and fundraising training
and in providing the Management Committee members with the skills to effectively and
sustainably manage the ECD centres.
30
Orphans and Vulnerable Children Network: The aim of the Orphan and Vulnerable Children
Network is to empower a network of women in the poorest settlements to identify and support
vulnerable children within their communities. Daily savings and loans serves the backbone of
the OVC network – where these community leaders walk door-to-door, collecting, recording,
and banking small change. This money serves a pool of resources to support existing
community initiatives, confront neighbourhood problems as they arise, and mobilize funds for
basic needs. In addition, in the Western Cape and KwaZulu-Natal, a network of community-run
crèches offer a safe, inexpensive childcare alternative for working parents. These crèches
request a small fee from parents who can afford to pay for child care services. This money is
used to subsidize the care of orphans or other vulnerable children in the surrounding
communities. The SAEP could consider partnering with the OVC in bringing SAEP-assisted
crèches onboard with the OVC network. In addition to the emotional and moral support
provided by the grassroots networking of crèche principals and community volunteers, a
‘savings club’ project amongst parents could provide an alternative way of subsidizing the
crèches if it is found that the R100-150 monthly fee is not being met by many parents.
Bright Kid Foundation: The Foundation has delivered four Edutainers to the Philippi area so far.
Bright Kid is looking into the possibility of Edutainer toy libraries stocked with educational toys
to remote areas throughout South Africa. It is intended that these libraries will be placed next
to pre-schools and pre-school teachers will select volunteers from the community, who will
then be trained as toy librarians. Bright Kid Foundation will convert a 40-foot container into a
toy library including: library shelves, age appropriate educational toys, storage, training and
play areas. Educational Toy Libraries have the potential to greatly impact pre-school children’s
future success, providing high quality educational material, which lay the foundations for vital
skills like fine and gross motor skills, numeracy and language. These toy Edutainers could be
used alongside the solid infrastructural and organizational foundations laid by the SAEP in the
crèches in Philippi. Bright Kid may be more inclined to pursue this avenue in collaboration with
an already established NGO such as the SAEP as this would provide greater sustainability. The
SAEP would benefit from the educational resources as well as the extra play space.
31
References
Adlard, G. (2009). An Introduction To Philippi. Unpublished Draft 1 4.11.08. Available on
request.
City of Cape Town. (1998). Socioeconomic Characteristics: Philippi. Urban Policy Report.
City of Cape Town. (2006a). A Socio-Economic Profile of Ward 33 (Kosovo, Philippi, Philippi
West, Samora Michel, Weltevreden Valley) looking at the Economic and Human Development
Department’s Programmes and Projects in 2005/06. Economic and Human Development
Department.
City of Cape Town. (2006b). A Socio-Economic Profile of Ward 80 (Browns Farm, Philippi)
looking at the Economic and Human Development Department’s Programmes and Projects in
2005/06. Economic and Human Development Department.
City of Cape Town. (2007). Philippi Heritage Information Brochure.
Retrieved on September 20, 2009 at
http://www.capetown.gov.za/en/EnvironmentalResourceManagement/publications/Document
s/HAP16_PhilippiHeritage.pdf
Edwards, M. & Hulme, D. (1995). NGO Performance and Accountability: Introduction and
Overview. In M. Edwards and D. Hulme (Eds.). Non-Governmental Organisations: Performance
and Accountability. Beyond the Magic Bullet. Earthscan Publications.
GIS. (2001). Philippi 2001 Census data. Philippi data compiled and extracted by Strategic
Development Information and GIS from 2001 Census data supplied by Statistics South Africa.
32
GIS. (2007). Count of Informal Shacks and Backyard Shacks from the Respective Aerial
Photographs. Extracted by the Corporate GIS of Strategic Development Information and GIS
Department, City of Cape Town.
Goldstone Commission. (1993). Report on Violence at Crossroads: The Commission Report To
The Commission Of Inquiry Regarding The Prevention Of Public Violence And Intimidation. By
The Committee Investigating Public Violence And Intimidation At Crossroads During March-June
1993.
Kaplan, A. (1994). NGOs, Civil Society and Capacity Building – Towards the Development
Strategy. Durban: Olive Information Service.
Keen, J (2009). Early Childhood Development Programme. SAEP.
Lagace, M. (2005). Nonprofit Networking: The New Way to Grow. Working Knowledge –
Harvard Business School. Retrieved on August 17, 209 at
http://hbswk.hbs.edu/item/4801.html
Manona, W. (2004). Impact of Health, Water and Sanitation Services on Improving the Quality
of Life of Poor Communities. Dissertation Presented for the Requirements of the Degree of
Philosophy at the University of Stellenbosch.
Midrand State of Environment Report. (1999). Biodiversity and Open Spaces. Midrand Green
City Project South Africa.
Ndlovu, N.C (2008). Managing the impact of informal settlements on the performance of
Learners in Primary Schools in Kagiso. University of Johannesburg.
SAEP. (2007/2008). Educating and Inspiring a Brighter Future: SAEP Annual Report 2007/2008.
Retrieved on 23 August, 2009 at www.saep.org/media/docs/123444091212.pdf
33
SAEP. (2009). Handbook for Volunteers and Students. Early Childhood Development
Programme. Retrieved 20 August, 2009 at
http://www.saep.org/media/docs/124541853319.pdf
Swilling, M. & Russell, B. (2002). The Size and Scope of the Non-profit Sector in South Africa.
Durban: Graduate School of Public and Development Management and The Centre for Civil
Society.
University of Stellenbosch. (2005). Philippi Transformation Research Project. Unit for Religion
and Development Research.
Walker, M & Unterhalter, E (2007). The Capability Approach: Its Potential for Work In Education
in Amartya Sen’s Capability Approach and Social Justice in Education. New York: Palgrave
Macmillan.
34
APPENDIX A
Census 2001 - Philippi
Compiled by Strategic Development Information and GIS from 2001 Census data supplied by
Statistics South Africa
DEMOGRAPHIC PROFILE BY GENDER
Philippi
ETHNIC GROUP Male % Female % Total %
Black African 50,953 46.19 53,156 48.18 104,109 94.37
Coloured 2,816 2.55 3,215 2.91 6,031 5.47
Indian/Asian 66 0.06 60 0.05 126 0.11
White 30 0.03 24 0.02 54 0.05
Total 53,865 48.83 56,456 51.17 110,321 100.00
AGE Male %
Femal
e % Total %
0 - 5 7,259 6.58 7,400 6.71 14,660 13.29
6 - 12 6,839 6.20 7,350 6.66 14,189 12.86
13 - 17 4,284 3.88 5,299 4.80 9,583 8.69
18 - 34 22,993 20.84 24,174 21.91 47,167 42.75
35 - 54 10,680 9.68 10,256 9.30 20,935 18.98
55 - 64 1,313 1.19 1,399 1.27 2,711 2.46
65+ 498 0.45 578 0.52 1,075 0.97
Total 53,865 48.83 56,456 51.17 110,321 100.00
EDUCATION LEVEL OF
ADULTS (20+) Male % Female % Total %
No schooling 2,921 4.36 2,845 4.25 5,766 8.61
Grade 1- 6 7,520 11.23 4,653 6.95 12,173 18.17
Grade 7 3,218 4.80 2,688 4.01 5,906 8.82
Grade 8 - 11 13,381 19.97 15,651 23.36 29,033 43.34
35
Grade 12 5,203 7.77 6,366 9.50 11,569 17.27
Certificate with less than
grade 12 144 0.21 199 0.30 342 0.51
Cert/dip with grade 12 766 1.14 997 1.49 1,763 2.63
Bachelor’s degree 110 0.16 97 0.14 207 0.31
Bachelor’s degree and
diploma 45 0.07 91 0.14 136 0.20
Honour’s degree 27 0.04 24 0.04 51 0.08
Higher degree (master’s or
doctorate) 24 0.04 24 0.04 48 0.07
Total 33,358 49.79 33,634 50.21 66,993 100.00
LANGUAGE Male % Female % Total %
English 359 0.33 268 0.24 628 0.57
Afrikaans 2,896 2.63 3,297 2.99 6,193 5.61
Xhosa 48,713 44.16 51,824 46.98 100,537 91.13
Other African 1,450 1.31 994 0.90 2,444 2.22
Other 447 0.41 72 0.07 519 0.47
Total 53,865 48.83 56,456 51.17 110,321 100.00
EMPLOYMENT PROFILE BY GENDER
Philippi
WORK STATUS -
ECONOMICALLY ACTIVE Aged
15 to 65 Male % Female % Total %
Employed 14,420 25.50 8,999 15.91 23,419 41.41
Unemployed 15,158 26.81 17,971 31.78 33,129 58.59
Economically Active Total 29,578 52.31 26,970 47.69 56,548 100.00
36
OCCUPATION OF LABOUR
FORCE Male % Female % Total %
Legislators, senior officials
and managers 207 0.88 114 0.49 321 1.37
Professionals 222 0.95 183 0.78 405 1.73
Technicians and associate
professionals 386 1.65 432 1.84 818 3.49
Clerks 471 2.01 652 2.78 1,123 4.80
Service workers, shop and
market sales workers 2,506 10.70 1,133 4.84 3,640 15.54
Skilled agricultural and
fishery workers 377 1.61 85 0.36 461 1.97
Craft and related trades
workers 3,038 12.97 390 1.67 3,428 14.64
Plant and machine operators
and assemblers 1,659 7.08 170 0.73 1,828 7.81
Elementary occupations 4,847 20.70 5,337 22.79 10,184 43.49
Undetermined 707 3.02 503 2.15 1,210 5.17
WORK STATUS -
ECONOMICALLY INACTIVE
Aged 15 to 65 Male % Female % Total %
Scholar or student 4,284 20.99 5,665 27.76 9,949 48.76
Home-maker or housewife 51 0.25 1,559 7.64 1,610 7.89
Pensioner or retired person/too
old to work 369 1.81 753 3.69 1,122 5.50
Unable to work due to illness or
disability 804 3.94 776 3.80 1,580 7.74
Seasonal worker not working
presently 260 1.27 199 0.98 459 2.25
Does not choose to work 661 3.24 1,081 5.30 1,742 8.54
Could not find work 1,606 7.87 2,336 11.45 3,942 19.32
Economically Inactive Total 8,037 39.39 12,369 60.61 20,406 100.00
37
Total 14,420 61.57 8,999 38.43 23,419 100.00
INCOME OF EARNERS (PER
MONTH) Male % Female % Total %
0 - R1 600 11,487 49.05 7,903 33.75 19,390 82.80
R1 601 - R6 400 2,762 11.79 986 4.21 3,747 16.00
R6 401 - R25 600 144 0.61 105 0.45 249 1.06
R25 601 - R102 400 24 0.10 6 0.03 30 0.13
R102 401 or more 3 0.01 0 0.00 3 0.01
Total 14,420 61.57 8,999 38.43 23,419 100.00
OCCUPATION OF LABOUR
FORCE Male % Female % Total %
Legislators, senior officials
and managers 207 0.88 114 0.49 321 1.37
Professionals 222 0.95 183 0.78 405 1.73
Technicians and associate
professionals 386 1.65 432 1.84 818 3.49
Clerks 471 2.01 652 2.78 1,123 4.80
Service workers, shop and
market sales workers 2,506 10.70 1,133 4.84 3,640 15.54
Skilled agricultural and
fishery workers 377 1.61 85 0.36 461 1.97
Craft and related trades
workers 3,038 12.97 390 1.67 3,428 14.64
Plant and machine operators
and assemblers 1,659 7.08 170 0.73 1,828 7.81
Elementary occupations 4,847 20.70 5,337 22.79 10,184 43.49
Undetermined 707 3.02 503 2.15 1,210 5.17
Total 14,420 61.57 8,999 38.43 23,419 100.00
INCOME OF EARNERS (PER
MONTH) Male % Female % Total %
0 - R1 600 11,487 49.05 7,903 33.75 19,390 82.80
38
R1 601 - R6 400 2,762 11.79 986 4.21 3,747 16.00
R6 401 - R25 600 144 0.61 105 0.45 249 1.06
R25 601 - R102 400 24 0.10 6 0.03 30 0.13
R102 401 or more 3 0.01 0 0.00 3 0.01
Total 14,420 61.57 8,999 38.43 23,419 100.00
HOUSING PROFILE
Philippi
TYPE OF DWELLING Number %
House or brick structure on a separate stand or yard 11,579 35.17
Traditional dwelling/hut/structure made of traditional
materials 698 2.12
Flat in block of flats 1,331 4.04
Town/cluster/semi-detached house (simplex; duplex;
triplex) 136 0.41
House/flat/room in back yard 560 1.70
Informal dwelling/shack in back yard 2,624 7.97
Informal dwelling/shack NOT in back yard 15,366 46.68
Room/flatlet not in back yard but on shared property 62 0.19
Caravan or tent 174 0.53
Private ship/boat 6 0.02
Not applicable (living quarters is not housing unit) 384 1.17
Total 32,920 100.00
DWELLING OWNERSHIP Number %
Owned and fully paid off 6,298 19.13
Owned but not yet paid off 3,559 10.81
Rented 5,154 15.66
Occupied rent-free 17,525 53.24
Not applicable 384 1.17
Total 32,920 100.00
39
HOUSEHOLD INCOME (PER ANNUM) Number %
0 - R19 200 27,080 82.26
R19 201 - R76 800 5,326 16.18
R76 801 - R307 200 417 1.27
R307 201 - R1 228 800 30 0.09
R1 228 801 and more 66 0.20
Total 32,920 100.00
SERVICE PROFILE
Philippi
TYPE OF FUEL USED FOR LIGHTING Number %
Electricity 16,800 51.04
Gas 192 0.58
Paraffin 14,881 45.21
Candles 968 2.94
Solar 27 0.08
Other 48 0.15
Total 32,916 100.00
ACCESS TO WATER Number %
Piped water inside dwelling 2,765 8.40
Piped water inside yard 14,962 45.46
Piped water on community stand: distance less than 200m.
from dwelling 5,318 16.16
Piped water on community stand: distance greater than 200m.
from dwelling 7,531 22.88
Borehole 51 0.15
Spring 6 0.02
Rain-water tank 178 0.54
Dam/pool/stagnant water 6 0.02
River/stream 33 0.10
Water vendor 12 0.04
40
Other 2,054 6.24
Total 32,916 100.00
TYPE OF SANITATION Number %
Flush toilet (connected to sewerage system) 17,622 53.54
Flush toilet (with septic tank) 417 1.27
Chemical toilet 285 0.87
Pit latrine with ventilation (VIP) 103 0.31
Pit latrine without ventilation 1,282 3.89
Bucket latrine 5,300 16.10
None 7,907 24.02
Total 32,916 100.00
TYPE OF REFUSE REMOVAL Number %
Removed by local authority at least once a week 23,620 71.76
Removed by local authority less often 145 0.44
Communal refuse dump 1,460 4.44
Own refuse dump 3,134 9.52
No rubbish disposal 4,556 13.84
Total 32,916 100.00
41
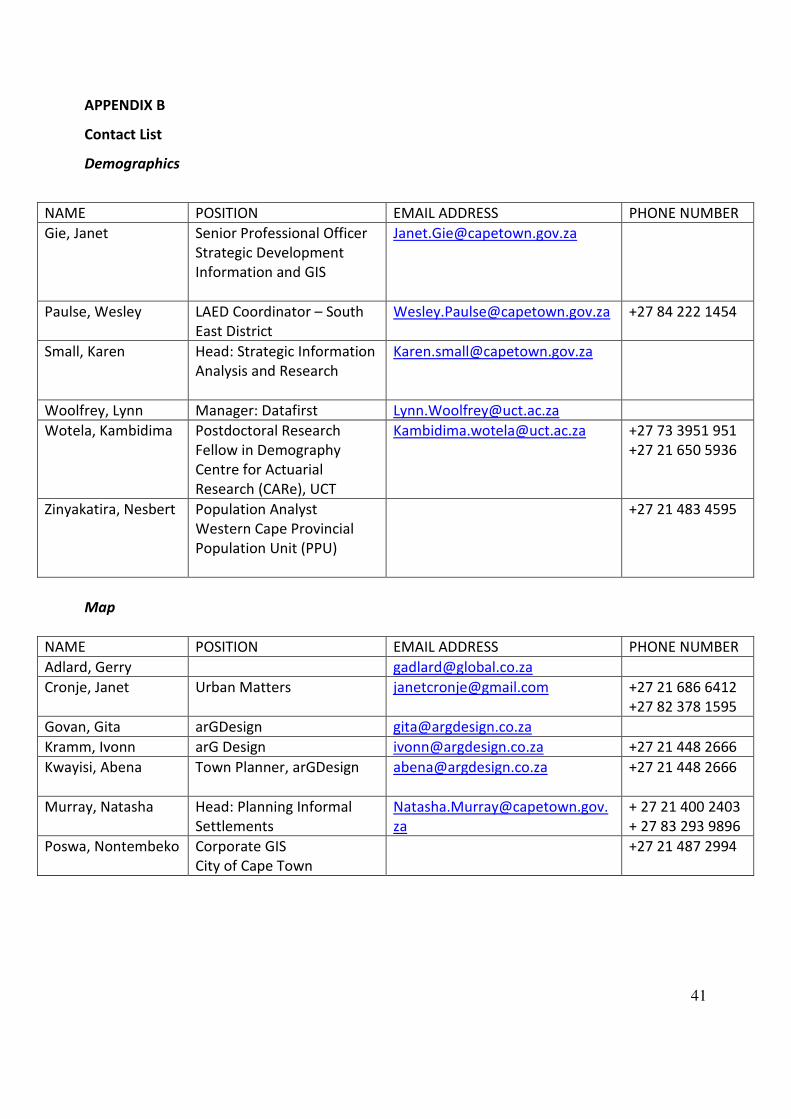
APPENDIX B
Contact List
Demographics
NAME POSITION EMAIL ADDRESS PHONE NUMBER
Gie, Janet
Senior Professional Officer
Strategic Development
Information and GIS
Paulse, Wesley
LAED Coordinator – South
East District
[email protected] +27 84 222 1454
Small, Karen
Head: Strategic Information
Analysis and Research
Woolfrey, Lynn Manager: Datafirst [email protected]
Wotela, Kambidima
Postdoctoral Research
Fellow in Demography
Centre for Actuarial
Research (CARe), UCT
+27 73 3951 951
+27 21 650 5936
Zinyakatira, Nesbert
Population Analyst
Western Cape Provincial
Population Unit (PPU)
+27 21 483 4595
Map
NAME POSITION EMAIL ADDRESS PHONE NUMBER
Adlard, Gerry [email protected]
Cronje, Janet Urban Matters [email protected] +27 21 686 6412
+27 82 378 1595
Govan, Gita arGDesign [email protected]
Kramm, Ivonn arG Design [email protected] +27 21 448 2666
Kwayisi, Abena Town Planner, arGDesign [email protected]
+27 21 448 2666
Murray, Natasha Head: Planning Informal
Settlements
za
+ 27 21 400 2403
+ 27 83 293 9896
Poswa, Nontembeko Corporate GIS
City of Cape Town
+27 21 487 2994
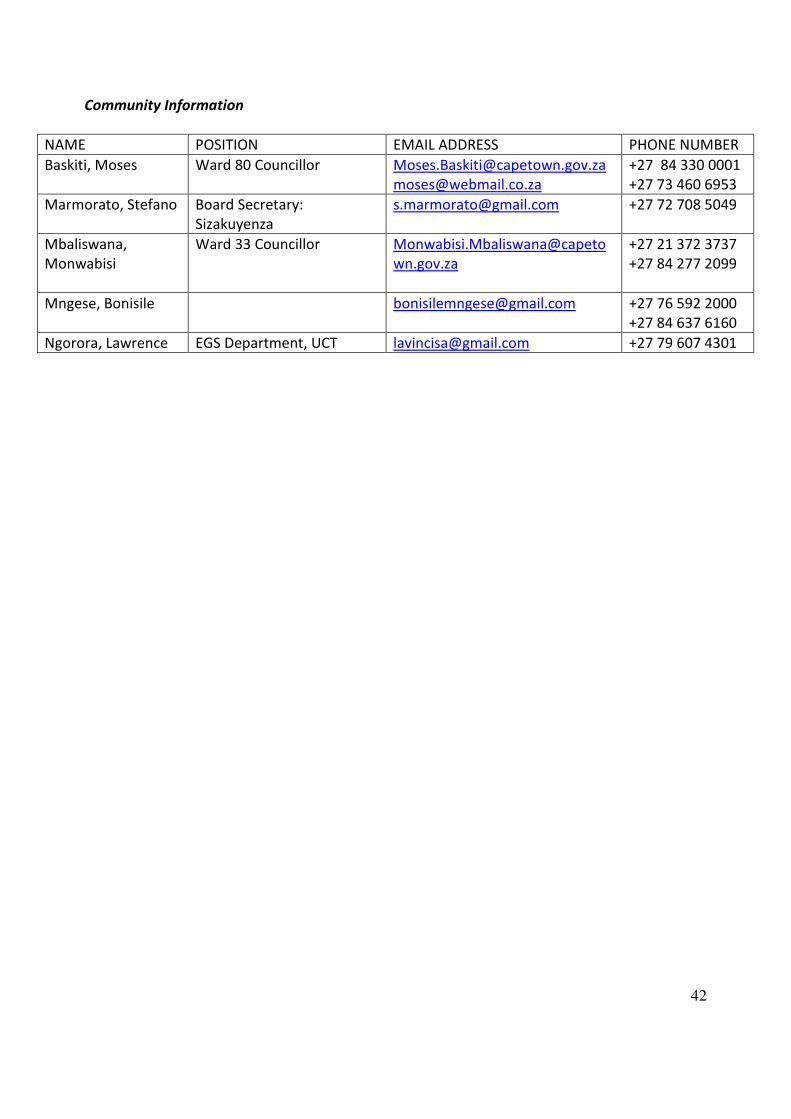
42
Community Information
NAME POSITION EMAIL ADDRESS PHONE NUMBER
Baskiti, Moses Ward 80 Councillor [email protected]
+27 84 330 0001
+27 73 460 6953
Marmorato, Stefano Board Secretary:
Sizakuyenza
+27 72 708 5049
Mbaliswana,
Monwabisi
Ward 33 Councillor Monwabisi.Mbaliswana@capeto
wn.gov.za
+27 21 372 3737
+27 84 277 2099
Mngese, Bonisile [email protected]
+27 76 592 2000
+27 84 637 6160
Ngorora, Lawrence EGS Department, UCT [email protected] +27 79 607 4301
Recommended