Phasing Estimation Relationships
NASA Cost Symposium
Pasadena, CA
August 2013
Darren Elliott – Tecolote Research, Inc.
Erik Burgess, Chad Krause, Jan Sterbutzel – Burgess Consulting Inc.
Los Angeles Washington, D.C. Boston Chantilly Huntsville Dayton Santa Barbara
Albuquerque Colorado Springs Goddard Space Flight Center Johnson Space Center Patuxent River Washington Navy Yard
Aberdeen Denver Edgewood Ft. Meade Ft. Monmouth Dahlgren Quantico Montgomery Ogden Tacoma
Eglin AFB San Antonio New Orleans San Diego Tampa Vandenberg AFB

Agenda
Introduction
Data Analysis
Regression Results
Summary and Further Research
2
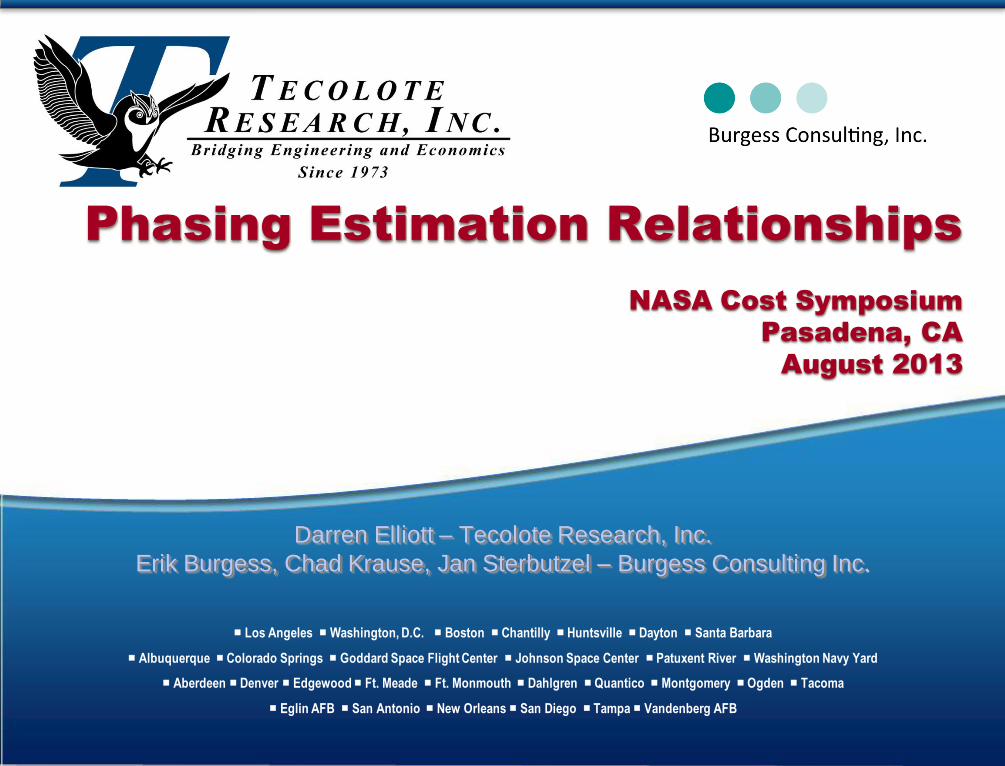
Phasing Estimating Relationships (PERs)
Research funded by NASA/OE/CAD
Estimate annual funding for a mission
Given a cost and schedule estimate
Based on historical data … not “optimal”
An
nu
al
$ Actuals
Model
Phasing Model
Scope of PERs presented today:
Time: System Requirements Review (SRR) to Launch
Content:
Option 1: Total project excluding launch
Option 2: Spacecraft and instruments only
3
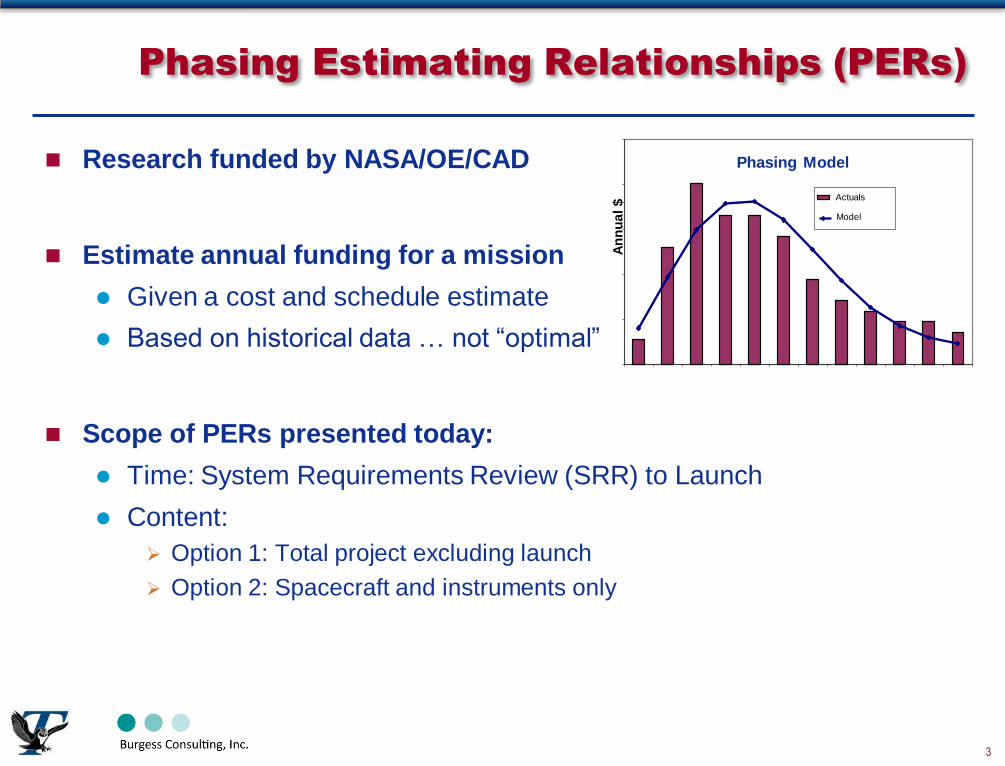
Utility
Applications:
Support, assess, and/or defend budgets
Starting point for analyzing cost & schedule ramifications
Keys to useful PERs:
Clearly traceable to source data
Transparent and verifiable
Users can draw directly from analogy missions
Logical drivers and functional form
Front/back-loading makes sense
Theoretical and empirical basis
Differentiates between expenditures and obligation authority
Useful accuracy metrics
Indexed to program events
Standard error vs. time
4
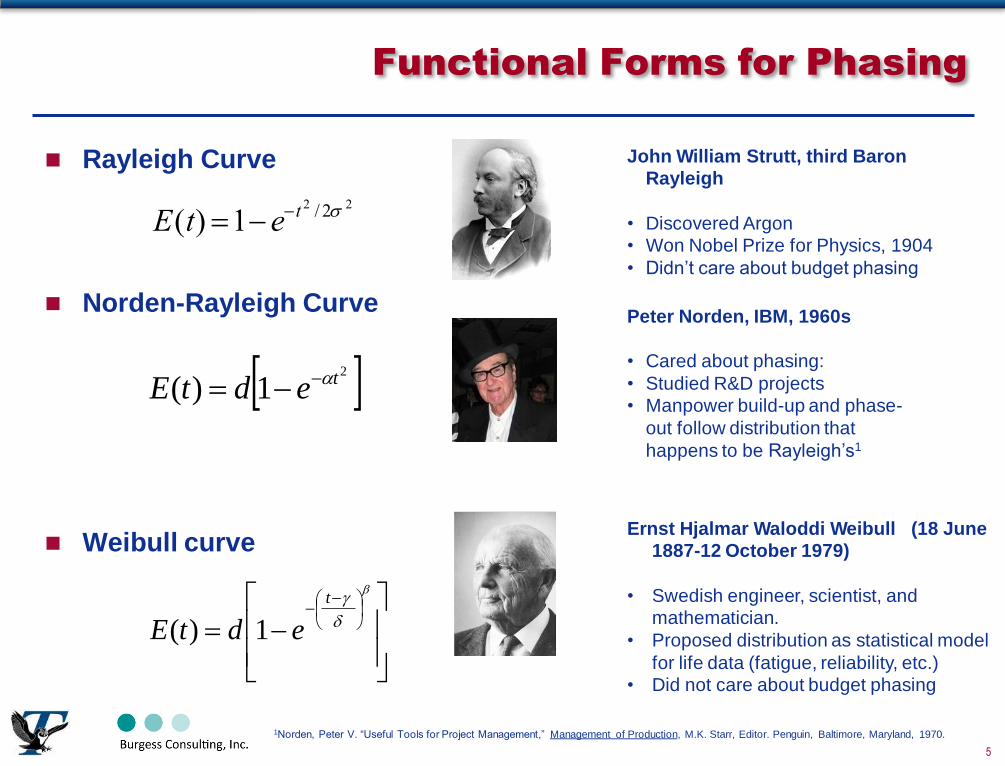
Functional Forms for Phasing
•
•
•
Rayleigh Curve
E(t) 1et2 / 2 2
•
•
•
John William Strutt, third Baron
Rayleigh
Discovered Argon
Won Nobel Prize for Physics, 1904
Didn’t care about budget phasing
Norden-Rayleigh Curve
1)(2tedtE
•
•
•
Peter Norden, IBM, 1960s
Cared about phasing:
Studied R&D projects
Manpower build-up and phase-
out follow distribution that
happens to be Rayleigh’s1
Weibull curve
t
edtE 1)(
Ernst Hjalmar Waloddi Weibull (18 June
1887-12 October 1979)
Swedish engineer, scientist, and
mathematician.
Proposed distribution as statistical model
for life data (fatigue, reliability, etc.)
Did not care about budget phasing
1Norden, Peter V. “Useful Tools for Project Management,” Management of Production, M.K. Starr, Editor. Penguin, Baltimore, Maryland, 1970.
5
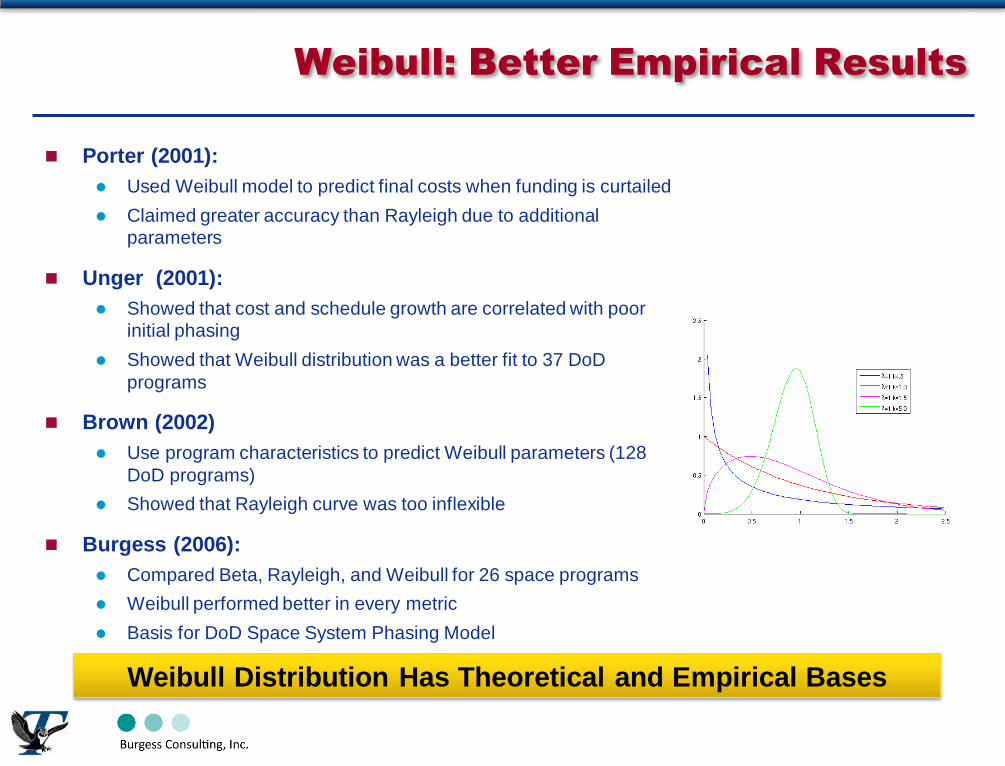
Weibull: Better Empirical Results
Porter (2001):
Used Weibull model to predict final costs when funding is curtailed
Claimed greater accuracy than Rayleigh due to additional
parameters
Unger (2001):
Showed that cost and schedule growth are correlated with poor
initial phasing
Showed that Weibull distribution was a better fit to 37 DoD
programs
Brown (2002)
Use program characteristics to predict Weibull parameters (128
DoD programs)
Showed that Rayleigh curve was too inflexible
Burgess (2006):
Compared Beta, Rayleigh, and Weibull for 26 space programs
Weibull performed better in every metric
Basis for DoD Space System Phasing Model
2-6
Weibull Distribution Has Theoretical and Empirical Bases
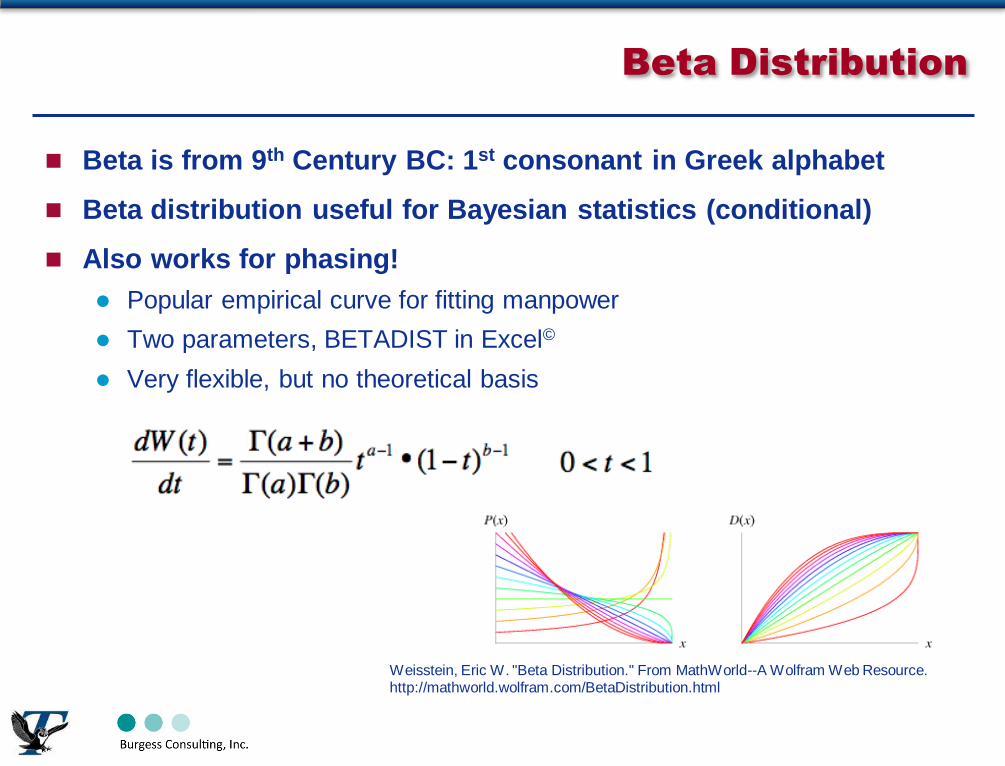
Beta Distribution
Beta is from 9th Century BC: 1st consonant in Greek alphabet
Beta distribution useful for Bayesian statistics (conditional)
Also works for phasing!
Popular empirical curve for fitting manpower
Two parameters, BETADIST in Excel©
Very flexible, but no theoretical basis
2-7
Weisstein, Eric W. "Beta Distribution." From MathWorld--A Wolfram Web Resource. http://mathworld.wolfram.com/BetaDistribution.html
Agenda
Introduction
Data Analysis
Regression Results
Summary and Further Research
8
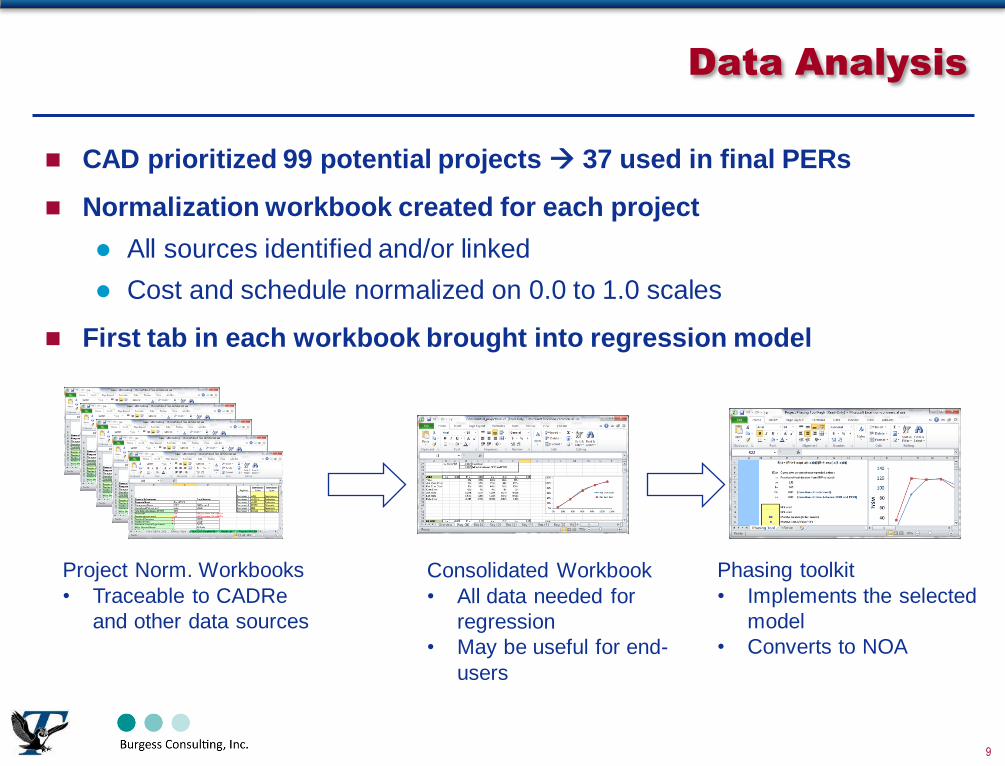
Data Analysis
CAD prioritized 99 potential projects 37 used in final PERs
Normalization workbook created for each project
All sources identified and/or linked
Cost and schedule normalized on 0.0 to 1.0 scales
First tab in each workbook brought into regression model
Project Norm. Workbooks
• Traceable to CADRe
and other data sources
•
•
Consolidated Workbook
All data needed for
regression
May be useful for end-
users
Phasing toolkit
• Implements the selected
model
Converts to NOA •
9
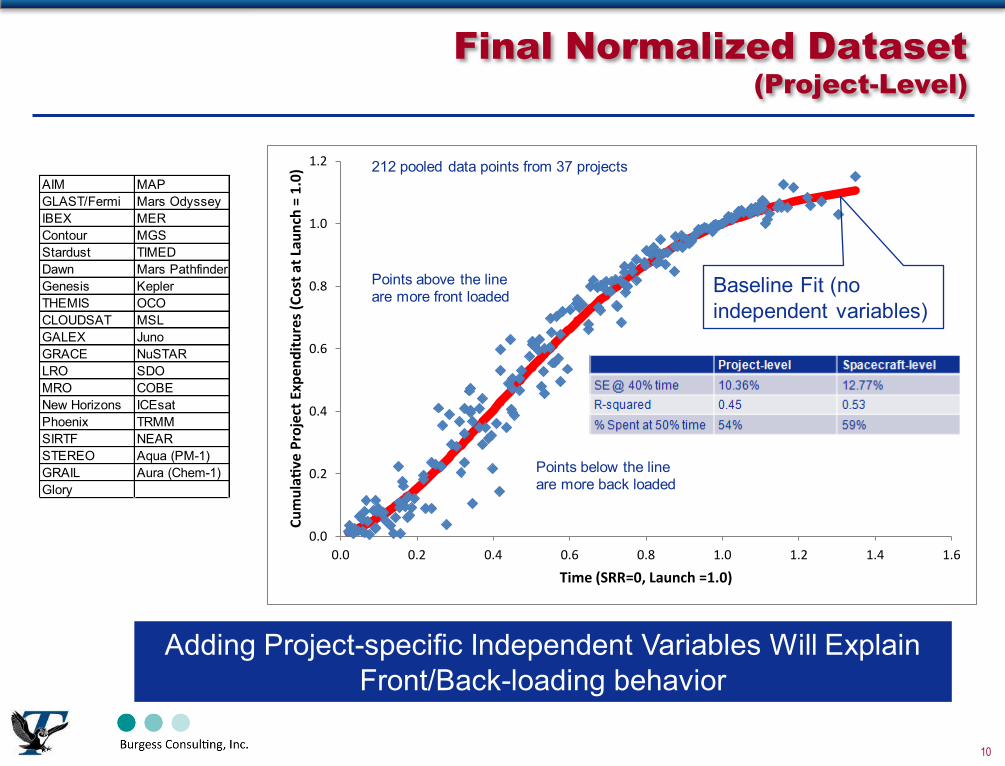
Final Normalized Dataset (Project-Level)
AIM MAPGLAST/Fermi Mars OdysseyIBEX MERContour MGSStardust TIMEDDawn Mars PathfinderGenesis KeplerTHEMIS OCOCLOUDSAT MSLGALEX JunoGRACE NuSTARLRO SDOMRO COBENew Horizons ICEsatPhoenix TRMMSIRTF NEARSTEREO Aqua (PM-1)GRAIL Aura (Chem-1)Glory
0.0
0.2
0.4
0.6
0.8
1.0
1.2
0.0 0.2 0.4 0.6 0.8 1.0 1.2 1.4 1.6
Cum
ulati
ve P
roje
ct E
xpen
ditu
res (
Cost
at L
aunc
h =
1.0)
Time (SRR=0, Launch =1.0)
212 pooled data points from 37 projects
Points above the line are more front loaded
Points below the line are more back loaded
Baseline Fit (no independent variables)
Adding Project-specific Independent Variables Will Explain Front/Back-loading behavior
10

Agenda
Introduction
Data Analysis
Regression Results
Summary and Further Research
11
•
•
•
•
•
•
•
•
•
•
•
•
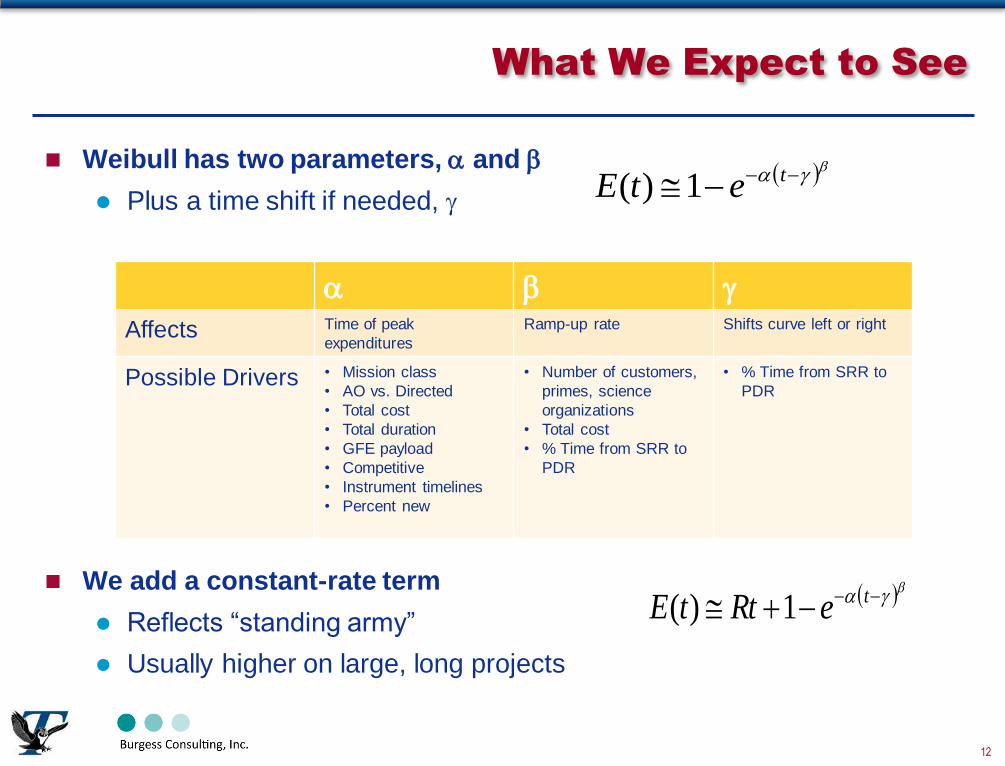
What We Expect to See
Weibull has two parameters, and
Plus a time shift if needed, tetE 1)(
Affects Time of peak
expenditures
Ramp-up rate Shifts curve left or right
Possible Drivers Mission class
AO vs. Directed
Total cost
Total duration
GFE payload
Competitive
Instrument timelines
Percent new
Number of customers,
primes, science
organizations
Total cost
% Time from SRR to
PDR
% Time from SRR to
PDR
We add a constant-rate term
Reflects “standing army”
Usually higher on large, long projects
teRttE 1)(
12
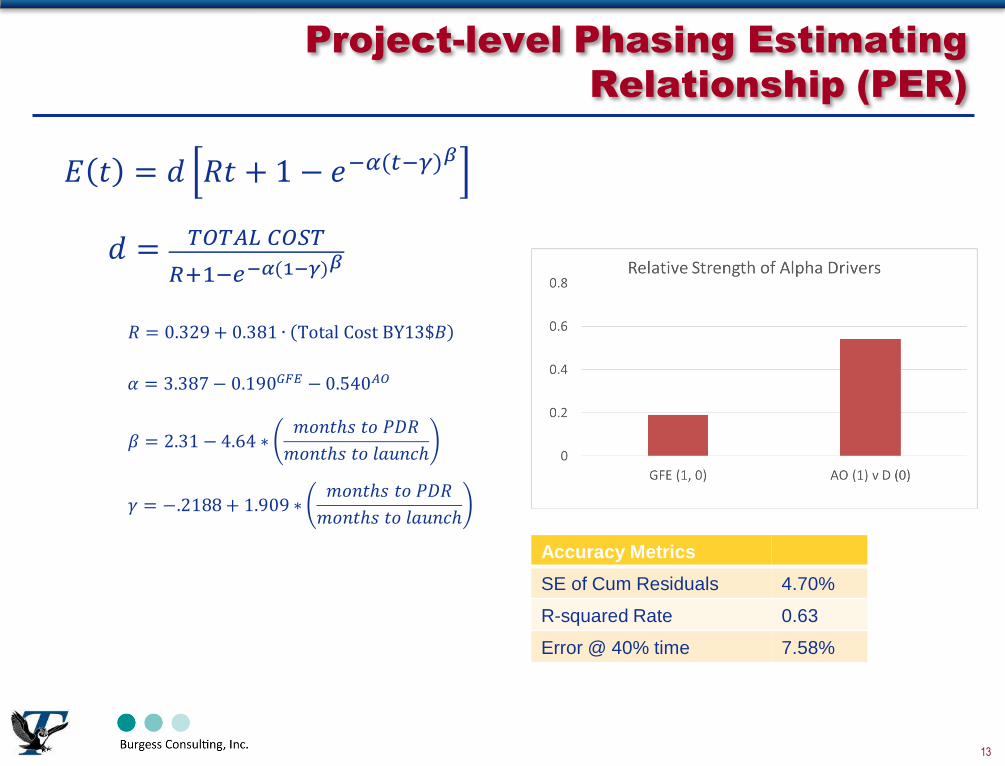
Project-level Phasing Estimating
Relationship (PER)
𝐸 𝑡 = 𝑑 𝑅𝑡 + 1 − 𝑒−𝛼(𝑡−𝛾)𝛽
𝑑 = 𝑇𝑂𝑇𝐴𝐿 𝐶𝑂𝑆𝑇
𝑅+1−𝑒−𝛼(1−𝛾)𝛽
𝑅 = 0.329 + 0.381 ∙ Total Cost BY13$𝐵
𝛼 = 3.387 − 0.190𝐺𝐹𝐸 − 0.540𝐴𝑂
𝛽 = 2.31 − 4.64 ∗𝑚𝑜𝑛𝑡ℎ𝑠 𝑡𝑜 𝑃𝐷𝑅
𝑚𝑜𝑛𝑡ℎ𝑠 𝑡𝑜 𝑙𝑎𝑢𝑛𝑐ℎ
𝛾 = −.2188 + 1.909 ∗𝑚𝑜𝑛𝑡ℎ𝑠 𝑡𝑜 𝑃𝐷𝑅
𝑚𝑜𝑛𝑡ℎ𝑠 𝑡𝑜 𝑙𝑎𝑢𝑛𝑐ℎ
Accuracy Metrics
SE of Cum Residuals 4.70%
R-squared Rate 0.63
Error @ 40% time 7.58%
13
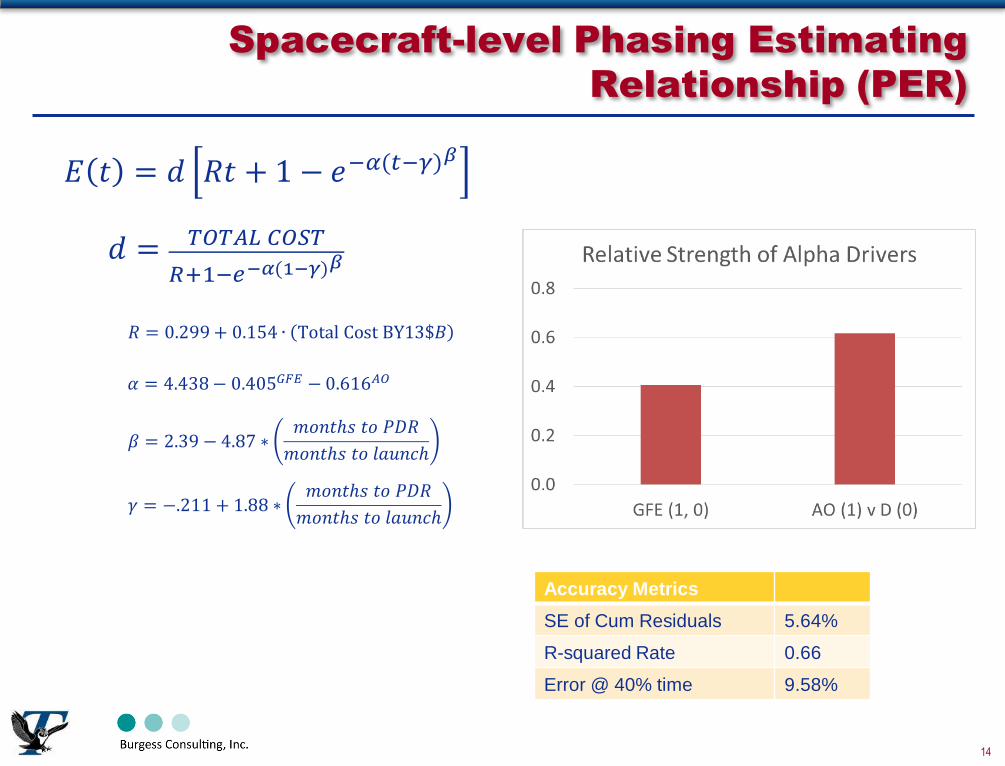
Spacecraft-level Phasing Estimating
Relationship (PER)
𝐸 𝑡 = 𝑑 𝑅𝑡 + 1 − 𝑒−𝛼(𝑡−𝛾)𝛽
𝑑 = 𝑇𝑂𝑇𝐴𝐿 𝐶𝑂𝑆𝑇
𝑅+1−𝑒−𝛼(1−𝛾)𝛽
𝑅 = 0.299 + 0.154 ∙ Total Cost BY13$𝐵
𝛼 = 4.438 − 0.405𝐺𝐹𝐸 − 0.616𝐴𝑂
𝛽 = 2.39 − 4.87 ∗𝑚𝑜𝑛𝑡ℎ𝑠 𝑡𝑜 𝑃𝐷𝑅
𝑚𝑜𝑛𝑡ℎ𝑠 𝑡𝑜 𝑙𝑎𝑢𝑛𝑐ℎ
𝛾 = −.211 + 1.88 ∗𝑚𝑜𝑛𝑡ℎ𝑠 𝑡𝑜 𝑃𝐷𝑅
𝑚𝑜𝑛𝑡ℎ𝑠 𝑡𝑜 𝑙𝑎𝑢𝑛𝑐ℎ
Accuracy Metrics
SE of Cum Residuals 5.64%
R-squared Rate 0.66
Error @ 40% time 9.58%
14
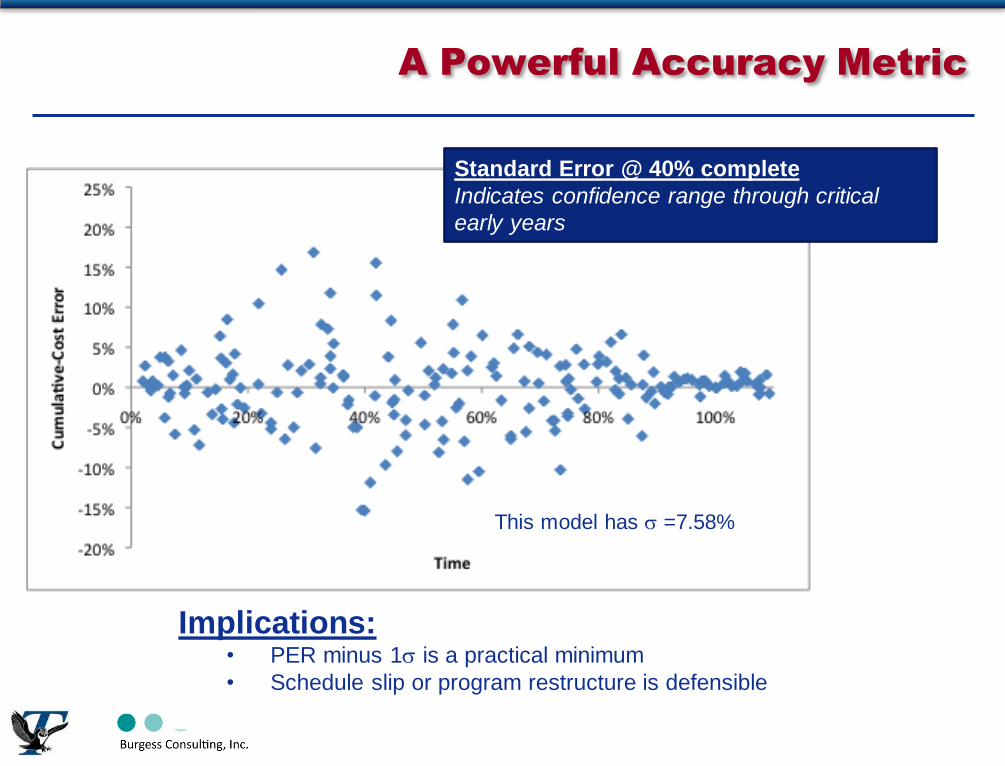
A Powerful Accuracy Metric
•
•
This model has =7.58%
Implications: PER minus 1 is a practical minimum
Schedule slip or program restructure is defensible
Indicates confidence range through critical
early years
Standard Error @ 40% complete
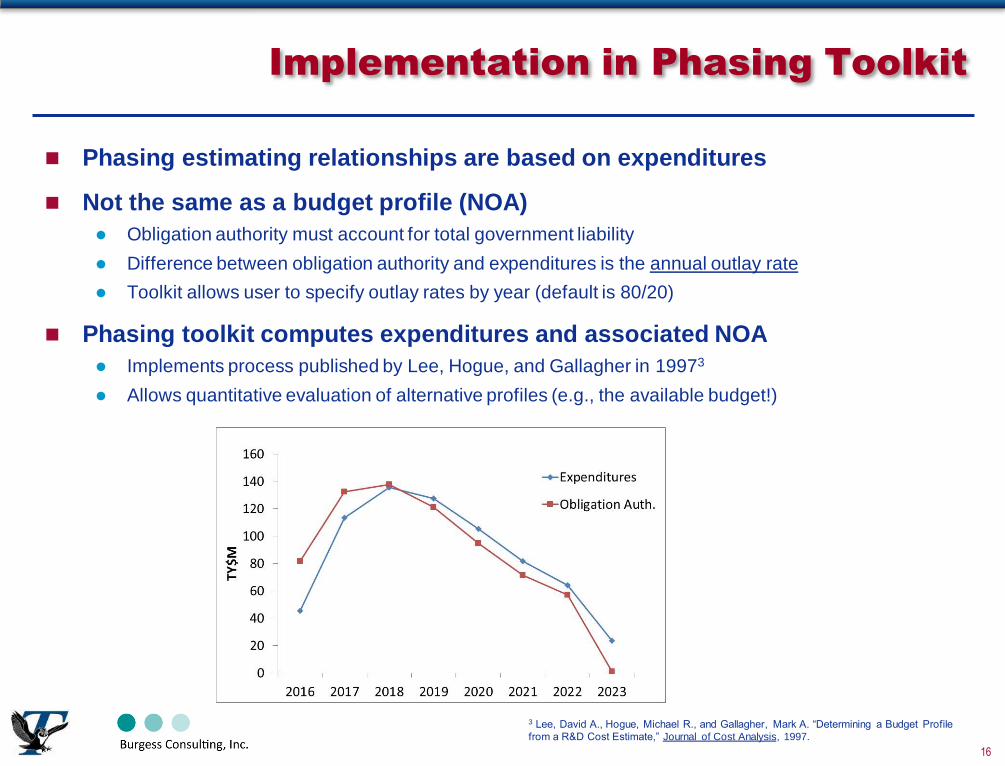
Implementation in Phasing Toolkit
Phasing estimating relationships are based on expenditures
Not the same as a budget profile (NOA)
Obligation authority must account for total government liability
Difference between obligation authority and expenditures is the annual outlay rate
Toolkit allows user to specify outlay rates by year (default is 80/20)
Phasing toolkit computes expenditures and associated NOA
Implements process published by Lee, Hogue, and Gallagher in 19973
Allows quantitative evaluation of alternative profiles (e.g., the available budget!)
3 Lee, David A., Hogue, Michael R., and Gallagher, Mark A. “Determining a Budget Profile
from a R&D Cost Estimate,” Journal of Cost Analysis, 1997.
16
Agenda
Introduction
Database
Results
Summary and Further Research
17
Summary and Further Research
Summary:
Two PERs are presented for NASA projects
PERs reflect actual experience, consistent with data-driven cost and
schedule models … not optimal
Traceable to CADRe data
Error metrics useful for formulating, assessing, or defending budgets
Further research: Assess cost and schedule impacts of deviating
from PERs
Do front-loaded programs cost less or more?
How strong is the correlation between cost and phasing?
What is the schedule impact of a funding cut in year n?
18
References
• Abernathy, T. “An Application of the Rayleigh Distribution to Contract Cost Data.” Master’s Thesis, Naval Postgraduate School, Monterey, California, 1984.
Brown, Thomas W., White, Edward D., and Gallagher, Mark A. “Weibull-based Forecasting of R&D Program Budgets.” Presented to Military Operations Research Society Symposium (MORSS), Ft. Leavenworth, Kansas, 18 June 2002.
Burgess, Erik. (2006). “R&D Budget Profiles and Metrics.” Journal of Parametrics , 11-30.
Burgess, Erik. (2012) “Modeling R&D Budget Profiles.” SCEA/ISPA Joint Annual Conference, Orlando, FL, June 2012.
Elrod, S.M. “Engineering and Manufacturing Development Cost Estimation: An Analysis of Combined Time-Phased and Classical Techniques.” Master’s Thesis, Naval Postgraduate School, Monterey, California, 1993.
Gallagher, Mark A., and Lee, David A. “Final-Cost Estimates for Research and Development Programs Conditioned on Realized Costs,” Military Operations Research, V2 N2, 1996.
Garcia, Rick. “Ground Radar Expenditure Phasing Analysis,” presented at the International Cost Estimating and Analysis Association Annual Symposium, New Orleans, LA, 18 June 2013.
Lee, D., Hogue, M., and Hoffman, D. “Time Histories of Expenditures for Defense Acquisition Programs in the Development Phase,” presented at the 1993 Annual Meeting of the International Society for Parametric Analysis.
Lee, David A., Hogue, Michael R., and Gallagher, Mark A. “Determining a Budget Profile from a R&D Cost Estimate,” Journal of Cost Analysis, 1997.
Lee, David. “Norden-Rayleigh Analysis: A Useful Tool for EVM in Development Projects,” presented to the CPM Spring Conference, April 2002.
National Aeronautics and Space Administration (NASA). NASA Cost-Estimating Handbook, 2002, 2008.
Naval Center for Cost Analysis (NCCA). “Inflation Indices & Outlay Profile Factors.” March 2000.
Norden, Peter V. “Useful Tools for Project Management,” Management of Production, M.K. Starr, Editor. Penguin, Baltimore, Maryland, 1970.
Porter, Paul H. “Revising R&D Program Budgets when Considering Funding Curtailment with a Weibull Model,” Master’s Thesis, Air Force Institute of Technology, Wright-Patterson Air Force Base, Ohio, March 2001.
Unger, Eric J. “Relating Initial Budget to Program Growth with Rayleigh and Weibull Models,” Master’s Thesis, Air Force Institute of Technology, Wright-Patterson Air Force Base, Ohio, March 2001.
Watkins, Harry. “An Application of Rayleigh Curve Theory to Contract Cost Estimation and Control,” Master’s Thesis, Naval Postgraduate School, Monterey, California, March, 1982.
•
•
•
•
•
•
•
•
•
•
•
•
•
•
•
Recommended