Peru’s Economic Boom and the
Asian Connection
Cynthia A. Sanborn Alexis Yong
Universidad del Pacifico Lima, Peru
“Reaching Across the Pacific: Latin America and Asia in the New Century”
Woodrow Wilson Center for Scholars
Washington, DC
June 20th, 2013

Contents (paper) Introduction I. Peru – Asian Relations: A Brief History II. Peruvian Trade with Asia
Peru exports to Asia / China Asia / China imports to Peru Concentration and balance of trade
III. Asian Investment in Peru Japan: learning from the past South Korea: partnership for the future China: learning by doing
IV. Conclusions

Introduction Peru´s success story: minerals + sound policy +
trade expansion Relations with Asia key
China, Japan, Rep. of Korea Demand for minerals
Risks of dependency? (resource curse) Responses
Global standards in mining /CSR FTAs / Diversification of trade
Results? Net positive, dynamism, not case of de-industrialization.

Peru – Asia history: how important?

Peruvian trade with Asia APEC 1997 - 18 FTA 2013 (5 Asia) 92% with 3 countries China #1 trade partner, 17% exports
83% = copper, iron, lead, fishmeal Imports from China
54% goods for industry, 17% consumer Mixed impact / net positive
FTA: dynamism & diversification
En
vige
ncia
Cuba Canadá
Chile Tailandia
Firmados
Venezuela
Costa Rica
En
nego
ciac
ión
El Salvador
Honduras
Chile Brunei
Nueva Zelanda
Australia Chile Colombia
Alianza del Pacífico
Tailandia México
Asociación Transpacífico (TPP)
México Vietnam
Canadá Malasia
Singapur Estados Unidos
Unión Europea
Guatemala
México Estados Unidos Comunidad Andina
Panamá
EFTA MERCOSUR
Peruvian Trade Agreements
Singapur China
Corea del Sur
Japón

Asian trade summary Increased total trade, total number of
Peruvian exporters, number and variety of non-traditional goods
95% traditional (minerals prices), but non-traditional growing fast Manufacture exports grew 46% to China,
vs 13% world Chemicals, agro, metallurgical Japan similar, Korea more value-added

Figure 1. LAC exports to Asia, by destination country 1990 – 2011 (share of total exports to Asia)
Source: Authors’ calculations based on UN COMTRADE

Figure 2. Peru exports to Asia, by destination country 1990 – 2011 (percentage of total exports to Asia)
Source: Authors’ calculations based on UN COMTRADE
0%
10%
20%
30%
40%
50%
60%
70%
80%
90%
100%
1990 1991 1992 1993 1994 1995 1996 1997 1998 1999 2000 2001 2002 2003 2004 2005 2006 2007 2008 2009 2010 2011
China Japan Korea, Rep. Thailand India Philippines Other

Figure 3. Penetration of imports from China into the Peruvian market, by sector
Source: Cárdenas and Gavilano (2013)

Figure 4. Peru exports by sector to Asia main trading partners and the World, 1997, 2008, 2011
(share of total exports to main destinations)
Source: Authors’ calculations based on UN COMTRADE

Figure 5. Peru export structure to main destinations, 1997 – 2008 (percentage of total exports from main destinations)
Source: Authors’ calculations based on UN COMTRADE Notes: Sector classified by levels of technological sophistication, as Lall (2000).:PG = Primary goods, NRBM = Natural resources based manufactures, LTM = Low technology manufactures, MTM = Medium technology manufactures, HTM = High technology manufactures

Figure 6. Peru export structure to Asia main trading partners and the World, 1997, 2008, 2011
(share of total exports to main destinations)
Source: Authors’ calculations based on UN COMTRADE Notes: Sector classified by levels of technological sophistication, as Lall (2000).:PG = Primary goods, NRBM = Natural resources based manufactures, LTM = Low technology manufactures, MTM = Medium technology manufactures, HTM = High technology manufactures

Level of technology
sophistication Sector
Commodity Code (HS)
Commodity Description Trade Value
NRBM Mining & Oil 260300 Copper ores and concentrates 2,417,569,333
PG Fishing 230120 Flour or meal, pellet, fish, etc, for animal feed 1,042,228,645
NRBM Mining & Oil 260111 Iron ore, concentrate, not iron pyrites,unagglomerate 1,000,887,459
NRBM Mining & Oil 260700 Lead ores and concentrates 723,723,644
PG Mining & Oil 740311 Copper cathodes and sections of cathodes unwrought 623,283,133
NRBM Mining & Oil 260800 Zinc ores and concentrates 256,397,372
PG Mining & Oil 790111 Zinc, not alloyed, unwrought, >99% pure 125,165,953
NRBM Fishing 160590 Molluscs and shellfish nes, prepared or preserved 122,360,116
PG Mining & Oil 740200 Unrefined copper, copper anodes, electrolytic refinin 91,229,794
NRBM Mining & Oil 261610 Silver ores and concentrates 77,580,826
Table 9. Top 10 Peruvian exports/imports to/from China on 2011
HTM Metal-
Mechanical & Electronics
847120 Digital computers with cpu and input-output units 405,270,468
HTM Metal-
Mechanical & Electronics
852520 Transmit-receive apparatus for radio, TV, etc. 375,250,366
MTM Metal-
Mechanical & Electronics
871120 Motorcycles, spark ignition engine of 50-250 cc 142,141,509
HTM Various (inc. jewelry, crafts) 852810 Colour television receivers/monitors/projectors 126,808,238
LTM Various (inc. jewelry, crafts) 950390 Toys nes 109,711,716
HTM Metal-
Mechanical & Electronics
851730 Telephonic or telegraphic switching apparatus 98,330,643
MTM Metal-
Mechanical & Electronics
870422 Diesel powered trucks weighing 5-20 tonnes 79,168,676
HTM Metal-
Mechanical & Electronics
847192 Computer input or output units 76,538,742
LTM Various (inc. jewelry, crafts) 640299 Footwear, outer soles/uppers of rubber or plastic, ne 74,444,463
HTM Metal-
Mechanical & Electronics
847330 Parts and accessories of data processing equipment ne 72,323,698
Exp
orts
Im
ports
Source: Authors’ calculations based on UN COMTRADE

Asian investment in Peru FDI lags well behind EU (Spain, UK), US Japan
1960s & 70s: instability & crisis, moved to Colombia, Chile
2013: mining S. Korea today: mining
FTA 2011, strategic association Airplanes (KOTRA), industrial & tech coop
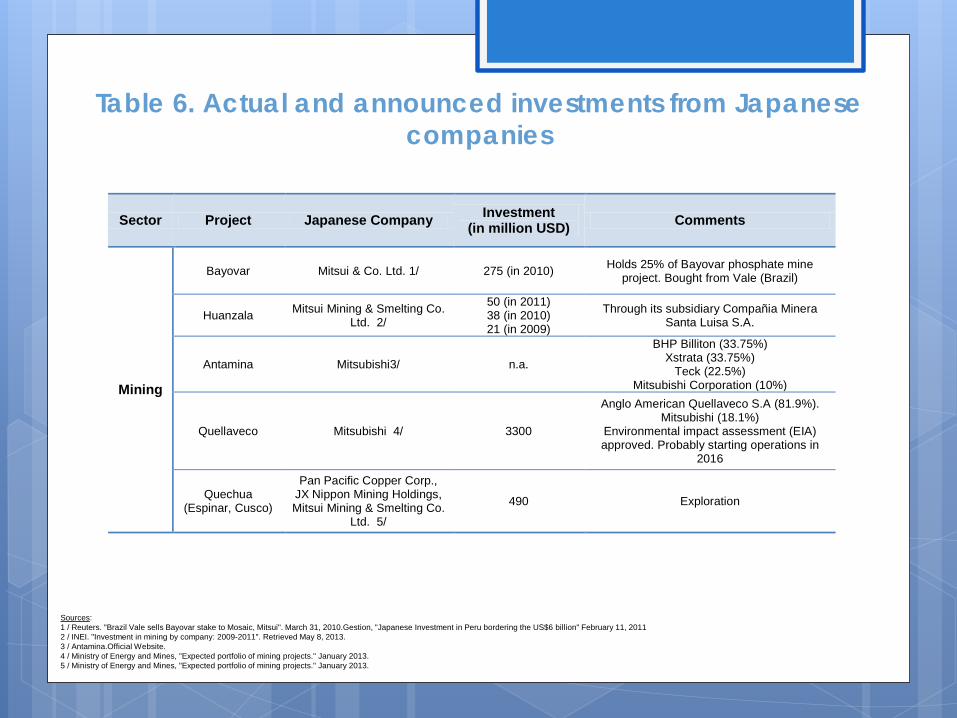
Sector Project Japanese Company Investment (in million USD) Comments
Mining
Bayovar Mitsui & Co. Ltd. 1/ 275 (in 2010) Holds 25% of Bayovar phosphate mine project. Bought from Vale (Brazil)
Huanzala Mitsui Mining & Smelting Co. Ltd. 2/
50 (in 2011) 38 (in 2010) 21 (in 2009)
Through its subsidiary Compañia Minera Santa Luisa S.A.
Antamina Mitsubishi3/ n.a.
BHP Billiton (33.75%) Xstrata (33.75%)
Teck (22.5%) Mitsubishi Corporation (10%)
Quellaveco Mitsubishi 4/ 3300
Anglo American Quellaveco S.A (81.9%). Mitsubishi (18.1%)
Environmental impact assessment (EIA) approved. Probably starting operations in
2016
Quechua (Espinar, Cusco)
Pan Pacific Copper Corp., JX Nippon Mining Holdings, Mitsui Mining & Smelting Co.
Ltd. 5/
490 Exploration
Table 6. Actual and announced investments from Japanese companies
Sources: 1 / Reuters. "Brazil Vale sells Bayovar stake to Mosaic, Mitsui". March 31, 2010.Gestion, "Japanese Investment in Peru bordering the US$6 billion" February 11, 2011 2 / INEI. "Investment in mining by company: 2009-2011". Retrieved May 8, 2013. 3 / Antamina.Official Website. 4 / Ministry of Energy and Mines, "Expected portfolio of mining projects." January 2013. 5 / Ministry of Energy and Mines, "Expected portfolio of mining projects." January 2013.

Sector Project Korean Company Investment (in million USD) Comments
Oil& Gas
Block Z46 (Trujillo basin, La
Libertad) SK Energy 1/ 482.62 Exploration in progress
Block 8 (Trompeteros y
Yanayacu, Loreto)
SK Energy, Daewoo,
Korea National Oil Corporation (KNOC)
2/
n.a.
Project in production phase. Korean interest is divided in: SK Energy
8.3%, Daewoo 11.6%, Korea National Oil Corporation (KNOC) 20%. Pluspetrol Norte
S.A. holds 60% of the project and is property of Pluspetrol Resources Corporation (55%) and China National Petroleum Corporation,
CNPC (45%)
Block 115 (Datem del
Marañón, Loreto )
Korea National Oil Corporation (KNOC) 3/ n.a.
Project in exploration phase. Korea National Oil Corporation, KNOC 30%,
Pluspetrol 70%.
Savia Peru Block Z-2B
(Talara,Piura)
Korea National Oil Corporation (KNOC) 4/ n.a.
Korea National Oil Corporation (KNOC) 50%, Ecopetrol 50%. Project in production/exploration phase
Mining
Mina Justa Korea Resources, LS-Nikko Copper 5/ 744
Environmental impact assessment (EIA) approved. Starting operation in 2015
Brescia Group (CumbresAndinas) 70%, Korea Resources 15%, LS-Nikko Copper 15%.
San Juan de Marcona,
Pachapaqui Korea Zinc 6/ 200 In progress
DesalinationPlant - Cerro Lindo Doosan 7/ n.a. To be completedby 2013
Fishery Pesquera
Diamante S.A. acquisition
Dongwon Industries Co 8/ n.a. Notconfirmed
Table 7. Actual and announced investments from Korean companies
Sources: 1 / Central Reserve Bank of Peru. "Inflation Report March 2013": 2/3/4 / Korea National Oil Corporation, Operations 5 / Andina. "Korean firms investment in Peru would sum U.S. $ 6.600 billion." August 12, 2011. 6 / Peru 21, "South Korea wants to invest in the energy sector in Peru". February 26, 2012.Ministry of Energy and Mines, "Expected portfolio of mining projects." January 2013. 7 / Doosan."Doosan water plants".Retrieved May 8, 2013. 8 / Business Week. "Reportedly Eyes Dongwon Fisheries, Dongwon But Does Not Disclose Confirms Target Name". Retrieved May 8, 2013.

Table 8. Actual and announced investments from Chinese companies
Sector Project Chinese Company Investment
(in million USD) Comments
Mining
Toromocho Chinalco Peru (Chinalco) 1/ 2150 Possibly completedon 2014
El Galeno
China Min Metals Corporation 2/
2500 Possibly completed on 2014-2015
China Min Metals Corporation (60%), Jiangxi Copper Company
Ltd. 3/ Jiangxi Copper Company Ltd.(40%)
Extension of Marcona mine
Shougang Hierro Peru (Shougang Corporation) 4/ 1200 In progress
Pampa de Pongo Nanjinzhao Group 5/ 3005 Investment over 2010-2014
Rio Blanco
Zijing Mining Group 6/ Tongling Nonferrous 7/
Xiamen C&D 8/ (former Monterrico Metals y
Majaz)
1500
Investment over 2009-2014. Zijing Mining Group(45%)
Tongling Nonferrous (35%) Xiamen C&D (20%)
Cercana project (Yarabamba,
Arequipa) June field Group 9/ to be defined Exploration
Llama TY01 (Huancano, Ica) Jintong Mining 10/ to be defined Exploration
Shandong Exploration 11/ n.a. Exploration
Anhui Exploration 12/ n.a. Exploration
Hebei Exploration 13/ n.a. Exploration
Oil& Gas
Block 6 / 7 (Talara, Piura)
China National Petroleum Corporation (CNPC) 14/ n.a. Since Januray 1994 and October 1995.
Block 111/113 (Madre de Dios)
China National Petroleum Corporation (CNPC) 15/ n.a. Project in exploration phase
Block 1AB (Olaya, Loreto)
China National Petroleum Corporation (CNPC) 16/ n.a.
Already in production. Holds 45% of the project. Pluspetrol
Resources Corporation holds the 55%.
Block 8 (Trompeteros y
Yanayacu, Loreto)
China National Petroleum Corporation (CNPC) 17/ n.a.
Already in production. Holds 27% under its stake in Pluspetrol Norte S.A. Other partners
are SK Energy (8.3%), Daewoo (11.6%), Korea National Oil Corporation, KNOC
(20%) and Pluspetrol Resoruces Corporation (33%).

Chinese investment in Peru 1992: Shougang – Hierro Peru
First major China overseas investment 1994: CNPC (Talara)
2007-2008: Boom in new investment China today is #10, but single largest in
mining, 23% projected mining portfolio Obstacles to investment in other sectors,
role of government weak

Peru case
China and global standards

Final remarks Deep historical ties, and new relations Asia trade reinforces Peru as mineral
exporter, but does not significantly de-industrialize
FTA help diversify trade, non-traditional exports increase
Post-FTA: largely private initiative Weaknesses of State & political leadership
Recommended