Personal Lines Insurance:Overview & Outlook
Pillars of Profitability &Drivers of Revenue, Cost,
Profit & Competition
Insurance Information Institute
March 2006
Robert P. Hartwig, Ph.D., CPCU, Senior Vice President & Chief EconomistInsurance Information Institute 110 William Street New York, NY 10038
Tel: (212) 346-5520 Fax: (212) 732-1916 [email protected] www.iii.org
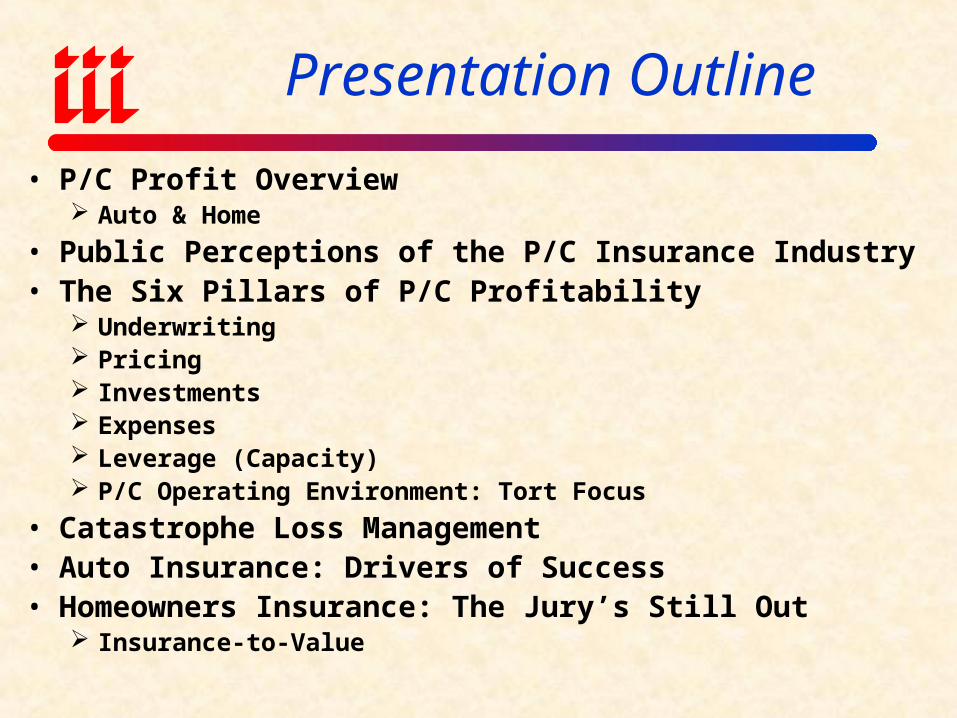
Presentation Outline
• P/C Profit Overview Auto & Home
• Public Perceptions of the P/C Insurance Industry• The Six Pillars of P/C Profitability
Underwriting Pricing Investments Expenses Leverage (Capacity) P/C Operating Environment: Tort Focus
• Catastrophe Loss Management• Auto Insurance: Drivers of Success• Homeowners Insurance: The Jury’s Still Out
Insurance-to-Value

P/C PROFIT OVERVIEW
2006 Outlook is Good
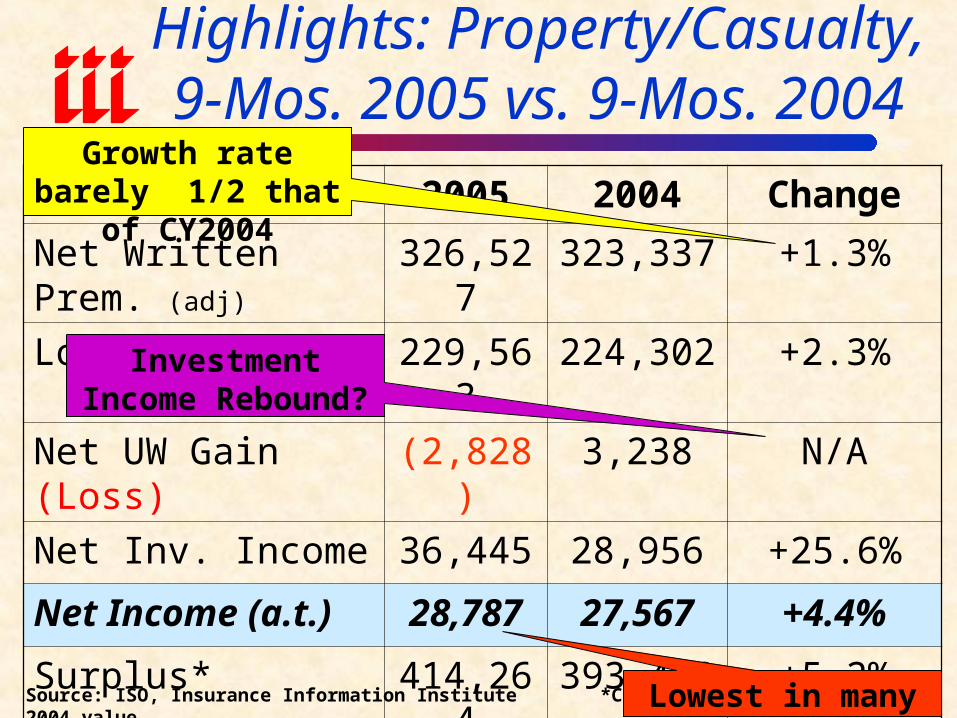
Highlights: Property/Casualty,9-Mos. 2005 vs. 9-Mos. 2004
2005 2004 Change
Net Written Prem. (adj) 326,527 323,337 +1.3%
Loss & LAE 229,563 224,302 +2.3%
Net UW Gain (Loss) (2,828) 3,238 N/A
Net Inv. Income 36,445 28,956 +25.6%
Net Income (a.t.) 28,787 27,567 +4.4%
Surplus* 414,264 393,488 +5.2%
Combined Ratio* 100.0 98.1 +1.9 pts.
Source: ISO, Insurance Information Institute *Comparison is with year-end 2004 value.
Growth rate barely 1/2 that of CY2004
Investment Income Rebound?
Lowest in many years
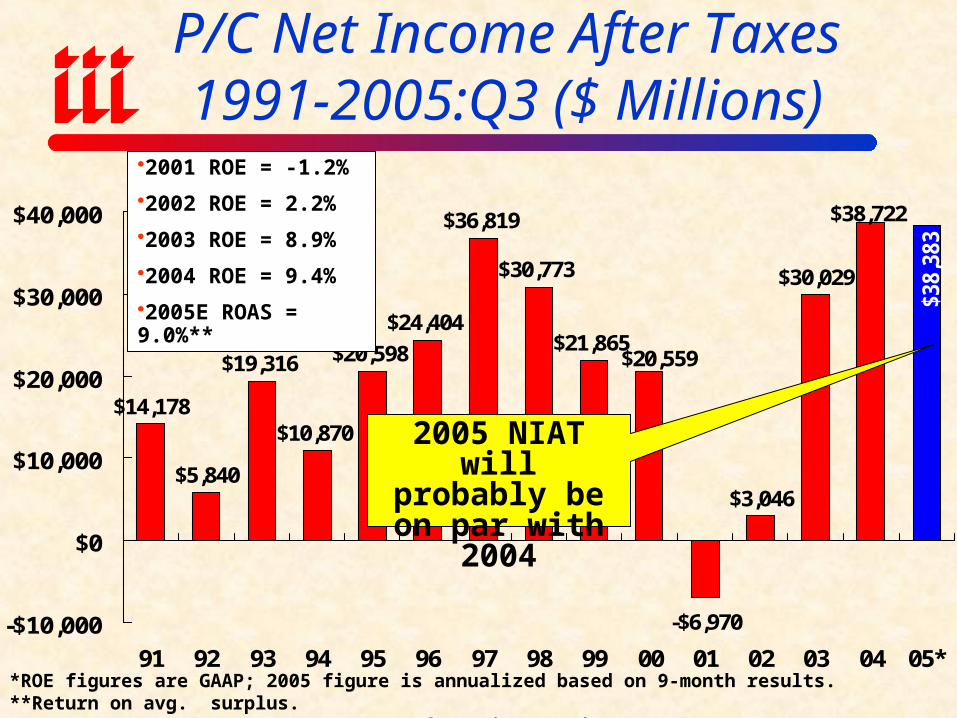
P/C Net Income After Taxes1991-2005:Q3 ($ Millions)
$14,178
$5,840
$19,316
$10,870
$20,598
$24,404
$36,819
$30,773
$21,865
-$6,970
$3,046
$30,029
$38,
383
$20,559
$38,722
-$10,000
$0
$10,000
$20,000
$30,000
$40,000
91 92 93 94 95 96 97 98 99 00 01 02 03 04 05**ROE figures are GAAP; 2005 figure is annualized based on 9-month results. **Return on avg. surplus.Sources: A.M. Best, ISO, Insurance Information Institute.
2001 ROE = -1.2%
2002 ROE = 2.2%
2003 ROE = 8.9%
2004 ROE = 9.4%
2005E ROAS = 9.0%**
2005 NIAT will probably be on par with 2004
-10%
-5%
0%
5%
10%
15%
20%
25%
19
70
19
71
19
72
19
73
19
74
19
75
19
76
19
77
19
78
19
79
19
80
19
81
19
82
19
83
19
84
19
85
19
86
19
87
19
88
19
89
19
90
19
91
19
92
19
93
19
94
19
95
19
96
19
97
19
98
19
99
20
00
20
01
20
02
20
03
20
04
20
05
20
06
F2
00
7F
20
08
F2
00
9F
20
10
F
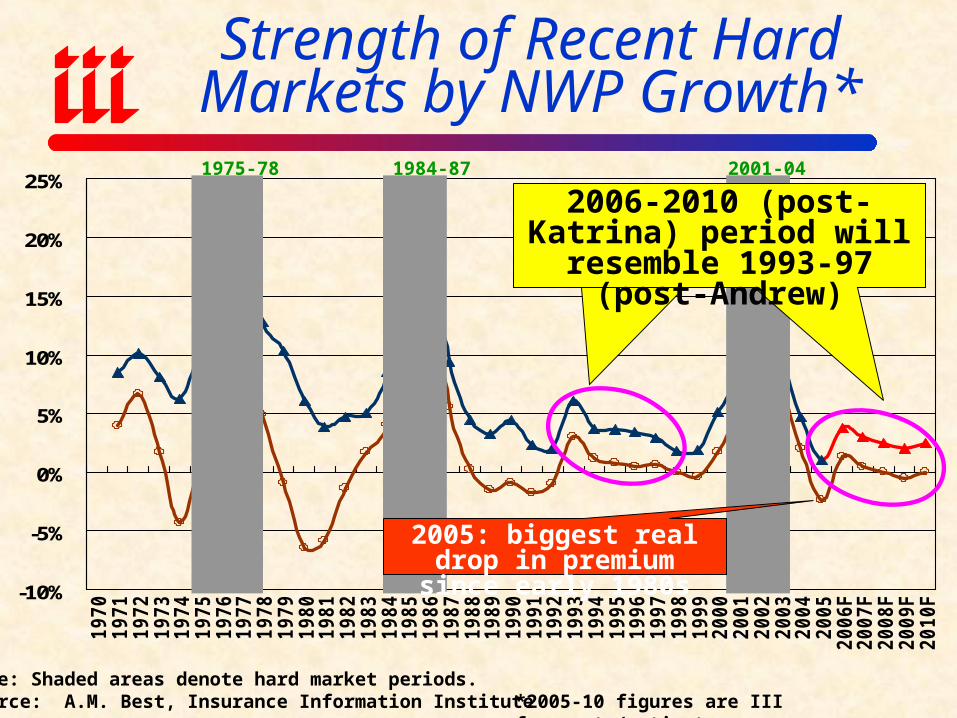
Note: Shaded areas denote hard market periods.Source: A.M. Best, Insurance Information Institute
Strength of Recent Hard Markets by NWP Growth*
1975-78 1984-87 2001-04
*2005-10 figures are III forecasts/estimates.
2006-2010 (post-Katrina) period will resemble 1993-97
(post-Andrew)
2005: biggest real drop in premium since early 1980s
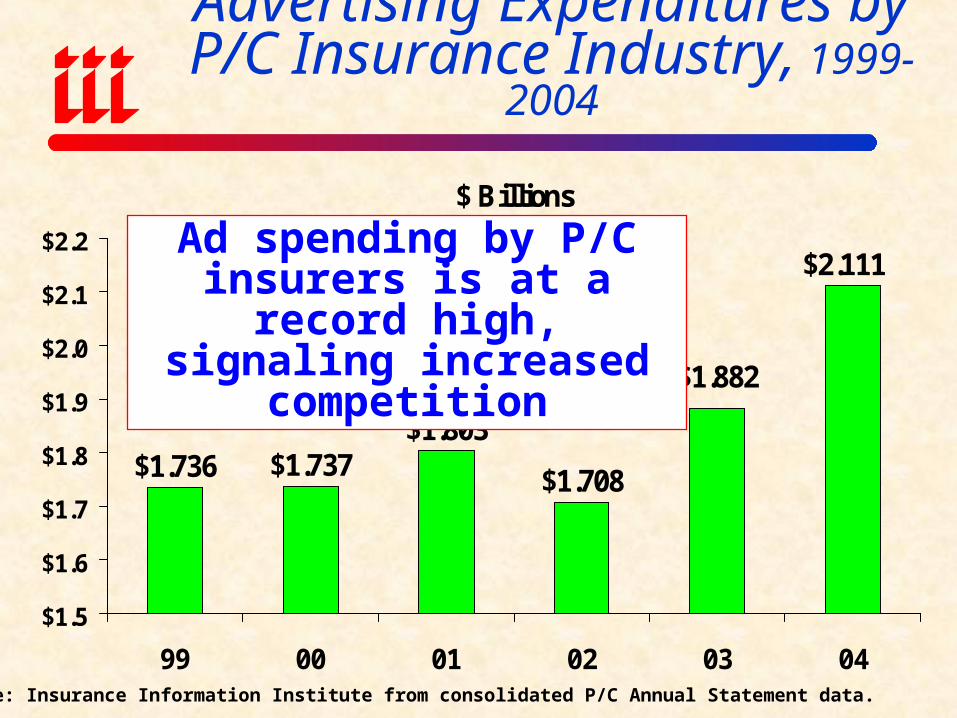
Advertising Expenditures by P/C Insurance Industry, 1999-2004
$ Billions
$1.736 $1.737$1.803
$1.708
$2.111
$1.882
$1.5
$1.6
$1.7
$1.8
$1.9
$2.0
$2.1
$2.2
99 00 01 02 03 04Source: Insurance Information Institute from consolidated P/C Annual Statement data.
Ad spending by P/C insurers is at a record high, signaling
increased competition
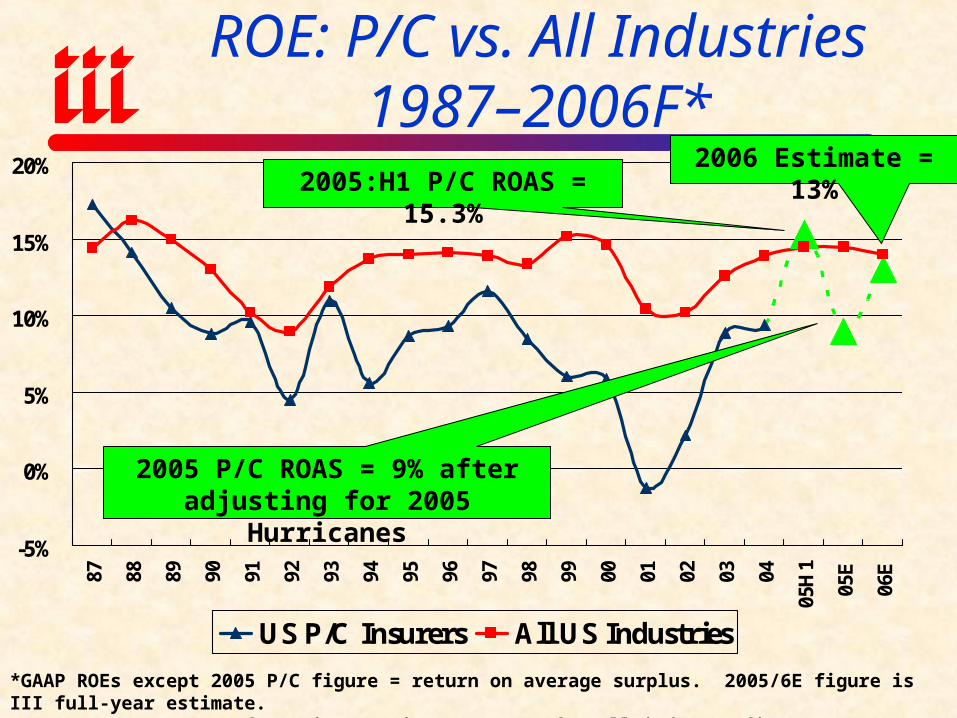
-5%
0%
5%
10%
15%
20%
87 88 89 90 91 92 93 94 95 96 97 98 99 00 01 02 03 04
05H
1
05E
06E
US P/C Insurers All US Industries
ROE: P/C vs. All Industries 1987–2006F*
*GAAP ROEs except 2005 P/C figure = return on average surplus. 2005/6E figure is III full-year estimate.Source: Insurance Information Institute; Fortune for all industry figures
2005 P/C ROAS = 9% after adjusting for 2005 Hurricanes
2005:H1 P/C ROAS = 15.3%2006 Estimate = 13%
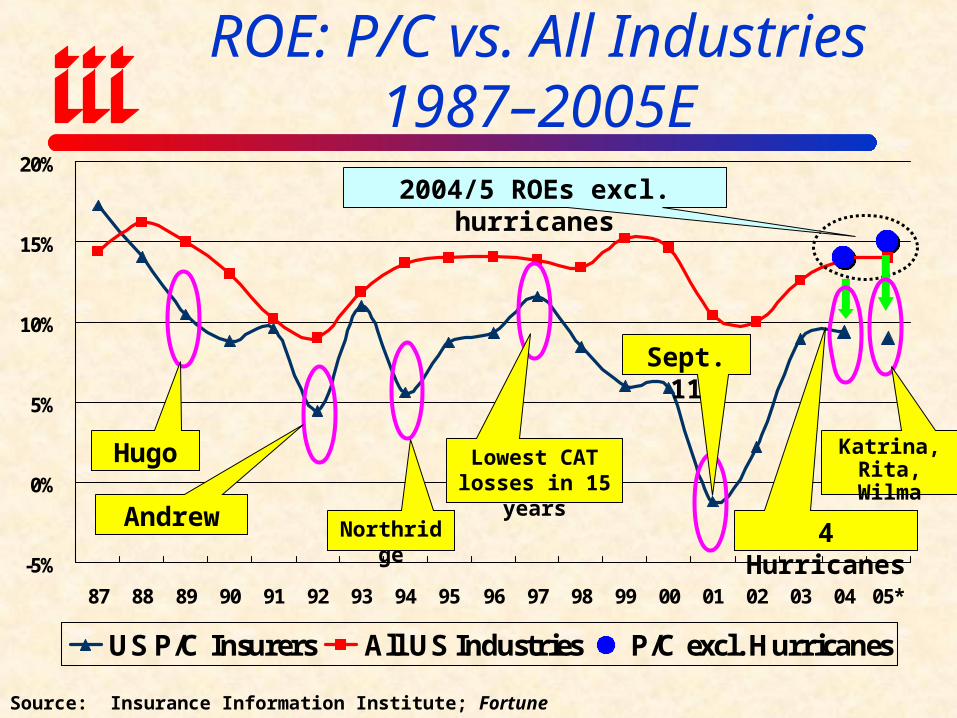
-5%
0%
5%
10%
15%
20%
87 88 89 90 91 92 93 94 95 96 97 98 99 00 01 02 03 04 05*
US P/C Insurers All US Industries P/C excl. Hurricanes
ROE: P/C vs. All Industries 1987–2005E
Source: Insurance Information Institute; Fortune
Andrew Northridge
Hugo Lowest CAT losses in 15 years
Sept. 11
2004/5 ROEs excl. hurricanes
4 Hurricanes
Katrina, Rita, Wilma
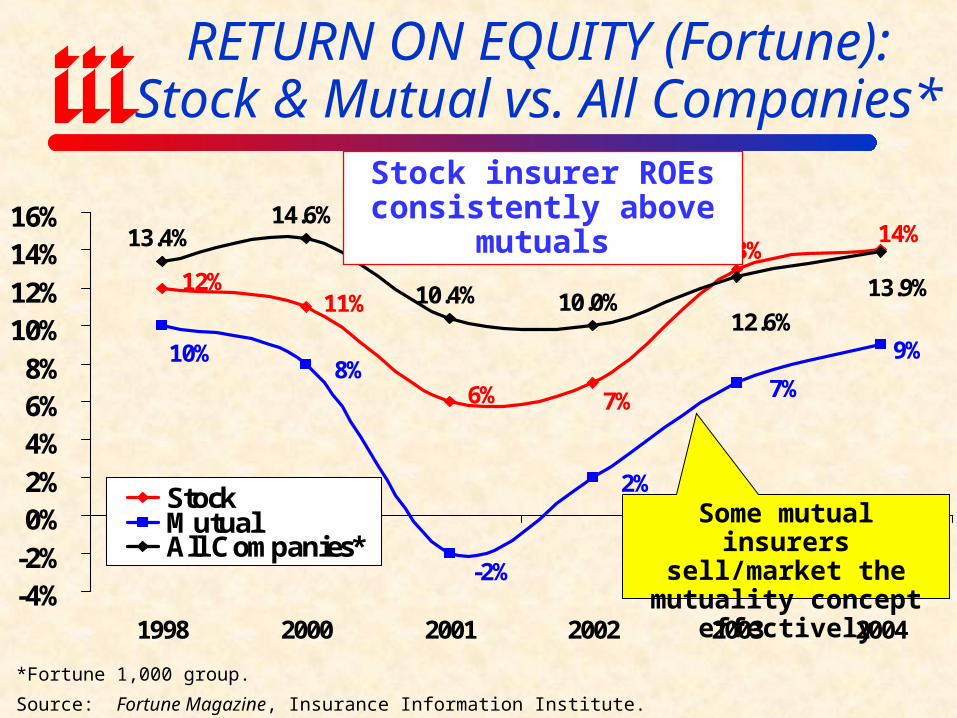
RETURN ON EQUITY (Fortune):Stock & Mutual vs. All Companies*
*Fortune 1,000 group.
Source: Fortune Magazine, Insurance Information Institute.
9%
13.4%14.6%
10.4% 10.0%
14%13%
7%6%
11%12%
-2%
8%7%
2%
10%
13.9%
12.6%
-4%-2%0%2%4%6%8%
10%12%14%16%
1998 2000 2001 2002 2003 2004
StockMutualAll Companies*
Stock insurer ROEs consistently above mutuals
Some mutual insurers sell/market the mutuality
concept effectively
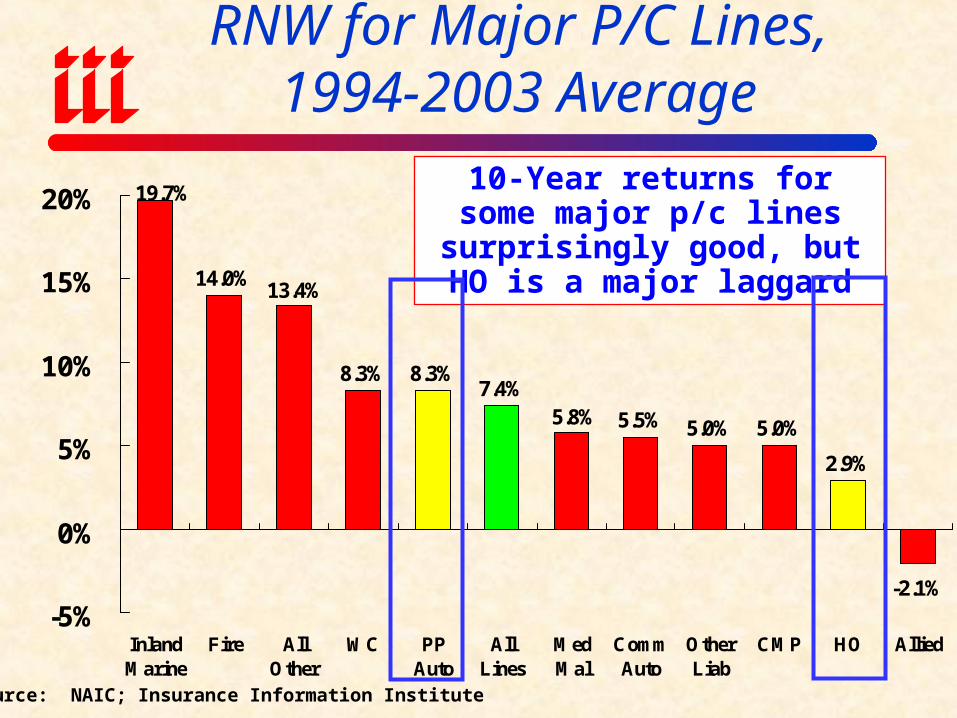
RNW for Major P/C Lines,1994-2003 Average
14.0%
8.3% 8.3%7.4%
5.5% 5.0% 5.0%
2.9%
-2.1%
19.7%
13.4%
5.8%
-5%
0%
5%
10%
15%
20%
InlandMarine
Fire AllOther
WC PPAuto
AllLines
MedMal
CommAuto
OtherLiab
CMP HO Allied
Source: NAIC; Insurance Information Institute
10-Year returns for some major p/c lines surprisingly good, but
HO is a major laggard

WALL STREET:
GENERALLY STRONG GAINS
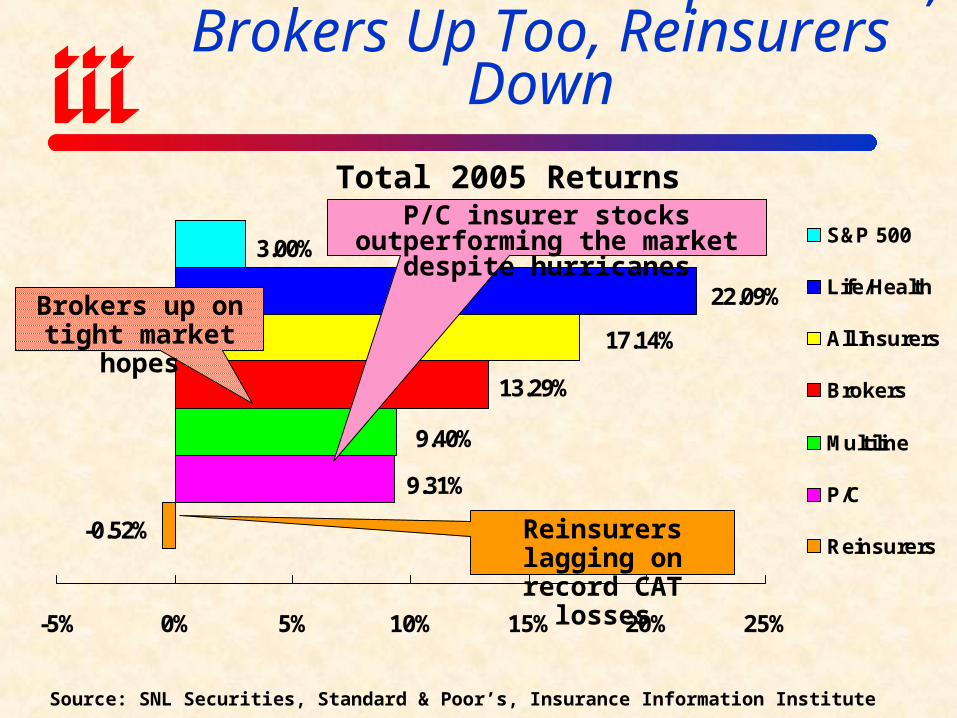
P/C Insurers Stocks Up in 2005, Brokers Up Too, Reinsurers Down
-0.52%
9.31%
9.40%
13.29%
17.14%
22.09%
3.00%
-5% 0% 5% 10% 15% 20% 25%
S&P 500
Life/Health
All Insurers
Brokers
Multiline
P/C
Reinsurers
Source: SNL Securities, Standard & Poor’s, Insurance Information Institute
Total 2005 ReturnsP/C insurer stocks outperforming
the market despite hurricanes
Reinsurers lagging on record CAT losses
Brokers up on tight market hopes
4.2%
4.0% 4.5%
3.8%
2.2%
2.5% 3.
3%
2.7% 3.
9%
2.6% 3.2%
2.9%
4.9%
8.7% 9.3%
-4.0
%
-3.5
%
-2.7
%
-4.1
%
-5.3
%
-4.5
%
-5.7
%
-5.8
%
-6.0
%
-6.2
%
-5.3
%
-5.6
%
-5.6
%
-1.3
%
-0.5
%
-5.5
%
-6.4
% -4.8
%
-5.5
%
-0.6
%
1.9%
2.1% 3.
6% 4.8%
3.4%
2.2% 2.
8%
5.0%
7.0%
13.3
%
-10%
-5%
0%
5%
10%
15%
5-Aug
12-Aug
19-Aug
26-Aug
2-Sep
9-Sep
16-Sep
23-Sep
30-Sep
7-Oct
14-Oct
21-Oct
28-Oct
04-Nov
31-Dec
P/C Reinsurers Brokers
Source: SNL Securities; Insurance Information Institute
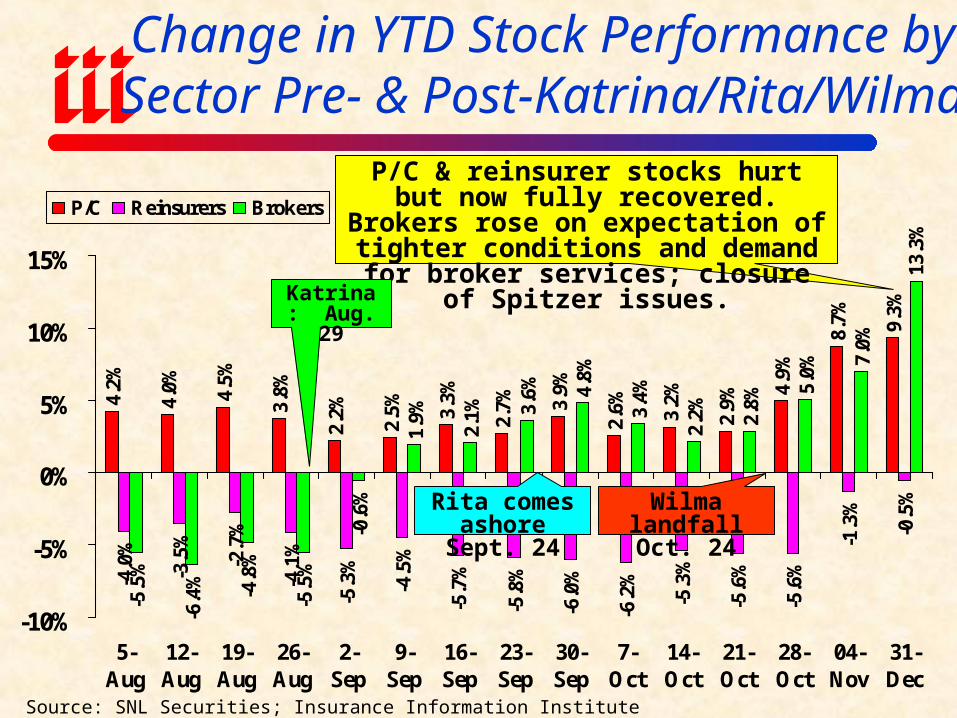
Change in YTD Stock Performance by Sector Pre- & Post-Katrina/Rita/Wilma
P/C & reinsurer stocks hurt but now fully recovered. Brokers rose on expectation of tighter conditions and demand for broker
services; closure of Spitzer issues.
Katrina: Aug. 29
Rita comes ashore Sept. 24
Wilma landfall Oct. 24
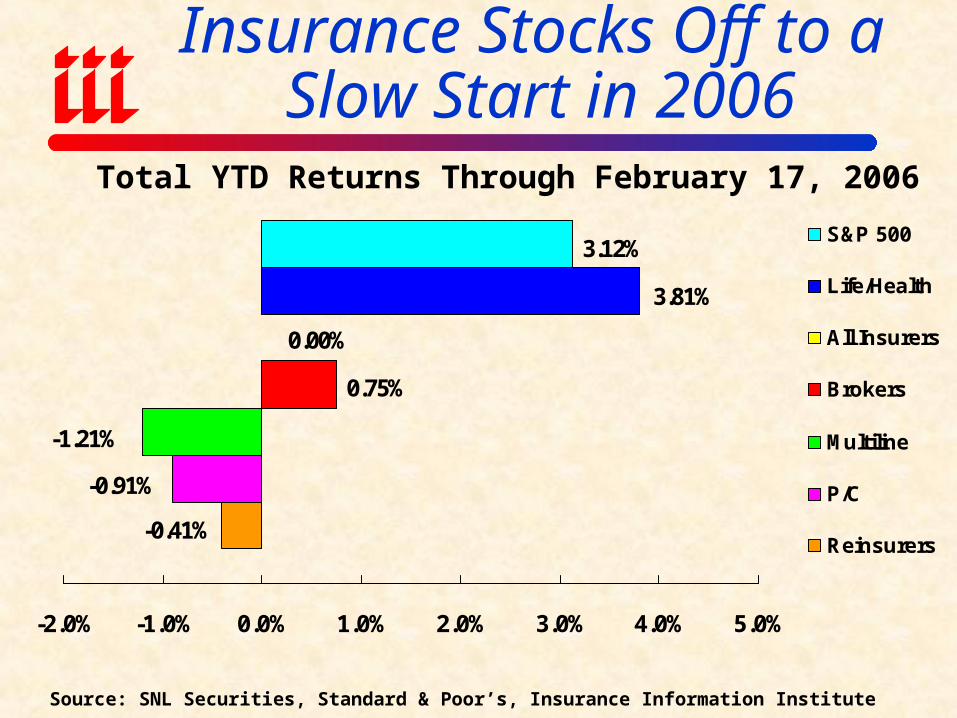
Insurance Stocks Off to a Slow Start in 2006
-0.41%
-0.91%
-1.21%
0.75%
0.00%
3.81%
3.12%
-2.0% -1.0% 0.0% 1.0% 2.0% 3.0% 4.0% 5.0%
S&P 500
Life/Health
All Insurers
Brokers
Multiline
P/C
Reinsurers
Source: SNL Securities, Standard & Poor’s, Insurance Information Institute
Total YTD Returns Through February 17, 2006
PUBLIC PERCEPTIONS OF INSURANCE
INDUSTRYHave Public Perceptions of the
Industry Been Affected by Mega-Disasters and Scandals
0%
10%
20%
30%
40%
50%
60%
70%
80%
90%
1968
1972
1978
1981
1983
1985
1986
1988
1991
1992
1993
1994
1995
1996
1997
1998
1999
2000
2001
2002
2003
2004
Ju
n-0
5
Dec
-05
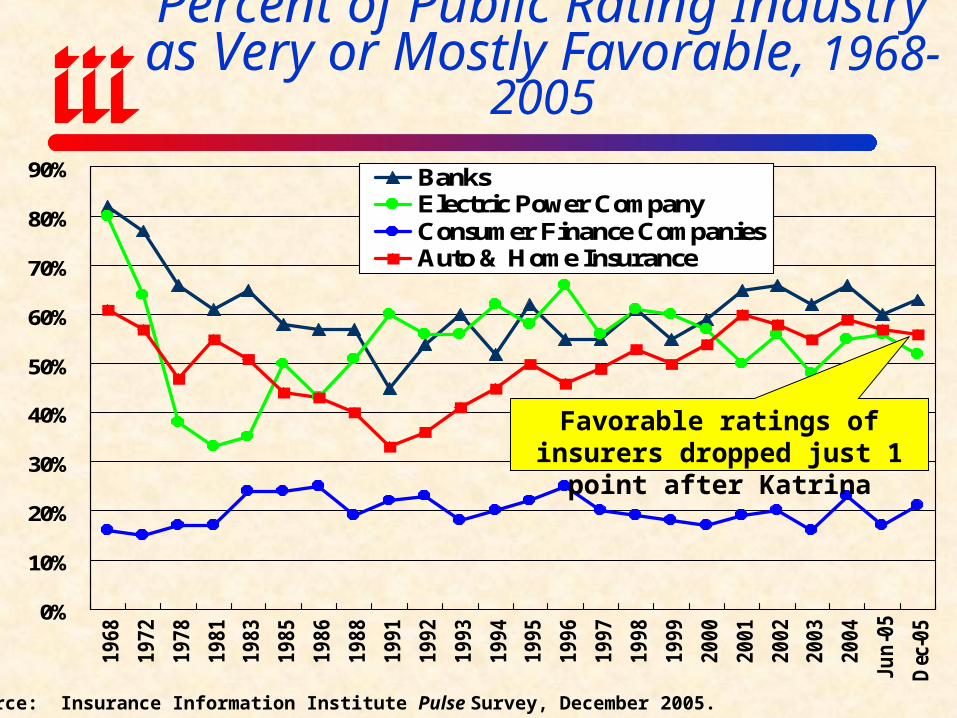
BanksElectric Power CompanyConsumer Finance CompaniesAuto & Home Insurance
Source: Insurance Information Institute Pulse Survey, December 2005.
Percent of Public Rating Industry as Very or Mostly Favorable, 1968-2005
Favorable ratings of insurers dropped just 1 point after Katrina
7%
11%
8%
9%
9%
12%
14%
13%
15%
15%
33%
21%
24%
25%
25%
17%
15%
20%
19%
21%
17%
37%
30%
29%
26%
15%
2%
3%
2%
3%
0% 20% 40% 60% 80% 100%
Insurance Cos.
Bush Admin.
FEMA
FederalGovernment
State & LocalGovt.
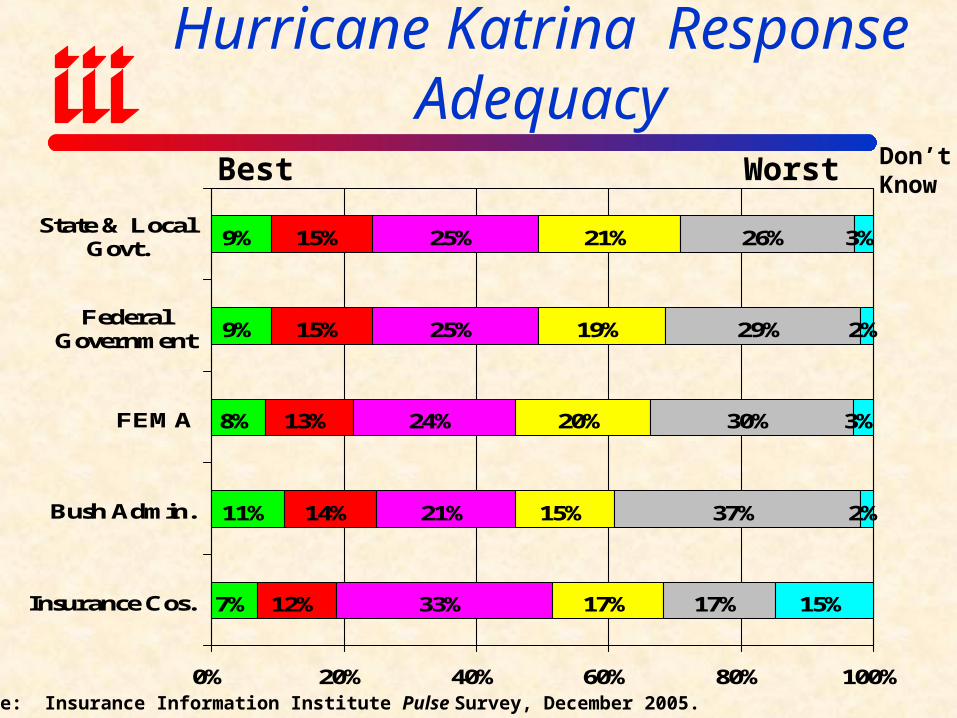
Source: Insurance Information Institute Pulse Survey, December 2005.
Public Perceptions of Hurricane Katrina Response AdequacyBest Worst Don’t
Know
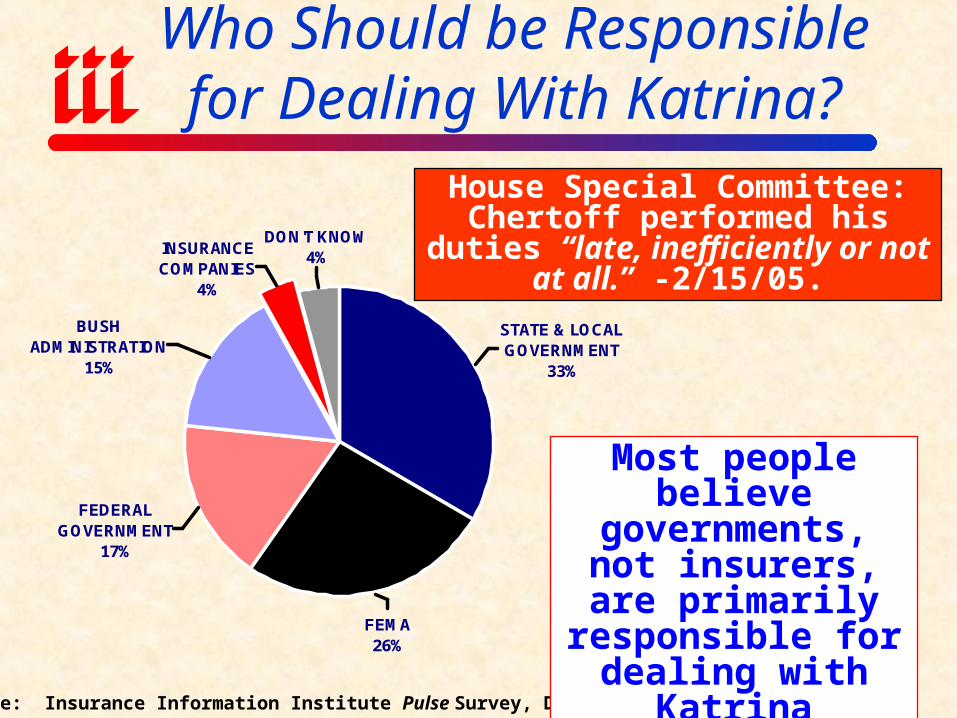
Who Should be Responsible for Dealing With Katrina?
STATE & LOCAL GOVERNMENT
33%
FEMA26%
FEDERAL GOVERNMENT
17%
BUSH ADMINISTRATION
15%
INSURANCE COMPANIES
4%
DON'T KNOW4%
Source: Insurance Information Institute Pulse Survey, December 2005.
Most people believe governments, not
insurers, are primarily responsible
for dealing with Katrina
House Special Committee: Chertoff performed his duties “late,
inefficiently or not at all.” -2/15/05.

Profit Pillar #1UNDERWRITING
Surprisingly Strong in 2005, Stage is Set for a
Good 2006
115.8
107.4
100.198.3
92.7
101.8
97.7
90
100
110
120
01 02 03 04 05H1 05E 06F IIIForecast*
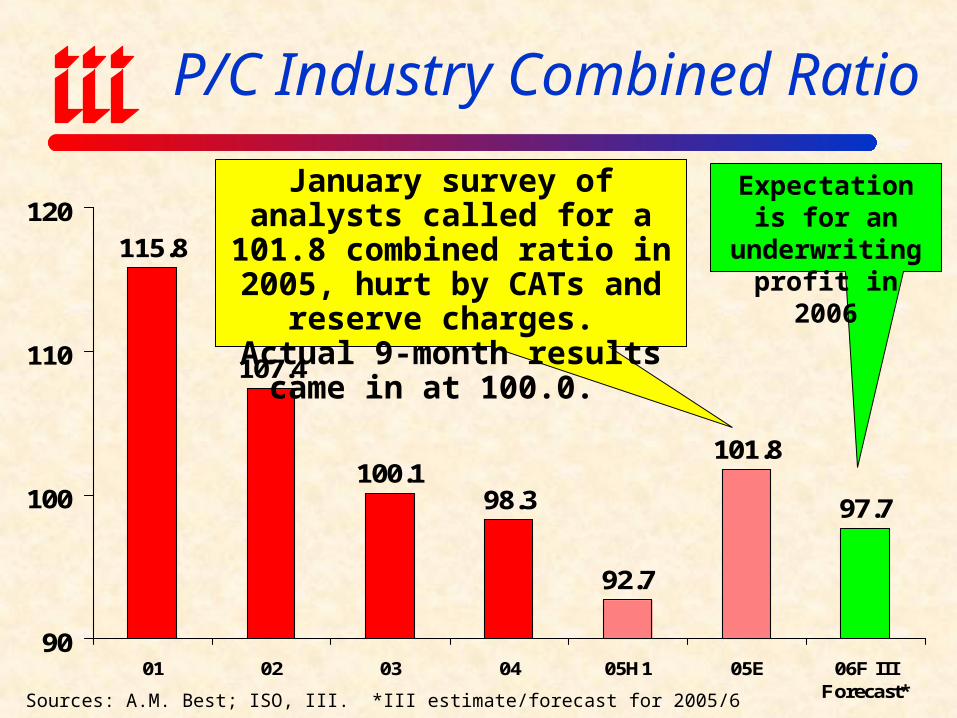
P/C Industry Combined Ratio
Sources: A.M. Best; ISO, III. *III estimate/forecast for 2005/6
January survey of analysts called for a 101.8 combined ratio
in 2005, hurt by CATs and reserve charges. Actual 9-month
results came in at 100.0.
Expectation is for an underwriting
profit in 2006
103.
9
104.
5
103.
5
104.
9
99.8 10
2.7
104.
5
109.
9
110.
9
105.
3
98.4
94.3
100.
0
95.9
85
90
95
100
105
110
115
93 94 95 96 97 98 99 00 01 02 03 04 05E 06F
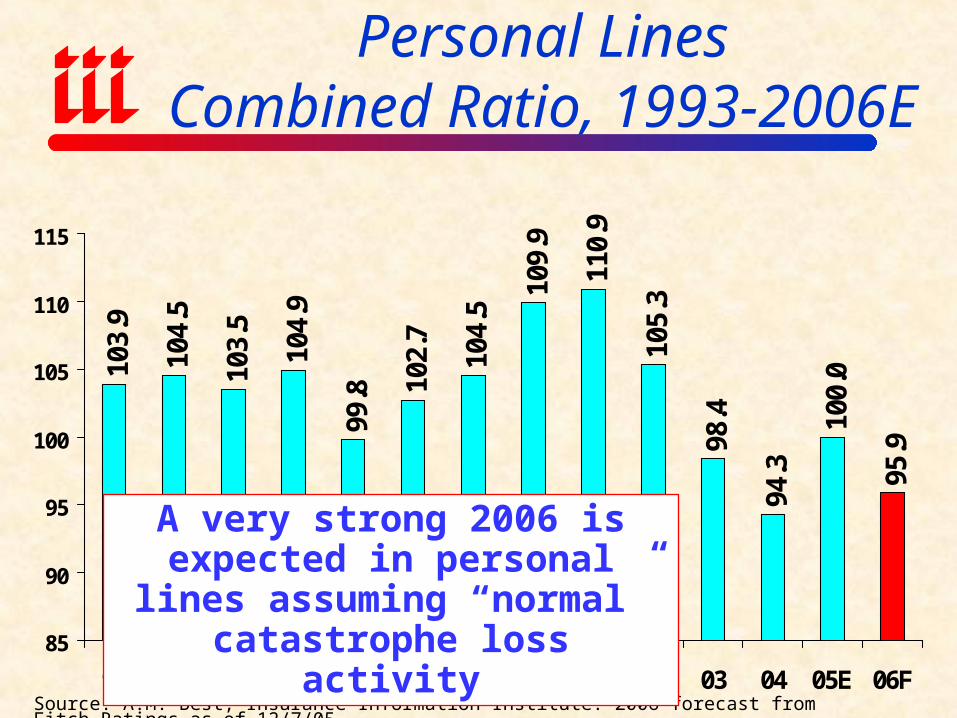
Personal LinesCombined Ratio, 1993-2006E
Source: A.M. Best; Insurance Information Institute. 2006 forecast from Fitch Ratings as of 12/7/05.
A very strong 2006 is expected in personal lines assuming “normal”
catastrophe loss activity
97.5
100.6 100.198.3
92.7
100.0
9.4% 9.5%
15.3%14.3%
15.9%
9.4%
80
85
90
95
100
105
110
1978 1979 2003Actual
2004 2005:H1 2005E
Co
mb
ined
Ratio
6%
8%
10%
12%
14%
16%
18%
Retr
un
on
Eq
uity*
Combined Ratio ROE*
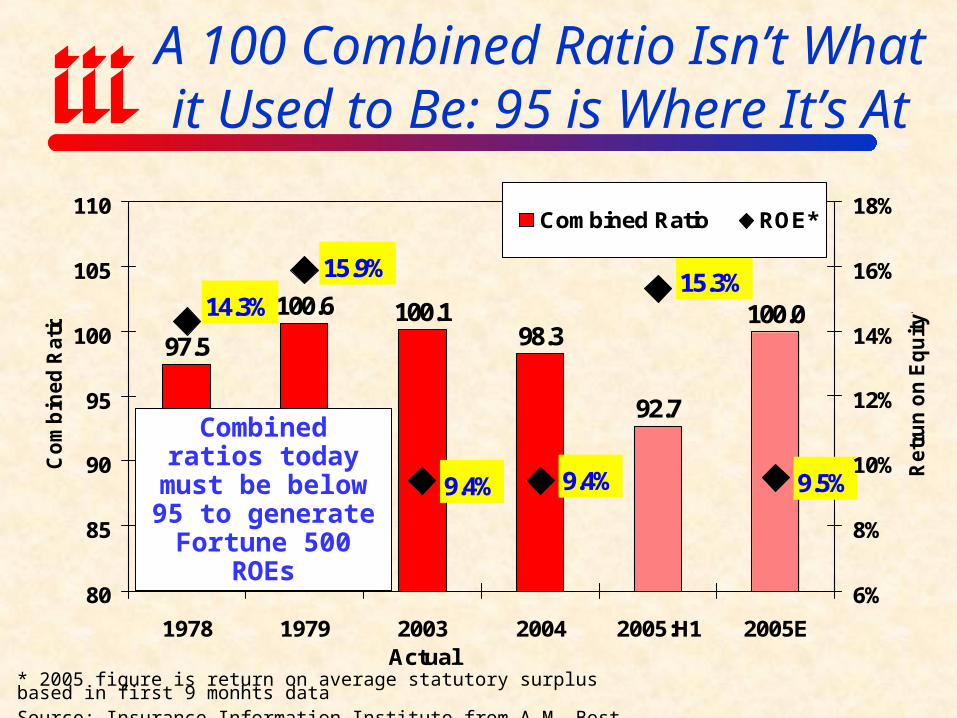
* 2005 figure is return on average statutory surplus based in first 9 monhts dataSource: Insurance Information Institute from A.M. Best and ISO data.
A 100 Combined Ratio Isn’t What it Used to Be: 95 is Where It’s At
Combined ratios today must be below
95 to generate Fortune 500 ROEs
($55)($50)($45)($40)($35)($30)($25)($20)($15)($10)($5)$0$5
$10
75
76
77
78
79
80
81
82
83
84
85
86
87
88
89
90
91
92
93
94
95
96
97
98
99
00
01
02
03
04
05
E0
6F
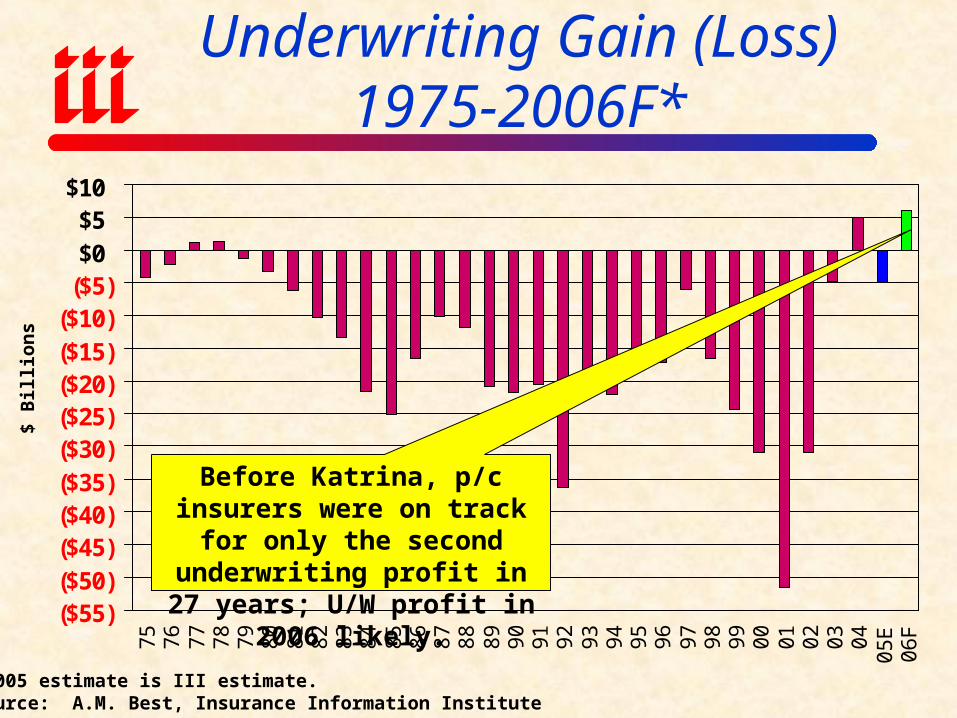
Underwriting Gain (Loss)1975-2006F*
*2005 estimate is III estimate. Source: A.M. Best, Insurance Information Institute
$ B
illi
ons
Before Katrina, p/c insurers were on track for only the
second underwriting profit in 27 years; U/W profit in 2006 likely.
110
.5
10
5.0 11
3.6 11
9.2
10
4.8
10
0.8
10
0.5
114
.3
10
6.5
12
5.8
111
.0
12
4.6
12
4.1
10
8.8 11
5.8
10
6.9
10
8.5
10
6.7
10
6.0
10
1.9
10
5.9
10
8.0
110
.1 115
.8
10
7.4
10
0.1
98
.3 10
1.8
16
2.4
12
6.5
90
100
110
120
130
140
150
160
170
91 92 93 94 95 96 97 98 99 00 01 02 03 04 05E*
Reinsurance All Lines Combined Ratio
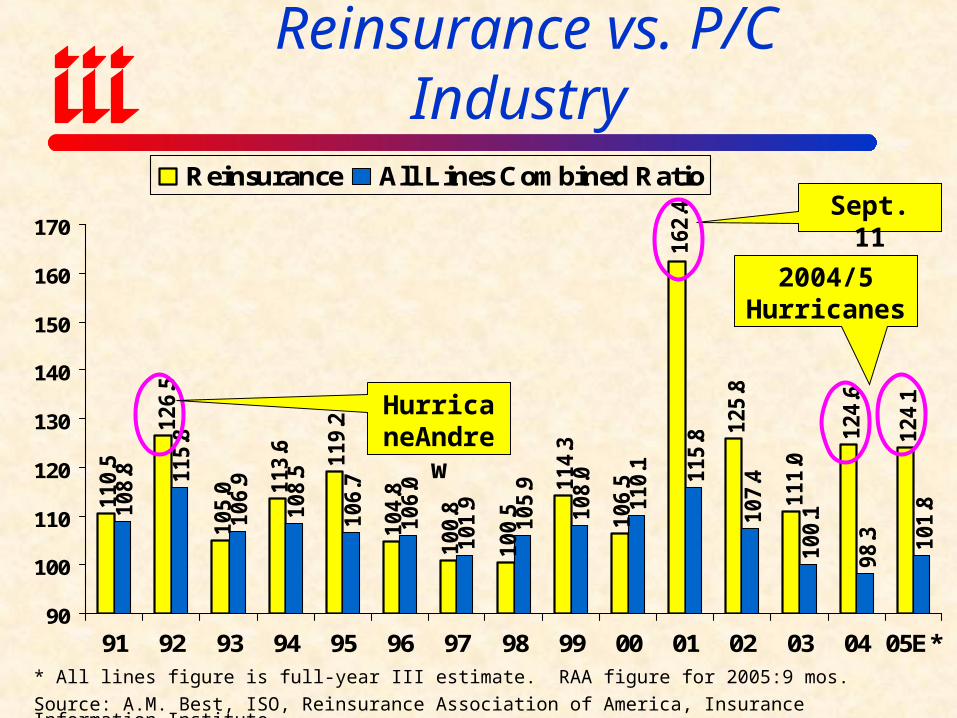
Combined Ratio: Reinsurance vs. P/C Industry
* All lines figure is full-year III estimate. RAA figure for 2005:9 mos.
Source: A.M. Best, ISO, Reinsurance Association of America, Insurance Information Institute
HurricaneAndrew
Sept. 11
2004/5 Hurricanes
UNDERWRITING AFFECTS FINANCIAL
STRENGTH
Is There Causefor Concern?
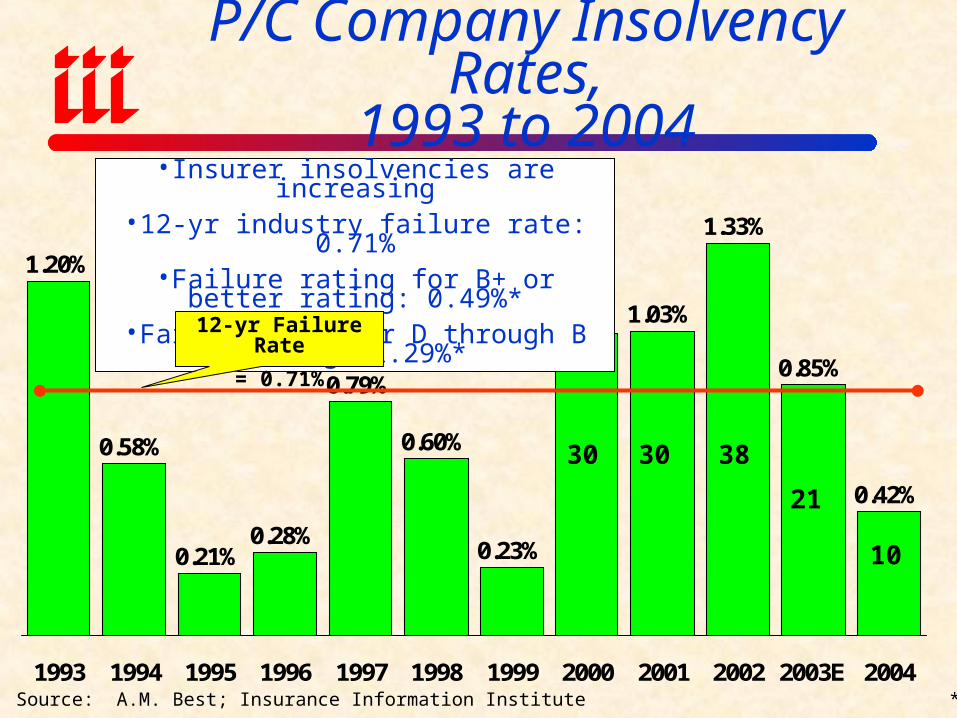
P/C Company Insolvency Rates,1993 to 2004
Source: A.M. Best; Insurance Information Institute *1993-2003
1.20%
0.58%
0.21%0.28%
0.79%
0.60%
0.23%
1.02% 1.03%
1.33%
0.85%
0.42%
1993 1994 1995 1996 1997 1998 1999 2000 2001 2002 2003E 2004
•Insurer insolvencies are increasing•12-yr industry failure rate: 0.71%
•Failure rating for B+ or better rating: 0.49%*•Failure rate for D through B rating: 1.29%*
383030
12-yr Failure Rate
= 0.71%
21
10
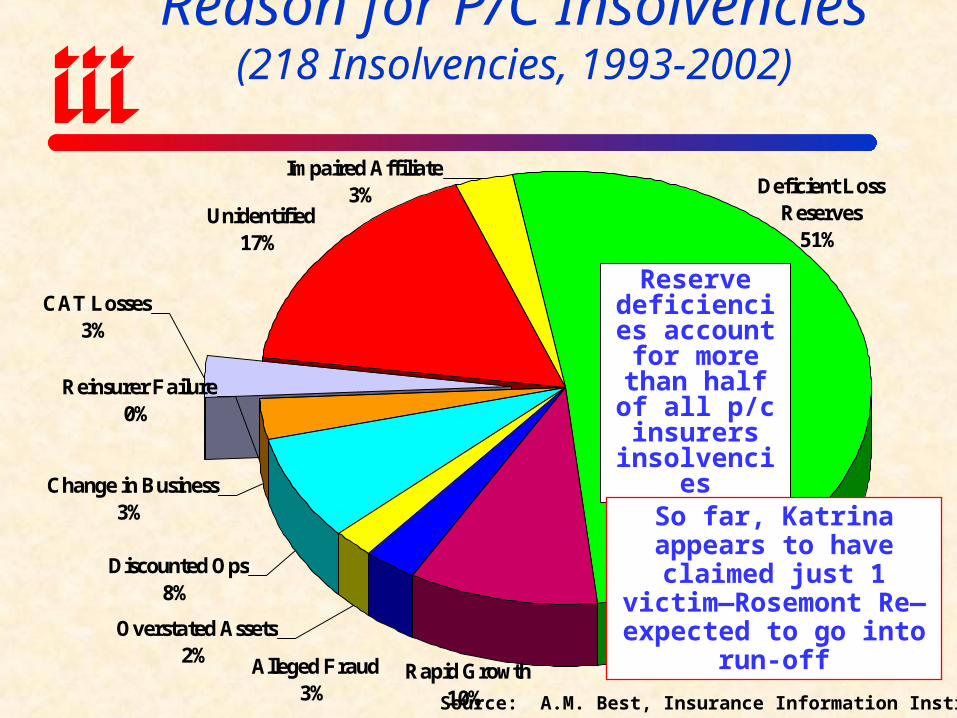
Reason for P/C Insolvencies(218 Insolvencies, 1993-2002)
Unidentified17%
Impaired Affiliate3%
Overstated Assets2%
Change in Business3%
CAT Losses3%
Reinsurer Failure0%
Rapid Growth10%
Discounted Ops8%
Alleged Fraud3%
Deficient Loss Reserves
51%
Source: A.M. Best, Insurance Information Institute
Reserve deficiencies account for
more than half of all p/c insurers
insolvencies
So far, Katrina appears to have claimed just 1 victim—Rosemont Re—expected
to go into run-off
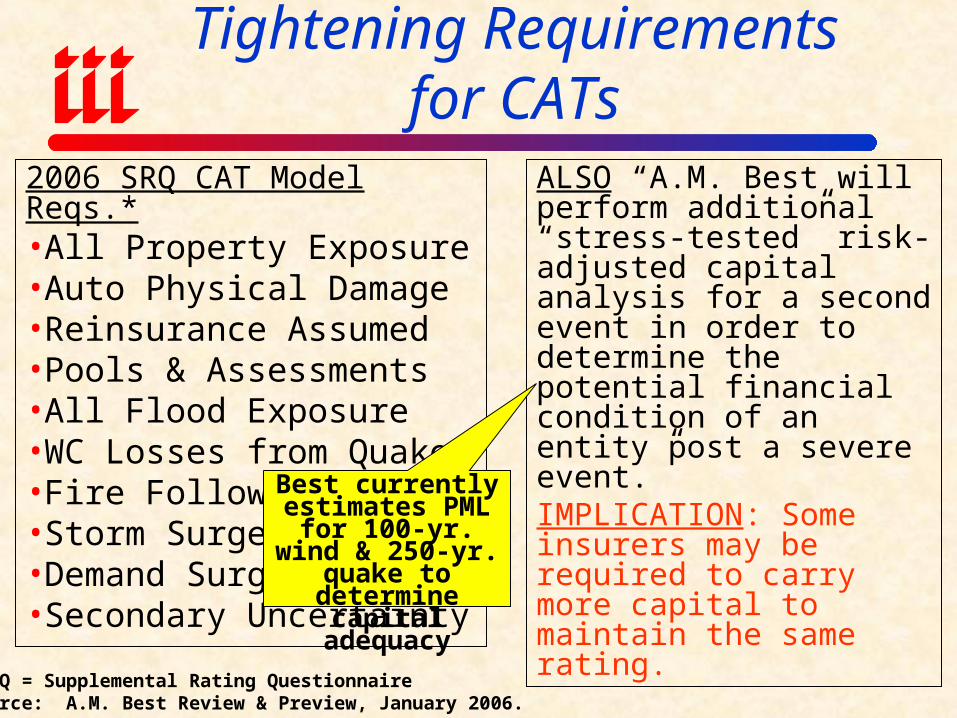
Ratings Agencies Tightening Requirements for CATs
2006 SRQ CAT Model Reqs.*•All Property Exposure•Auto Physical Damage•Reinsurance Assumed•Pools & Assessments•All Flood Exposure•WC Losses from Quake•Fire Following•Storm Surge•Demand Surge•Secondary Uncertainty
ALSO “A.M. Best will perform additional “stress-tested” risk-adjusted capital analysis for a second event in order to determine the potential financial condition of an entity post a severe event.”IMPLICATION: Some insurers may be required to carry more capital to maintain the same rating.
*SRQ = Supplemental Rating QuestionnaireSource: A.M. Best Review & Preview, January 2006.
Best currently estimates PML for
100-yr. wind & 250-yr. quake to determine capital
adequacy
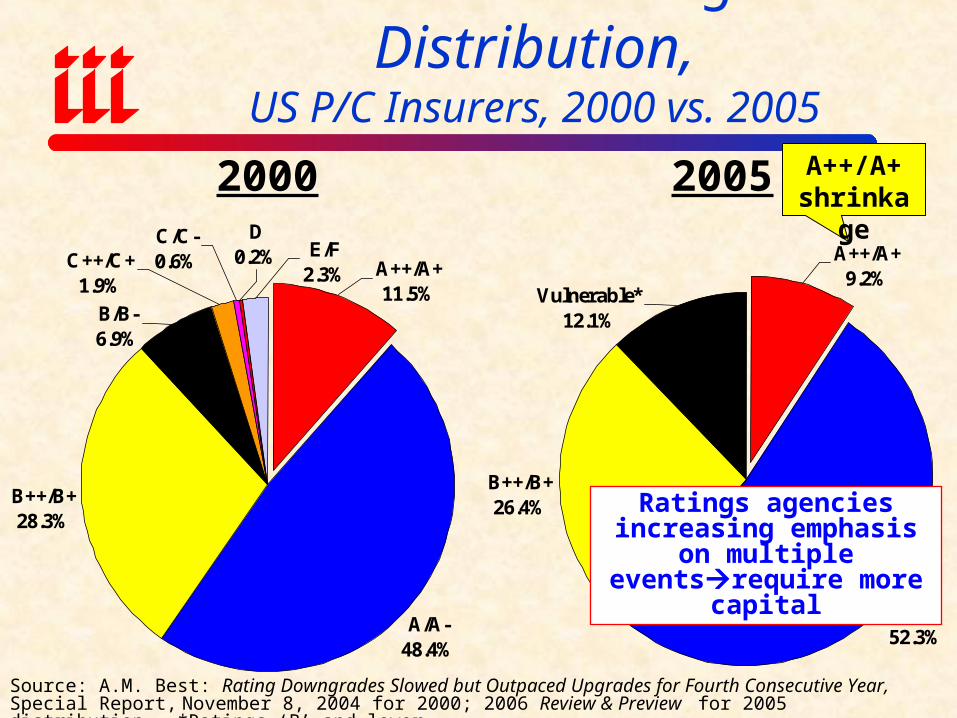
Historical Ratings Distribution,US P/C Insurers, 2000 vs. 2005
A/A-52.3%
A++/A+9.2%
B++/B+26.4%
Vulnerable*12.1%
Source: A.M. Best: Rating Downgrades Slowed but Outpaced Upgrades for Fourth Consecutive Year, Special Report, November 8, 2004 for 2000; 2006 Review & Preview for 2005 distribution. *Ratings ‘B’ and lower.
A/A-48.4%
D0.2%C++/C+
1.9%
E/F2.3% A++/A+
11.5%
C/C-0.6%
B++/B+28.3%
B/B-6.9%
2000 2005 A++/A+ shrinkage
Ratings agencies increasing emphasis on multiple
eventsrequire more capital
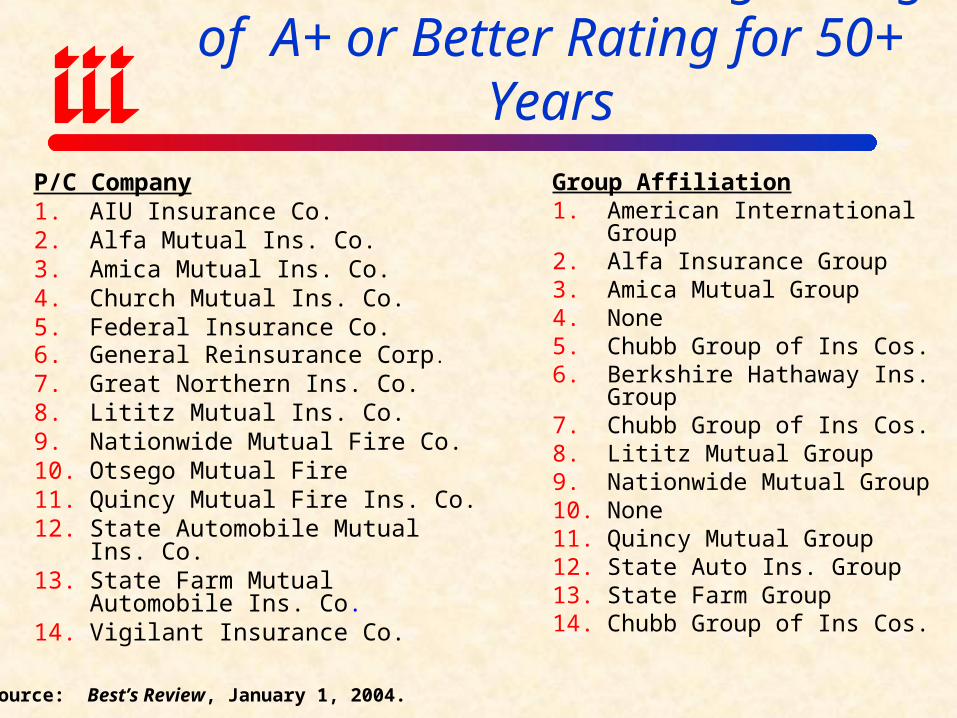
P/C Insurers Maintaining Rating of A+ or Better Rating for 50+ Years
P/C Company1. AIU Insurance Co.2. Alfa Mutual Ins. Co.3. Amica Mutual Ins. Co.4. Church Mutual Ins. Co.5. Federal Insurance Co.6. General Reinsurance Corp.
7. Great Northern Ins. Co.8. Lititz Mutual Ins. Co.9. Nationwide Mutual Fire Co.10. Otsego Mutual Fire11. Quincy Mutual Fire Ins. Co.12. State Automobile Mutual Ins. Co.13. State Farm Mutual Automobile Ins. Co.14. Vigilant Insurance Co.
Group Affiliation1. American International Group2. Alfa Insurance Group3. Amica Mutual Group4. None5. Chubb Group of Ins Cos.6. Berkshire Hathaway Ins. Group7. Chubb Group of Ins Cos.8. Lititz Mutual Group9. Nationwide Mutual Group10. None11. Quincy Mutual Group12. State Auto Ins. Group13. State Farm Group14. Chubb Group of Ins Cos.
Source: Best’s Review, January 1, 2004.

Underwriting Matters Because Pricing is Often Undisciplined
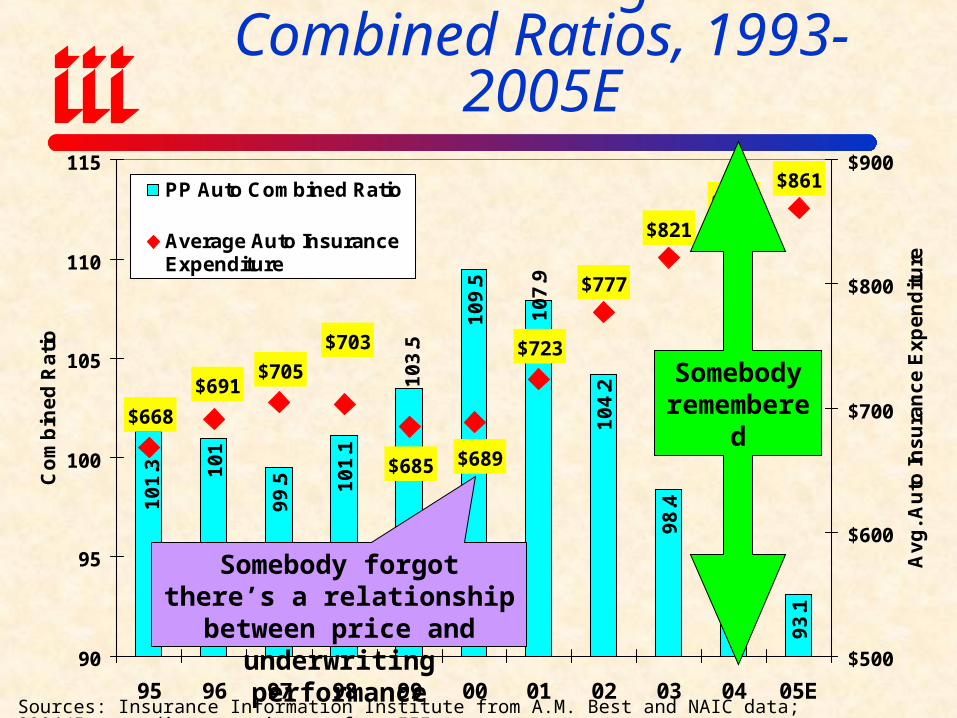
99
.5 10
1.1
10
9.5
10
4.2
98
.4
94
.0
93
.1
10
7.9
10
3.5
10
1.3 10
1
$777
$821
$844$861
$689$685
$705
$703 $723
$691
$668
90
95
100
105
110
115
95 96 97 98 99 00 01 02 03 04 05E
Co
mb
ine
d R
ati
o
$500
$600
$700
$800
$900
Av
g. A
uto
Ins
ura
nc
e E
xp
en
dit
ure
PP Auto Combined Ratio
Average Auto InsuranceExpenditure
Private Passenger AutoCombined Ratios, 1993-2005E
Sources: Insurance Information Institute from A.M. Best and NAIC data; 2004/5 expenditure estimates from III.
Somebody forgot there’s a relationship between price and
underwriting performance
Somebody remembered
CATASTROPHE LOSS
MANAGEMENT
Failure to Adequately Manage this Risk Has Been Devastating
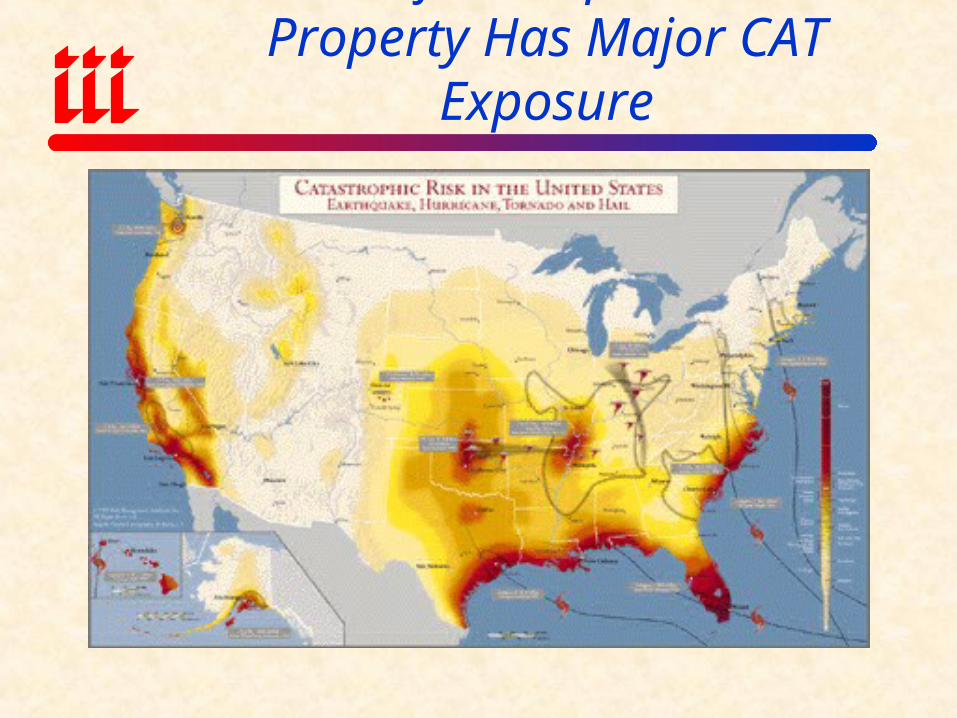
Most of US Population & Property Has Major CAT Exposure
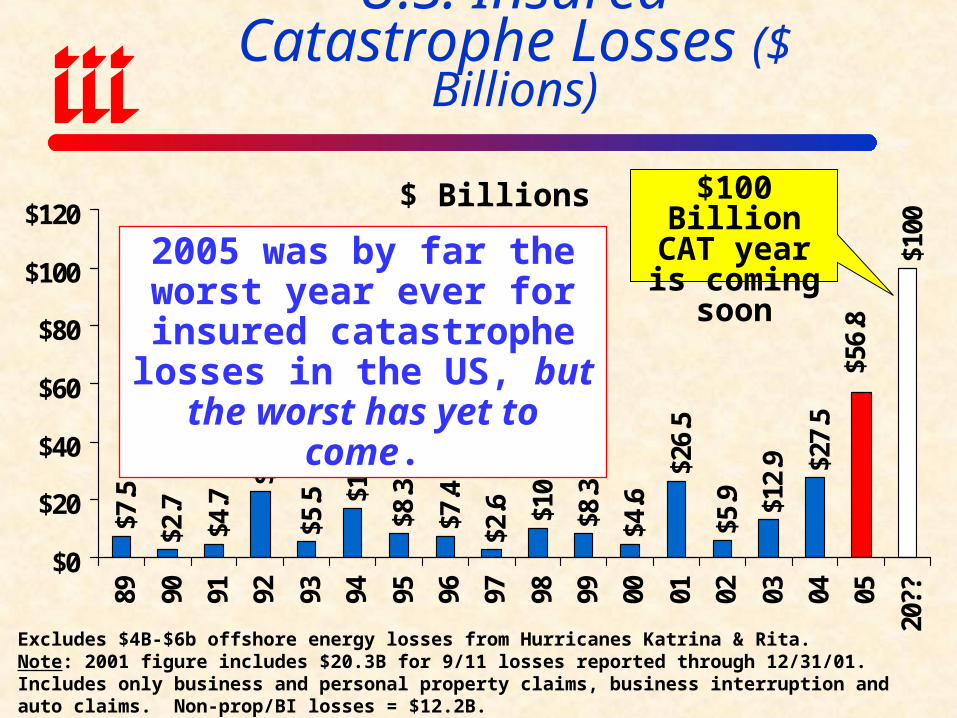
U.S. InsuredCatastrophe Losses ($ Billions)
$7.5
$2.7
$4.7
$22.
9
$5.5 $1
6.9
$8.3
$7.4
$2.6 $1
0.1
$8.3
$4.6
$26.
5
$5.9 $1
2.9 $2
7.5
$56.
8
$100
$0
$20
$40
$60
$80
$100
$120
89 90 91 92 93 94 95 96 97 98 99 00 01 02 03 04 05
20??
Excludes $4B-$6b offshore energy losses from Hurricanes Katrina & Rita.Note: 2001 figure includes $20.3B for 9/11 losses reported through 12/31/01. Includes only business and personal property claims, business interruption and auto claims. Non-prop/BI losses = $12.2B.Source: Property Claims Service/ISO; Insurance Information Institute
$ Billions
2005 was by far the worst year ever for insured
catastrophe losses in the US, but the worst has yet to come.
$100 Billion CAT year is coming soon
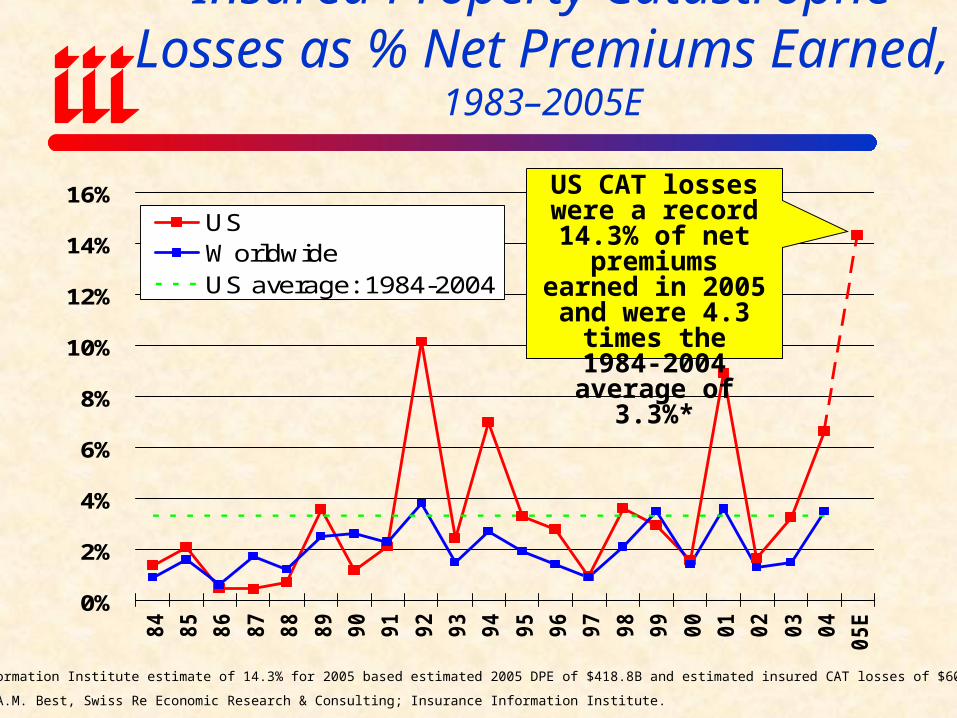
Insured Property Catastrophe Losses as % Net Premiums Earned, 1983–2005E
0%
2%
4%
6%
8%
10%
12%
14%
16%
84
85
86
87
88
89
90
91
92
93
94
95
96
97
98
99
00
01
02
03
04
05E
USWorldwideUS average: 1984-2004
*Insurance Information Institute estimate of 14.3% for 2005 based estimated 2005 DPE of $418.8B and estimated insured CAT losses of $60B.
Sources: ISO, A.M. Best, Swiss Re Economic Research & Consulting; Insurance Information Institute.
US CAT losses were a record 14.3% of
net premiums earned in 2005 and were 4.3 times the 1984-2004 average
of 3.3%*
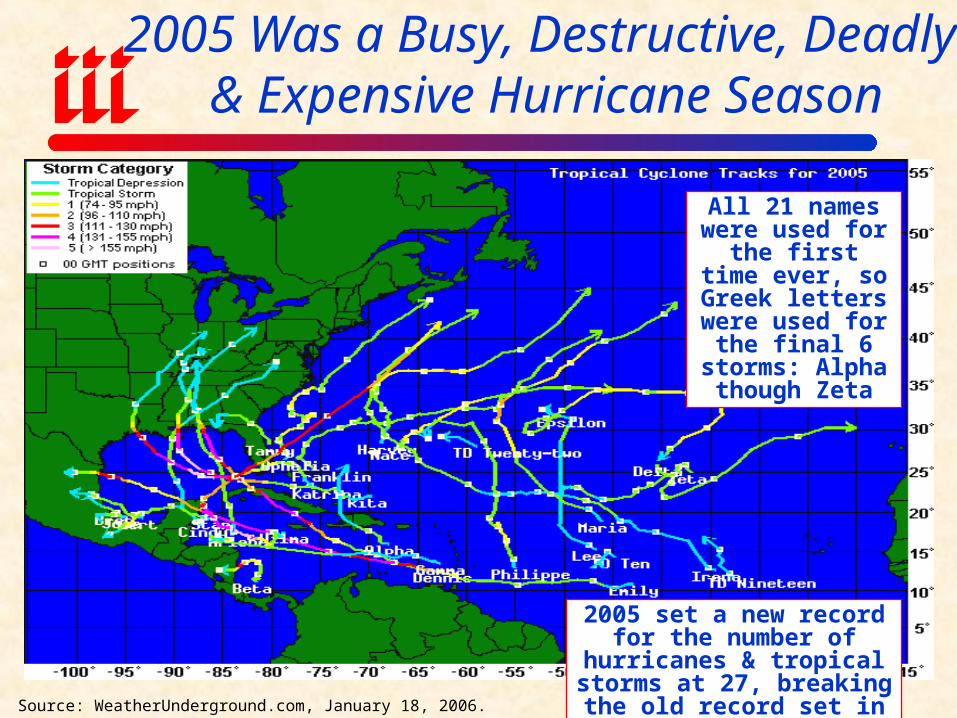
2005 Was a Busy, Destructive, Deadly & Expensive Hurricane Season
Source: WeatherUnderground.com, January 18, 2006.
All 21 names were used for the first
time ever, so Greek letters were used for the final 6
storms: Alpha though Zeta
2005 set a new record for the number of hurricanes &
tropical storms at 27, breaking the old record set in 1933.
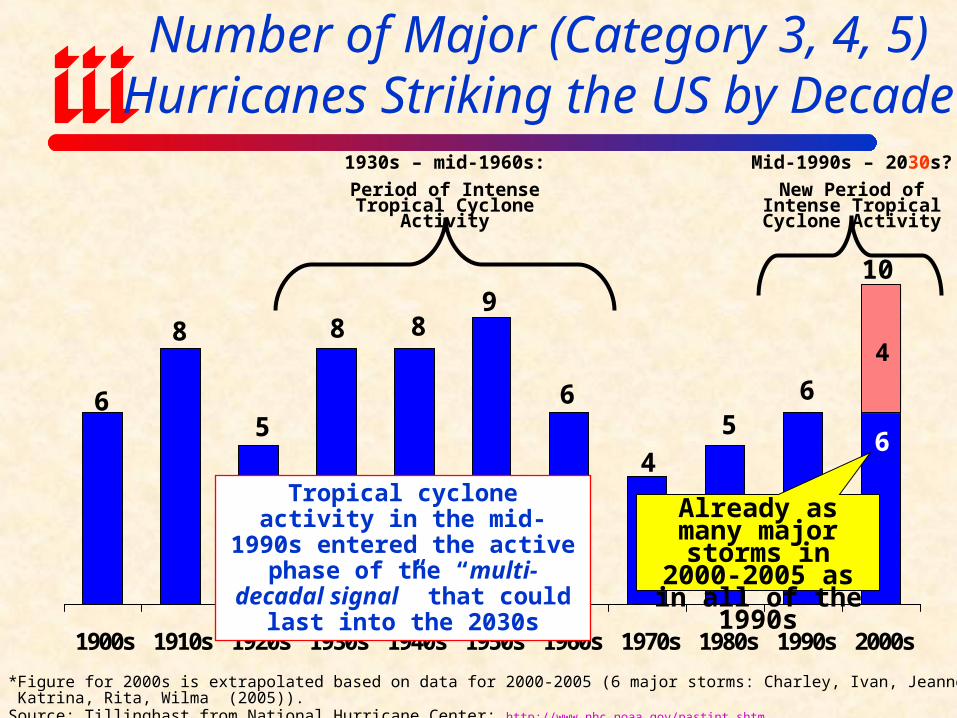
Number of Major (Category 3, 4, 5) Hurricanes Striking the US by Decade
4
6
65
4
6
88
5
8
6
9
1900s 1910s 1920s 1930s 1940s 1950s 1960s 1970s 1980s 1990s 2000s
*Figure for 2000s is extrapolated based on data for 2000-2005 (6 major storms: Charley, Ivan, Jeanne (2004) & Katrina, Rita, Wilma (2005)).Source: Tillinghast from National Hurricane Center: http://www.nhc.noaa.gov/pastint.shtm.
10
1930s – mid-1960s:
Period of Intense Tropical Cyclone Activity
Mid-1990s – 2030s?
New Period of Intense Tropical Cyclone Activity
Tropical cyclone activity in the mid-1990s entered the active
phase of the “multi-decadal signal” that could last into the 2030s
Already as many major storms in
2000-2005 as in all of the 1990s
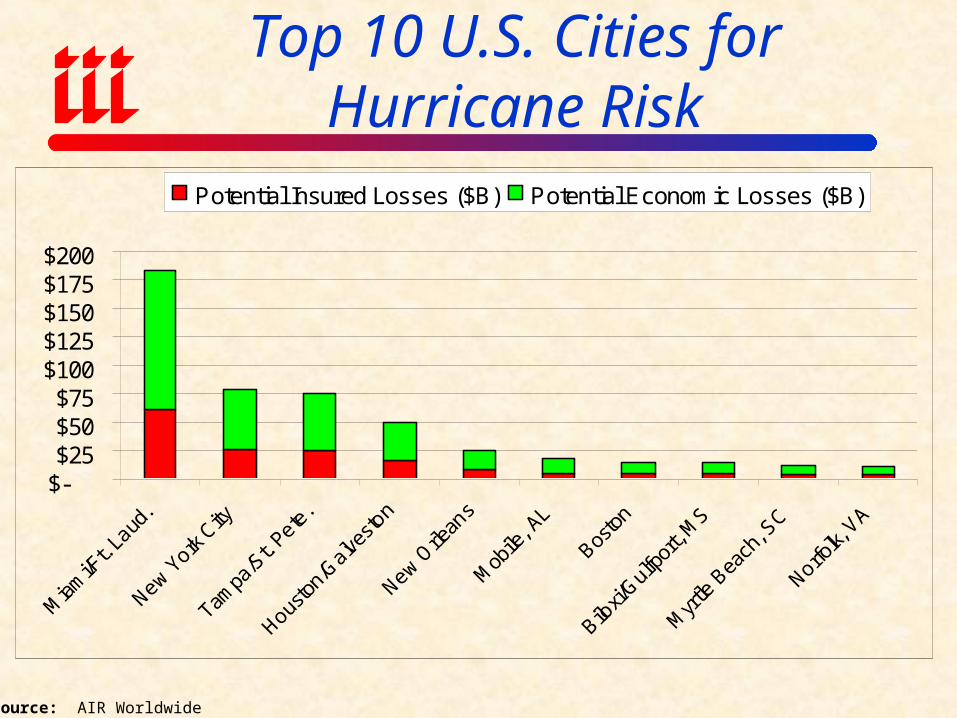
Top 10 U.S. Cities for Hurricane Risk
$-$25$50$75
$100$125$150$175$200
Potential Insured Losses ($B) Potential Economic Losses ($B)
Source: AIR Worldwide
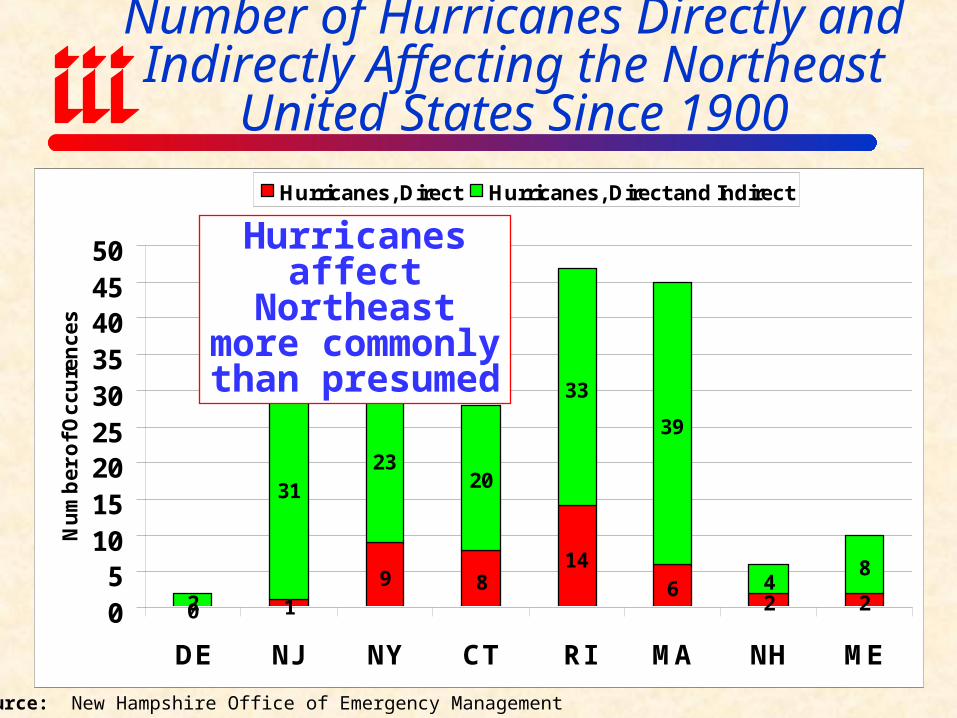
Number of Hurricanes Directly and Indirectly Affecting the Northeast
United States Since 1900
0 19 8
146
2 22
3123
20
33
39
48
05
101520253035404550
DE NJ NY CT RI MA NH ME
Nu
mb
er
of
Oc
cu
ren
ce
s
Hurricanes, Direct Hurricanes, Direct and Indirect
Source: New Hampshire Office of Emergency Management
Hurricanes affect Northeast more commonly than
presumed
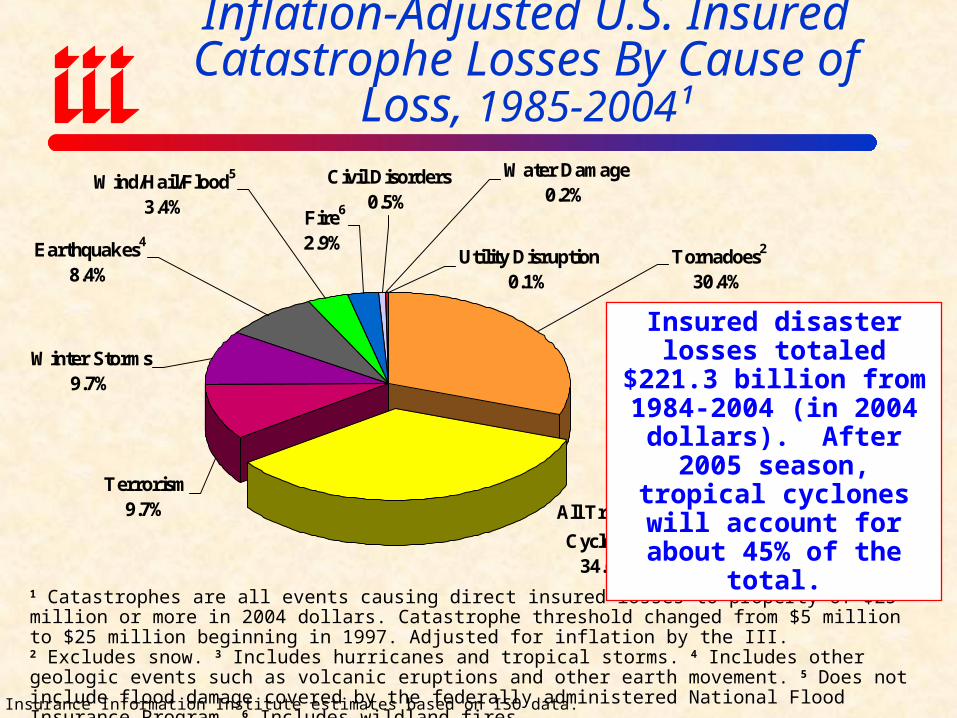
Inflation-Adjusted U.S. Insured Catastrophe Losses By Cause of Loss,
1985-2004¹
Utility Disruption0.1%
Terrorism9.7% All Tropical
Cyclones3
34.6%
Tornadoes2
30.4%
Water Damage0.2%
Civil Disorders0.5%
Fire6
2.9%
Wind/Hail/Flood5
3.4%
Earthquakes4
8.4%
Winter Storms9.7%
Source: Insurance Information Institute estimates based on ISO data.
1 Catastrophes are all events causing direct insured losses to property of $25 million or more in 2004 dollars. Catastrophe threshold changed from $5 million to $25 million beginning in 1997. Adjusted for inflation by the III.2 Excludes snow. 3 Includes hurricanes and tropical storms. 4 Includes other geologic events such as volcanic eruptions and other earth movement. 5 Does not include flood damage covered by the federally administered National Flood Insurance Program. 6 Includes wildland fires.
Insured disaster losses totaled $221.3 billion from
1984-2004 (in 2004 dollars). After 2005 season, tropical
cyclones will account for about 45% of the total.
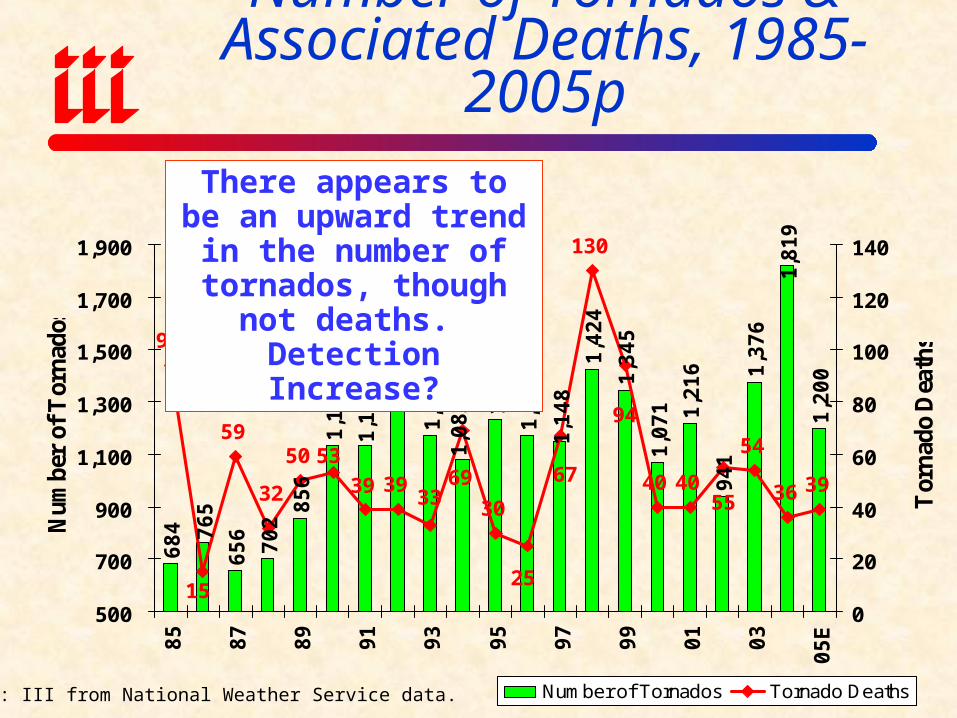
Number of Tornados & Associated Deaths, 1985-2005p
68
4
65
6
70
2
85
6
1,1
33 1,2
97
1,1
73
1,2
34
1,1
73
1,4
24
1,3
45
1,0
71 1,2
16
94
1
1,3
76
1,8
19
1,2
00
76
5
1,1
32
1,1
48
1,0
82
94
5950
3930
130
40 40
54
36 3953
15
69 67
94
5532 3933
25
500
700
900
1,100
1,300
1,500
1,700
1,900
85
87
89
91
93
95
97
99
01
03
05
E
Nu
mb
er o
f T
orn
ados
0
20
40
60
80
100
120
140
Tor
nad
o D
eath
s
Number of Tornados Tornado DeathsSource: III from National Weather Service data.
There appears to be an upward trend in the number of tornados, though not deaths. Detection Increase?
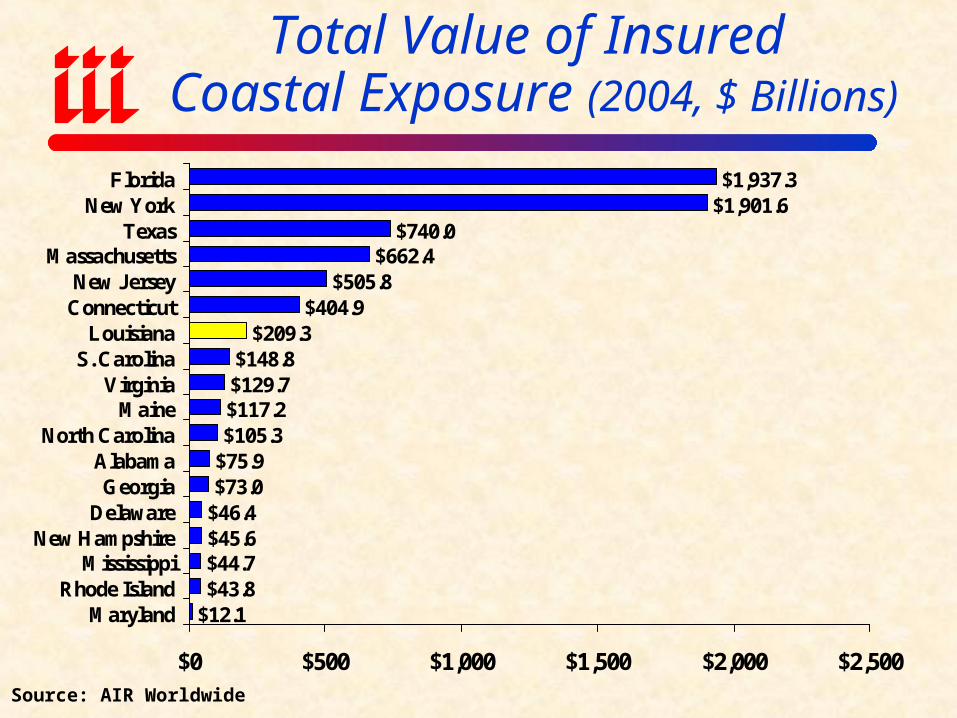
Total Value of Insured Coastal Exposure (2004, $ Billions)
$1,901.6$740.0
$662.4$505.8
$404.9$209.3
$148.8$129.7$117.2$105.3
$75.9$73.0
$46.4$45.6$44.7$43.8
$12.1
$1,937.3
$0 $500 $1,000 $1,500 $2,000 $2,500
FloridaNew York
TexasMassachusetts
New JerseyConnecticut
LouisianaS. Carolina
VirginiaMaine
North CarolinaAlabamaGeorgia
DelawareNew Hampshire
MississippiRhode Island
Maryland
Source: AIR Worldwide
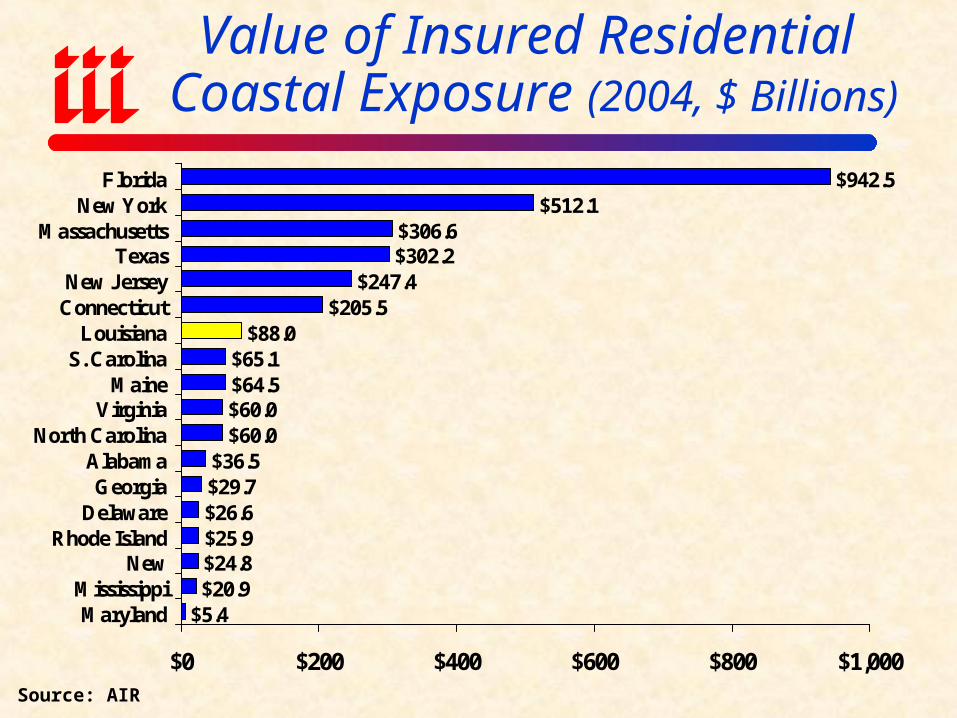
Value of Insured Residential Coastal Exposure (2004, $ Billions)
$512.1$306.6$302.2
$247.4$205.5
$88.0$65.1$64.5$60.0$60.0
$36.5$29.7$26.6$25.9$24.8$20.9
$5.4
$942.5
$0 $200 $400 $600 $800 $1,000
FloridaNew York
MassachusettsTexas
New JerseyConnecticut
LouisianaS. Carolina
MaineVirginia
North CarolinaAlabamaGeorgia
DelawareRhode Island
NewMississippiMaryland
Source: AIR
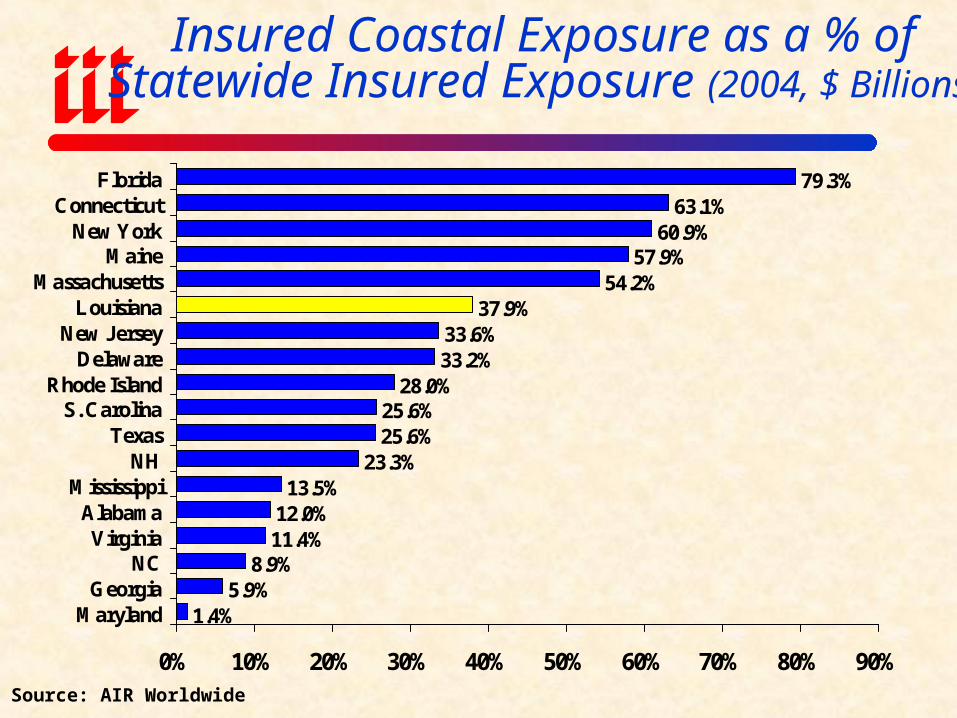
Insured Coastal Exposure as a % of Statewide Insured Exposure (2004, $ Billions)
63.1%60.9%
57.9%54.2%
37.9%33.6%33.2%
28.0%25.6%25.6%
23.3%13.5%
12.0%11.4%
8.9%5.9%
1.4%
79.3%
0% 10% 20% 30% 40% 50% 60% 70% 80% 90%
FloridaConnecticut
New YorkMaine
MassachusettsLouisiana
New JerseyDelaware
Rhode IslandS. Carolina
TexasNH
MississippiAlabamaVirginia
NCGeorgia
Maryland
Source: AIR Worldwide

The 2006 Hurricane Season:
Preview to Disaster?
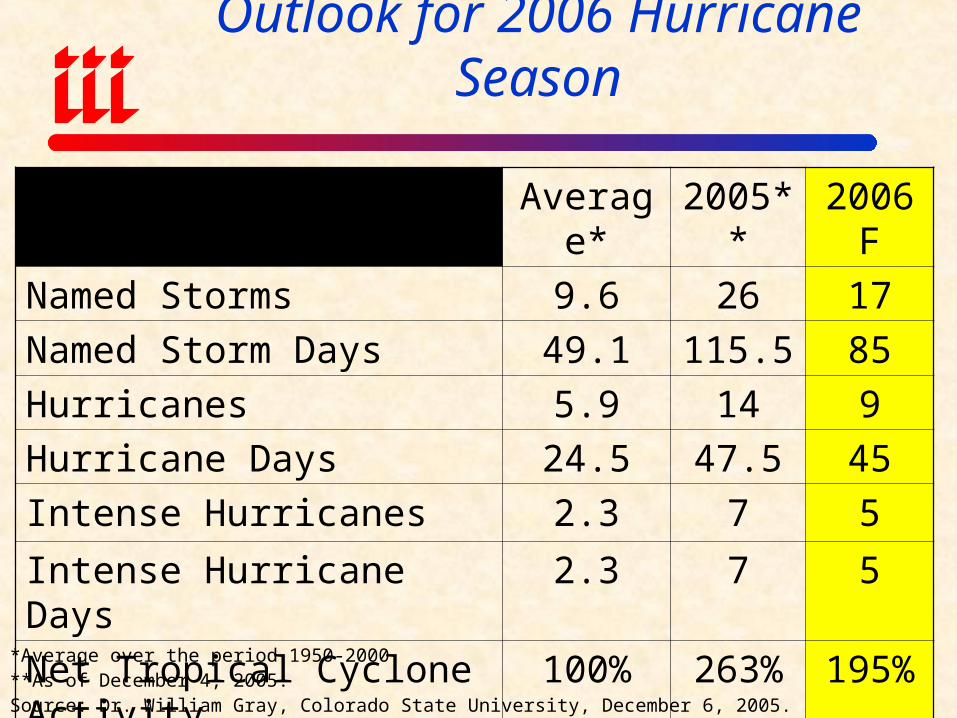
Outlook for 2006 Hurricane Season
Average* 2005** 2006F
Named Storms 9.6 26 17
Named Storm Days 49.1 115.5 85
Hurricanes 5.9 14 9
Hurricane Days 24.5 47.5 45
Intense Hurricanes 2.3 7 5
Intense Hurricane Days 2.3 7 5
Net Tropical Cyclone Activity 100% 263% 195%
*Average over the period 1950-2000.**As of December 4, 2005.Source: Dr. William Gray, Colorado State University, December 6, 2005.
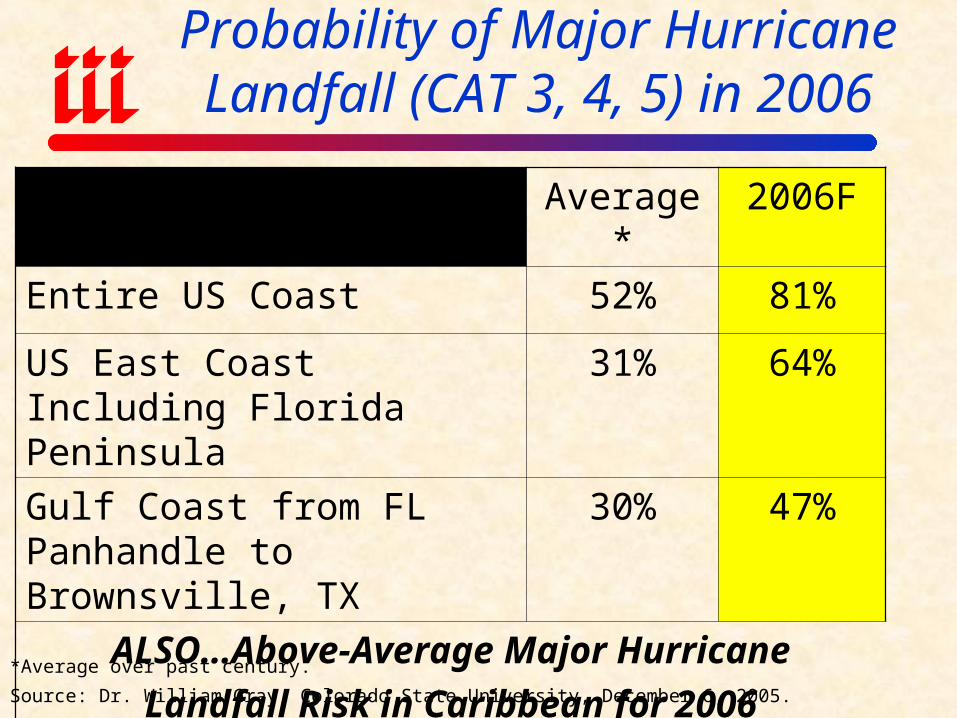
Probability of Major Hurricane Landfall (CAT 3, 4, 5) in 2006
Average* 2006F
Entire US Coast 52% 81%
US East Coast Including Florida Peninsula
31% 64%
Gulf Coast from FL Panhandle to Brownsville, TX
30% 47%
ALSO…Above-Average Major Hurricane
Landfall Risk in Caribbean for 2006
*Average over past century.
Source: Dr. William Gray, Colorado State University, December 6, 2005.

Hurricanes Katrina, Rita & Wilma:
Their Place in History
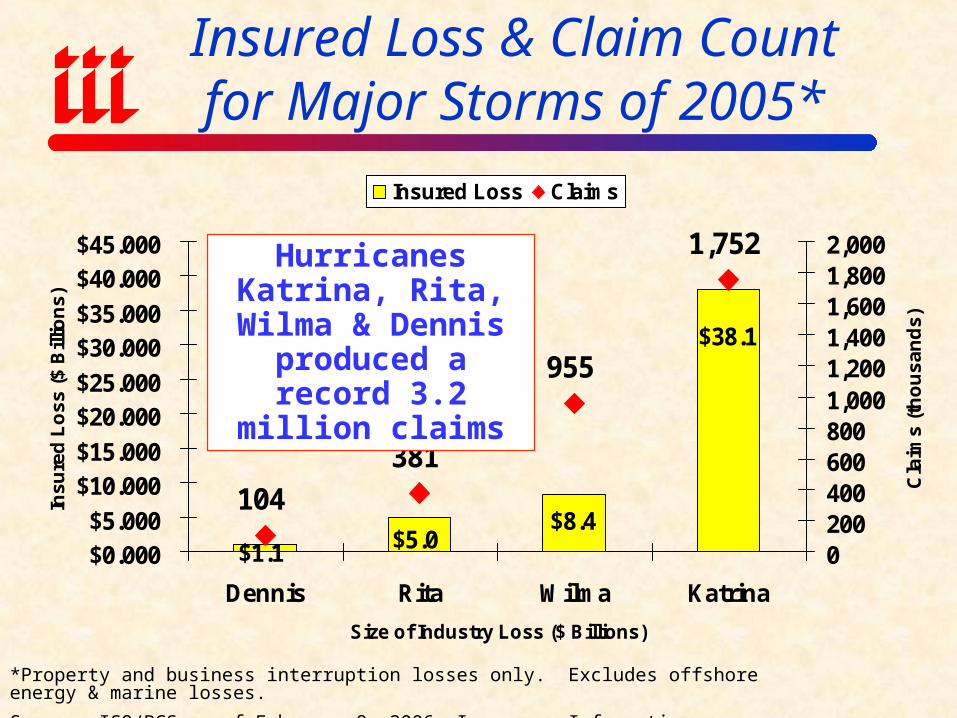
Insured Loss & Claim Count for Major Storms of 2005*
$1.1
$38.1
$8.4$5.0
104
381
955
1,752
$0.000$5.000
$10.000$15.000
$20.000$25.000
$30.000$35.000
$40.000$45.000
Dennis Rita Wilma Katrina
Size of Industry Loss ($ Billions)
Ins
ure
d L
os
s (
$ B
illio
ns
)
02004006008001,0001,2001,4001,6001,8002,000
Cla
ims
(th
ou
sa
nd
s)
Insured Loss Claims
*Property and business interruption losses only. Excludes offshore energy & marine losses.
Source: ISO/PCS as of February 8, 2006; Insurance Information Institute.
Hurricanes Katrina, Rita, Wilma & Dennis produced a record 3.2
million claims
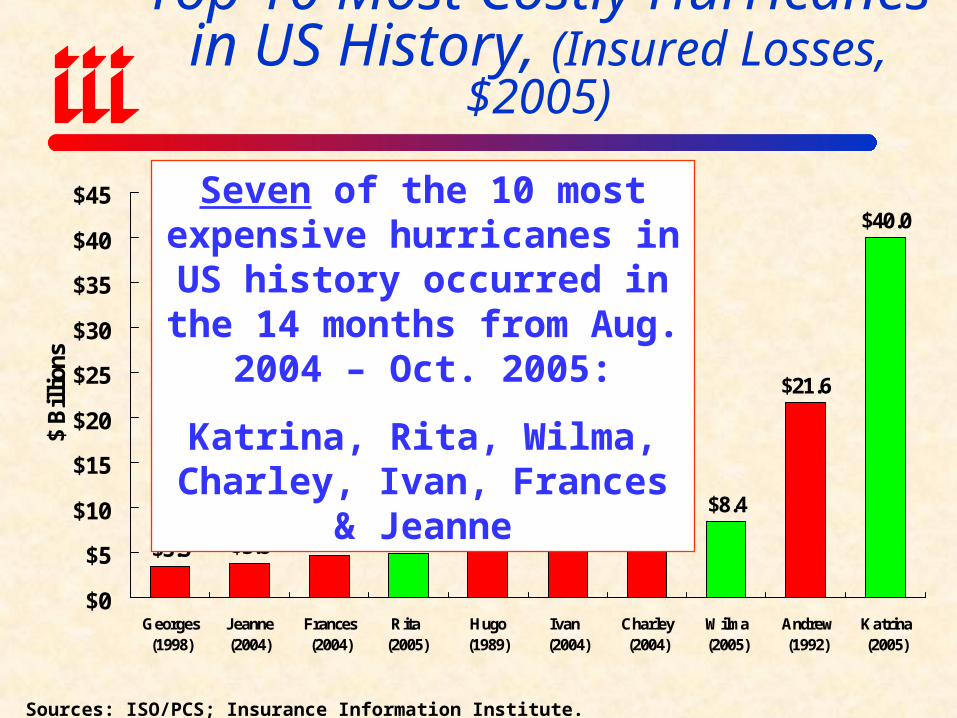
Top 10 Most Costly Hurricanes in US History, (Insured Losses, $2005)
$3.5 $3.8 $4.8 $5.0$6.6 $7.4 $7.7 $8.4
$21.6
$40.0
$0
$5
$10
$15
$20
$25
$30
$35
$40
$45
Georges(1998)
Jeanne(2004)
Frances(2004)
Rita (2005)
Hugo(1989)
Ivan (2004)
Charley(2004)
Wilma(2005)
Andrew(1992)
Katrina(2005)
$ B
illi
ons
Sources: ISO/PCS; Insurance Information Institute.
Seven of the 10 most expensive hurricanes in US history
occurred in the 14 months from Aug. 2004 – Oct. 2005:
Katrina, Rita, Wilma, Charley, Ivan, Frances & Jeanne
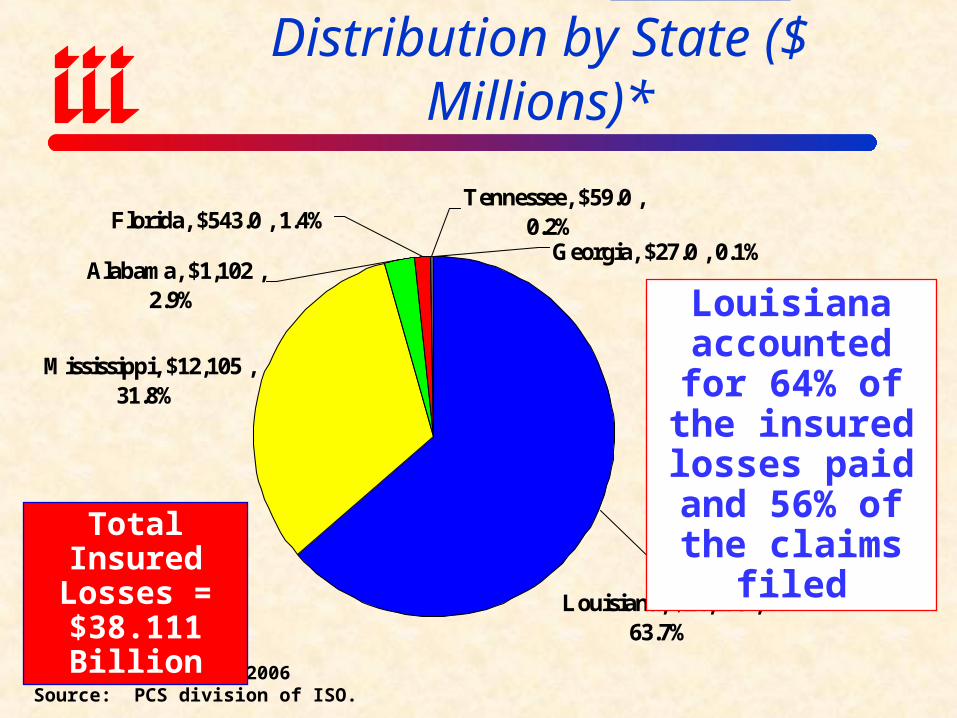
Hurricane Katrina Insured Loss Distribution by State ($ Millions)*
Mississippi, $12,105 , 31.8%
Louisiana, $24,275 , 63.7%
Tennessee, $59.0 , 0.2%Florida, $543.0 , 1.4%
Georgia, $27.0 , 0.1%Alabama, $1,102 ,
2.9%
*As of February 8, 2006Source: PCS division of ISO.
Louisiana accounted for
64% of the insured losses
paid and 56% of the claims filed
Total Insured Losses =
$38.111 Billion
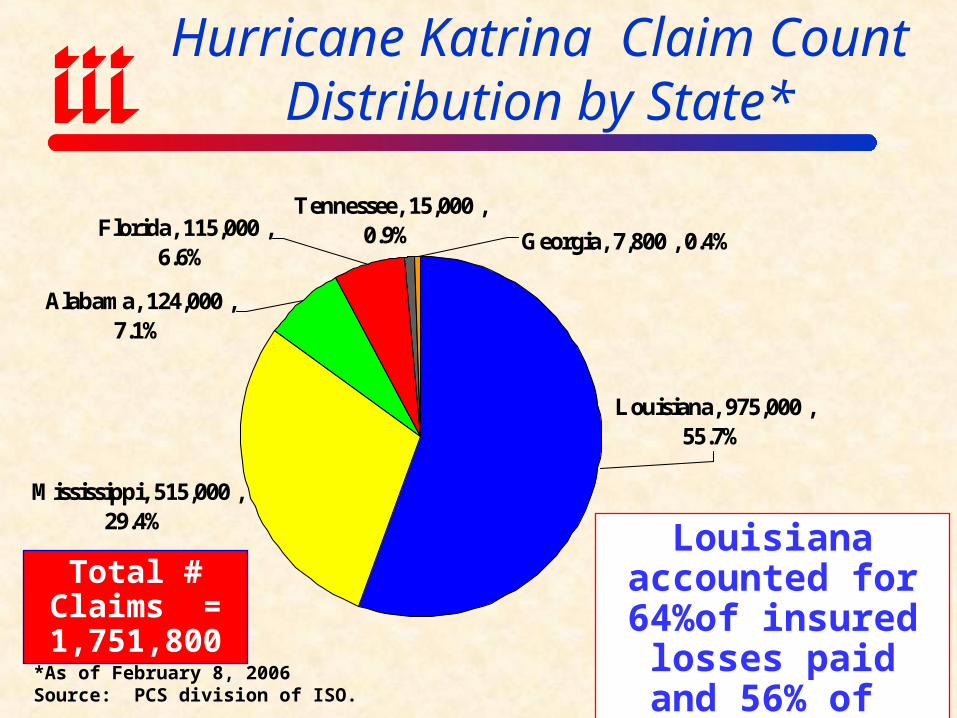
Hurricane Katrina Claim Count Distribution by State*
Mississippi, 515,000 , 29.4%
Tennessee, 15,000 , 0.9%
Louisiana, 975,000 , 55.7%
Florida, 115,000 , 6.6%
Georgia, 7,800 , 0.4%
Alabama, 124,000 , 7.1%
*As of February 8, 2006Source: PCS division of ISO.
Louisiana accounted for 64%of insured
losses paid and 56% of claims filed
Total # Claims = 1,751,800
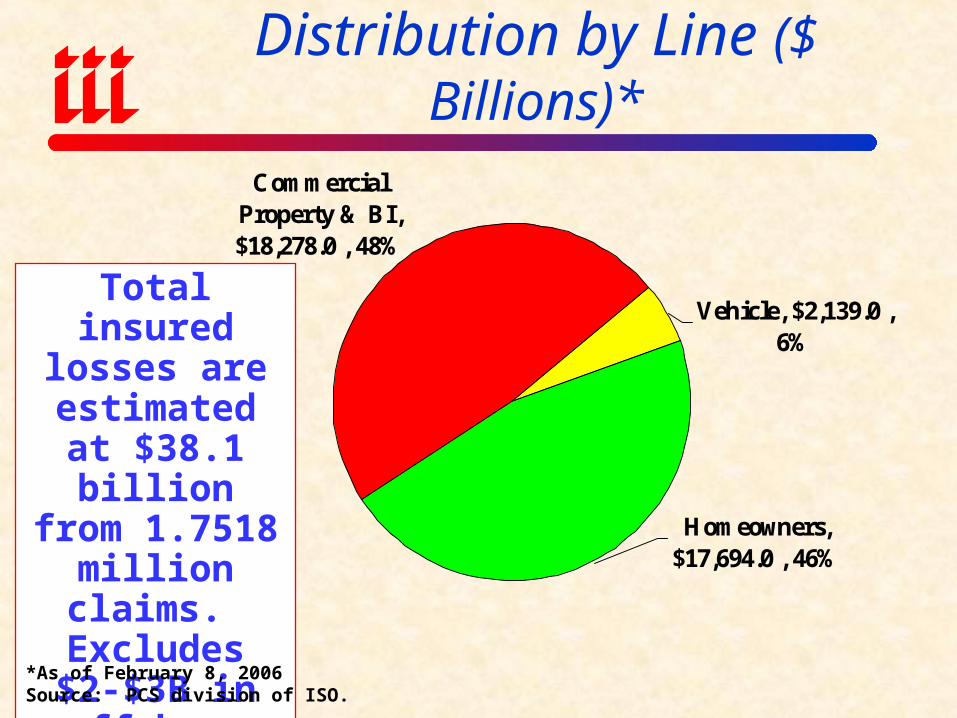
Hurricane Katrina Loss Distribution by Line ($ Billions)*
Homeowners, $17,694.0 , 46%
Commercial Property & BI, $18,278.0 , 48%
Vehicle, $2,139.0 , 6%
Total insured losses are
estimated at $38.1 billion from 1.7518
million claims. Excludes $2-
$3B in offshore energy losses
*As of February 8, 2006Source: PCS division of ISO.
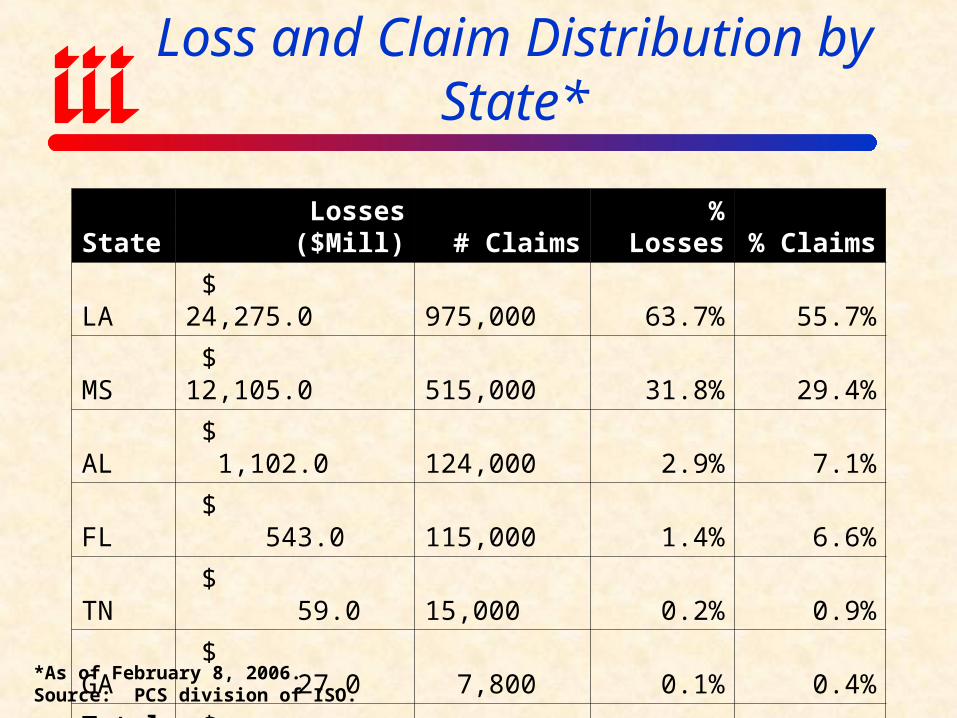
Hurricane Katrina Insured Loss and Claim Distribution by State*
State Losses ($Mill) # Claims % Losses % Claims
LA $ 24,275.0 975,000 63.7% 55.7%
MS $ 12,105.0 515,000 31.8% 29.4%
AL $ 1,102.0 124,000 2.9% 7.1%
FL $ 543.0 115,000 1.4% 6.6%
TN $ 59.0 15,000 0.2% 0.9%
GA $ 27.0 7,800 0.1% 0.4%
Totals $ 38,111.0 1,751,800 100.0% 100.0%
*As of February 8, 2006.Source: PCS division of ISO.
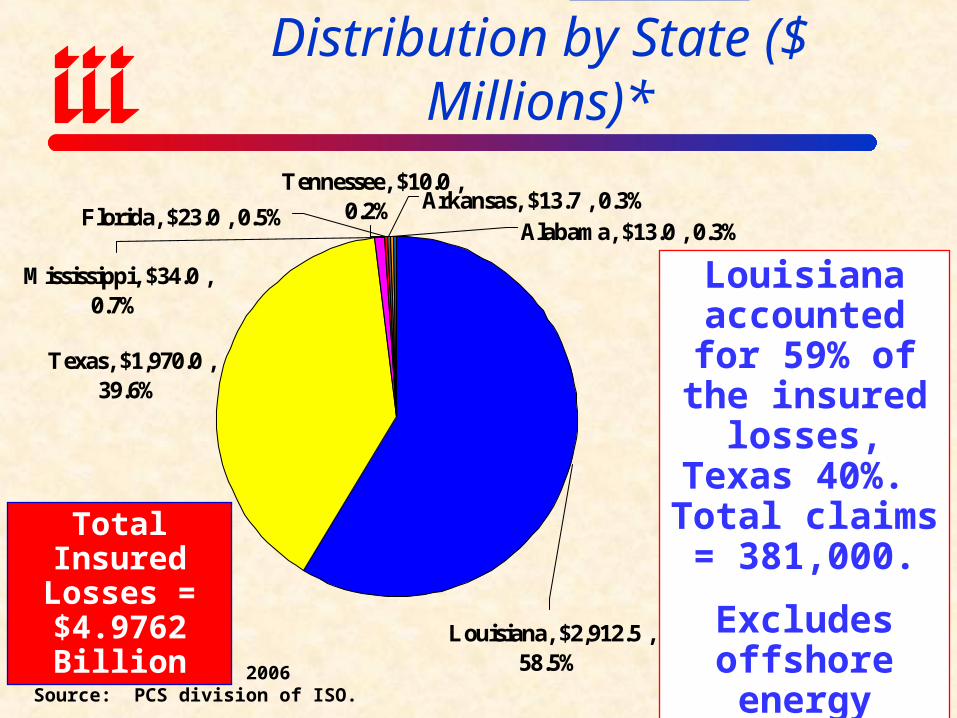
Hurricane Rita Insured Loss Distribution by State ($ Millions)*
Texas, $1,970.0 , 39.6%
Tennessee, $10.0 , 0.2%
Louisiana, $2,912.5 , 58.5%
Arkansas, $13.7 , 0.3%Florida, $23.0 , 0.5%
Alabama, $13.0 , 0.3%
Mississippi, $34.0 , 0.7%
*As of February 8, 2006Source: PCS division of ISO.
Louisiana accounted for
59% of the insured losses, Texas 40%.
Total claims = 381,000.
Excludes offshore energy losses of $2-3B
Total Insured Losses =
$4.9762 Billion
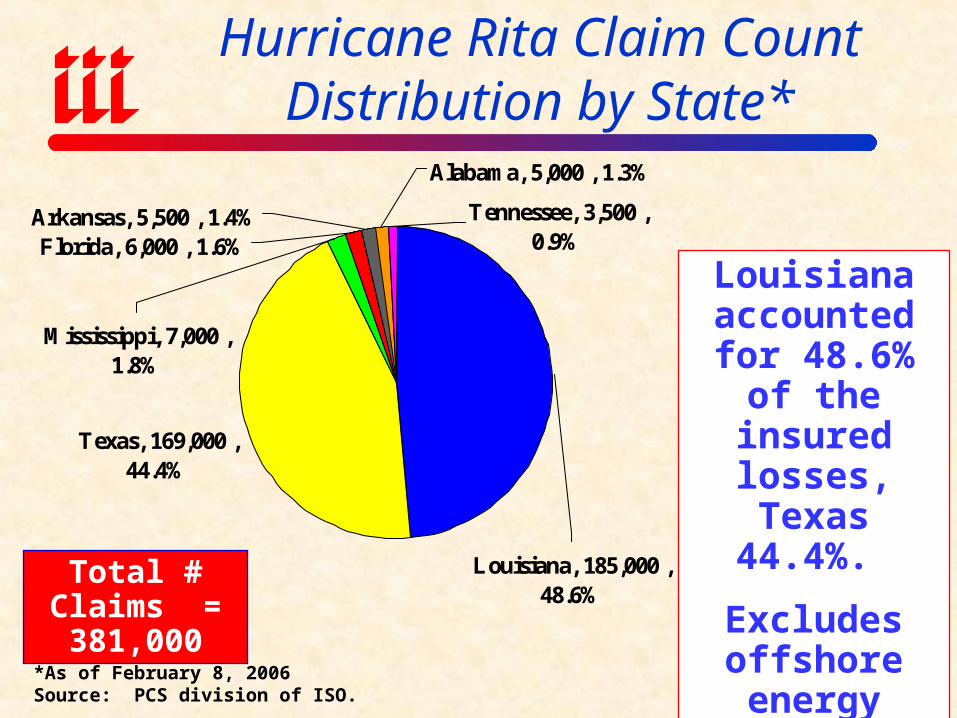
Hurricane Rita Claim Count Distribution by State*
Texas, 169,000 , 44.4%
Tennessee, 3,500 , 0.9%
Louisiana, 185,000 , 48.6%
Arkansas, 5,500 , 1.4%Florida, 6,000 , 1.6%
Alabama, 5,000 , 1.3%
Mississippi, 7,000 , 1.8%
*As of February 8, 2006Source: PCS division of ISO.
Louisiana accounted for 48.6% of the
insured losses, Texas 44.4%.
Excludes offshore energy losses of $2-3BTotal # Claims
= 381,000
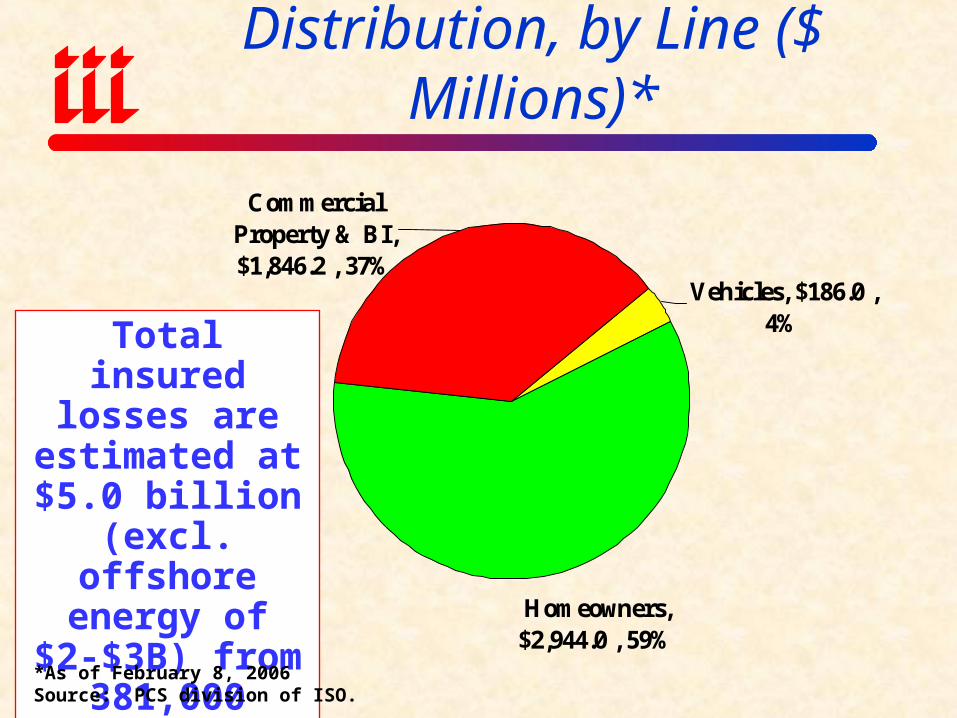
Hurricane Rita Loss Distribution, by Line ($ Millions)*
Homeowners, $2,944.0 , 59%
Commercial Property & BI, $1,846.2 , 37%
Vehicles, $186.0 , 4%Total insured
losses are estimated at $5.0
billion (excl. offshore energy of $2-$3B) from 381,000 claims.
*As of February 8, 2006Source: PCS division of ISO.
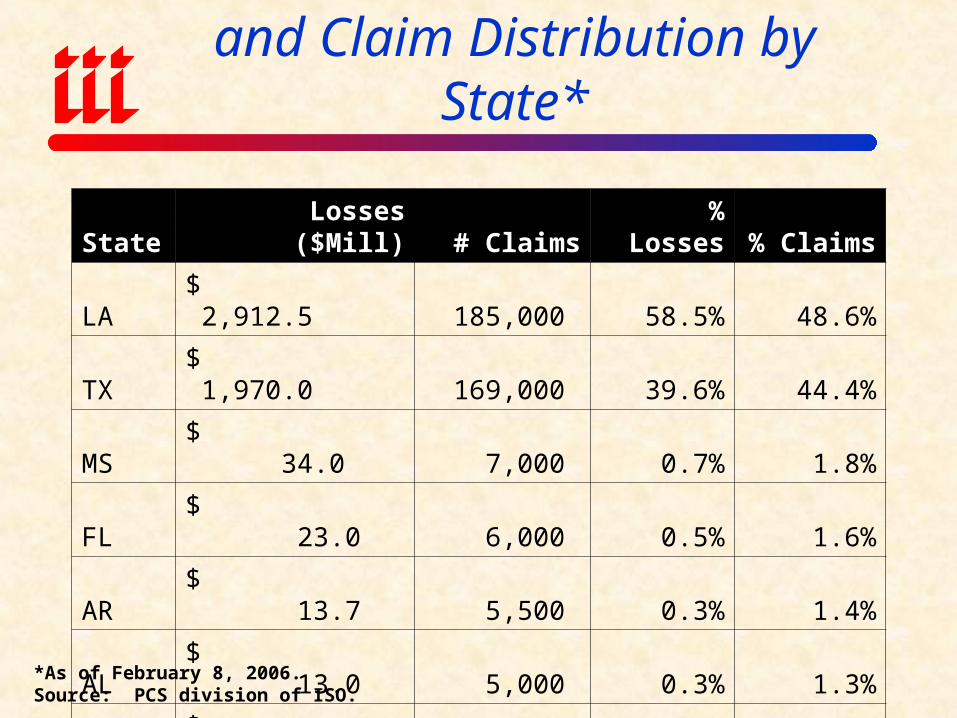
Hurricane Rita Insured Loss and Claim Distribution by State*
State Losses ($Mill) # Claims % Losses % Claims
LA $ 2,912.5 185,000 58.5% 48.6%
TX $ 1,970.0 169,000 39.6% 44.4%
MS $ 34.0 7,000 0.7% 1.8%
FL $ 23.0 6,000 0.5% 1.6%
AR $ 13.7 5,500 0.3% 1.4%
AL $ 13.0 5,000 0.3% 1.3%
TN $ 10.0 3,500 0.2% 0.9%
Totals $ 4,976.2 381,000 100.0% 100.0%
*As of February 8, 2006.Source: PCS division of ISO.
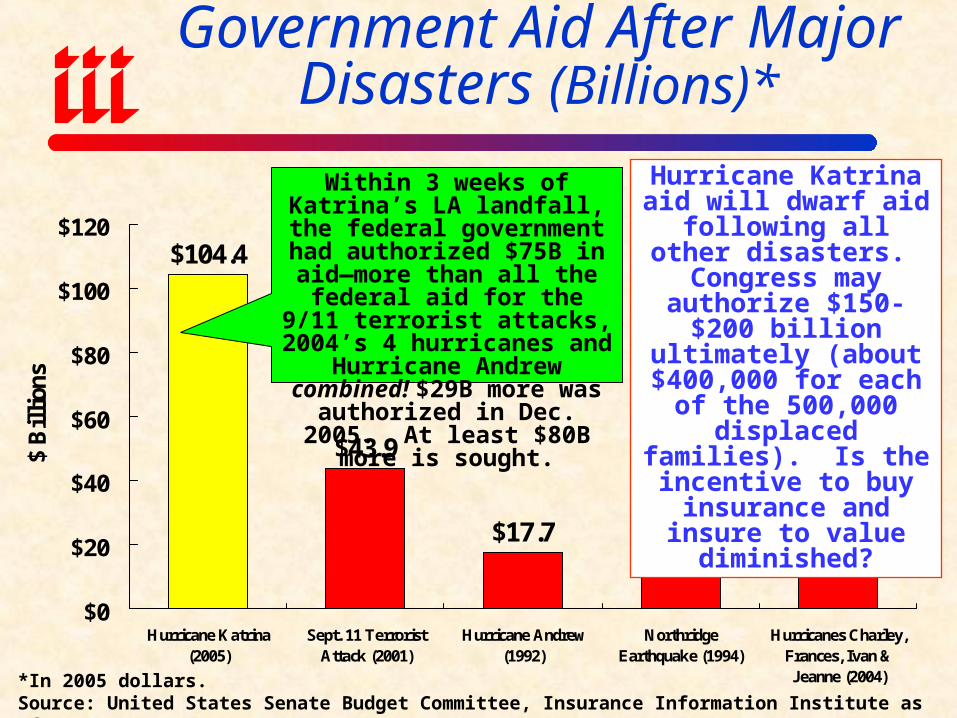
Government Aid After Major Disasters (Billions)*
$104.4
$43.9
$17.7 $15.5 $15.0
$0
$20
$40
$60
$80
$100
$120
Hurricane Katrina(2005)
Sept. 11 TerroristAttack (2001)
Hurricane Andrew(1992)
NorthridgeEarthquake (1994)
Hurricanes Charley,Frances, Ivan &Jeanne (2004)
$ B
illi
ons
*In 2005 dollars.Source: United States Senate Budget Committee, Insurance Information Institute as of 12/31/05.
Hurricane Katrina aid will dwarf aid following
all other disasters. Congress may authorize
$150-$200 billion ultimately (about
$400,000 for each of the 500,000 displaced
families). Is the incentive to buy insurance and
insure to value diminished?
Within 3 weeks of Katrina’s LA landfall, the federal government
had authorized $75B in aid—more than all the federal aid for the 9/11 terrorist attacks, 2004’s
4 hurricanes and Hurricane Andrew combined! $29B more
was authorized in Dec. 2005. At least $80B more is sought.
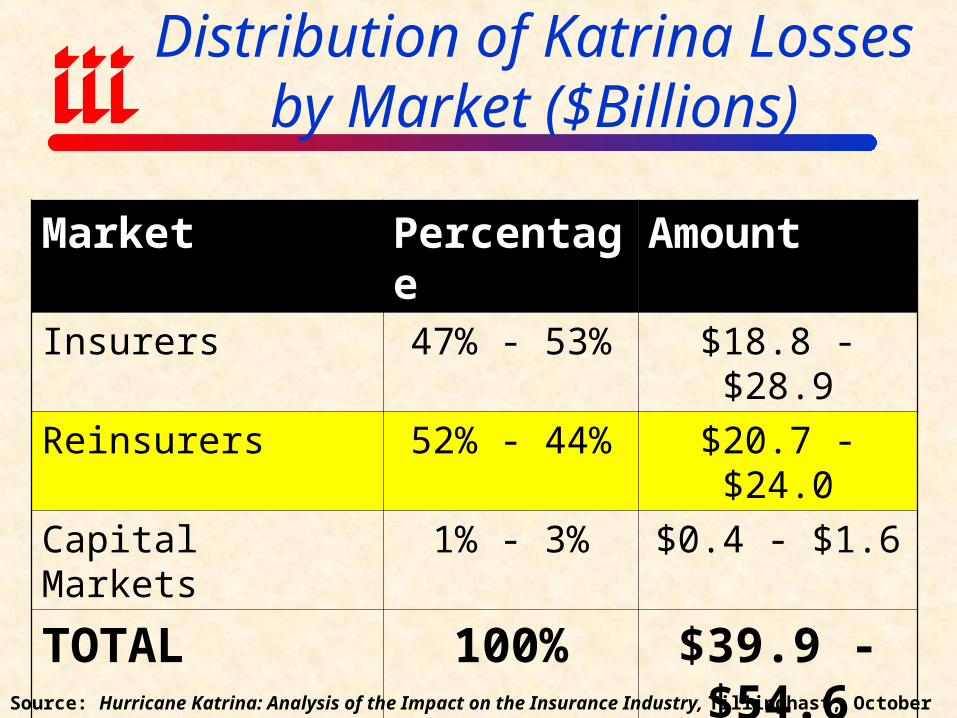
Distribution of Katrina Losses by Market ($Billions)
Market Percentage Amount
Insurers 47% - 53% $18.8 - $28.9
Reinsurers 52% - 44% $20.7 - $24.0
Capital Markets 1% - 3% $0.4 - $1.6
TOTAL 100% $39.9 - $54.6
Source: Hurricane Katrina: Analysis of the Impact on the Insurance Industry, Tillinghast, October 2005.
Overview of Plans for a National
Catastrophe Insurance Plan
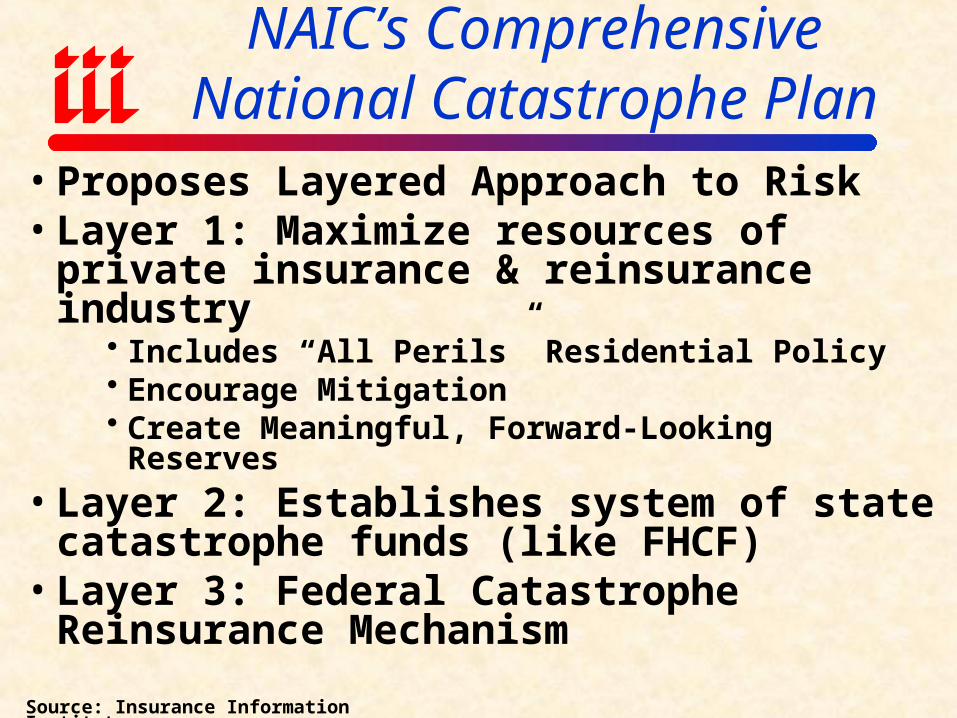
NAIC’s Comprehensive National Catastrophe Plan
• Proposes Layered Approach to Risk• Layer 1: Maximize resources of private
insurance & reinsurance industry Includes “All Perils” Residential Policy Encourage Mitigation Create Meaningful, Forward-Looking Reserves
• Layer 2: Establishes system of state catastrophe funds (like FHCF)
• Layer 3: Federal Catastrophe Reinsurance Mechanism
Source: Insurance Information Institute
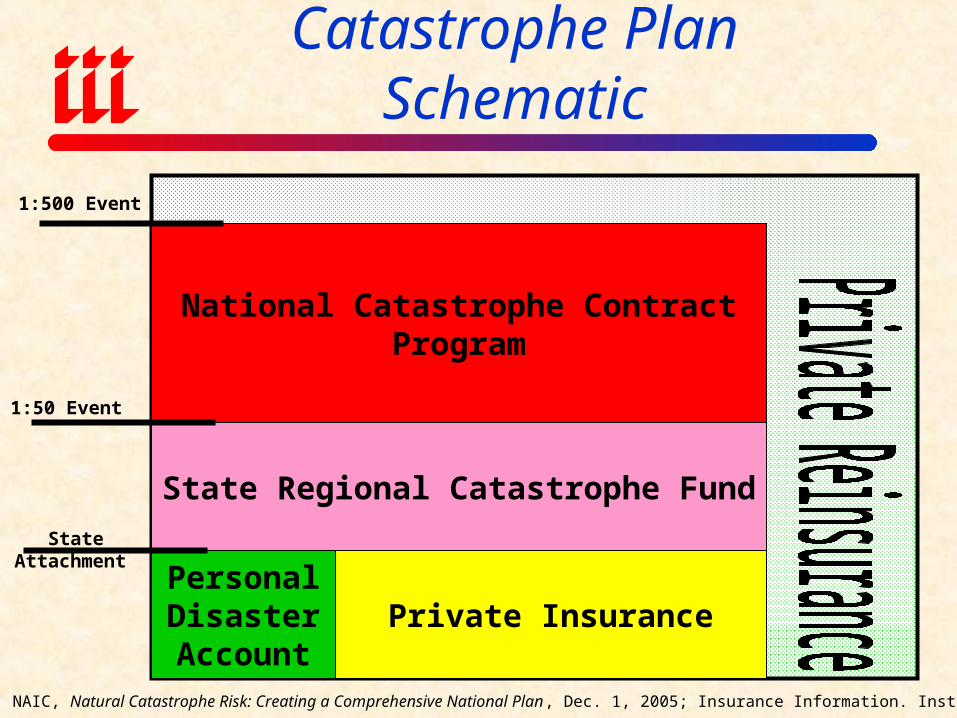
Comprehensive National Catastrophe Plan Schematic
Personal Disaster Account
Private Insurance
State Regional Catastrophe Fund
National Catastrophe Contract Program
Source: NAIC, Natural Catastrophe Risk: Creating a Comprehensive National Plan, Dec. 1, 2005; Insurance Information. Inst.
State Attachment
1:50 Event
1:500 Event
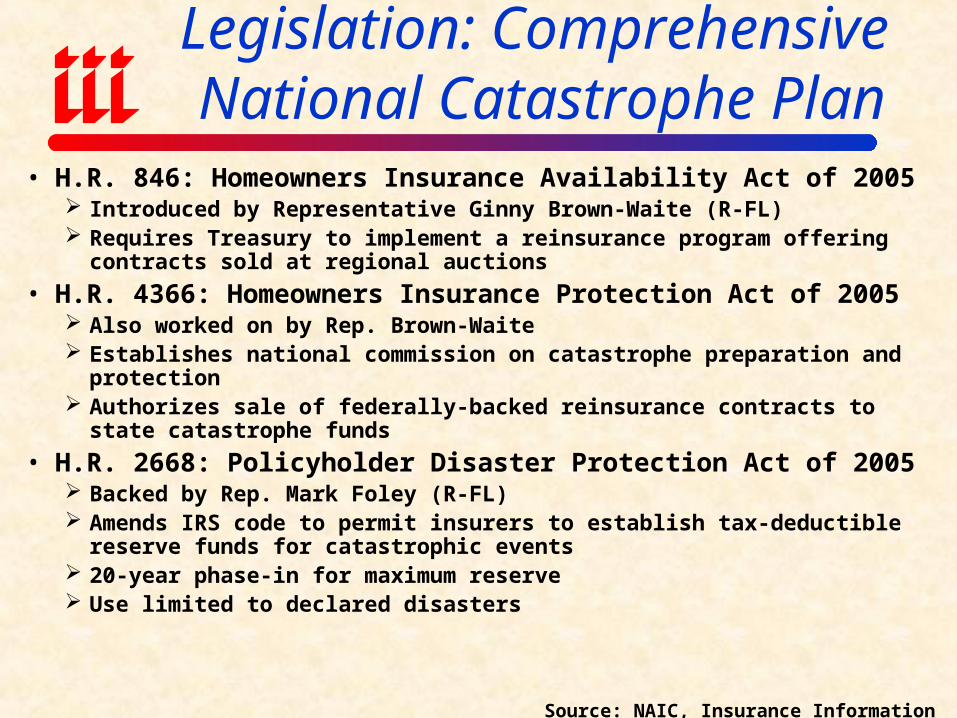
Legislation: Comprehensive National Catastrophe Plan
• H.R. 846: Homeowners Insurance Availability Act of 2005 Introduced by Representative Ginny Brown-Waite (R-FL) Requires Treasury to implement a reinsurance program offering contracts
sold at regional auctions
• H.R. 4366: Homeowners Insurance Protection Act of 2005 Also worked on by Rep. Brown-Waite Establishes national commission on catastrophe preparation and protection Authorizes sale of federally-backed reinsurance contracts to state catastrophe
funds
• H.R. 2668: Policyholder Disaster Protection Act of 2005 Backed by Rep. Mark Foley (R-FL) Amends IRS code to permit insurers to establish tax-deductible reserve funds
for catastrophic events 20-year phase-in for maximum reserve Use limited to declared disasters
Source: NAIC, Insurance Information Institute

Profit Pillar #2PRICING
Can Discipline be Maintained?
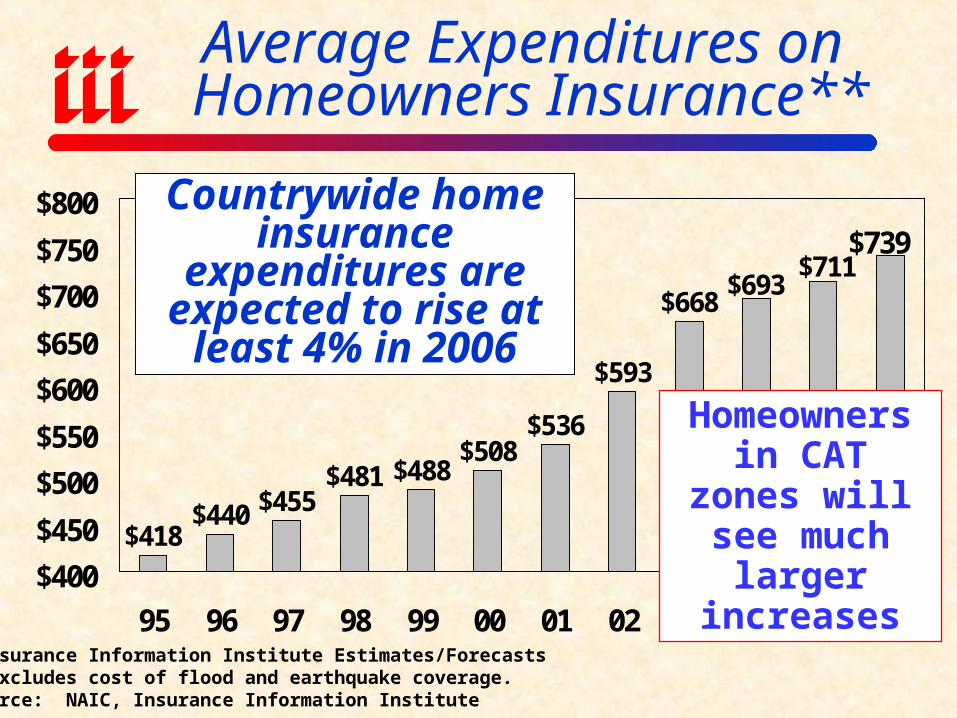
$418$440 $455
$481 $488$508
$536
$593
$668$693
$711$739
$400
$450
$500
$550
$600
$650
$700
$750
$800
95 96 97 98 99 00 01 02 03 04* 05* 06*
Average Expenditures on Homeowners Insurance**
*Insurance Information Institute Estimates/Forecasts**Excludes cost of flood and earthquake coverage.Source: NAIC, Insurance Information Institute
Countrywide home insurance expenditures are expected to rise at
least 4% in 2006
Homeowners in CAT zones will see much larger
increases
$651$668
$691 $705 $703$685 $689
$723
$777
$821
$874$844
$861
$600
$650
$700
$750
$800
$850
$900
$950
94 95 96 97 98 99 00 01 02 03 04* 05* 06*
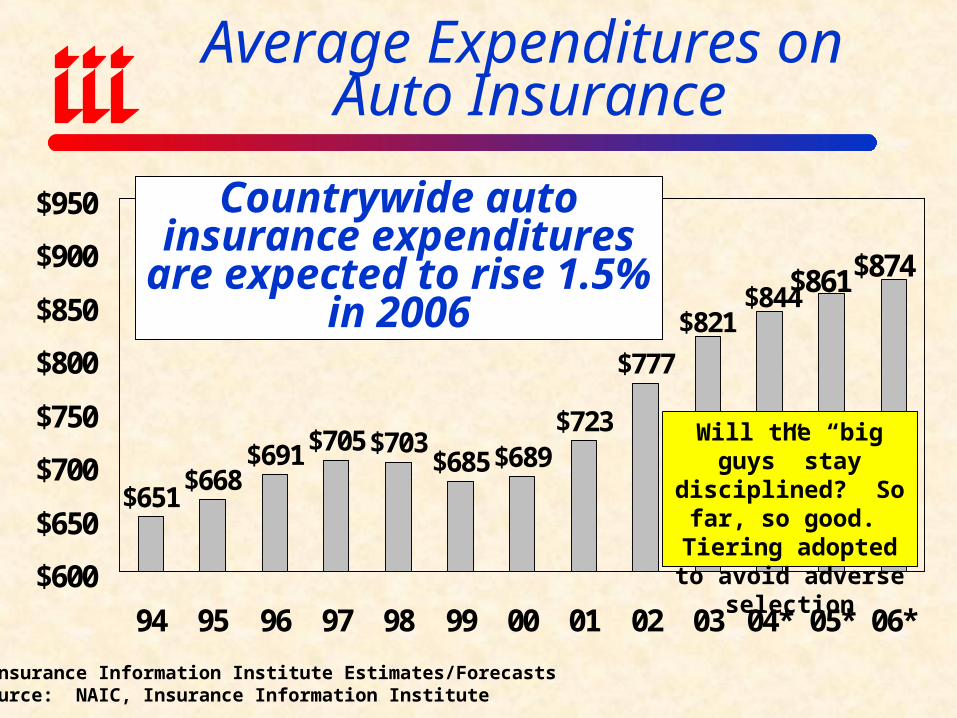
Average Expenditures on Auto Insurance
*Insurance Information Institute Estimates/ForecastsSource: NAIC, Insurance Information Institute
Countrywide auto insurance expenditures are expected to
rise 1.5% in 2006
Will the “big guys” stay disciplined? So far, so good. Tiering
adopted to avoid adverse selection

Profit Pillar #3INVESTMENTS
Does Investment Performance Affect
Discipline?
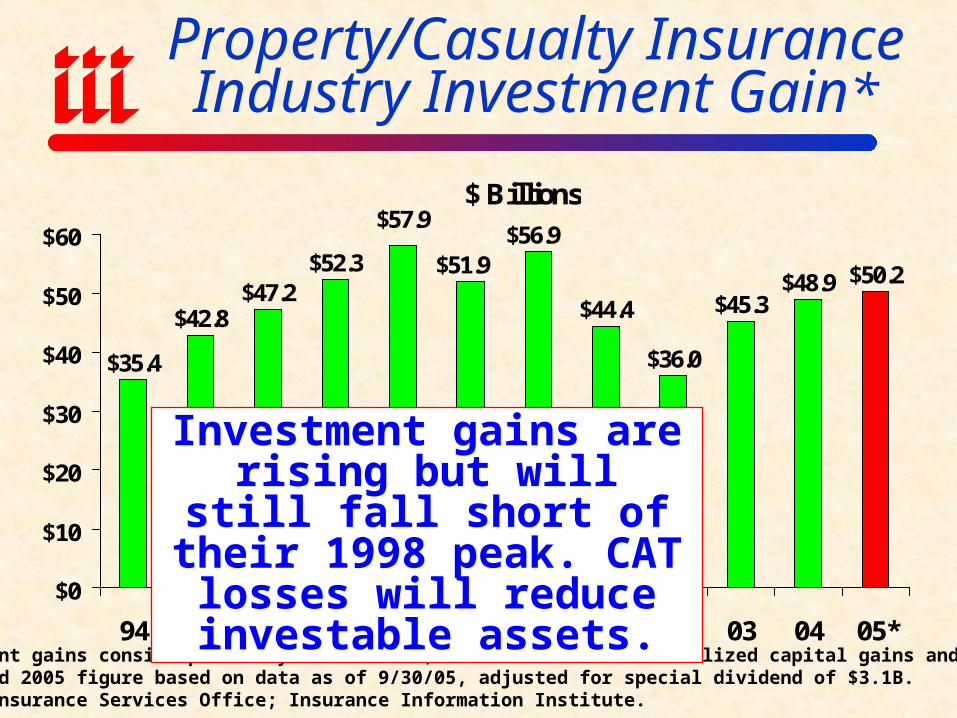
Property/Casualty Insurance Industry Investment Gain*
$ Billions
$35.4
$42.8$47.2
$52.3
$44.4
$36.0
$45.3$48.9 $50.2
$56.9$51.9
$57.9
$0
$10
$20
$30
$40
$50
$60
94 95 96 97 98 99 00 01 02 03 04 05**Investment gains consist primarily of interest, stock dividends and realized capital gains and losses.Annualized 2005 figure based on data as of 9/30/05, adjusted for special dividend of $3.1B.Source: Insurance Services Office; Insurance Information Institute.
Investment gains are rising but will still fall short of
their 1998 peak. CAT losses will reduce investable assets.
Profit Pillar #4EXPENSES
Will Expense Ratio Rise as Premium Growth Slows?
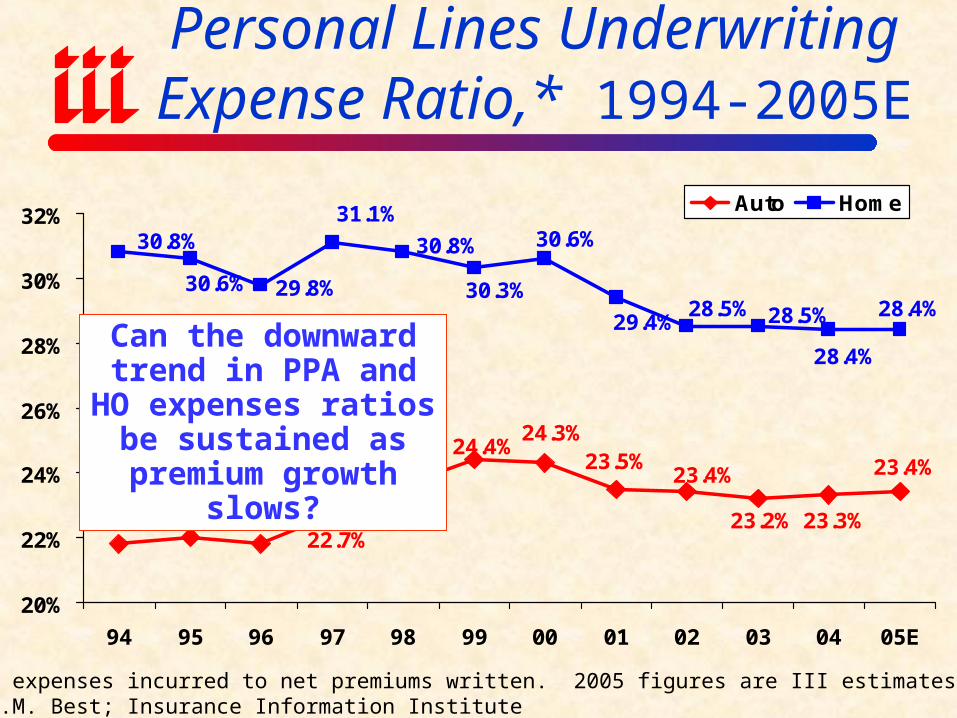
Personal Lines Underwriting Expense Ratio,* 1994-2005E
21.8% 22.0% 21.8%
23.5%
29.8%
24.3%24.4%
23.6%
23.4%
22.7%23.2% 23.3%
23.4%
28.4%
28.4%
28.5%28.5%
30.8%
31.1%30.8%
30.6% 30.3%
30.6%
29.4%
20%
22%
24%
26%
28%
30%
32%
94 95 96 97 98 99 00 01 02 03 04 05E
Auto Home
*Ratio of expenses incurred to net premiums written. 2005 figures are III estimates.Source: A.M. Best; Insurance Information Institute
Can the downward trend in PPA and HO expenses
ratios be sustained as premium growth slows?

Profit Pillar #5LEVERAGE
Can the Industry Efficiently Employ Its Increasing Capital?
$0
$50
$100
$150
$200
$250
$300
$350
$400
$450
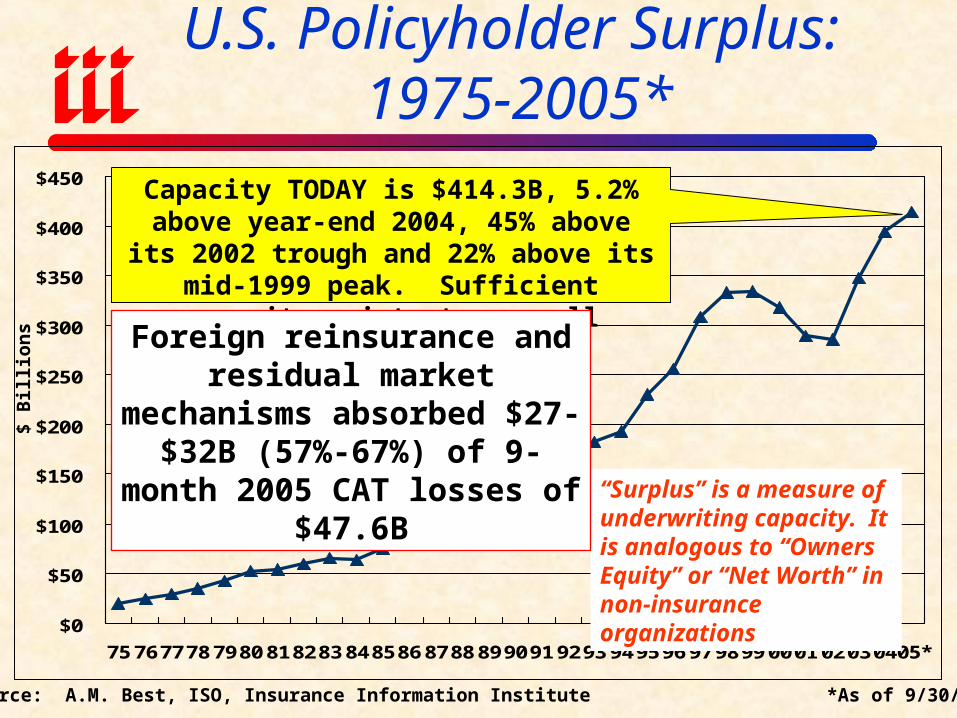
75 767778 7980 818283 848586 8788 899091 9293 949596 979899 0001 02030405*
U.S. Policyholder Surplus: 1975-2005*
Source: A.M. Best, ISO, Insurance Information Institute *As of 9/30/05.
$ B
illi
ons
“Surplus” is a measure of underwriting capacity. It is analogous to “Owners Equity” or “Net Worth” in non-insurance organizations
Capacity TODAY is $414.3B, 5.2% above year-end 2004, 45% above its 2002 trough and
22% above its mid-1999 peak. Sufficient capacity exists to pay all hurricane claims.
Foreign reinsurance and residual market mechanisms absorbed
$27-$32B (57%-67%) of 9-month 2005 CAT losses of $47.6B
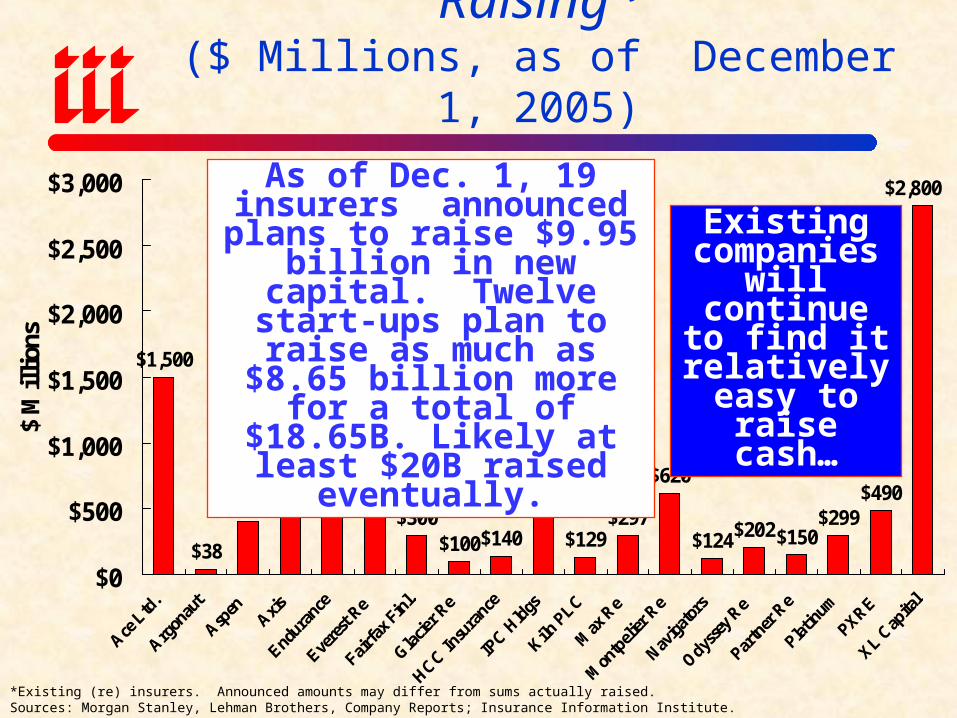
Announced Insurer Capital Raising*($ Millions, as of December 1, 2005)
$1,500
$38
$400$450$600
$710
$300$100$140
$600
$129$297
$620
$124$202$150$299
$490
$2,800
$0
$500
$1,000
$1,500
$2,000
$2,500
$3,000
$ M
illi
ons
*Existing (re) insurers. Announced amounts may differ from sums actually raised. Sources: Morgan Stanley, Lehman Brothers, Company Reports; Insurance Information Institute.
As of Dec. 1, 19 insurers announced plans to raise
$9.95 billion in new capital. Twelve start-ups plan to raise as much as $8.65
billion more for a total of $18.65B. Likely at least $20B
raised eventually.
Existing companies
will continue to find it
relatively easy to raise cash…
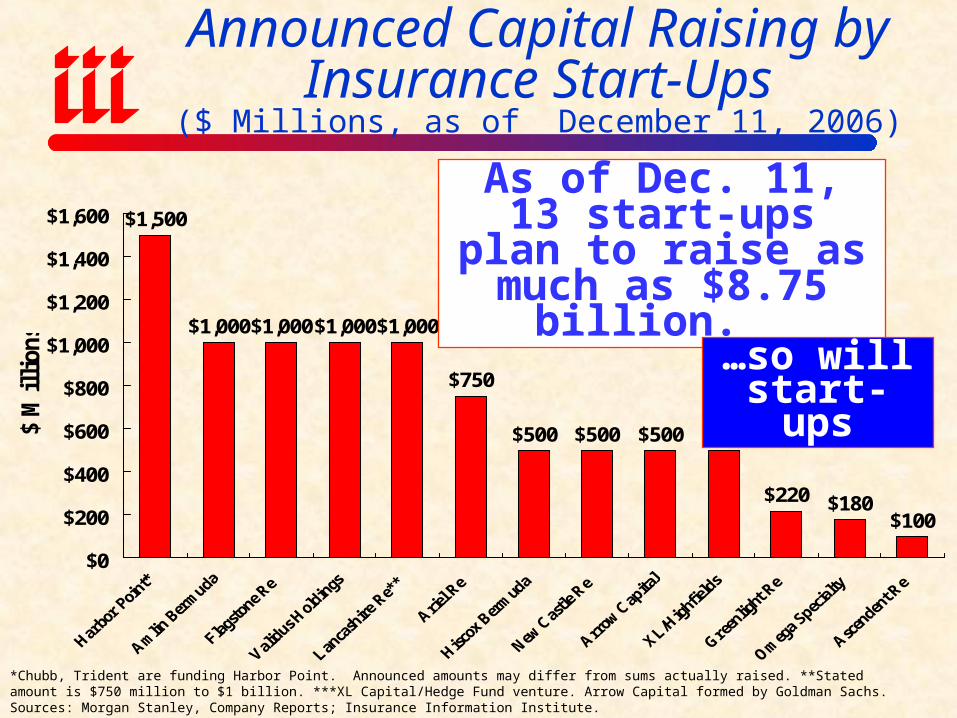
Announced Capital Raising by Insurance Start-Ups
($ Millions, as of December 11, 2006)
$1,500
$1,000$1,000$1,000$1,000
$750
$500 $500 $500 $500
$220 $180$100
$0
$200
$400
$600
$800
$1,000
$1,200
$1,400
$1,600
$ M
illi
ons
*Chubb, Trident are funding Harbor Point. Announced amounts may differ from sums actually raised. **Stated amount is $750 million to $1 billion. ***XL Capital/Hedge Fund venture. Arrow Capital formed by Goldman Sachs.Sources: Morgan Stanley, Company Reports; Insurance Information Institute.
As of Dec. 11, 13 start-ups plan to raise as
much as $8.75 billion.
…so will start-ups

Profit Pillar #6P/C OPERATING ENVIRONMENT
Have Things Changed for the Better?
TORT SYSTEM
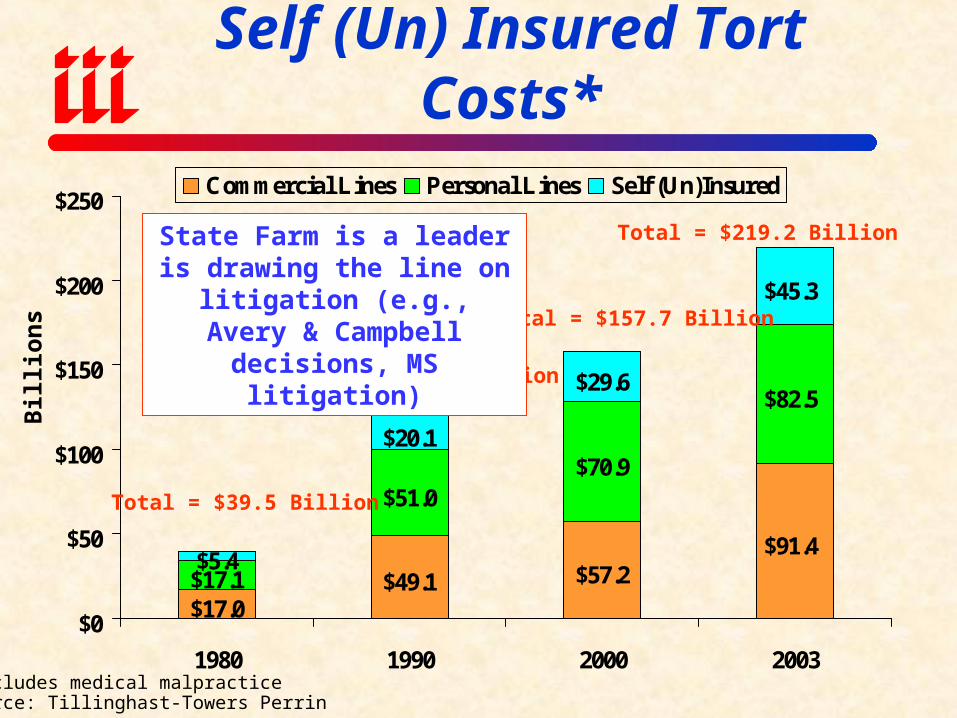
Personal, Commercial & Self (Un) Insured Tort Costs*
$17.0$49.1 $57.2
$91.4
$17.1
$51.0$70.9
$82.5
$5.4
$20.1
$29.6
$45.3
$0
$50
$100
$150
$200
$250
1980 1990 2000 2003
Commercial Lines Personal Lines Self (Un)Insured
Bil
lion
s
Total = $39.5 Billion
*Excludes medical malpracticeSource: Tillinghast-Towers Perrin
Total = $120.2 Billion
Total = $157.7 Billion
Total = $219.2 BillionState Farm is a leader is drawing the line on litigation
(e.g., Avery & Campbell decisions, MS litigation)
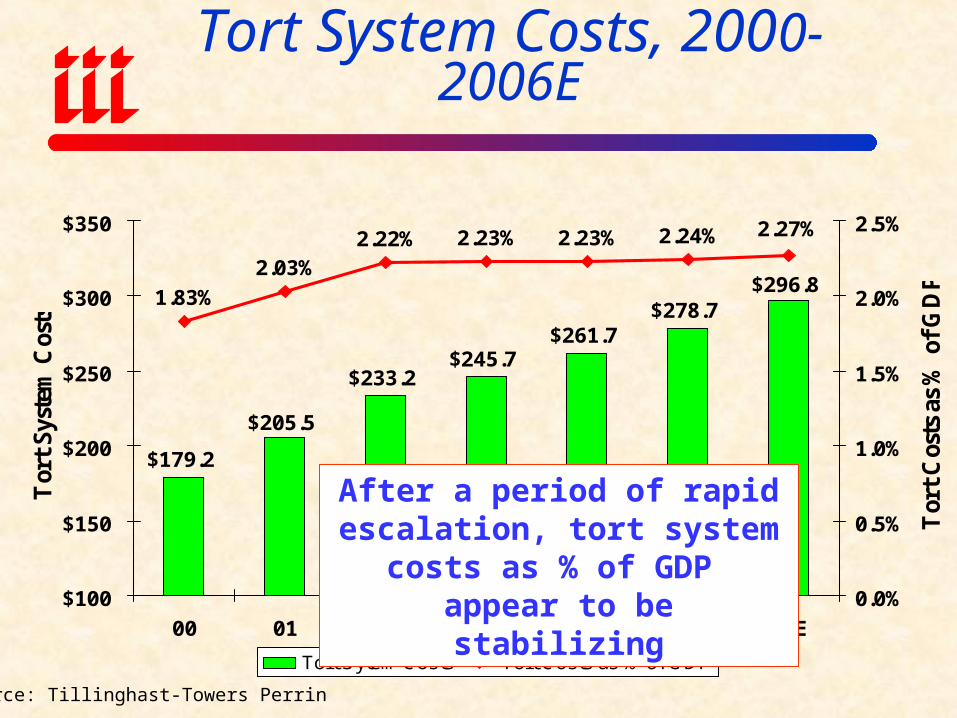
Tort System Costs, 2000-2006E
$179.2
$233.2$245.7
$261.7$278.7
$296.8
$205.5
1.83%
2.03%2.22% 2.23% 2.24% 2.27%2.23%
$100
$150
$200
$250
$300
$350
00 01 02 03 04E 05E 06E
Tor
t S
yste
m C
osts
0.0%
0.5%
1.0%
1.5%
2.0%
2.5%
Tor
t C
osts
as
% o
f G
DP
Tort Sytem Costs Tort Costs as % of GDP
Source: Tillinghast-Towers Perrin
After a period of rapid escalation, tort system costs as % of GDP appear to be stabilizing
Other Operational Challenges
• Insurance Scoring: Challenges Based on Disparate Impact
• Territorial Rating: Race-Based Issues Loom Large
• CAT Modeling: Need Greater Acceptance by Regulators
• Regulatory Environment: Still Antiquated

AUTO & HOME:
A SUCCESSFUL SHIFT TO THE UNDERWRITING
CULTURE?

Private Passenger Auto
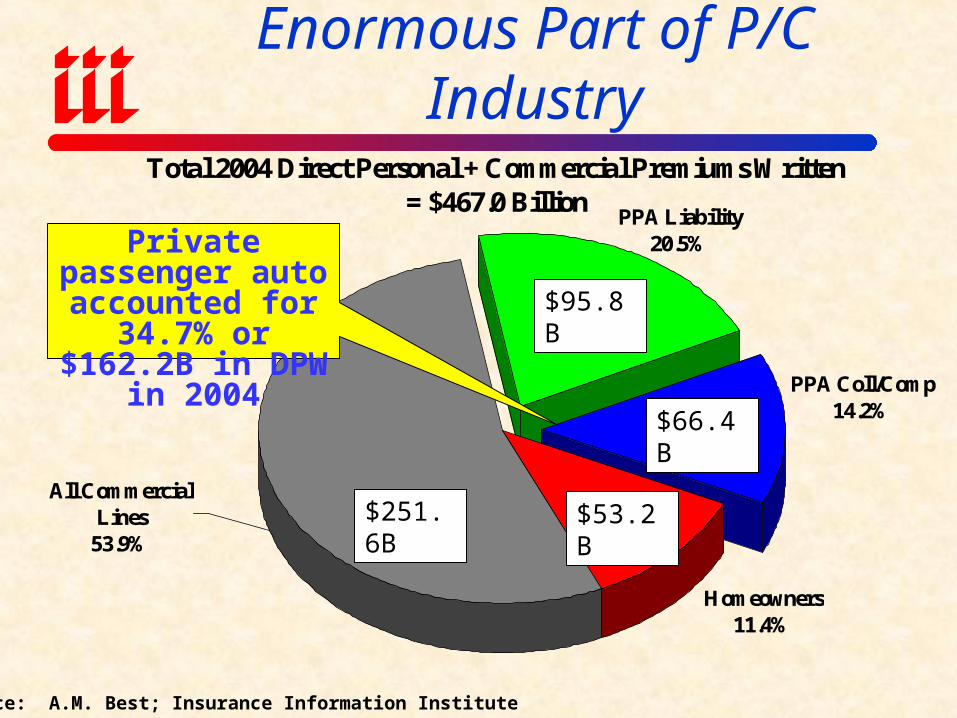
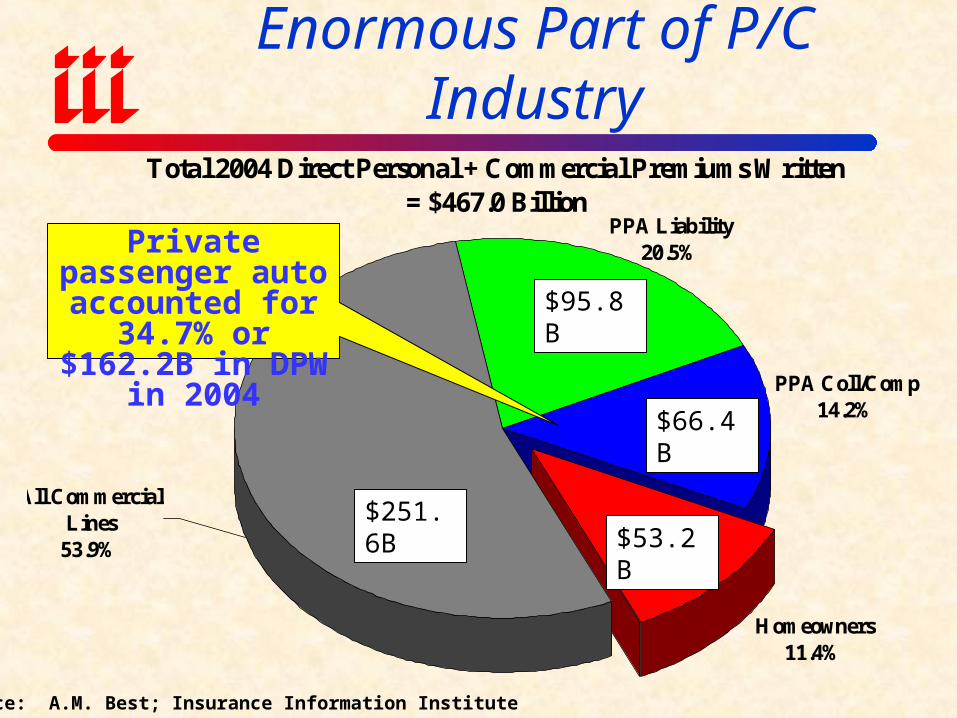
Private Passenger Auto is Enormous Part of P/C Industry
Total 2004 Direct Personal + Commercial Premiums Written = $467.0 Billion
All Commercial Lines
53.9%
PPA Coll/Comp14.2%
Homeowners11.4%
PPA Liability20.5%
Source: A.M. Best; Insurance Information Institute
Private passenger auto accounted for 34.7% or $162.2B in DPW in 2004
$251.6B $53.2B
$95.8B
$66.4B
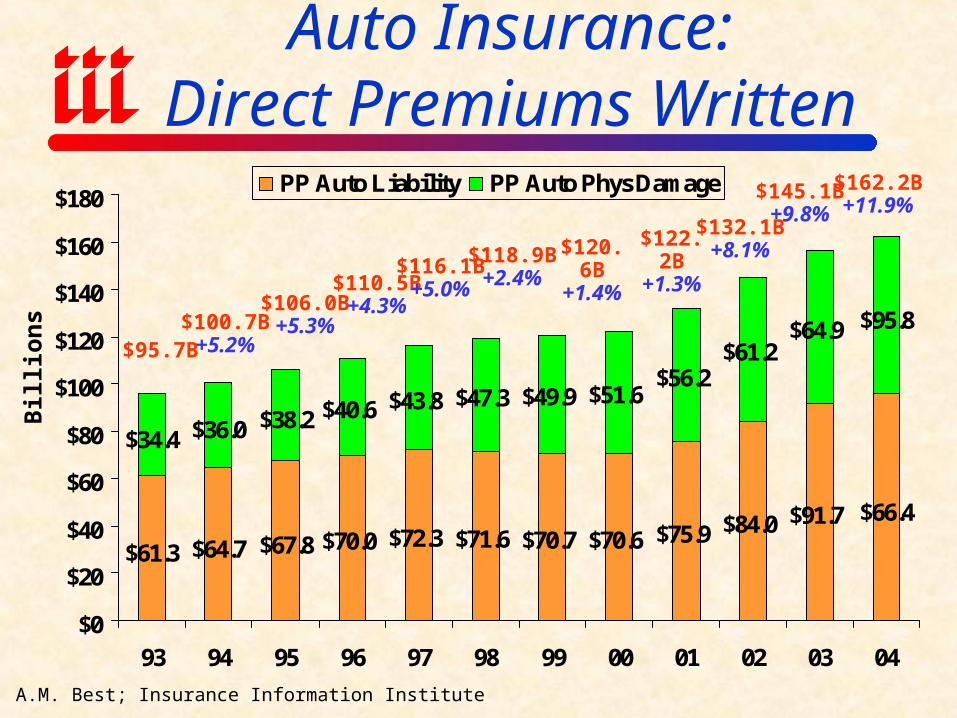
Auto Insurance:Direct Premiums Written
$61.3 $64.7 $67.8 $70.0 $72.3 $71.6 $70.7 $70.6 $75.9 $84.0 $91.7
$34.4 $36.0 $38.2 $40.6 $43.8 $47.3 $49.9 $51.6$56.2
$61.2$64.9
$66.4
$95.8
$0
$20
$40
$60
$80
$100
$120
$140
$160
$180
93 94 95 96 97 98 99 00 01 02 03 04
PP Auto Liability PP Auto Phys Damage
Bil
lion
s
$95.7B
Source: A.M. Best; Insurance Information Institute
$100.7B+5.2%
$106.0B+5.3%
$110.5B+4.3%
$116.1B+5.0%
$118.9B+2.4%
$120.6B
+1.4%
$122.2B
+1.3%
$132.1B+8.1%
$145.1B+9.8%
$162.2B+11.9%
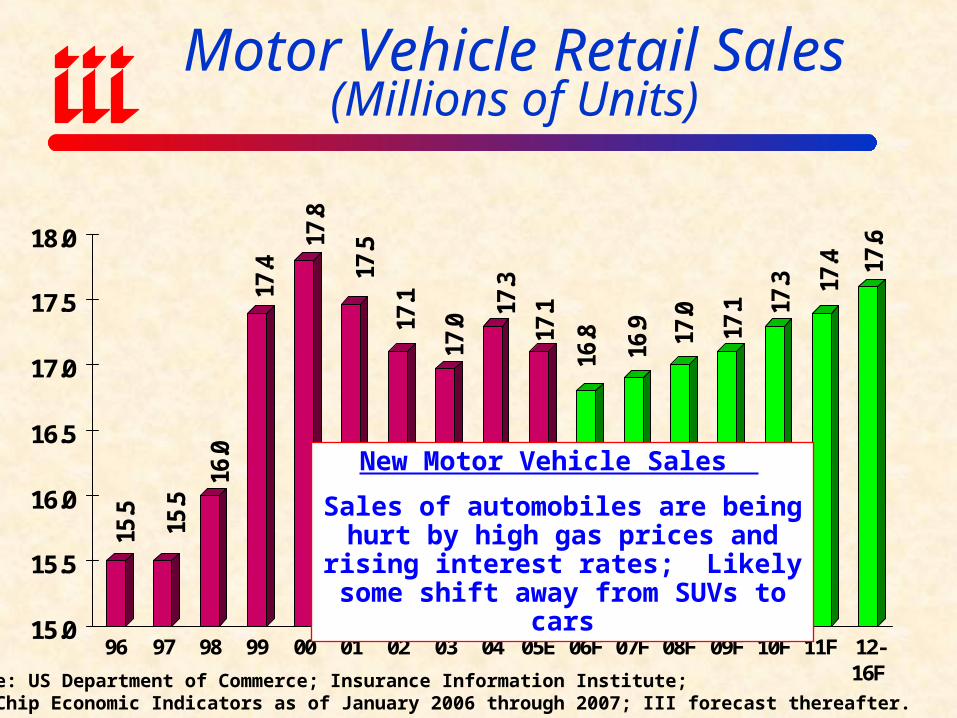
Motor Vehicle Retail Sales (Millions of Units)
15.5
15.5
16.0
17.4
17.8
17.5
17.1
17.0
17.3
17.1
16.8
16.9 17
.0
17.1 17
.3 17.4 17
.6
15.0
15.5
16.0
16.5
17.0
17.5
18.0
96 97 98 99 00 01 02 03 04 05E 06F 07F 08F 09F 10F 11F 12-16F
Source: US Department of Commerce; Insurance Information Institute;Blue Chip Economic Indicators as of January 2006 through 2007; III forecast thereafter.
New Motor Vehicle Sales
Sales of automobiles are being hurt by high gas prices and rising interest rates;
Likely some shift away from SUVs to cars
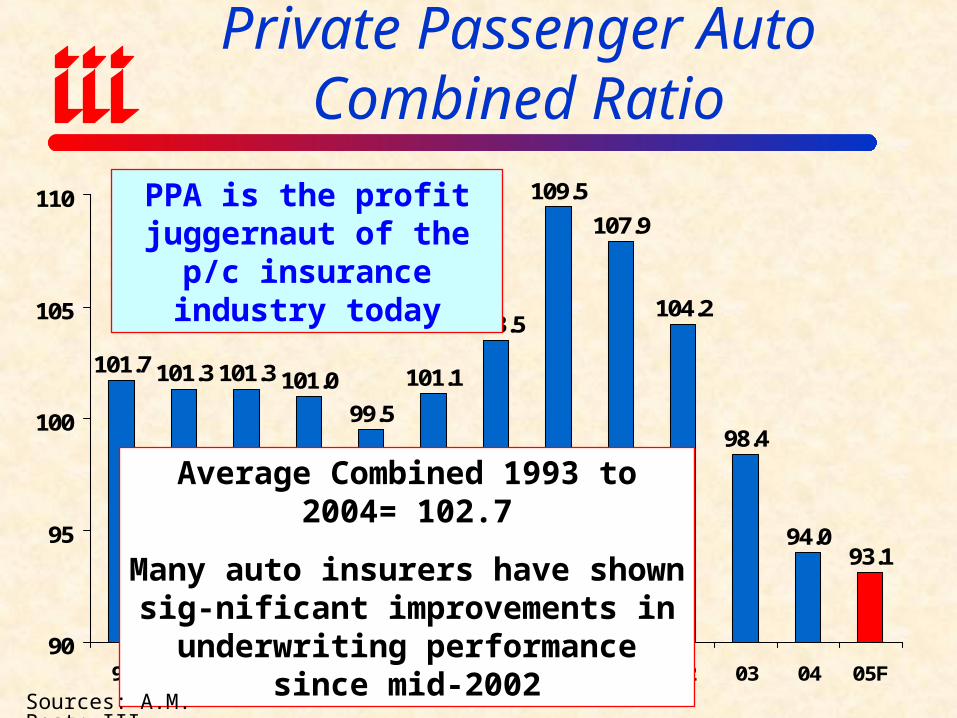
101.7 101.3 101.3 101.0
99.5
101.1
103.5
109.5
107.9
104.2
98.4
94.093.1
90
95
100
105
110
93 94 95 96 97 98 99 00 01 02 03 04 05F
Private Passenger Auto Combined Ratio
Average Combined 1993 to 2004= 102.7
Many auto insurers have shown sig-nificant improvements in underwriting
performance since mid-2002
Sources: A.M. Best; III
PPA is the profit juggernaut of the p/c
insurance industry today
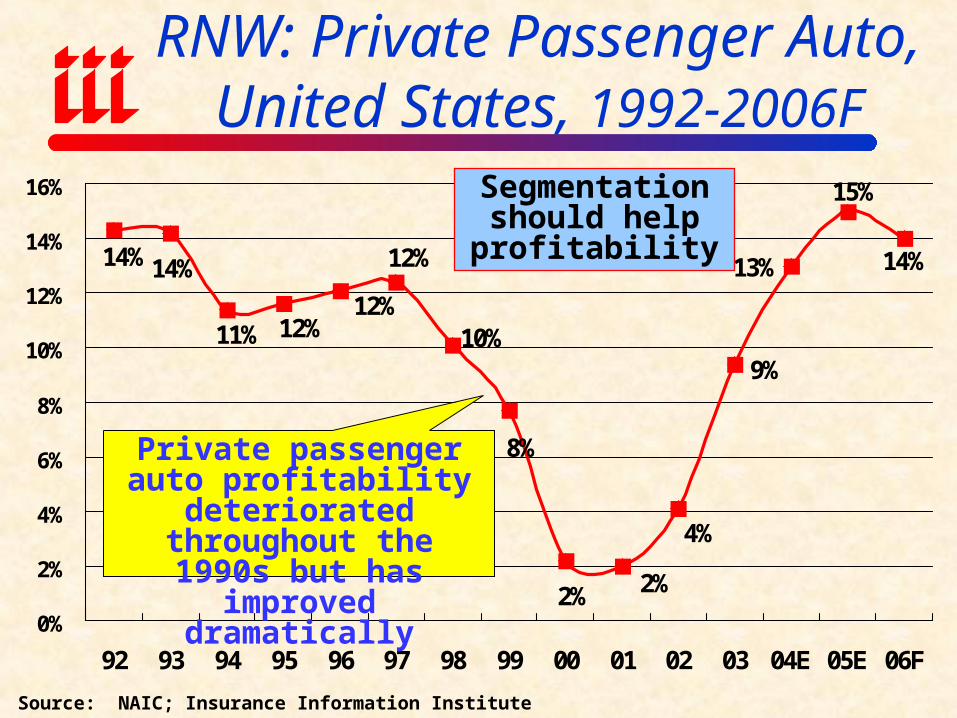
9%
14%13%
15%
12%14%14%
11% 12%12%
10%
8%
2% 2%
4%
0%
2%
4%
6%
8%
10%
12%
14%
16%
92 93 94 95 96 97 98 99 00 01 02 03 04E 05E 06F
RNW: Private Passenger Auto, United States, 1992-2006F
Source: NAIC; Insurance Information Institute
Private passenger auto profitability deteriorated throughout the 1990s but
has improved dramatically
Segmentation should help profitability
50%
60%
70%
80%
90%
100%
110%
99:Q
1
99:Q
2
99:Q
3
99:Q
4
00:Q
1
00:Q
2
00:Q
3
00:Q
4
01:Q
1
01:Q
2
01:Q
3
01:Q
4
02:Q
1
02:Q
2
02:Q
3
02:Q
4
03:Q
1
03:Q
2
03:Q
3
03:Q
4
04:Q
1
04:Q
2
04:Q
3
04:Q
4
05:Q
1
05:Q
2
05:Q
3
Collision Comprehensive Liability (BI & PD)
Source: ISO Fast Track; Insurance Information Institute. *Direct basis
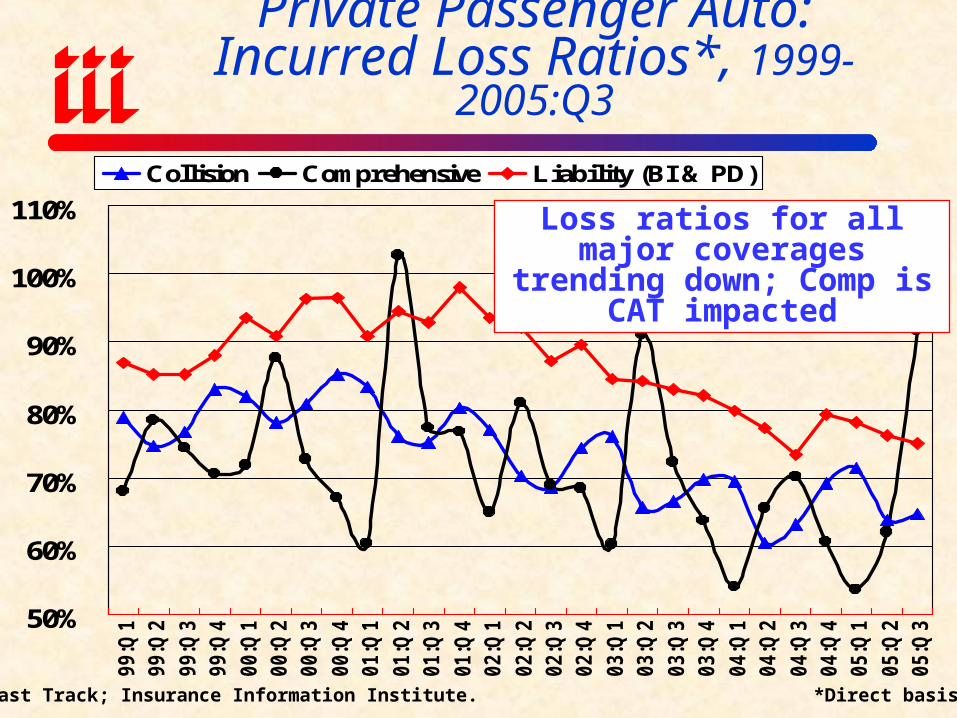
Private Passenger Auto:Incurred Loss Ratios*, 1999-2005:Q3
Loss ratios for all major coverages trending down; Comp is CAT impacted
0%
1%
2%
3%
4%
5%
6%
7%
8%
9%
10%
00
:Q1
00
:Q3
01
:Q1
01
:Q3
02
:Q1
02
:Q3
03
:Q1
03
:Q3
04
:Q1
04
:Q3
05
:Q1
05
:Q3
Auto Insurance Component of CPI Personal Auto-PD Pure Premium
Source: Insurance Information Institute calculations based ISO Fast Track and US BLS data.
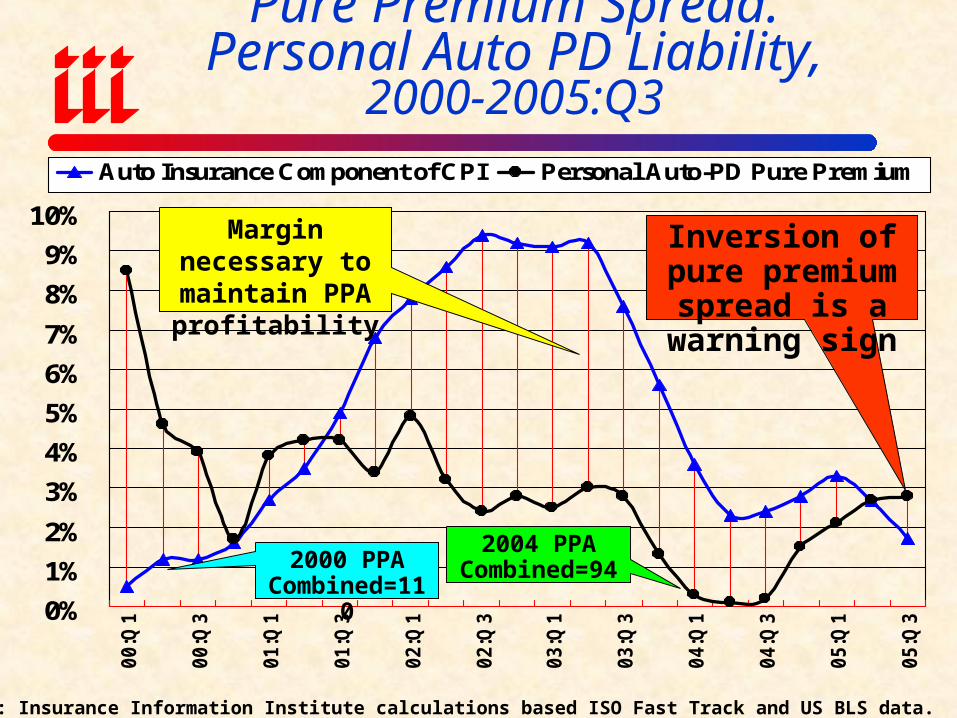
Pure Premium Spread: Personal Auto PD Liability, 2000-2005:Q3
Margin necessary to maintain PPA
profitability
2000 PPA Combined=110
2004 PPA Combined=94
Inversion of pure premium spread is a warning sign
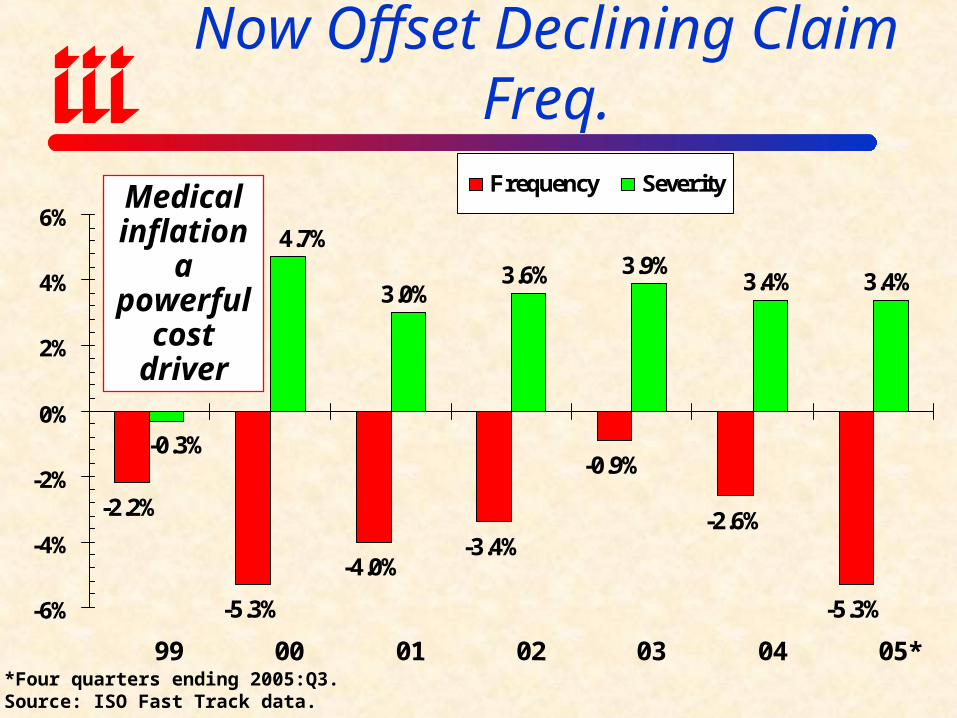
-2.2%
-5.3%
-4.0%-3.4%
-0.9%
-2.6%
-5.3%
3.0%3.6% 3.9%
3.4% 3.4%
-0.3%
4.7%
-6%
-4%
-2%
0%
2%
4%
6%
99 00 01 02 03 04 05*
Frequency Severity
Bodily Injury: Severity Trends Now Offset Declining Claim Freq.
*Four quarters ending 2005:Q3.Source: ISO Fast Track data.
Medical inflation a powerful
cost driver
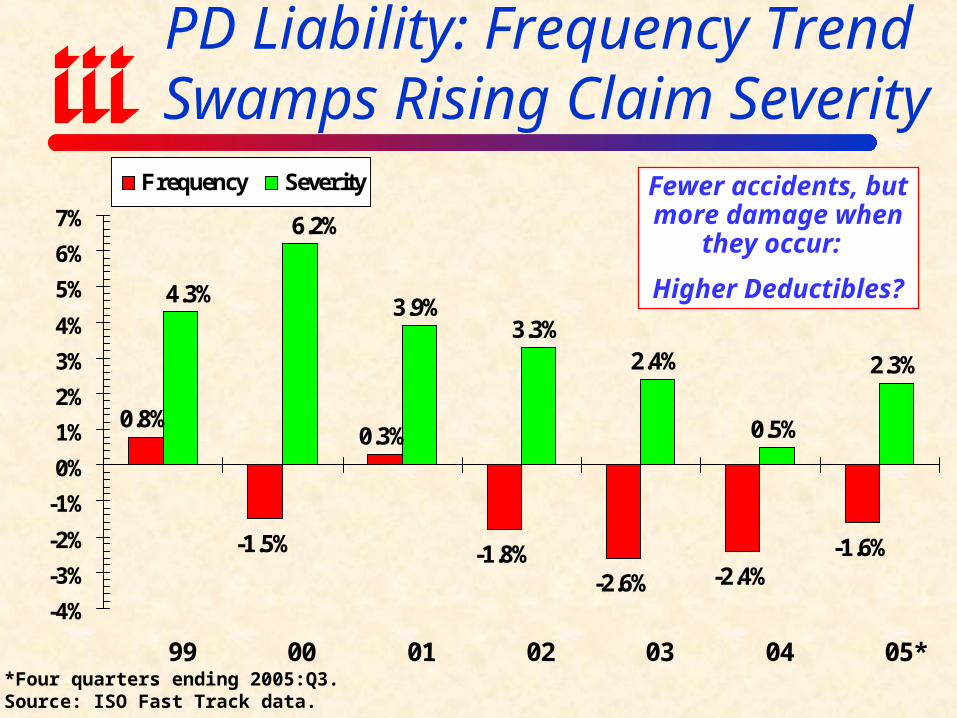
0.8%
-1.5%
0.3%
-1.8%-2.6% -2.4%
-1.6%
3.9%3.3%
2.4%
0.5%
2.3%
4.3%
6.2%
-4%
-3%
-2%
-1%
0%
1%
2%
3%
4%
5%
6%
7%
99 00 01 02 03 04 05*
Frequency Severity
PD Liability: Frequency Trend Swamps Rising Claim Severity
Fewer accidents, but more damage when
they occur:
Higher Deductibles?
*Four quarters ending 2005:Q3.Source: ISO Fast Track data.
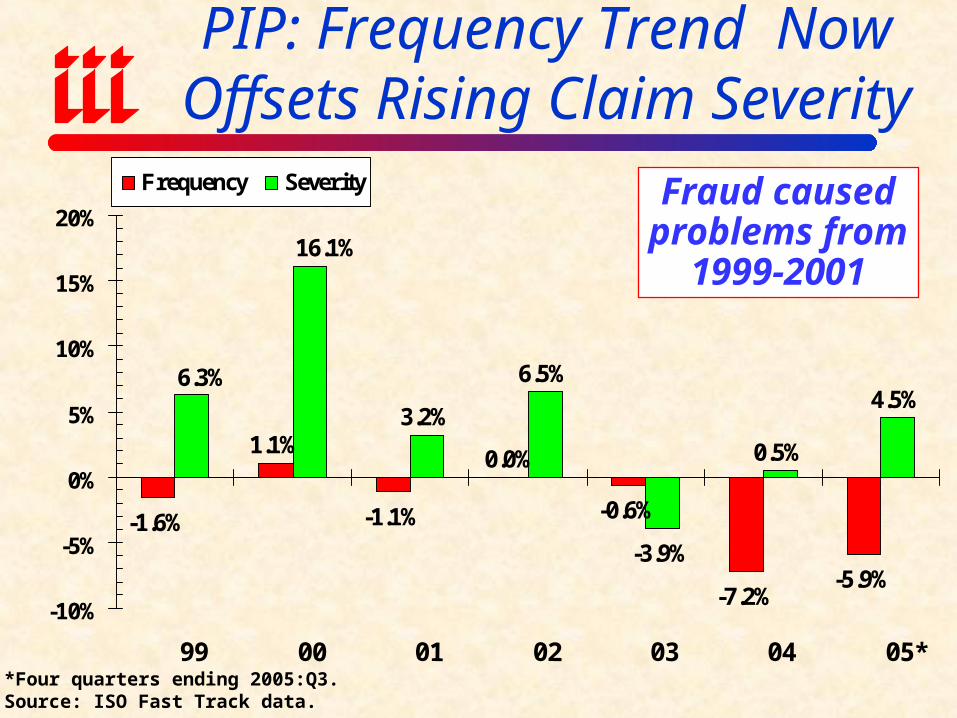
-1.6%
1.1%
-1.1%
0.0%
-0.6%
-7.2%-5.9%
3.2%
6.5%
-3.9%
0.5%
4.5%6.3%
16.1%
-10%
-5%
0%
5%
10%
15%
20%
99 00 01 02 03 04 05*
Frequency Severity
PIP: Frequency Trend Now Offsets Rising Claim Severity
Fraud caused problems from
1999-2001
*Four quarters ending 2005:Q3.Source: ISO Fast Track data.
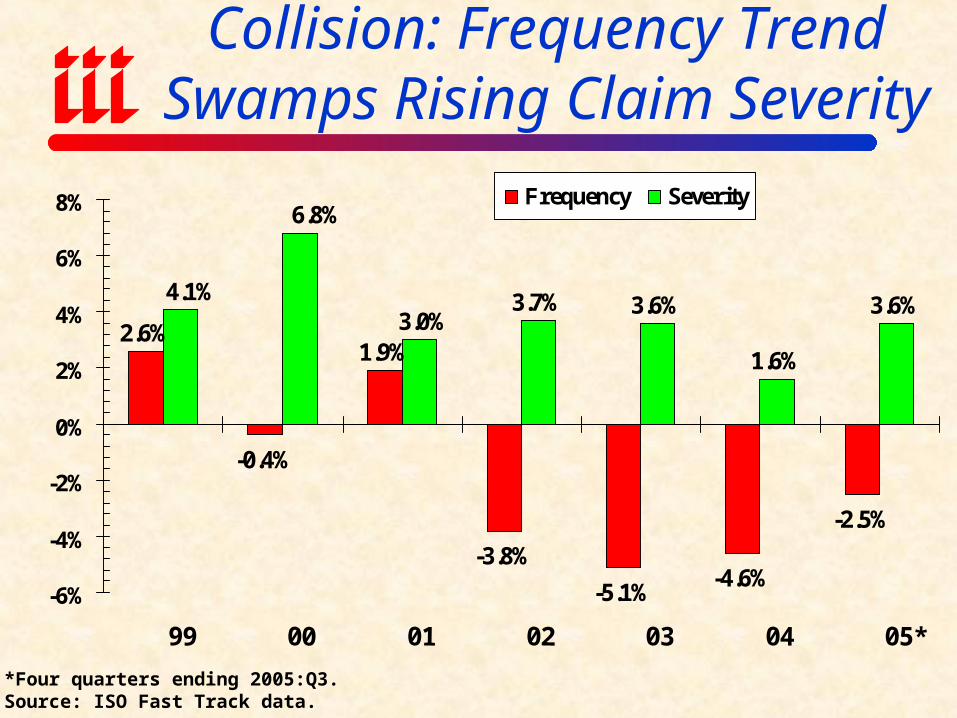
2.6%
-0.4%
1.9%
-3.8%
-5.1%-4.6%
-2.5%
3.7% 3.6%
1.6%
3.6%3.0%
4.1%
6.8%
-6%
-4%
-2%
0%
2%
4%
6%
8%
99 00 01 02 03 04 05*
Frequency Severity
Collision: Frequency Trend Swamps Rising Claim Severity
*Four quarters ending 2005:Q3.Source: ISO Fast Track data.
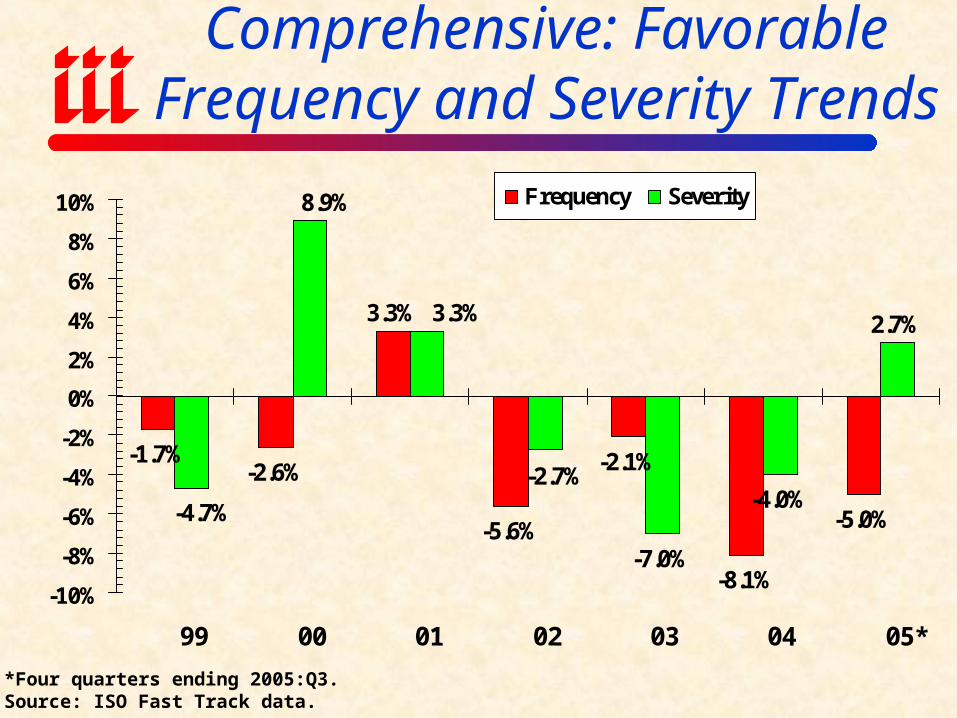
-1.7%-2.6%
3.3%
-5.6%
-2.1%
-8.1%
-5.0%
-7.0%
-4.0%
2.7%
-2.7%
3.3%
-4.7%
8.9%
-10%
-8%
-6%
-4%
-2%
0%
2%
4%
6%
8%
10%
99 00 01 02 03 04 05*
Frequency Severity
Comprehensive: Favorable Frequency and Severity Trends
*Four quarters ending 2005:Q3.Source: ISO Fast Track data.

Homeowners
Private Passenger Auto is Enormous Part of P/C Industry
Total 2004 Direct Personal + Commercial Premiums Written = $467.0 Billion
All Commercial Lines
53.9%
PPA Coll/Comp14.2%
Homeowners11.4%
PPA Liability20.5%
Source: A.M. Best; Insurance Information Institute
Private passenger auto accounted for 34.7% or $162.2B in DPW in 2004
$251.6B$53.2B
$95.8B
$66.4B
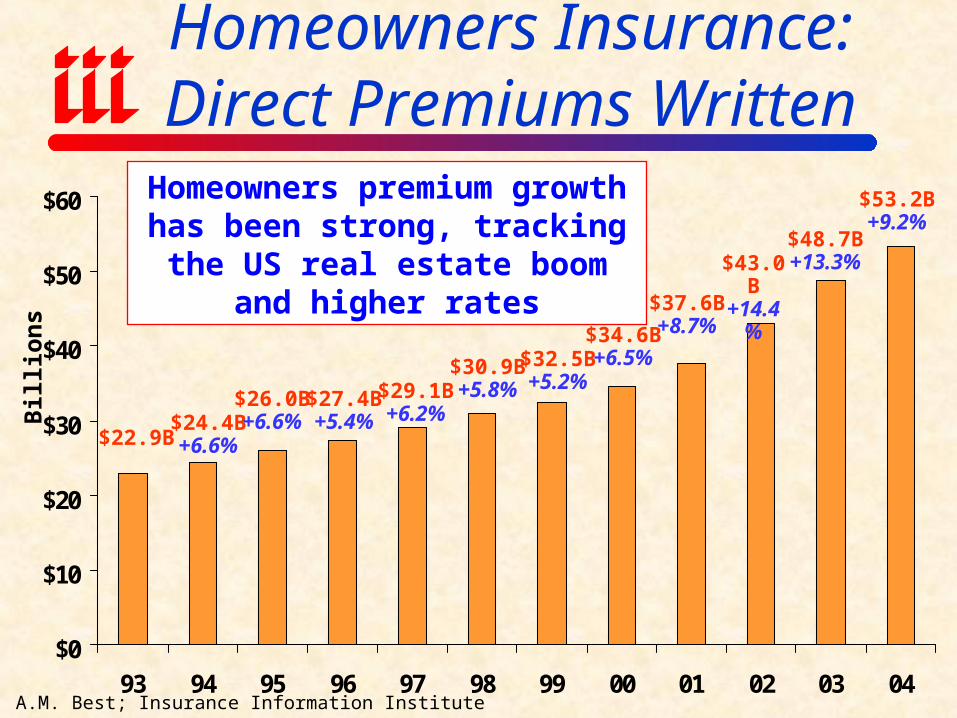
Homeowners Insurance:Direct Premiums Written
$0
$10
$20
$30
$40
$50
$60
93 94 95 96 97 98 99 00 01 02 03 04
Bil
lion
s
$22.9B
Source: A.M. Best; Insurance Information Institute
$24.4B+6.6%
$26.0B+6.6%
$27.4B+5.4%
$29.1B+6.2%
$30.9B+5.8%
$32.5B+5.2%
$34.6B+6.5%
$37.6B+8.7%
$43.0B+14.4
%
$48.7B+13.3%
$53.2B+9.2%
Homeowners premium growth has been strong, tracking the US real
estate boom and higher rates
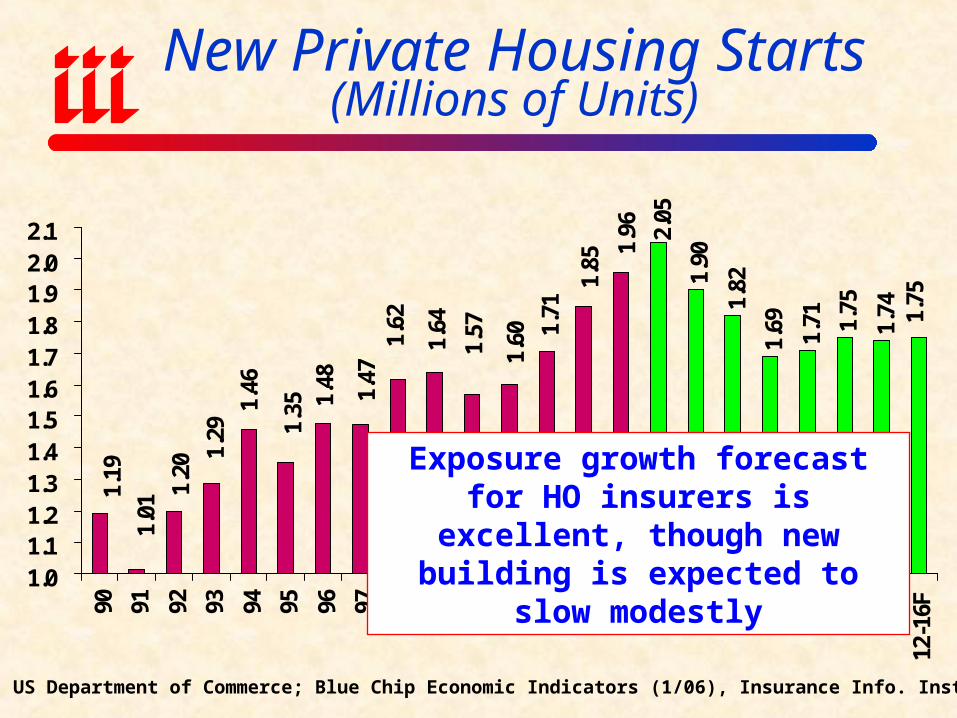
New Private Housing Starts(Millions of Units)
2.05
1.90
1.82
1.69 1.71 1.
75
1.74 1.
75
1.48
1.351.
46
1.29
1.20
1.01
1.19
1.47
1.62
1.64
1.57
1.60 1.
71
1.85
1.96
1.01.11.21.31.41.51.61.71.81.92.02.1
90 91 92 93 94 95 96 97 98 99 00 01 02 03 04
05E
06F
07F
08F
09F
10F
11F
12-1
6F
Source: US Department of Commerce; Blue Chip Economic Indicators (1/06), Insurance Info. Institute
Exposure growth forecast for HO insurers is excellent, though new
building is expected to slow modestly
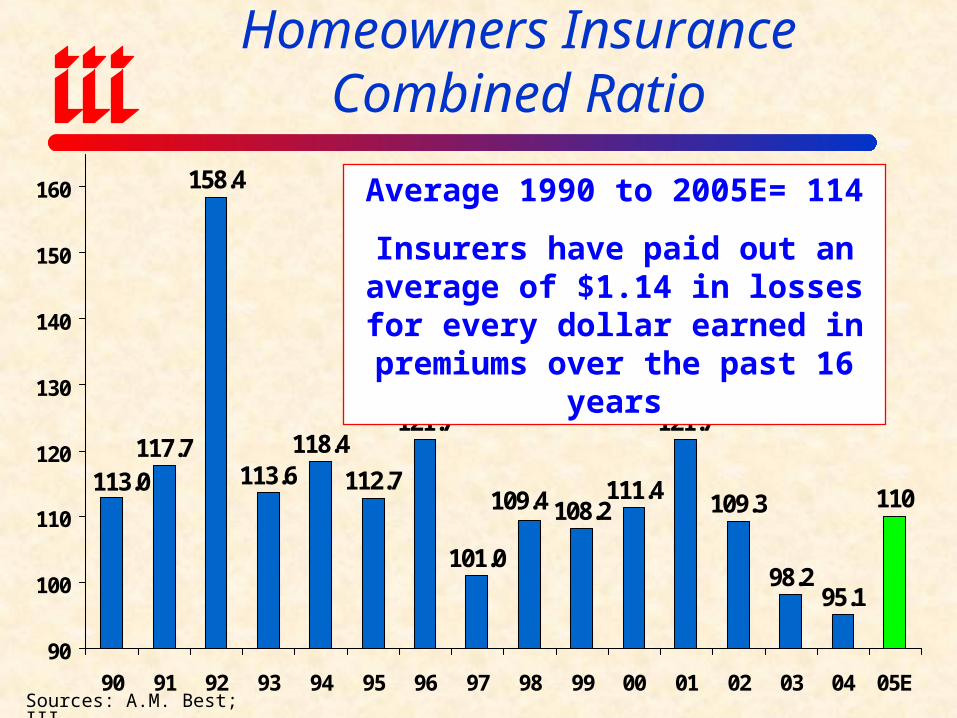
117.7
158.4
113.6118.4
112.7
121.7
101.0
108.2111.4
121.7
109.3
98.295.1
110113.0
109.4
90
100
110
120
130
140
150
160
90 91 92 93 94 95 96 97 98 99 00 01 02 03 04 05E
Homeowners Insurance Combined Ratio
Average 1990 to 2005E= 114
Insurers have paid out an average of $1.14 in losses for every dollar earned
in premiums over the past 16 years
Sources: A.M. Best; III
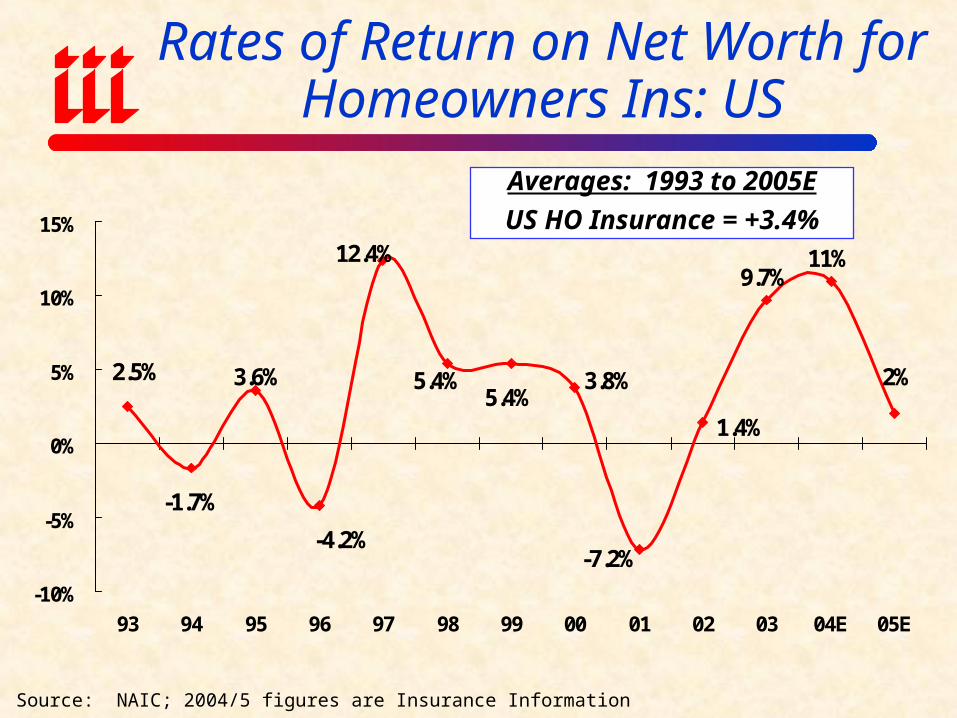
Rates of Return on Net Worth for Homeowners Ins: US
Source: NAIC; 2004/5 figures are Insurance Information Institute estimates.
9.7%11%
2%
-1.7%
-4.2%
3.6%
12.4%
5.4%2.5% 5.4% 3.8%
1.4%
-7.2%
-10%
-5%
0%
5%
10%
15%
93 94 95 96 97 98 99 00 01 02 03 04E 05E
Averages: 1993 to 2005E
US HO Insurance = +3.4%
INSURANCE-TO-VALUE:
Ending the Blame Game is aWin-Win Situation Deal
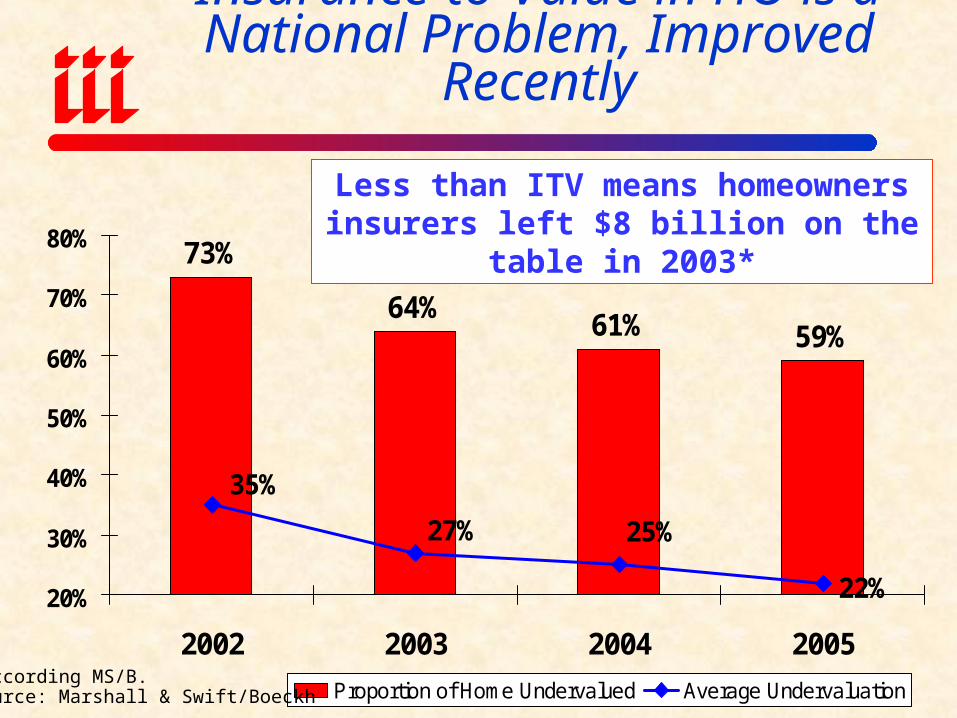
Insurance-to-Value in HO is a National Problem, Improved Recently
73%
64%61% 59%
22%
25%27%
35%
20%
30%
40%
50%
60%
70%
80%
2002 2003 2004 2005
Proportion of Home Undervalued Average Undervaluation*According MS/B.Source: Marshall & Swift/Boeckh
Less than ITV means homeowners insurers left $8 billion on the table in 2003*
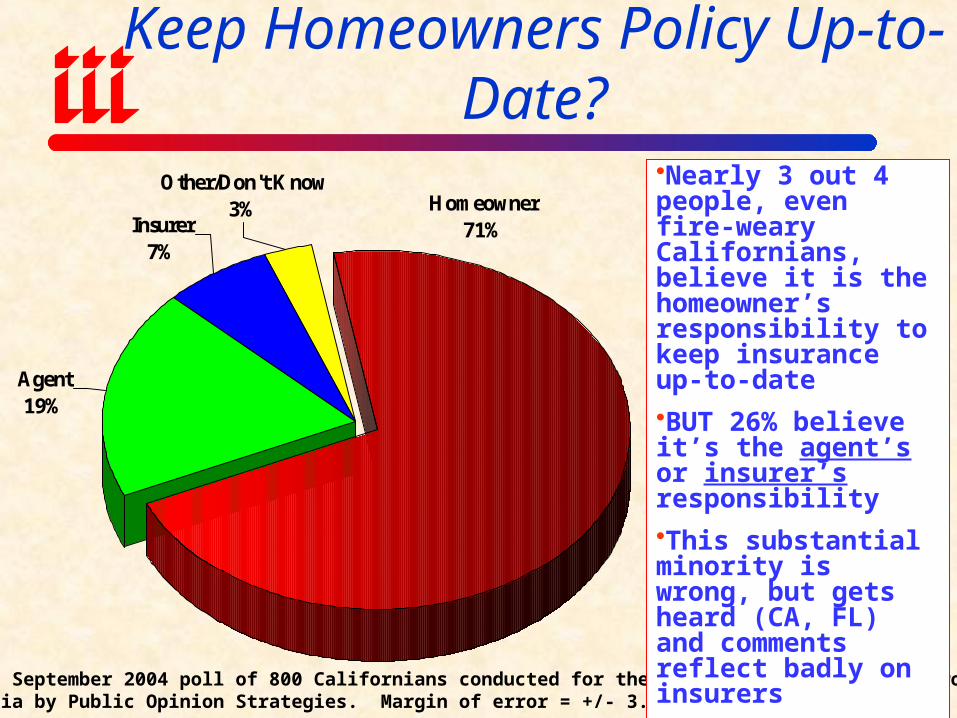
Who’s Responsibility Is It to Keep Homeowners Policy Up-to-Date?
Other/Don't Know3%
Agent19%
Insurer7%
Homeowner71%
Source: September 2004 poll of 800 Californians conducted for the Insurance Information Network ofCalifornia by Public Opinion Strategies. Margin of error = +/- 3.46%.
Nearly 3 out 4 people, even fire-weary Californians, believe it is the homeowner’s responsibility to keep insurance up-to-date
BUT 26% believe it’s the agent’s or insurer’s responsibility
This substantial minority is wrong, but gets heard (CA, FL) and comments reflect badly on insurers
Media, regulators and legislators join fray
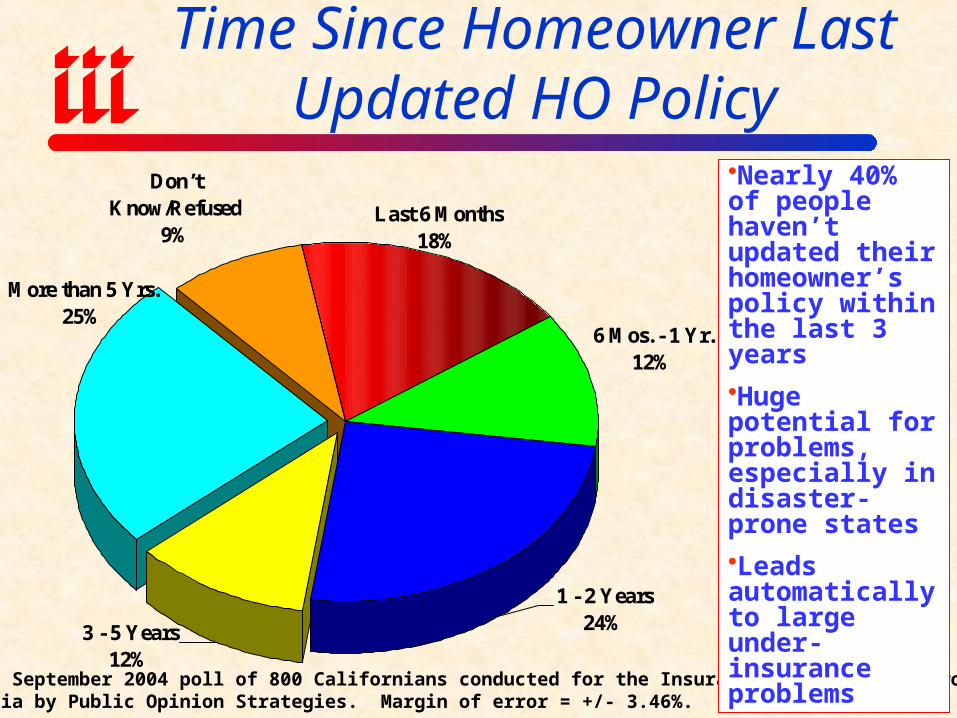
Time Since Homeowner Last Updated HO Policy
3 - 5 Years12%
Don’t Know/Refused
9%
6 Mos. - 1 Yr.12%
More than 5 Yrs.25%
1 - 2 Years24%
Last 6 Months18%
Source: September 2004 poll of 800 Californians conducted for the Insurance Information Network ofCalifornia by Public Opinion Strategies. Margin of error = +/- 3.46%.
Nearly 40% of people haven’t updated their homeowner’s policy within the last 3 years
Huge potential for problems, especially in disaster-prone states
Leads automatically to large under-insurance problems
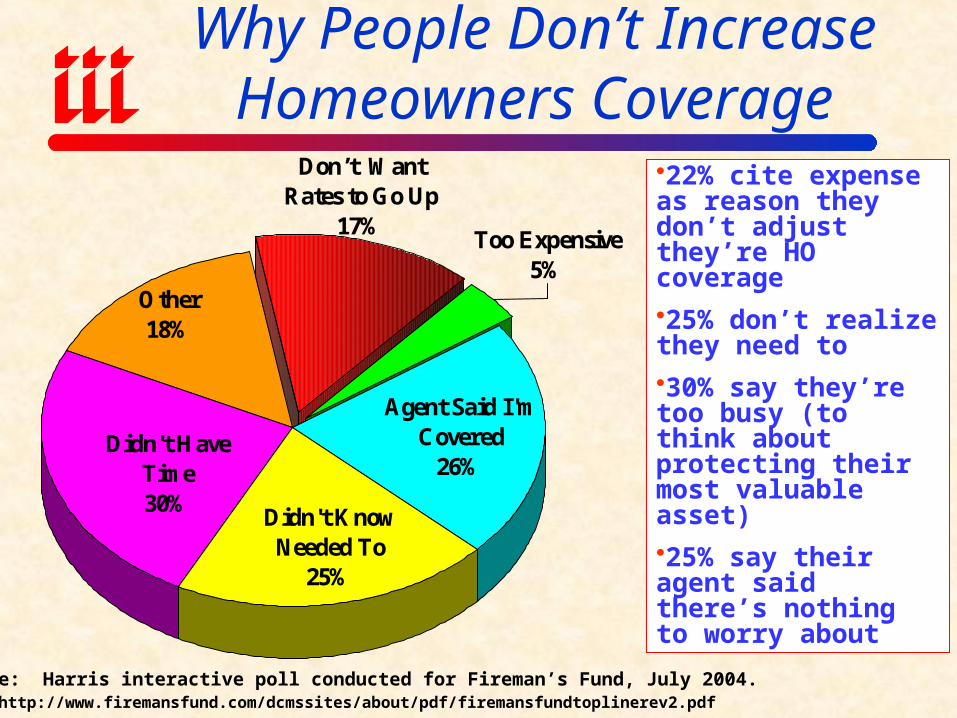
Why People Don’t Increase Homeowners Coverage
Didn't Know Needed To
25%
Other18%
Too Expensive5%
Didn't Have Time30%
Agent Said I'm Covered
26%
Don’t Want Rates to Go Up
17%
22% cite expense as reason they don’t adjust they’re HO coverage
25% don’t realize they need to
30% say they’re too busy (to think about protecting their most valuable asset)
25% say their agent said there’s nothing to worry about
Source: Harris interactive poll conducted for Fireman’s Fund, July 2004.See: http://www.firemansfund.com/dcmssites/about/pdf/firemansfundtoplinerev2.pdf
Summary• Home/Auto picture is bright for 2006, assuming “normal” CAT loss
activity
• Concern about pricing discipline, esp. if freq/severity trends turn adverse
• Rising investment returns insufficient to support deep soft market in terms of price, terms & conditions
• Clear need to be more underwriting focused
• Major Challenges:
Maintaining price/underwriting discipline
Managing variability/volatility of results

Insurance Information Institute On-Line
If you would like a copy of this presentation, please give me your business card with e-mail address
Recommended