5/25/2012
1
1
Performing Productivity Improvement
for Performance Recovery
an ELSA’s presentation to capital market analysts:
1Q-2012 performance, strategy & 2012 projection
Financial Club Jakarta - 24 May 2012
2
Discussion Agenda :
1. Corporate & Business Overview
2. Management’s Continuous Action for
Performance Recovery
3. 2011 Performance Highlights
4. Industry & Prospect in Brief
5. 1Q-2012 Performance Highlights
6. 2012 Business Strategy
7. 2Q-2012 Performance Projection
5/25/2012
2
3
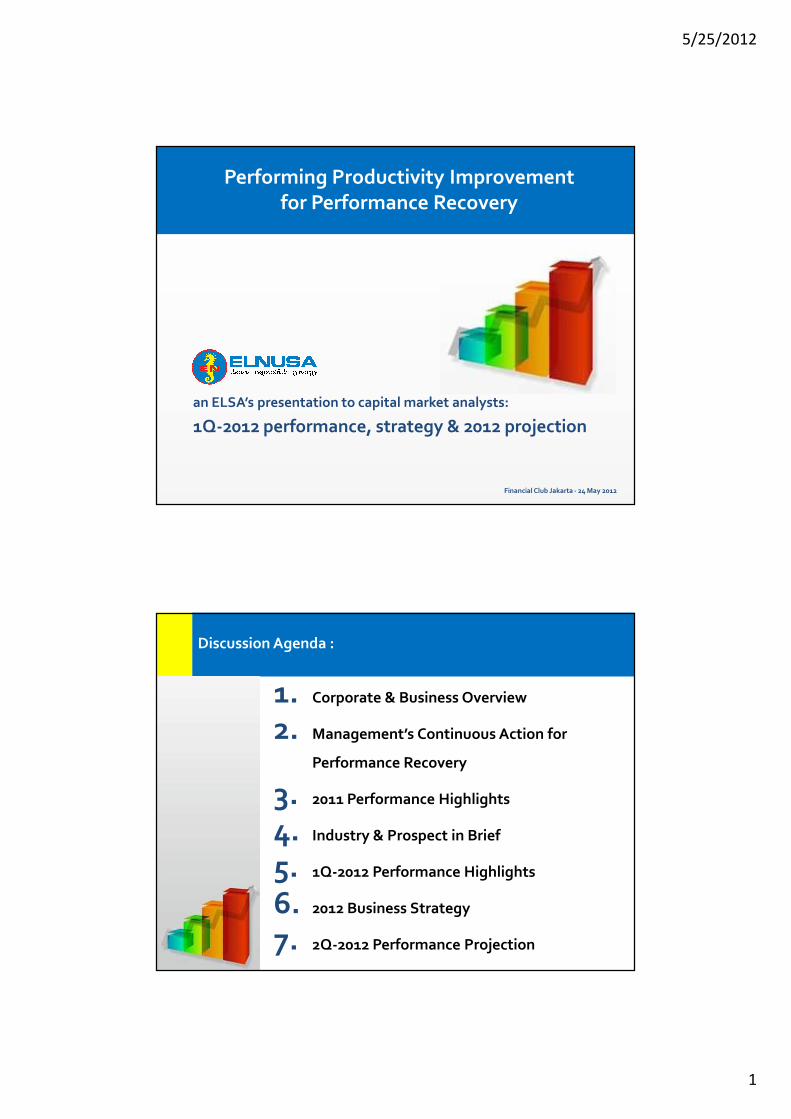
Corporate Overview :
Reputable Oil & Gas Services Business
PT Elnusa Tbk (“ELSA”) is a publicly listed
Oil & Gas Services company which has been
operating for almost 40 years in oil & gas
industry. ELSA focuses in Upstream Oil & Gas
Services business : Geoscience-Drilling-Oilfield
and also manages Downstream Oil& Gas
Services as well as Support Upstream Oil & Gas
Services in its Subsidiaries. In 2011, ELSA
established a Joint-Venture company for marine
seismic services business.
Controlling Shareholders :
- PT Pertamina (Persero)
- PT Benakat Petroleum Energy Tbk
4
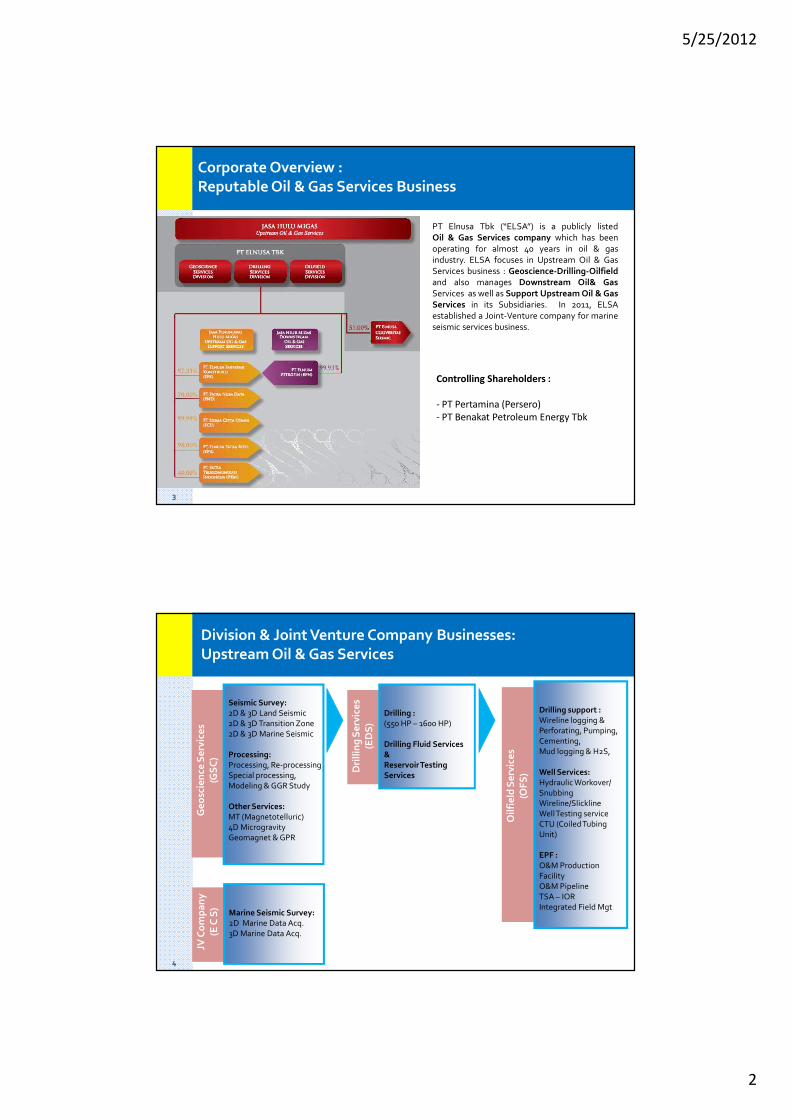
Division & Joint Venture Company Businesses:
Upstream Oil & Gas Services
Seismic Survey:
2D & 3D Land Seismic
2D & 3D Transition Zone
2D & 3D Marine Seismic
Processing:
Processing, Re-processing
Special processing,
Modeling & GGR Study
Other Services:
MT (Magnetotelluric)
4D Microgravity
Geomagnet & GPR
Drilling :
(550 HP – 1600 HP)
Drilling Fluid Services
&
Reservoir Testing
Services
Drilling support :
Wireline logging &
Perforating, Pumping,
Cementing,
Mud logging & H2S,
Well Services:
Hydraulic Workover/
Snubbing
Wireline/Slickline
Well Testing service
CTU (Coiled Tubing
Unit)
EPF :
O&M Production
Facility
O&M Pipeline
TSA – IOR
Integrated Field Mgt
Ge
osc
ien
ce S
erv
ice
s(G
SC
)
Dri
llin
g S
erv
ice
s(E
DS
)
Oil
fie
ld S
erv
ice
s(O
FS
)
Marine Seismic Survey:
2D Marine Data Acq.
3D Marine Data Acq.
JV C
om
pa
ny
(E C
S)
5/25/2012
3
5
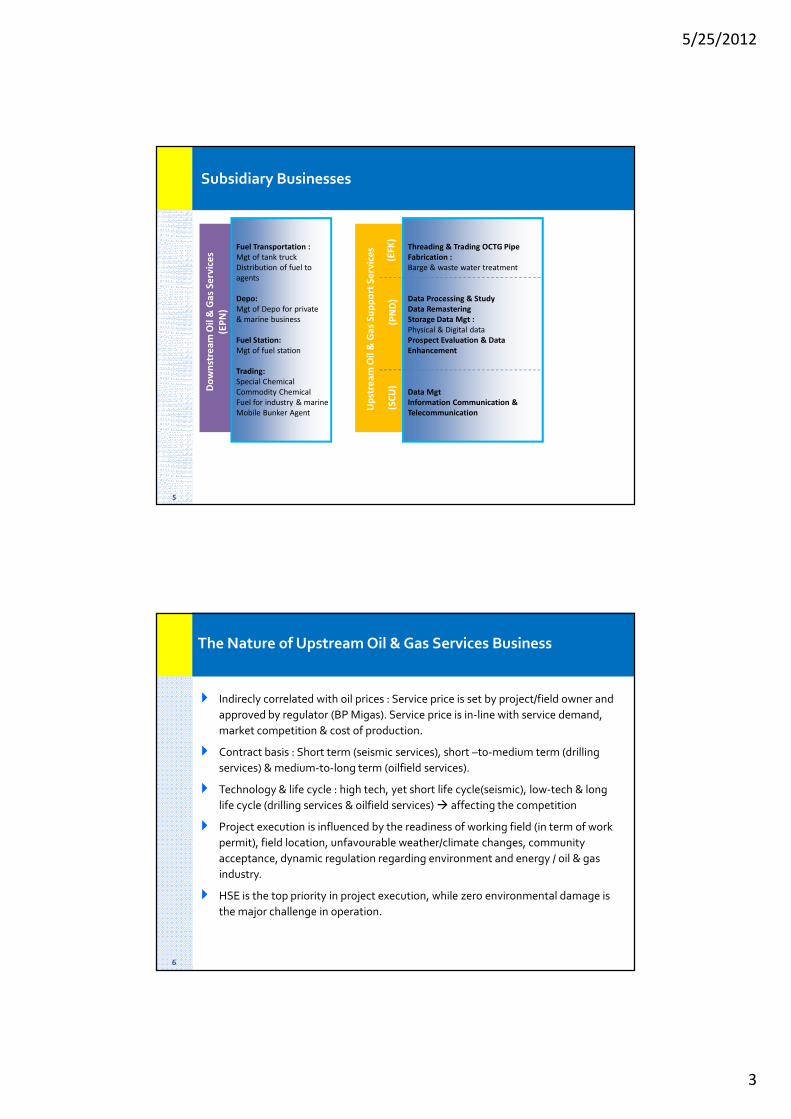
Subsidiary Businesses
Fuel Transportation :
Mgt of tank truck
Distribution of fuel to
agents
Depo:
Mgt of Depo for private
& marine business
Fuel Station:
Mgt of fuel station
Trading:
Special Chemical
Commodity Chemical
Fuel for industry & marine
Mobile Bunker Agent
Threading & Trading OCTG Pipe
Fabrication :
Barge & waste water treatment
Data Processing & Study
Data Remastering
Storage Data Mgt :
Physical & Digital data
Prospect Evaluation & Data
Enhancement
Data Mgt
Information Communication &
Telecommunication
Do
wn
stre
am
Oil
& G
as
Se
rvic
es
(EP
N)
Up
stre
am
Oil
& G
as
Su
pp
ort
Se
rvic
es
(EF
K)
(PN
D)
(SC
U)
6
The Nature of Upstream Oil & Gas Services Business
� Indirecly correlated with oil prices : Service price is set by project/field owner and
approved by regulator (BP Migas). Service price is in-line with service demand,
market competition & cost of production.
� Contract basis : Short term (seismic services), short –to-medium term (drilling
services) & medium-to-long term (oilfield services).
� Technology & life cycle : high tech, yet short life cycle(seismic), low-tech & long
life cycle (drilling services & oilfield services) � affecting the competition
� Project execution is influenced by the readiness of working field (in term of work
permit), field location, unfavourable weather/climate changes, community
acceptance, dynamic regulation regarding environment and energy / oil & gas
industry.
� HSE is the top priority in project execution, while zero environmental damage is
the major challenge in operation.
5/25/2012
4
7
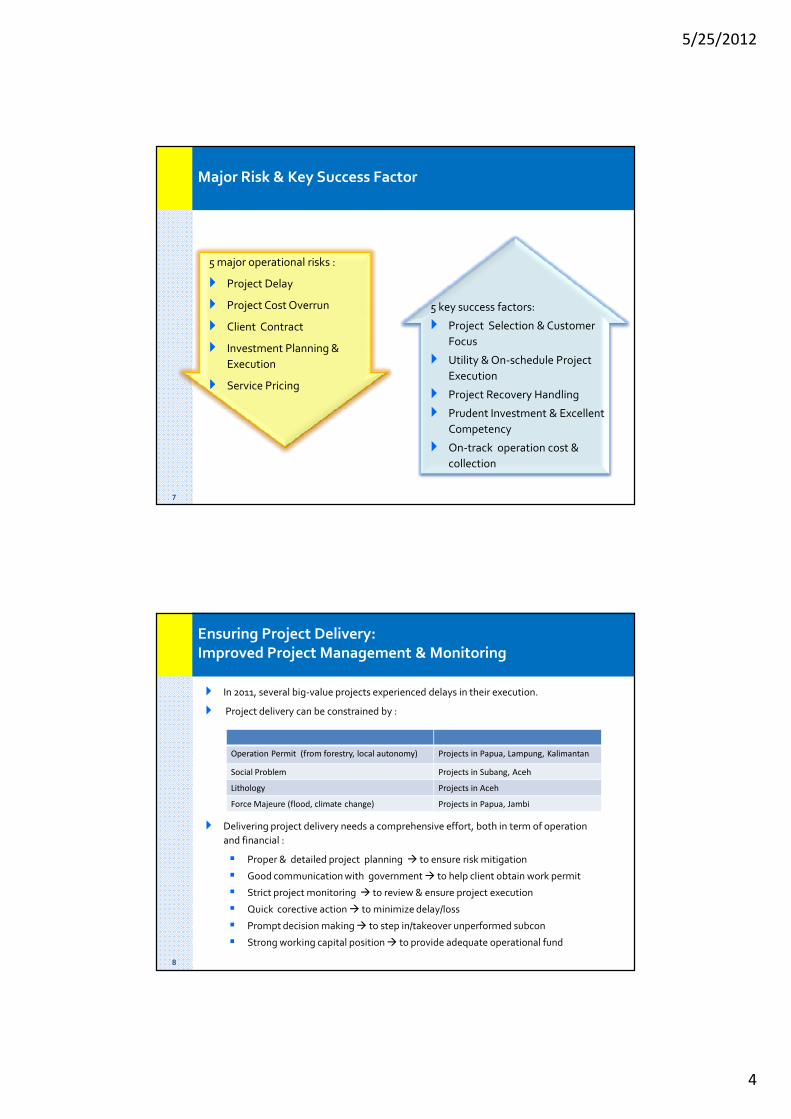
Major Risk & Key Success Factor
5 major operational risks :
� Project Delay
� Project Cost Overrun
� Client Contract
� Investment Planning &
Execution
� Service Pricing
5 key success factors:
� Project Selection & Customer
Focus
� Utility & On-schedule Project
Execution
� Project Recovery Handling
� Prudent Investment & Excellent
Competency
� On-track operation cost &
collection
8
Ensuring Project Delivery:
Improved Project Management & Monitoring
� In 2011, several big-value projects experienced delays in their execution.
� Project delivery can be constrained by :
� Delivering project delivery needs a comprehensive effort, both in term of operation
and financial :
� Proper & detailed project planning � to ensure risk mitigation
� Good communication with government � to help client obtain work permit
� Strict project monitoring � to review & ensure project execution
� Quick corective action � to minimize delay/loss
� Prompt decision making � to step in/takeover unperformed subcon
� Strong working capital position � to provide adequate operational fund
Operation Permit (from forestry, local autonomy) Projects in Papua, Lampung, Kalimantan
Social Problem Projects in Subang, Aceh
Lithology Projects in Aceh
Force Majeure (flood, climate change) Projects in Papua, Jambi
5/25/2012
5
9
Management’s Continuous Action for Performance Recovery
� Structural Change :
� Business structure repositioning (Oilfield Services
enhancement),
� Profitability & Cash flow as KPI,
� Isolated loss projects/business unit & review for next
action (Drilling, ECS),
� Streamlining organization for effectivity & efficiency.
� Fundamental Change :
� Work culture for integrity & professionalism,
� Strenghten awareness of ‘HSE is my culture,
Equipment is my life & Cost awareness is my
attitude”,
� Business process improvement.
� Performance Change :
� Focus on major & reputable clients,
� Strict monitoring on new proposal project & risk
mitigation,
� Project management improvement for execution,
� Invoice acceleration, refinancing for better & lower
interest rate,
� HSE strenghtening for zero fatality.
o Business Structure & Organization
Improvement
o Profitability, Productivity & Cash Flow
Management Improvement
o Work Culture Improvement
Improvement
10
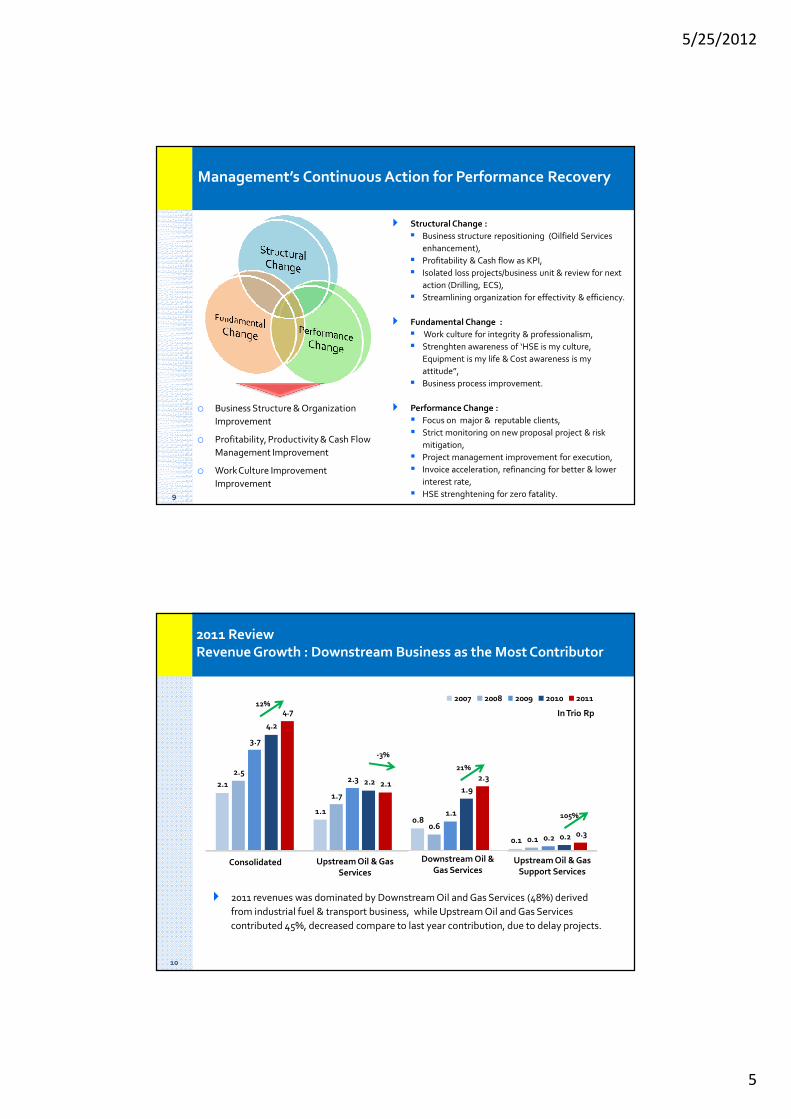
2.1
1.1 0.8
0.1
2.5
1.7
0.6
0.1
3.7
2.3
1.1
0.2
4.2
2.2 1.9
0.2
4.7
2.1 2.3
0.3
Pendapatan Usaha Hulu Hilir Support
2007 2008 2009 2010 2011
� 2011 revenues was dominated by Downstream Oil and Gas Services (48%) derived
from industrial fuel & transport business, while Upstream Oil and Gas Services
contributed 45%, decreased compare to last year contribution, due to delay projects.
2011 Review Revenue Growth : Downstream Business as the Most Contributor
Consolidated Upstream Oil & Gas
Services
Downstream Oil &
Gas ServicesUpstream Oil & Gas
Support Services
12%
21%
-3%
105%
In Trio Rp
5/25/2012
6
11
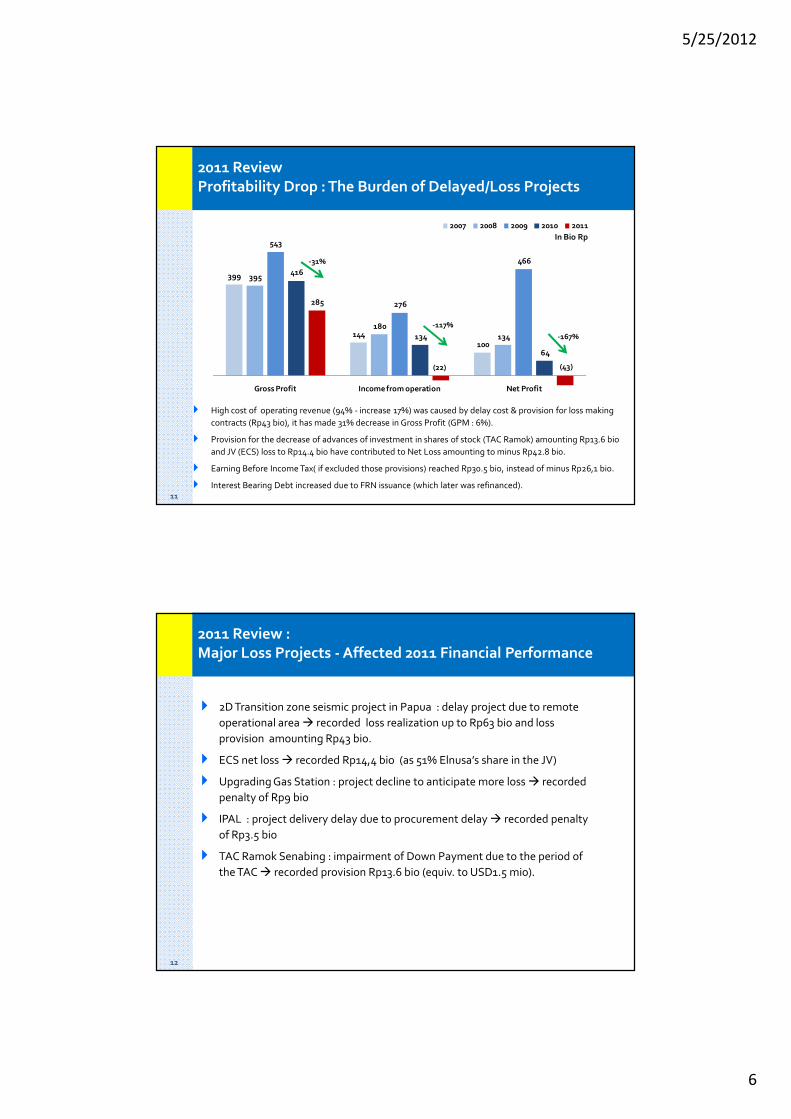
� High cost of operating revenue (94% - increase 17%) was caused by delay cost & provision for loss making
contracts (Rp43 bio), it has made 31% decrease in Gross Profit (GPM : 6%).
� Provision for the decrease of advances of investment in shares of stock (TAC Ramok) amounting Rp13.6 bio
and JV (ECS) loss to Rp14.4 bio have contributed to Net Loss amounting to minus Rp42.8 bi0.
� Earning Before Income Tax( if excluded those provisions) reached Rp30.5 bio, instead of minus Rp26,1 bio.
� Interest Bearing Debt increased due to FRN issuance (which later was refinanced).
2011 Review
Profitability Drop : The Burden of Delayed/Loss Projects
399
144
100
395
180
134
543
276
466
416
134
64
285
(22) (43)
Gross Profit Income from operation Net Profit
2007 2008 2009 2010 2011
-31%
-117%
-167%
In Bio Rp
12
2011 Review :
Major Loss Projects - Affected 2011 Financial Performance
� 2D Transition zone seismic project in Papua : delay project due to remote
operational area � recorded loss realization up to Rp63 bio and loss
provision amounting Rp43 bio.
� ECS net loss � recorded Rp14,4 bio (as 51% Elnusa’s share in the JV)
� Upgrading Gas Station : project decline to anticipate more loss � recorded
penalty of Rp9 bio
� IPAL : project delivery delay due to procurement delay � recorded penalty
of Rp3.5 bio
� TAC Ramok Senabing : impairment of Down Payment due to the period of
the TAC � recorded provision Rp13.6 bio (equiv. to USD1.5 mio).
5/25/2012
7
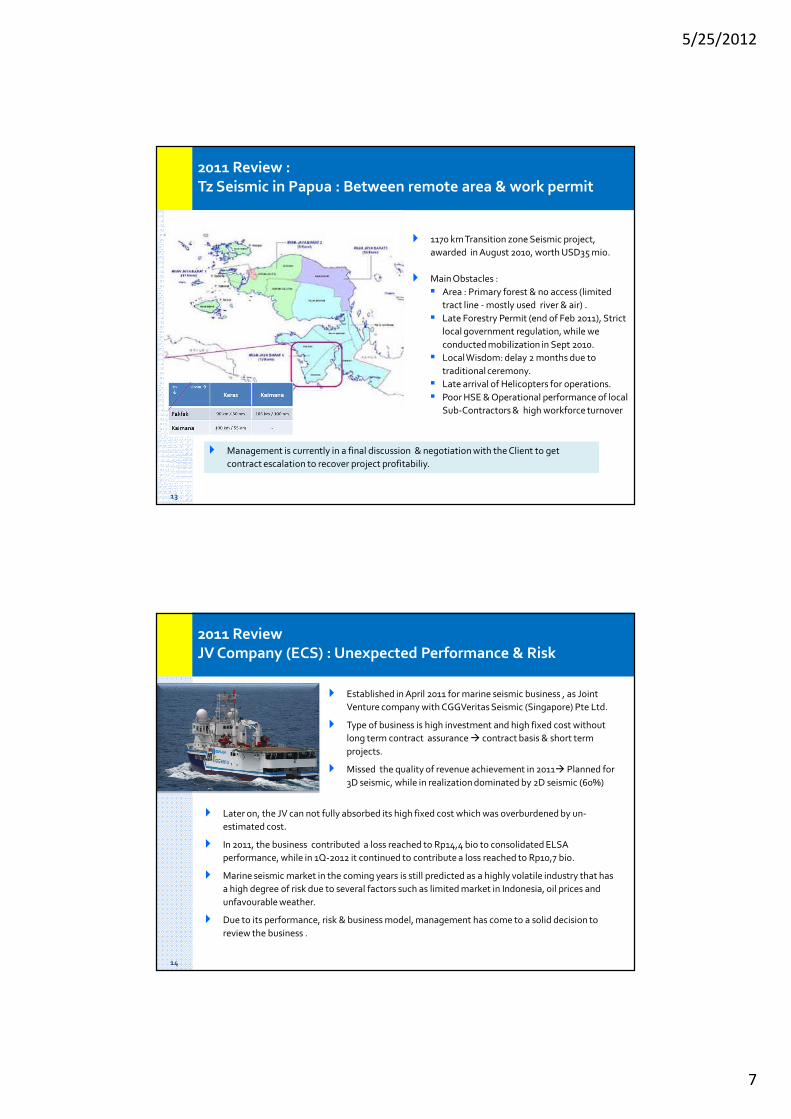
13
2011 Review :
Tz Seismic in Papua : Between remote area & work permit
� Management is currently in a final discussion & negotiation with the Client to get
contract escalation to recover project profitabiliy.
� 1170 km Transition zone Seismic project,
awarded in August 2010, worth USD35 mio.
� Main Obstacles :
� Area : Primary forest & no access (limited
tract line - mostly used river & air) .
� Late Forestry Permit (end of Feb 2011), Strict
local government regulation, while we
conducted mobilization in Sept 2010.
� Local Wisdom: delay 2 months due to
traditional ceremony.
� Late arrival of Helicopters for operations.
� Poor HSE & Operational performance of local
Sub-Contractors & high workforce turnover
14
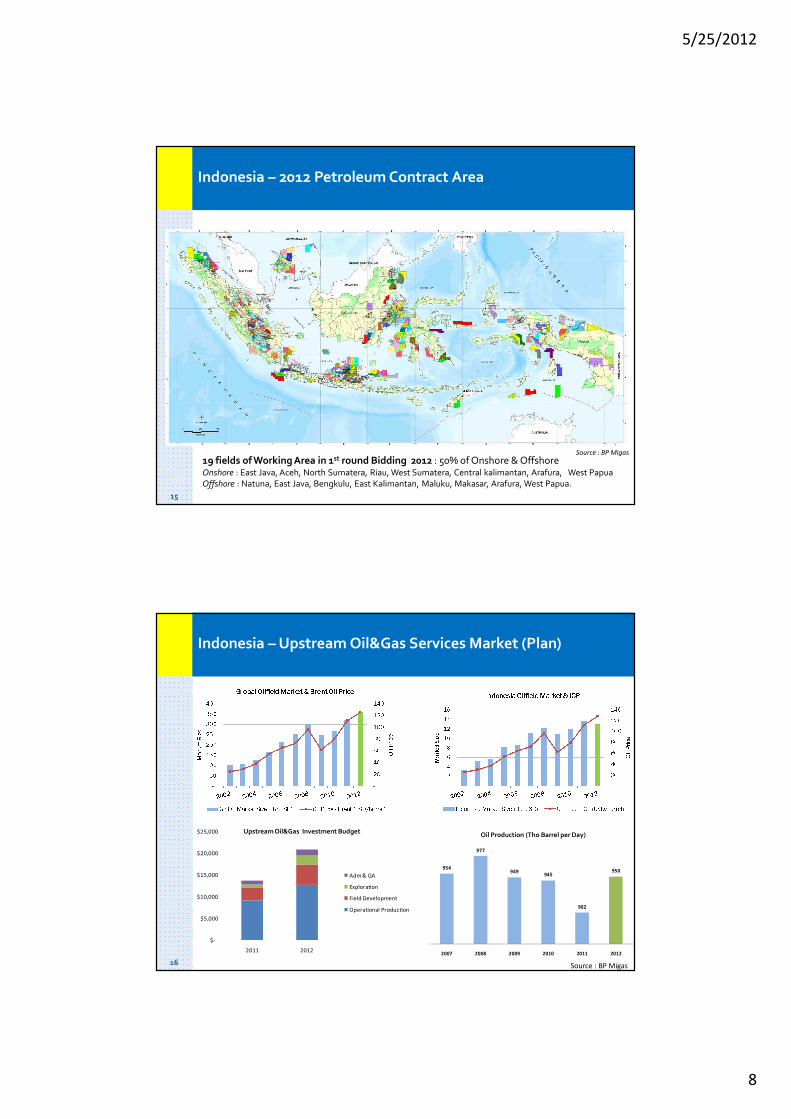
2011 Review
JV Company (ECS) : Unexpected Performance & Risk
� Established in April 2011 for marine seismic business , as Joint
Venture company with CGGVeritas Seismic (Singapore) Pte Ltd.
� Type of business is high investment and high fixed cost without
long term contract assurance � contract basis & short term
projects.
� Missed the quality of revenue achievement in 2011� Planned for
3D seismic, while in realization dominated by 2D seismic (60%)
� Later on, the JV can not fully absorbed its high fixed cost which was overburdened by un-
estimated cost.
� In 2011, the business contributed a loss reached to Rp14,4 bio to consolidated ELSA
performance, while in 1Q-2012 it continued to contribute a loss reached to Rp10,7 bio.
� Marine seismic market in the coming years is still predicted as a highly volatile industry that has
a high degree of risk due to several factors such as limited market in Indonesia, oil prices and
unfavourable weather.
� Due to its performance, risk & business model, management has come to a solid decision to
review the business .
5/25/2012
8
15
19 fields of Working Area in 1st round Bidding 2012 : 50% of Onshore & Offshore Onshore : East Java, Aceh, North Sumatera, Riau, West Sumatera, Central kalimantan, Arafura, West Papua
Offshore : Natuna, East Java, Bengkulu, East Kalimantan, Maluku, Makasar, Arafura, West Papua.
Indonesia – 2012 Petroleum Contract Area
Source : BP Migas
16
$-
$5,000
$10,000
$15,000
$20,000
$25,000
2011 2012
Adm & GA
Exploration
Field Development
Operational Production
Indonesia – Upstream Oil&Gas Services Market (Plan)
954
977
949945
902
950
2007 2008 2009 2010 2011 2012
Oil Production (Tho Barrel per Day) Upstream Oil&Gas Investment Budget
Source : BP Migas
5/25/2012
9
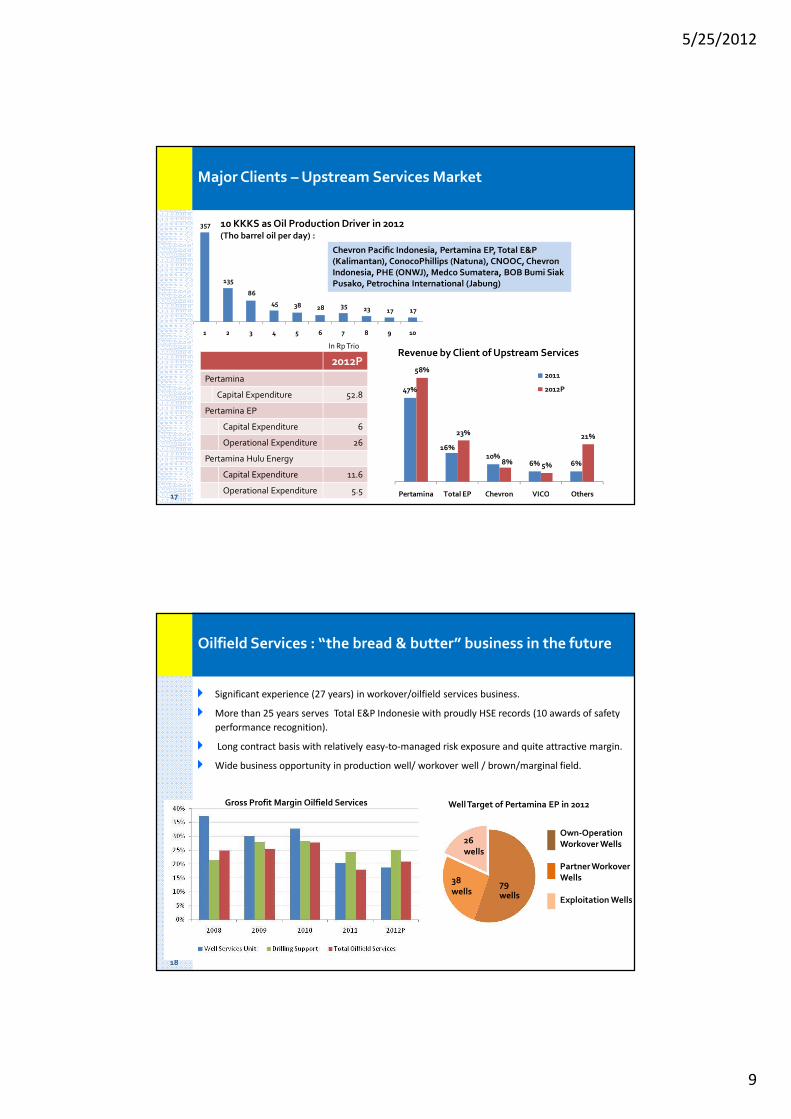
17
357
135
86
45 38 28 35 23 17 17
1 2 3 4 5 6 7 8 9 10
47%
16%10%
6% 6%
58%
23%
8% 5%
21%
Pertamina Total EP Chevron VICO Others
2011
2012P
Major Clients – Upstream Services Market
2012P
Pertamina
Capital Expenditure 52.8
Pertamina EP
Capital Expenditure 6
Operational Expenditure 26
Pertamina Hulu Energy
Capital Expenditure 11.6
Operational Expenditure 5.5
In Rp TrioRevenue by Client of Upstream Services
Chevron Pacific Indonesia, Pertamina EP, Total E&P
(Kalimantan), ConocoPhillips (Natuna), CNOOC, Chevron
Indonesia, PHE (ONWJ), Medco Sumatera, BOB Bumi Siak
Pusako, Petrochina International (Jabung)
10 KKKS as Oil Production Driver in 2012 (Tho barrel oil per day) :
18
79
wells
38
wells
26
wells
Oilfield Services : “the bread & butter” business in the future
Own-Operation
Workover Wells
Partner Workover
Wells
Exploitation Wells
Well Target of Pertamina EP in 2012
� Significant experience (27 years) in workover/oilfield services business.
� More than 25 years serves Total E&P Indonesie with proudly HSE records (10 awards of safety
performance recognition).
� Long contract basis with relatively easy-to-managed risk exposure and quite attractive margin.
� Wide business opportunity in production well/ workover well / brown/marginal field.
Gross Profit Margin Oilfield Services
5/25/2012
10
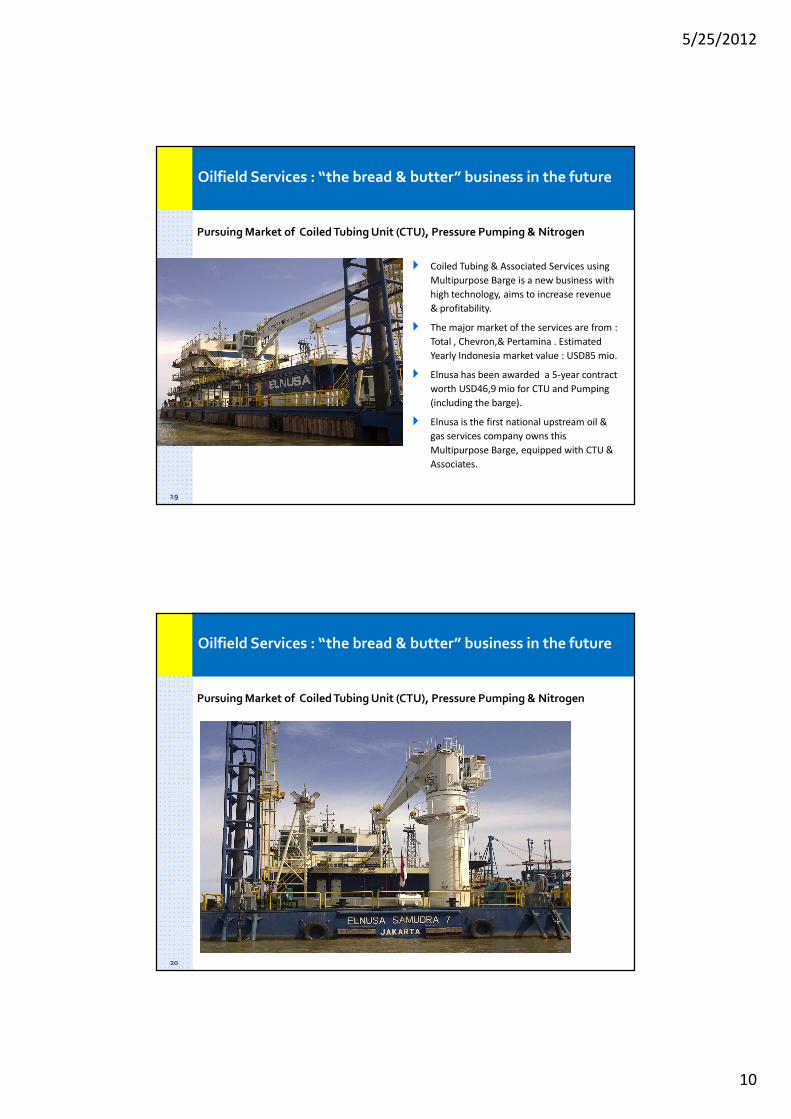
19
Oilfield Services : “the bread & butter” business in the future
Pursuing Market of Coiled Tubing Unit (CTU), Pressure Pumping & Nitrogen
� Coiled Tubing & Associated Services using
Multipurpose Barge is a new business with
high technology, aims to increase revenue
& profitability.
� The major market of the services are from :
Total , Chevron,& Pertamina . Estimated
Yearly Indonesia market value : USD85 mio.
� Elnusa has been awarded a 5-year contract
worth USD46,9 mio for CTU and Pumping
(including the barge).
� Elnusa is the first national upstream oil &
gas services company owns this
Multipurpose Barge, equipped with CTU &
Associates.
20
Oilfield Services : “the bread & butter” business in the future
Pursuing Market of Coiled Tubing Unit (CTU), Pressure Pumping & Nitrogen
5/25/2012
11
21
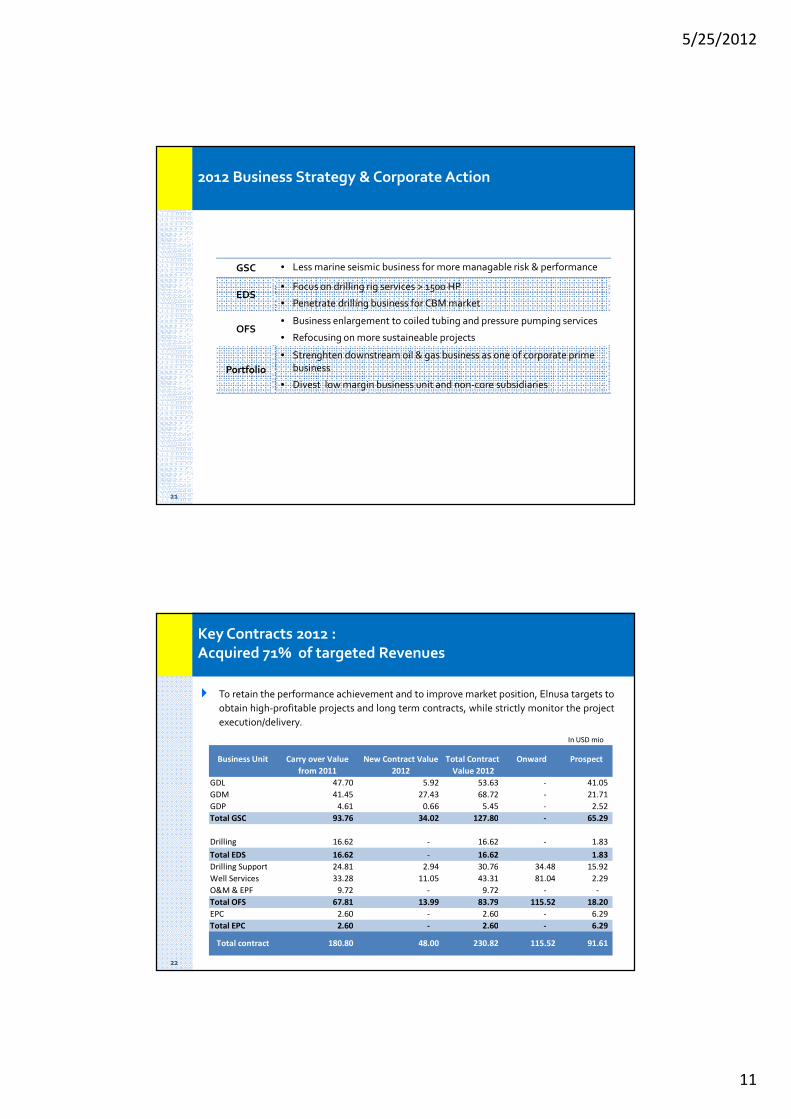
2012 Business Strategy & Corporate Action
GSC • Less marine seismic business for more managable risk & performance
EDS• Focus on drilling rig services > 1500 HP
• Penetrate drilling business for CBM market
OFS• Business enlargement to coiled tubing and pressure pumping services
• Refocusing on more sustaineable projects
Portfolio
• Strenghten downstream oil & gas business as one of corporate prime business
• Divest low margin business unit and non-core subsidiaries
22
Key Contracts 2012 :
Acquired 71% of targeted Revenues
� To retain the performance achievement and to improve market position, Elnusa targets to
obtain high-profitable projects and long term contracts, while strictly monitor the project
execution/delivery.
Business Unit Carry over Value New Contract Value Total Contract Onward Prospect
from 2011 2012 Value 2012
GDL 47.70 5.92 53.63 - 41.05
GDM 41.45 27.43 68.72 - 21.71
GDP 4.61 0.66 5.45 - 2.52
Total GSC 93.76 34.02 127.80 - 65.29
Drilling 16.62 - 16.62 - 1.83
Total EDS 16.62 - 16.62 1.83
Drilling Support 24.81 2.94 30.76 34.48 15.92
Well Services 33.28 11.05 43.31 81.04 2.29
O&M & EPF 9.72 - 9.72 - -
Total OFS 67.81 13.99 83.79 115.52 18.20
EPC 2.60 - 2.60 - 6.29
Total EPC 2.60 - 2.60 - 6.29
Total contract 180.80 48.00 230.82 115.52 91.61
In USD mio
5/25/2012
12
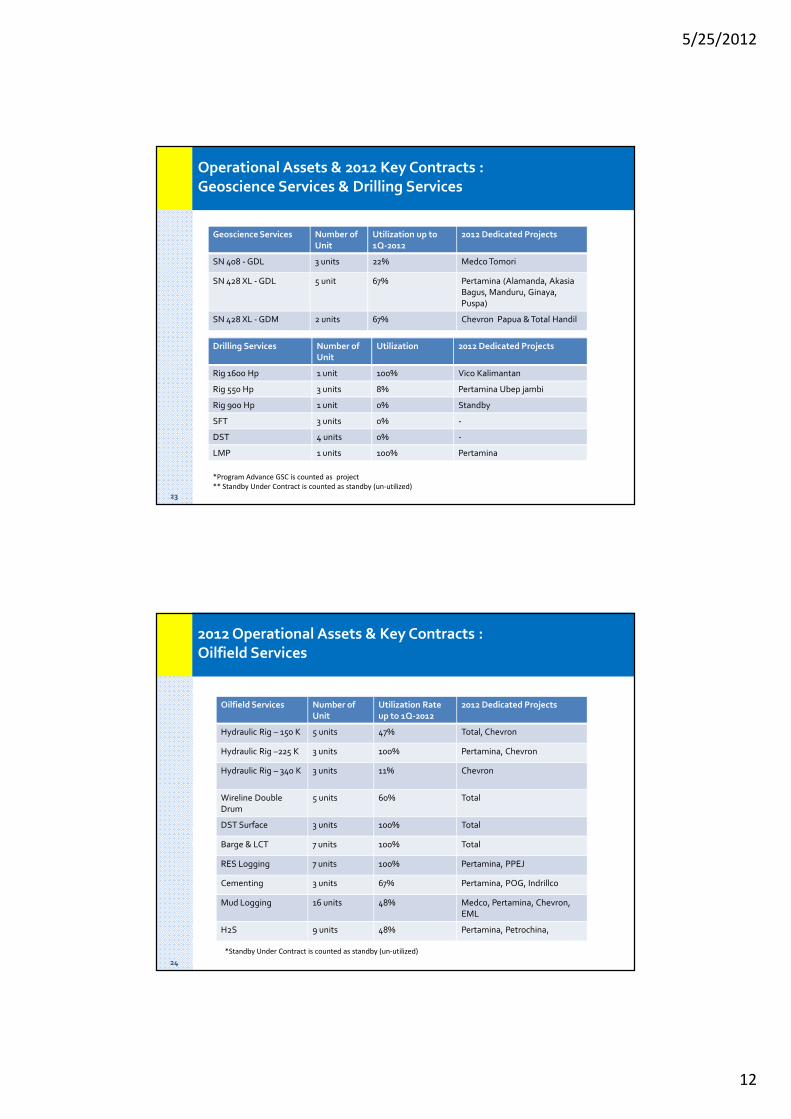
23
Operational Assets & 2012 Key Contracts :
Geoscience Services & Drilling Services
Geoscience Services Number of
Unit
Utilization up to
1Q-2012
2012 Dedicated Projects
SN 408 - GDL 3 units 22% Medco Tomori
SN 428 XL - GDL 5 unit 67% Pertamina (Alamanda, Akasia
Bagus, Manduru, Ginaya,
Puspa)
SN 428 XL - GDM 2 units 67% Chevron Papua & Total Handil
Drilling Services Number of
Unit
Utilization 2012 Dedicated Projects
Rig 1600 Hp 1 unit 100% Vico Kalimantan
Rig 550 Hp 3 units 8% Pertamina Ubep jambi
Rig 900 Hp 1 unit 0% Standby
SFT 3 units 0% -
DST 4 units 0% -
LMP 1 units 100% Pertamina
*Program Advance GSC is counted as project
** Standby Under Contract is counted as standby (un-utilized)
24
2012 Operational Assets & Key Contracts :
Oilfield Services
Oilfield Services Number of
Unit
Utilization Rate
up to 1Q-2012
2012 Dedicated Projects
Hydraulic Rig – 150 K 5 units 47% Total, Chevron
Hydraulic Rig –225 K 3 units 100% Pertamina, Chevron
Hydraulic Rig – 340 K 3 units 11% Chevron
Wireline Double
Drum
5 units 60% Total
DST Surface 3 units 100% Total
Barge & LCT 7 units 100% Total
RES Logging 7 units 100% Pertamina, PPEJ
Cementing 3 units 67% Pertamina, POG, Indrillco
Mud Logging 16 units 48% Medco, Pertamina, Chevron,
EML
H2S 9 units 48% Pertamina, Petrochina,
*Standby Under Contract is counted as standby (un-utilized)
5/25/2012
13
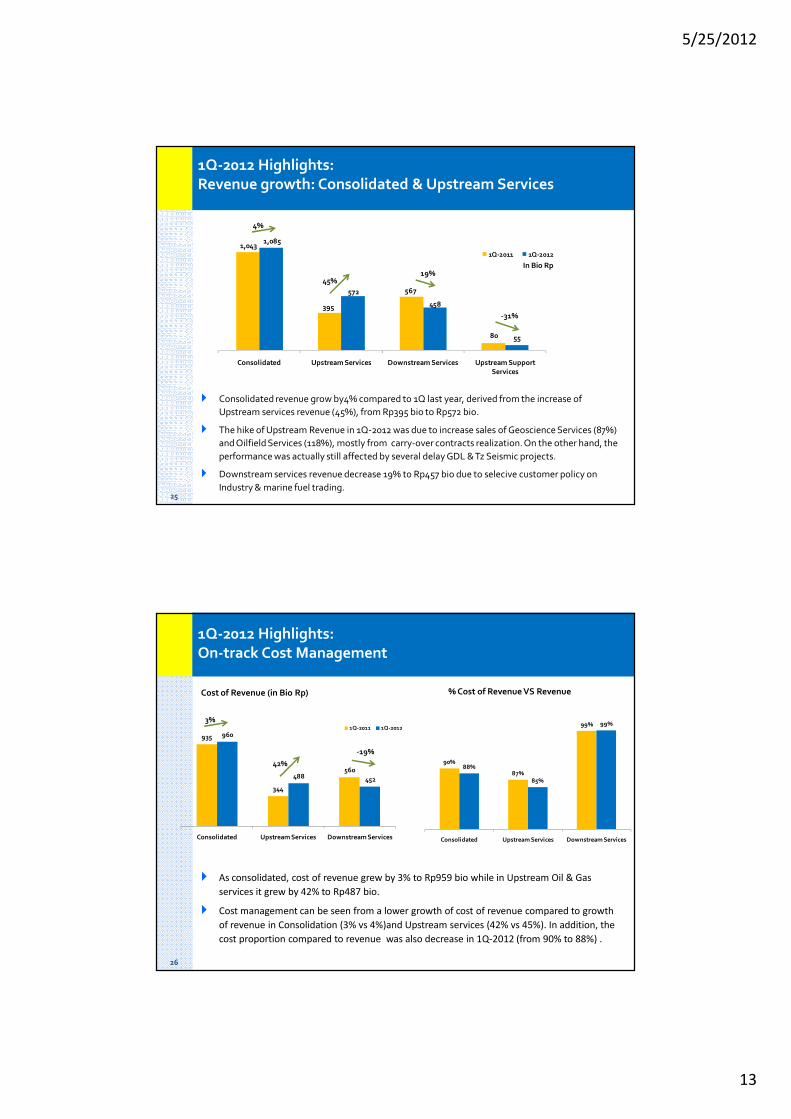
25
1,043
395
567
80
1,085
572
458
55
Consolidated Upstream Services Downstream Services Upstream Support
Services
1Q-2011 1Q-2012
1Q-2012 Highlights:
Revenue growth: Consolidated & Upstream Services
� Consolidated revenue grow by4% compared to 1Q last year, derived from the increase of
Upstream services revenue (45%), from Rp395 bio to Rp572 bio.
� The hike of Upstream Revenue in 1Q-2012 was due to increase sales of Geoscience Services (87%)
and Oilfield Services (118%), mostly from carry-over contracts realization. On the other hand, the
performance was actually still affected by several delay GDL & Tz Seismic projects.
� Downstream services revenue decrease 19% to Rp457 bio due to selecive customer policy on
Industry & marine fuel trading.
4%
45%
-31%
In Bio Rp19%
26
1Q-2012 Highlights:
On-track Cost Management
Cost of Revenue (in Bio Rp) % Cost of Revenue VS Revenue
� As consolidated, cost of revenue grew by 3% to Rp959 bio while in Upstream Oil & Gas
services it grew by 42% to Rp487 bio.
� Cost management can be seen from a lower growth of cost of revenue compared to growth
of revenue in Consolidation (3% vs 4%)and Upstream services (42% vs 45%). In addition, the
cost proportion compared to revenue was also decrease in 1Q-2012 (from 90% to 88%) .
90%
87%
99%
88%
85%
99%
Consolidated Upstream Services Downstream Services
935
344
560
960
488 452
Consolidated Upstream Services Downstream Services
1Q-2011 1Q-2012
3%
42%
-19%
5/25/2012
14
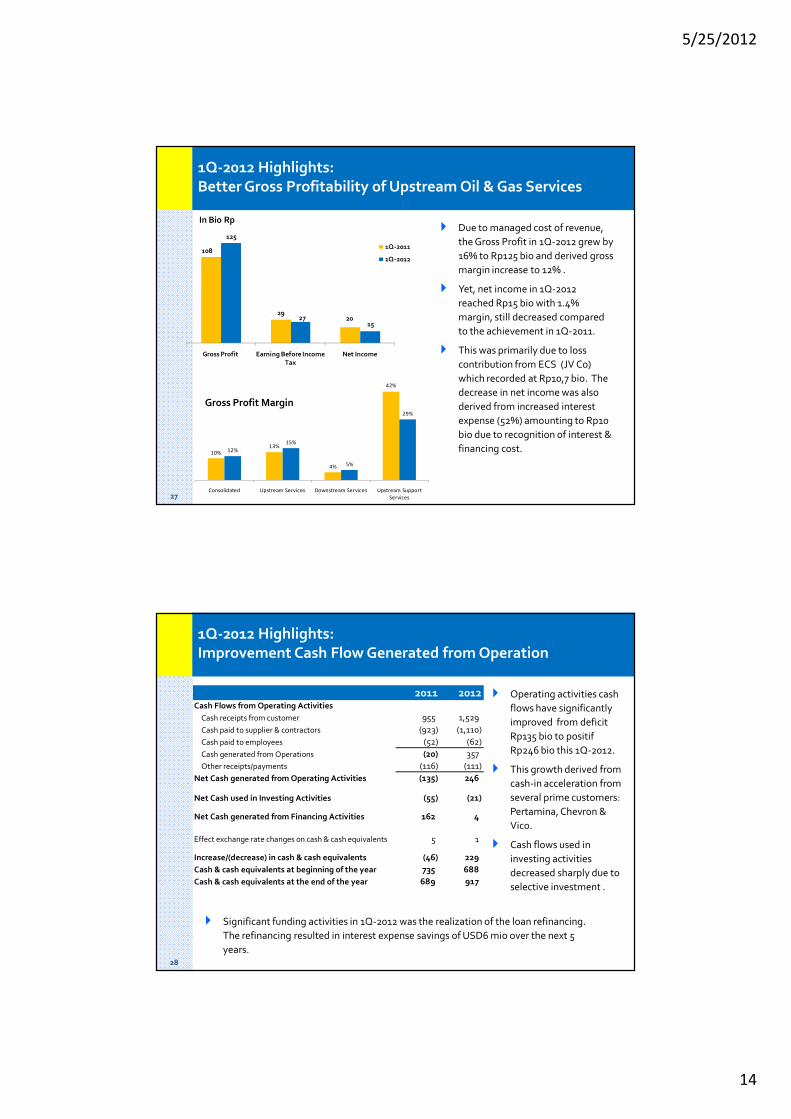
27
1Q-2012 Highlights:
Better Gross Profitability of Upstream Oil & Gas Services
� Due to managed cost of revenue,
the Gross Profit in 1Q-2012 grew by
16% to Rp125 bio and derived gross
margin increase to 12% .
� Yet, net income in 1Q-2012
reached Rp15 bio with 1.4%
margin, still decreased compared
to the achievement in 1Q-2011.
� This was primarily due to loss
contribution from ECS (JV Co)
which recorded at Rp10,7 bio. The
decrease in net income was also
derived from increased interest
expense (52%) amounting to Rp10
bio due to recognition of interest &
financing cost.
Gross Profit Margin
In Bio Rp
108
29 20
125
27 15
Gross Profit Earning Before Income
Tax
Net Income
1Q-2011
1Q-2012
10%13%
4%
42%
12%
15%
5%
29%
Consolidated Upstream Services Downstream Services Upstream Support
Services
28
1Q-2012 Highlights:
Improvement Cash Flow Generated from Operation
� Operating activities cash
flows have significantly
improved from deficit
Rp135 bio to positif
Rp246 bio this 1Q-2012.
� This growth derived from
cash-in acceleration from
several prime customers:
Pertamina, Chevron &
Vico.
� Cash flows used in
investing activities
decreased sharply due to
selective investment .
2011 2012Cash Flows from Operating Activities
Cash receipts from customer 955 1,529
Cash paid to supplier & contractors (923) (1,110)
Cash paid to employees (52) (62)
Cash generated from Operations (20) 357
Other receipts/payments (116) (111)
Net Cash generated from Operating Activities (135) 246
Net Cash used in Investing Activities (55) (21)
Net Cash generated from Financing Activities 162 4
Effect exchange rate changes on cash & cash equivalents 5 1
Increase/(decrease) in cash & cash equivalents (46) 229
Cash & cash equivalents at beginning of the year 735 688
Cash & cash equivalents at the end of the year 689 917
� Significant funding activities in 1Q-2012 was the realization of the loan refinancing.
The refinancing resulted in interest expense savings of USD6 mio over the next 5
years.
5/25/2012
15
29
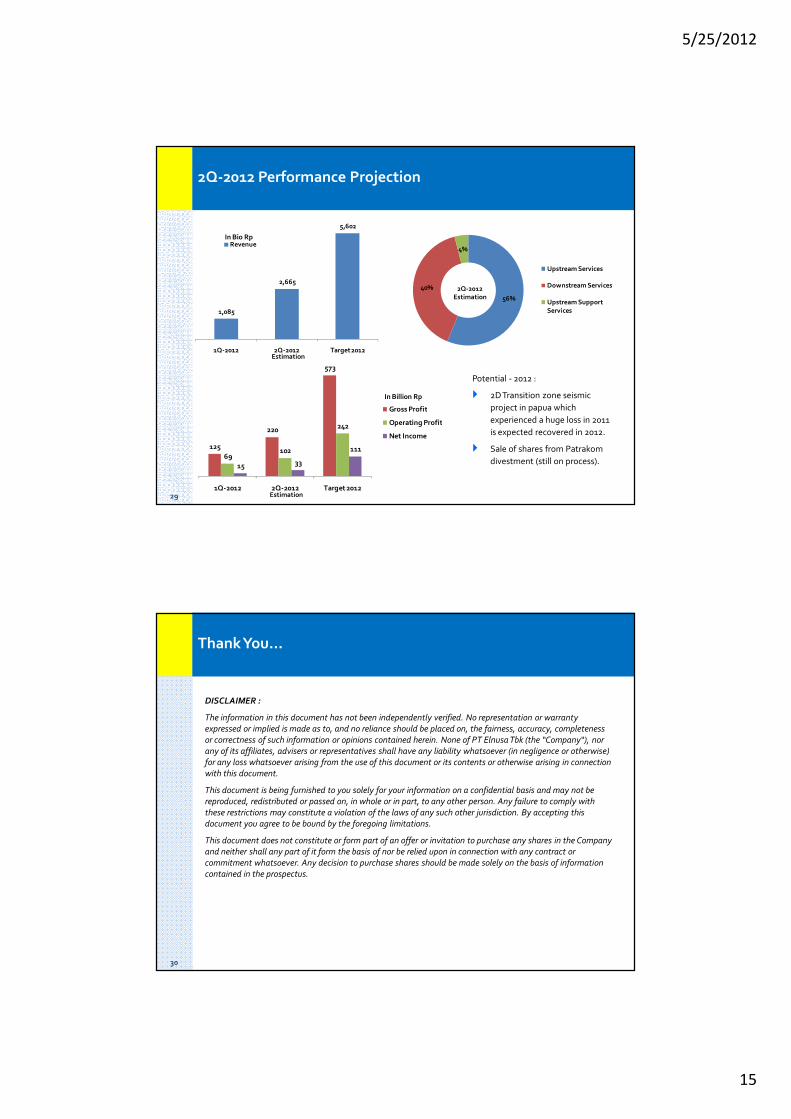
2Q-2012 Performance Projection
125
220
573
69 102
242
15 33
111
1Q-2012 2Q-2012 Target 2012
Gross Profit
Operating Profit
Net Income
1,085
2,665
5,602
1Q-2012 2Q-2012 Target 2012
Revenue
56%
40%
4%
Upstream Services
Downstream Services
Upstream Support
Services
Potential - 2012 :
� 2D Transition zone seismic
project in papua which
experienced a huge loss in 2011
is expected recovered in 2012.
� Sale of shares from Patrakom
divestment (still on process).
Estimation
Estimation
2Q-2012Estimation
In Bio Rp
In Billion Rp
30
Thank You…
DISCLAIMER :
The information in this document has not been independently verified. No representation or warranty
expressed or implied is made as to, and no reliance should be placed on, the fairness, accuracy, completeness
or correctness of such information or opinions contained herein. None of PT Elnusa Tbk (the “Company“), nor
any of its affiliates, advisers or representatives shall have any liability whatsoever (in negligence or otherwise)
for any loss whatsoever arising from the use of this document or its contents or otherwise arising in connection
with this document.
This document is being furnished to you solely for your information on a confidential basis and may not be
reproduced, redistributed or passed on, in whole or in part, to any other person. Any failure to comply with
these restrictions may constitute a violation of the laws of any such other jurisdiction. By accepting this
document you agree to be bound by the foregoing limitations.
This document does not constitute or form part of an offer or invitation to purchase any shares in the Company
and neither shall any part of it form the basis of nor be relied upon in connection with any contract or
commitment whatsoever. Any decision to purchase shares should be made solely on the basis of information
contained in the prospectus.
Recommended