Performance Review: FY2007
April 28, 2007

2
Agenda
Highlights
Operating Review
Financial Performance
Life Insurance
General Insurance

3
Highlights22% increase in profit after tax to Rs. 31.10 billion in FY2007 from Rs. 25.40 billion in FY2006
41% increase in net interest income to Rs. 66.36 billion in FY2007 from Rs. 47.09 billion in FY2006
45% increase in fee income to Rs. 50.12 billion in FY2007 from Rs. 34.47 billion in FY2006
Profit before general provisions and tax increased 40% to Rs. 13.69 billion in Q4-2007 from Rs. 9.75 billion in Q4-2006.
4.4% increase in profit after tax to Rs. 8.25 billion in Q4-2007 from Rs. 7.90 billion in Q4-2006
Pro
fitab
ility

4
Highlights34% growth in loan portfolio from Rs.1,461.63 bn to Rs. 1,958.66 bn
95% growth in loan portfolio of international branches from Rs. 125.24 bn to Rs. 244.10 bn39% growth in retail portfolio from Rs. 921.98 bn to Rs. 1,276.89 bn37% growth in rural & agricultural portfolio from Rs. 146.87 bn to Rs. 201.79 bn
Deposit growth of 40% from Rs. 1,650.83 bn to Rs. 2,305.10 bn
Net NPA ratio at 0.98% at March 31, 2007 compared to 0.71% at March 31, 2006
Bal
ance
she
et

5
Capital raisingThe Board of Directors of the Bank authorised equity capital raising through a public offering in India and an ADR offering in the United States, subject to necessary approvals
Size of the offering expected to be Rs. 200.00 billion (US$ 5 billion)
Need for capital raisingContinued growth momentum in economy and banking business
Strong demand for financing/ underwriting from corporate sectorContinued retail lending potential
Substantial increase in capital requirements in incremental business due to regulatory changes

6
Agenda
Highlights
Operating Review
Financial Performance
Life Insurance
General Insurance

7
Retail bankingMaintained market leadership in retail creditAchieved robust growth despite challenging environmentDemonstrated pricing power
Maintained market leadership in retail creditAchieved robust growth despite challenging environmentDemonstrated pricing power
Deposits
Credit
Fee income
Fully leveraging liability franchise and technology channelsHigh incremental deposit market share despite lean branch infrastructureMerger of Sangli Bank and branch rollout in Q4-2007 expected to enhance deposit franchise
Fully leveraging liability franchise and technology channelsHigh incremental deposit market share despite lean branch infrastructureMerger of Sangli Bank and branch rollout in Q4-2007 expected to enhance deposit franchise
Diversified fee income streams: loans, cards, transaction banking & distributionSuccessful insurance cross-sell initiatives
Diversified fee income streams: loans, cards, transaction banking & distributionSuccessful insurance cross-sell initiatives

8
Corporate & investment bankingHigh capacity utilisation leading to investment pipeline of about US$ 500 billionStrong corporate performance with high cash accruals supporting investment plansExpanding global presence
High capacity utilisation leading to investment pipeline of about US$ 500 billionStrong corporate performance with high cash accruals supporting investment plansExpanding global presence
Strategy
Opportunity
Leadership
Building an integrated franchise: origination to syndication across marketsProject and M&A advisory, structuring and financing expertiseStrong syndication & distribution capability
Building an integrated franchise: origination to syndication across marketsProject and M&A advisory, structuring and financing expertiseStrong syndication & distribution capability
Lead Arranger for over 50% of outbound M&A financing deals#1 arranger of ECBs for Indian corporatesLead arranged project financing of Rs. 217 bn
Lead Arranger for over 50% of outbound M&A financing deals#1 arranger of ECBs for Indian corporatesLead arranged project financing of Rs. 217 bn
9
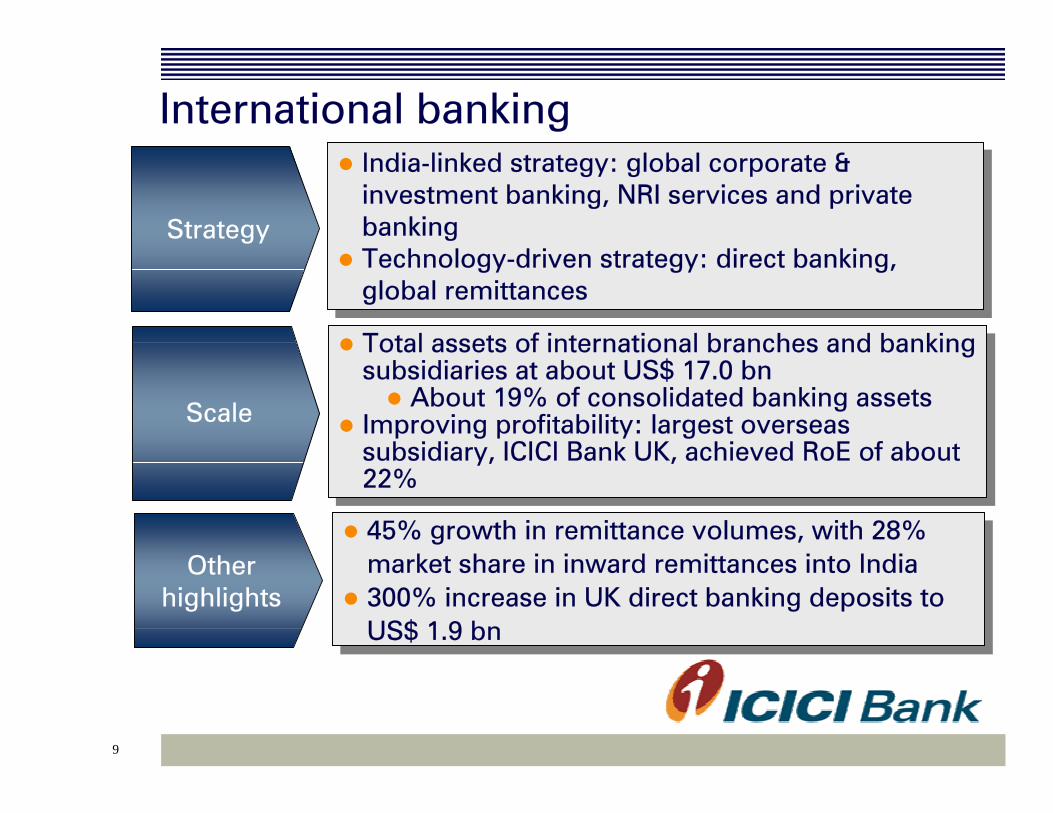
International bankingIndia-linked strategy: global corporate & investment banking, NRI services and private bankingTechnology-driven strategy: direct banking, global remittances
India-linked strategy: global corporate & investment banking, NRI services and private bankingTechnology-driven strategy: direct banking, global remittances
Scale
Strategy
Other highlights
Total assets of international branches and banking subsidiaries at about US$ 17.0 bn
About 19% of consolidated banking assetsImproving profitability: largest overseas subsidiary, ICICI Bank UK, achieved RoE of about 22%
Total assets of international branches and banking subsidiaries at about US$ 17.0 bn
About 19% of consolidated banking assetsImproving profitability: largest overseas subsidiary, ICICI Bank UK, achieved RoE of about 22%
45% growth in remittance volumes, with 28% market share in inward remittances into India300% increase in UK direct banking deposits to US$ 1.9 bn
45% growth in remittance volumes, with 28% market share in inward remittances into India300% increase in UK direct banking deposits to US$ 1.9 bn

10
Rural banking
Multi-product suite for catering to various customer segmentsHybrid channel strategy: branches, partnerships & technology based delivery
Multi-product suite for catering to various customer segmentsHybrid channel strategy: branches, partnerships & technology based delivery
Credit growth
Strategy
Rollout status
37% increase in rural portfolio to Rs. 201.80 bnComprehensive review of products and process undertaken to mitigate risks associated with new delivery models
37% increase in rural portfolio to Rs. 201.80 bnComprehensive review of products and process undertaken to mitigate risks associated with new delivery models
“No White Spaces” (NWS) strategy under implementation in 170 districts28 districts with over 75% NWS implementationAbout 11,500 customer touch points
“No White Spaces” (NWS) strategy under implementation in 170 districts28 districts with over 75% NWS implementationAbout 11,500 customer touch points

11
Agenda
Highlights
Operating Review
Financial Performance
Life Insurance
General Insurance

12
Profit & loss statement
16.08
0.44
4.23
14.54
35.28
2.27
14.27
16.54
18.75
Q4-2007
58.59
1.88
15.24
49.79
125.49
9.02
50.12
59.14
66.36
FY 2007
39.51
2.77
11.77
35.47
89.52
7.96
34.47
42.43
47.09
FY 2006
29.4%15.7%3.65 DMA2 expenses
48.3%
(32.0%)
40.4%
40.2%
13.3%
45.4%
39.4%
40.9%
Y-o-YGrowth
34.0%
(39.5%)
37.5%
30.9%
4.8%
29.1%
25.2%
36.4%
Q4-o-Q4 growth
12.00 Core operating profit
0.73 Lease depreciation
10.57 Operating expenses
26.95 Core operating income
2.16 - Others
11.05 - Fee income1
13.21 Non-interest income
13.74 NII
Q4-2006
(Rs. in billion)
1. Includes merchant forex income and margin on customer derivative transactions
2. Represents commissions paid to direct marketing agents (DMAs) for originationof retail loans. These commissions are expensed upfront

13
Profit & loss statement
230.1%14.954.5359.3%4.192.63 Specific prov & w-off1
27.4%43.79 34.36 40.4%13.69 9.75 Profit before GP and tax
115.6%7.3133.39 402.2%4.5720.91 General provision (GP)
24.6%9.99 8.02 9.3%2.66 2.43 Less: Premium amort on SLR
4.4%
(8.0%)
3.2%
44.4%
58.7%
34.0%
Q4-o-Q4 growth
31.10
5.38
36.48
58.74
10.14
58.59
FY 2007
22.4%
(3.4%)
17.8%
51.1%
37.0%
48.3%
Y-o-YGrowth
7.90
0.94
8.84
12.38
2.81
12.00
Q4-2006
25.40
5.57
30.97
38.88
7.40
39.51
FY2006
9.12 Profit before tax
16.08 Core op profit
4.46 Treasury income
8.25 Profit after tax
0.87 Tax
17.88Operating profit
Q4-2007
(Rs. in billion)
1. Net of write backs2. Includes impact of about Rs. 3.10 bn due to increase in GP to 2% on certain
categories of loans3. Includes impact of about Rs. 5.55 bn due to
increase in GP during the year

14
Balance sheet: Assets
3,446.58
204.13
238.90
1,958.66
673.68
371.21
1,044.89
Mar 31, 2007
37.1%
22.7%
16.7%
34.0%
31.9%
117.8%
53.4%
Y-o-Y growth
2,958.32
187.17
219.24
1,727.63
576.09
248.19
824.28
Dec 31, 2006
2,513.89
166.38
204.73
1,461.63
510.75
170.40
681.15
Mar 31, 2006
Total assets
Fixed & other assets
Other investments
Advances
- SLR investments
- Cash & bank balances
Cash balances with banks & SLR
(Rs. in billion)
15
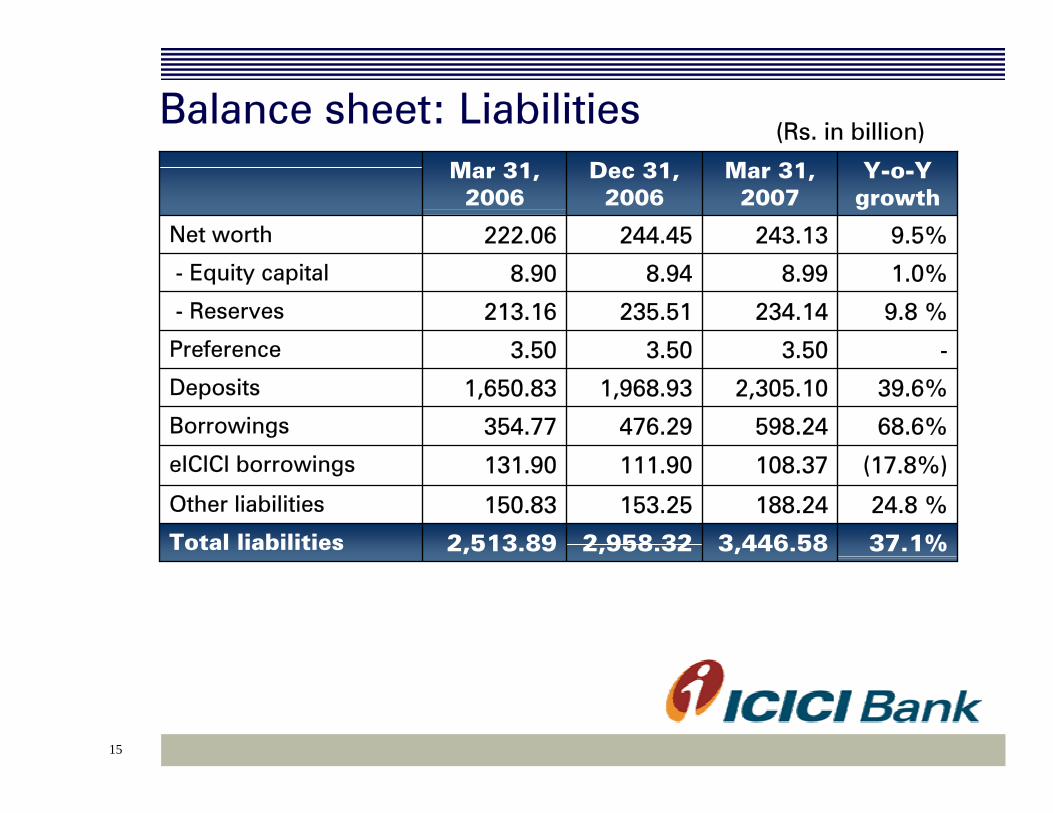
Balance sheet: Liabilities
2,958.32
153.25
111.90
476.29
1,968.93
3.50
235.51
8.94
244.45
Dec 31, 2006
37.1%
24.8 %
(17.8%)
68.6%
39.6%
-
9.8 %
1.0%
9.5%
Y-o-Y growth
598.24 354.77 Borrowings
2,513.89
150.83
131.90
1,650.83
3.50
213.16
8.90
222.06
Mar 31, 2006
3,446.58
188.24
108.37
2,305.10
3.50
234.14
8.99
243.13
Mar 31, 2007
Total liabilities
Other liabilities
eICICI borrowings
Deposits
Preference
- Reserves
- Equity capital
Net worth
(Rs. in billion)

16
Capital adequacy
4.271
7.42
11.691
%
2,899.93
123.93
215.03
338.96
Rs. bn
Mar 31, 2007
2,085.94Risk weighted assets
4.1586.61 - Tier II
9.20191.82 - Tier I
13.35278.43 Total Capital
%Rs. bn
Mar 31, 2006
1. Foreign currency bonds of US$ 750 million raised for Upper Tier II capital excluded from Tier II capital pending clarification required by RBI regarding certain terms of these bonds. Including these bonds, total capital adequacy ratio would be 12.81%.

17
Key ratios
40.0
1.80
41.2
2.742
248.6
32.5
16.4
FY2006
269.8269.8248.6Book value (Rs.)
41.5
1.88
39.7
2.79
35.7
14.5
Q4-2006
38.9
1.88
39.7
2.66
37.3
13.8
Q4-2007
1.75Cost3 to average assets
40.5Fee to income
40.2Cost3 to income
2.57NIM
34.8Weighted avg EPS (Rs.)
13.41Return on average networth
FY2007
(Percent)
1. RoE including profit of banking subsidiaries and excluding investment in insurance subsidiaries was 15.5%
2. NIM excluding sell down gains was 2.47%3. Excludes DMA expenses

18
0.98%
20.19
28.31
48.50
Mar 31, 2007
0.71%
10.75
18.88
29.63
Mar 31, 2006
Net NPA ratio
Net NPAs
Less: Cumulative w/offs & provisions
Gross NPAs
Asset quality and provisioning(Rs. in billion)
Gross retail NPLs as on Mar 31, 2007: Rs. 30.90 bn (of which 54% were non-collateralised) Net NPLs in home loan portfolio as on March 31, 2007: 0.71%Net retail NPLs as on Mar 31, 2007: Rs. 15.12 bn (of which 47% were non-collateralised)Net restructured loans: Rs. 48.83 bn (Mar 31, 2006: Rs. 53.16 bn)
19
Agenda
Highlights
Operating Review
Financial Performance
Life Insurance
General Insurance

20
Key highlights: FY2007Sustained market leadership in the private sector with a retail market share of 29.1%1
Overall market share of 10%
103% growth in Annualised Premium Equivalent (APE) to Rs 43.81 billion in FY 2007
67% growth in New Business Achieved Profit (NBAP) to Rs 8.81 billion in FY 2007
Distribution expansionBranch network from 177 at March 31, 2006 to 583 at March 31, 2007Advisor force from 72,000 at March 31, 2006 to 234,000 at March 31, 2007
1. Weighted Received Premium for 11m FY 2007; Source: IRDA

21
Market share: Private market
Max NYL, 6.0%
Birla Sun Life, 5.0%
AVIVA Life, 5.0%
Reliance Life, 4.6%
SBI Life, 8.2%
Others, 13.3%
HDFC Std, 9.3%
Bajaj Allianz , 19.6%
ICICI Pru, 29.1%
Retail1
Pvt mkt: Rs 107.54 bn
ICICI - Pru, 37.8%
SBI Life, 29.8%
Others, 5.0%Reliance Life,
1.9%Om Kotak, 2.6%
Birla Sun Life, 5.3%
Tata AIG, 5.5%
HDFC Std, 12.1%
Group
Pvt mkt: Rs 16.23 bn
1. Retail weighted received premium2. Source : IRDA , 11m FY 2007

22
Growth in new business
2.54
7.06
12.56
21.63
43.81
0.00
5.00
10.00
15.00
20.00
25.00
30.00
35.00
40.00
45.00
50.00
Rs
bn
FY 03 FY 04 FY 05 FY 06 FY07
103% growth in APE* in FY 2007 to over USD 1bn* Annualized Premium Equivalent
4 year CAGR - 104%

23
Financial performance
0.430.16Deferred Tax
(6.49)
(69.06)
(10.64)(9.84)(0.93)
4.45
79.1351.6227.50
FY 2007
(1.87)Profit / Loss (net of tax)
(36.28)Transfer to Reserves
(4.96)(5.10)(0.38)
Cost of acquisitionOperating expensesClaims/Benefits
2.09Investment & Other Income
42.5926.0216.57
Premium Income- New Business Premium- Renewal Business Premium
FY 2006Rs bn
Life insurance companies in high growth phase make accounting losses due to customer acquisition and business set-up costs, and reserving for actuarial liability

24
New Business Achieved Profit (NBAP)Metric for the economic value of new business written in a defined period
Measured as the present value of the future profits for the shareholders on account of new business sales, based on a set of assumptions
Actual experience could differ from these assumptions especially in respect of expense over runs in the initial years
Calculated net of tax after providing for the cost of capital that would be required to support the business

25
Value creation: NBAP
0.71
2.04
3.12
5.28
8.81
0.001.002.003.004.005.006.007.008.009.00
10.00
Rs
bn
FY 03 FY 04 FY 05 FY 06 FY 07
67% growth in NBAP* in FY 2007
* New Business Achieved Profit
4 year CAGR - 88%

26
Growth in assets held
Strong renewal flows leading to expanding asset base
6.6616.63
38.31
88.21
158.18
0.00
20.00
40.00
60.00
80.00
100.00
120.00
140.00
160.00
Rs
bn
FY 03 FY 04 FY 05 FY 06 FY 07
4 year CAGR 121%

27
Growth in customer base
0
1
2
3
4
0.00
0.50
1.00
1.50
2.00
2.50
3.00
3.50
4.00
4.50
Mn
Dec 00 Oct 04 Feb 06 Oct 06 Mar 07
16 months
8 months
44 months
5 months
Robust expansion of policy base

28
Distribution expansionWe continue to create a nationwide agency network,
complemented by increased focus on non-agency distribution
Advisors
Non agency share
Branches
Locations
Mar 06 Mar 07
132 421
177 583
72,000 234,000
37% 39%
Flat expense ratio despite expansion
29
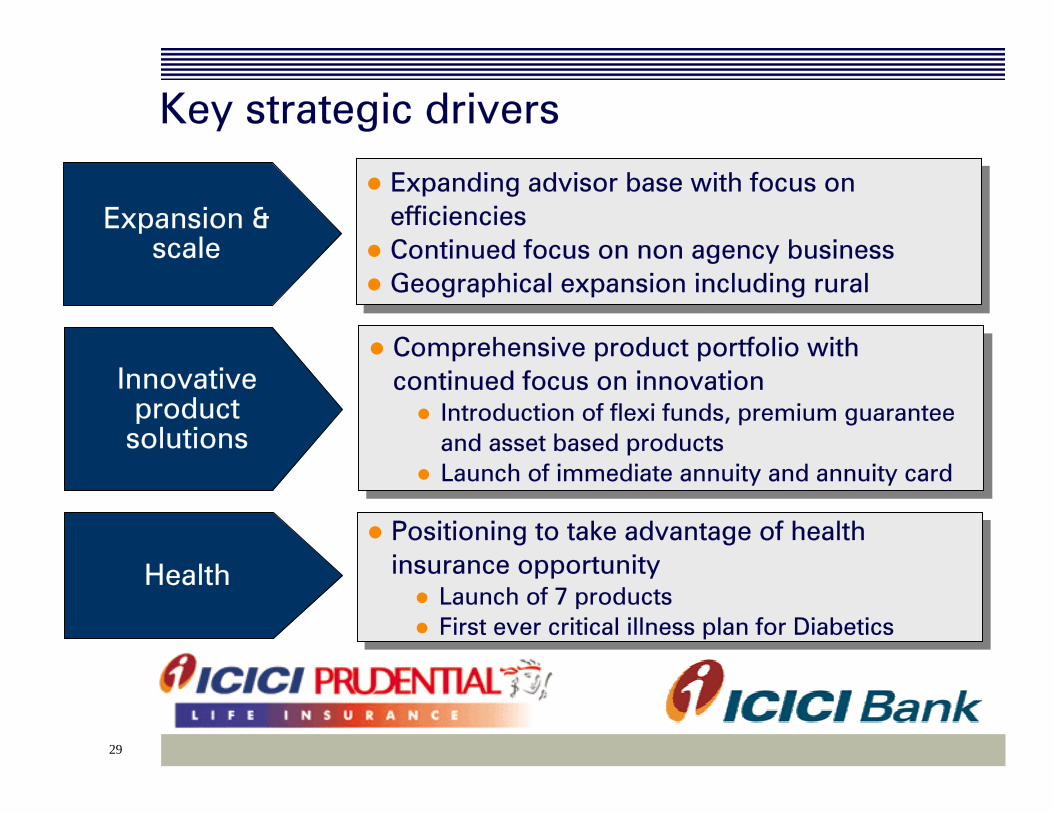
Key strategic drivers
Expanding advisor base with focus on efficiencies Continued focus on non agency businessGeographical expansion including rural
Expanding advisor base with focus on efficiencies Continued focus on non agency businessGeographical expansion including rural
Expansion & scale
Comprehensive product portfolio with continued focus on innovation
Introduction of flexi funds, premium guarantee and asset based productsLaunch of immediate annuity and annuity card
Comprehensive product portfolio with continued focus on innovation
Introduction of flexi funds, premium guarantee and asset based productsLaunch of immediate annuity and annuity card
Innovative product
solutions
Positioning to take advantage of health insurance opportunity
Launch of 7 productsFirst ever critical illness plan for Diabetics
Positioning to take advantage of health insurance opportunity
Launch of 7 productsFirst ever critical illness plan for Diabetics
Health

30
Agenda
Highlights
Operating review
Financial performance
Life insurance
General insurance

31
Key highlightsContinuing scale up of operations:
Achieved gross premium milestone > Rs. 30 bn
Consolidated market shareMarket share (industry) > 12% 1
Market share (private sector) > 33%1
Maintained consistent track record of profitability and dividend payment
Focus on enhancement of distribution franchiseCrossed 3 million policies in a year
1. Source: IRDA (Apr 06 – Feb 07)

Industry snapshot Rs. bn
Source: IRDA Journal
CompanyGWP
FY 03-04 GWP
FY 04-05 GWP
FY 05-06 GWP
YTD Feb-07 ICICI Lombard 5.07 8.85 15.92 28.03 Bajaj Allianz 4.76 8.53 12.88 16.21 Iffco Tokio 3.25 5.07 8.96 10.70 Reliance 1.61 1.62 1.62 8.04 Tata AIG 3.55 4.69 6.12 6.87 Royal Sundaram 2.58 3.32 4.54 5.43 Cholamandalam 0.97 1.70 2.20 2.83 HDFC Chubb 1.12 1.78 2.02 1.70 Private Sector Total 22.91 35.55 54.27 79.81 Private Sector % 15% 20% 27% 35%New India 40.28 42.07 47.62 45.06 Oriental 28.69 30.38 35.19 35.96 National 34.17 38.25 35.24 34.28 United 30.68 29.52 31.47 31.58 Public Sector Total 133.83 140.22 149.52 146.88 Public Sector % 85% 80% 73% 65%IL as % of Total 3.2% 5.0% 7.8% 12.4%IL as % of Pvt Sector 22% 25% 29% 35%

33
13.35
6.594.56 4.00
2.91 3.21 3.08 2.26 1.36 1.47 0.74-0.070.002.004.006.008.00
10.0012.0014.0016.00
ICIC
I Lom
bard
Rel iance G
ene ral
Bajaj A
l l ianz
Orie
n tal
IFFCO
-Toki
o
Uni t ed In
diaNew
Ind ia
National
Royal Sundara
mTat
a-AIG
Cholam
andalam
HDFC Chubb
Rs. b
nShare of growth in market
1. Source : IRDA (Apr 06 – Feb 07)
ICICI Lombard accounted for 31% of industry growth and 43% of private sector growth1

34
Changing business mix
44:5654:4672:2289:11Wholesale:Retail
16.717.302.510.55GWP – Retail group
13.328.626.344.52GWP – Wholesale group
88%80%75%134%Growth over previous year
30.0415.928.855.07Gross written premium
2007200620052004Year ending March 31,

Key indicators
95%
25 days
7.68
243,951
1,461,039
2,283
154
2006
96%
22 days
11.64
642,777
3,136,478
4,770
220
2007
90,69126,457Claims handled
2.621.21Claims paid Rs. bn
25 days26 daysAverage claim settlement time
94%89%Claim disposal ratio
607,926249,531Policies issued
1,249560Employees
9663Offices
20052004Indicators

Key financial highlights
Particulars - in Rs bn FY2006 FY2007
Gross written premium 15.92 30.03
Net written premium 7.34 14.51
Profit after tax 0.50 0.68
Combined ratio 97% 97%
The surplus based on the combined ratio and investment income aggregated Rs. 1.80 billion on a pre-tax basis in FY2007

37
This release does not constitute an offer of securities for sale in the United States. Securities may not be offered or sold in theUnited States unless they are registered under applicable law orexempt from registration. ICICI Bank Limited intends to make an offering of registered securities in the United States. Any public offering of securities to be made in the United States will be made by means of a prospectus that may be obtained from ICICI Bank Limited and will contain detailed information about ICICI Bank Limited and its management, as well as financial statements. No money, securities or other consideration is being solicited, and, if sent in response to the information contained herein, will not be accepted. ICICI Bank Limited intends to register for sale in theUnited States an offering of its securities.

38
Except for the historical information contained herein, statements in this Release which contain words or phrases such as 'will', 'would', ‘indicating’, ‘expected to’ etc., and similar expressions or variations of such expressions may constitute 'forward-looking statements'. These forward-looking statements involve a number of risks, uncertainties and other factors that could cause actual results to differ materially from those suggested by the forward-looking statements. These risks and uncertainties include, but are not limited to our ability to successfully implement our strategy, future levels of non-performing loans, our growth and expansion in business, the adequacy of our allowance for credit losses, technological implementation and changes, the actual growth in demand for banking products and services, investment income, cash flow projections, our exposure to market risks as well as other risks detailed in the reports filed by us with the United StatesSecurities and Exchange Commission. ICICI Bank undertakes no obligation to update forward-looking statements to reflect events or circumstances after the date thereof.
39
Thank you

40
Combined ratioParticulars
in Rs.Policy
inception Month 2Month 3 to 12
Policy end
Premium 100 - - 100NEP 8 8 83 100 Claims (60%) (5) (5) (50) (60) Commissions (15) - - (15) Operating expenses (20) - - (20) U/w result (32) 3 33 5 Combined ratio 95% 95%
Combined ratio of 95% at policy inception will result in underwriting surplus of Rs. 5 at the end of policy
Recommended