Performance Programming Process
P3
Montana’s Approach to Asset Management
Sandra Straehl, Chief Program & Policy Analysis Bureau
Montana Department of TransportationSeptember 24, 2001
2
P3:
A method to develop an optimal funding allocation and investment plan based on
strategic highway system performance goals, and the continual measurement of progress
towards these goals.
3
Montana’s Transportation Context
• Highway Oriented
• Efficiencies of Scale mean some centralizations
• -Districts Nominate Projects-Hqtr. Finalizes Program/Develops Projects
• No TMAs
• About 70% of overall program can be allocated and prioritized through P3 -
-30% distributed by formula
• Many tools in place before P3 analysis:-relational data sets (oracle environment)-management systems in place-linear referencing and GIS in place
4
156910141516222632343840414949515959647575767985869699100
127132132132
155164171173186
209217
268274276
381385
525676
784945
1094
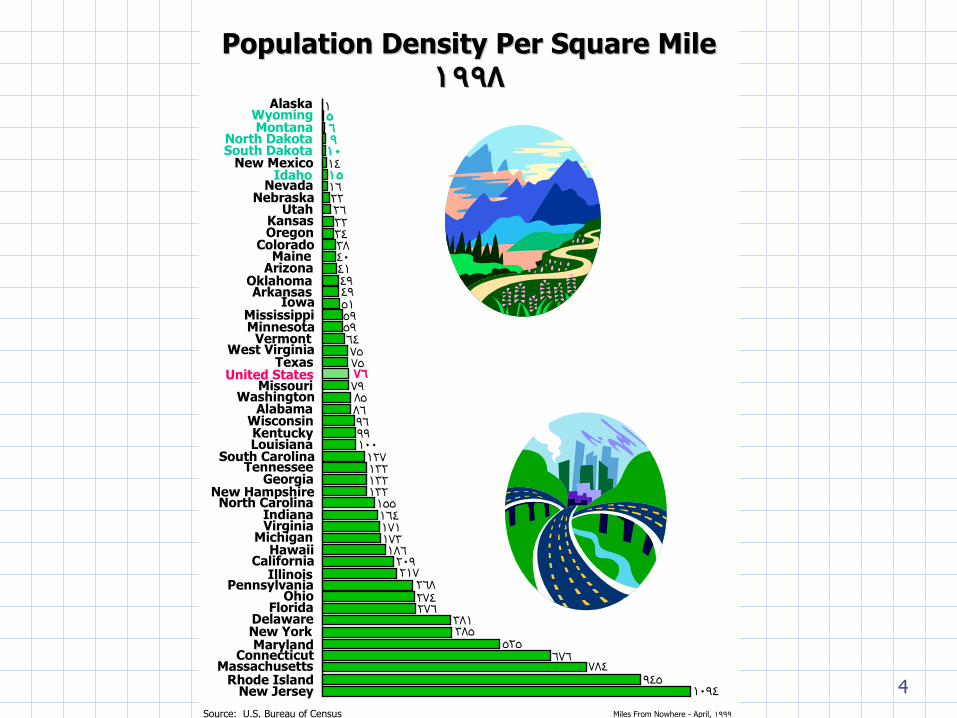
AlaskaWyomingMontana
North DakotaSouth Dakota
New MexicoIdaho
Nevada Nebraska
UtahKansasOregon
ColoradoMaine
ArizonaOklahomaArkansas
IowaMississippiMinnesota
VermontWest Virginia
TexasUnited States
MissouriWashington
AlabamaWisconsinKentuckyLouisiana
South CarolinaTennessee
GeorgiaNew Hampshire
North CarolinaIndianaVirginia
MichiganHawaii
CaliforniaIllinois
PennsylvaniaOhio
FloridaDelawareNew YorkMaryland
ConnecticutMassachusetts
Rhode IslandNew Jersey
Population Density Per Square MilePopulation Density Per Square Mile19981998
Source: U.S. Bureau of Census Miles From Nowhere - April, 1999
5
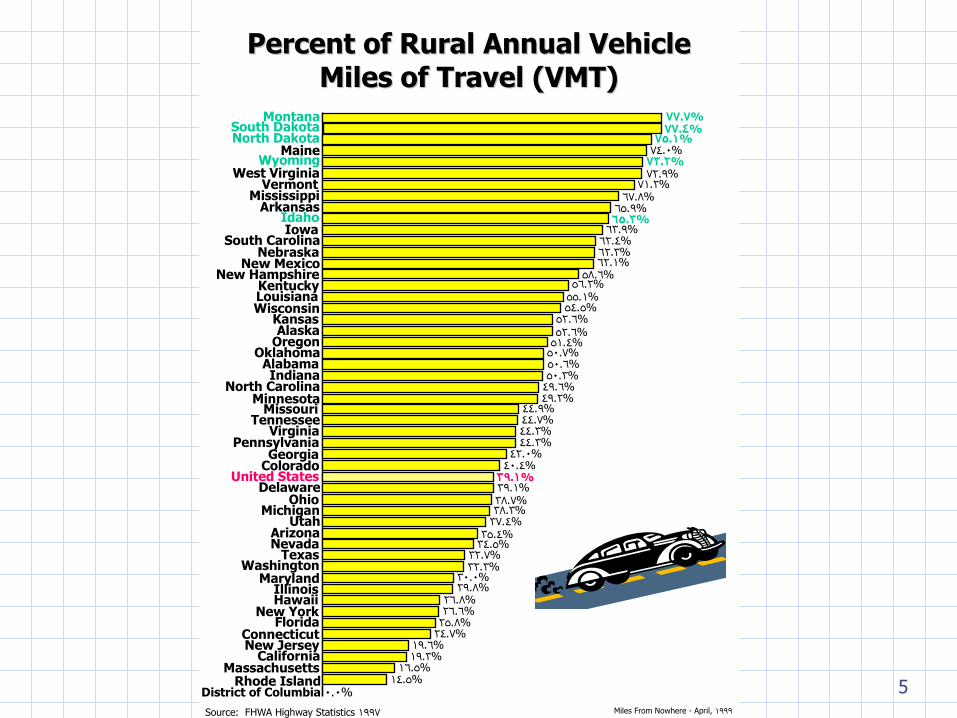
77.7%77.4%
75.1%74.0%
73.2%72.9%
71.2%67.8%
65.9%65.3%
63.9%62.4%62.3%62.1%
58.6%56.2%
55.1%54.5%
52.6%52.6%
51.4%50.7%50.6%50.3%
49.6%49.2%
44.9%44.7%44.3%44.3%
42.0%40.4%
39.1%39.1%38.7%38.3%
37.4%35.4%
34.5%32.7%32.3%
30.0%29.8%
26.8%26.6%
25.8%24.7%
19.6%19.3%
16.5%14.5%
0.0%
MontanaSouth DakotaNorth Dakota
MaineWyoming
West VirginiaVermont
MississippiArkansas
IdahoIowa
South CarolinaNebraska
New MexicoNew Hampshire
KentuckyLouisianaWisconsin
KansasAlaska
OregonOklahoma
AlabamaIndiana
North CarolinaMinnesota
MissouriTennessee
VirginiaPennsylvania
GeorgiaColorado
United StatesDelaware
OhioMichigan
UtahArizonaNevada
TexasWashington
MarylandIllinoisHawaii
New YorkFlorida
ConnecticutNew Jersey
CaliforniaMassachusetts
Rhode IslandDistrict of Columbia
Percent of Rural Annual Vehicle Percent of Rural Annual Vehicle Miles of Travel (VMT)Miles of Travel (VMT)
Source: FHWA Highway Statistics 1997 Miles From Nowhere - April, 1999
6
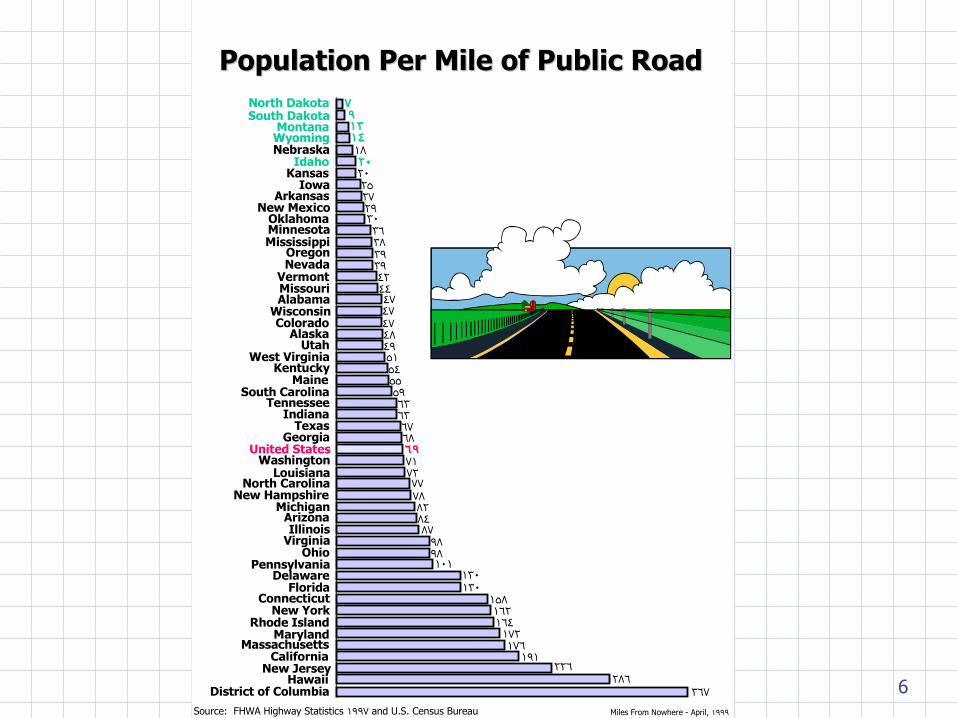
Population Per Mile of Public RoadPopulation Per Mile of Public Road79131418202025272930363839394244474747484951545559636367686971727778828487
9898101
130130
158162164
172176
191226
286367
North DakotaSouth Dakota
MontanaWyomingNebraska
IdahoKansas
IowaArkansas
New MexicoOklahomaMinnesotaMississippi
OregonNevada
VermontMissouriAlabama
WisconsinColorado
AlaskaUtah
West VirginiaKentucky
MaineSouth Carolina
TennesseeIndiana
TexasGeorgia
United StatesWashington
LouisianaNorth Carolina
New HampshireMichigan
ArizonaIllinois
VirginiaOhio
PennsylvaniaDelaware
FloridaConnecticut
New YorkRhode Island
MarylandMassachusetts
CaliforniaNew Jersey
HawaiiDistrict of Columbia
Source: FHWA Highway Statistics 1997 and U.S. Census Bureau Miles From Nowhere - April, 1999
7
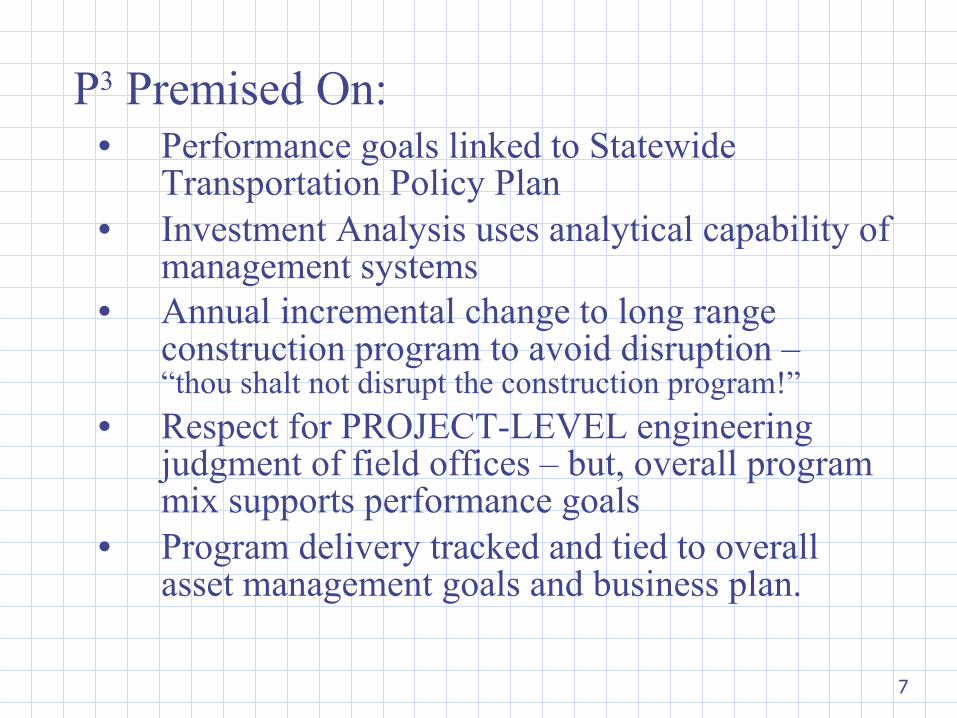
P3 Premised On:• Performance goals linked to Statewide
Transportation Policy Plan • Investment Analysis uses analytical capability of
management systems• Annual incremental change to long range
construction program to avoid disruption – “thou shalt not disrupt the construction program!”
• Respect for PROJECT-LEVEL engineering judgment of field offices – but, overall program mix supports performance goals
• Program delivery tracked and tied to overall asset management goals and business plan.
8
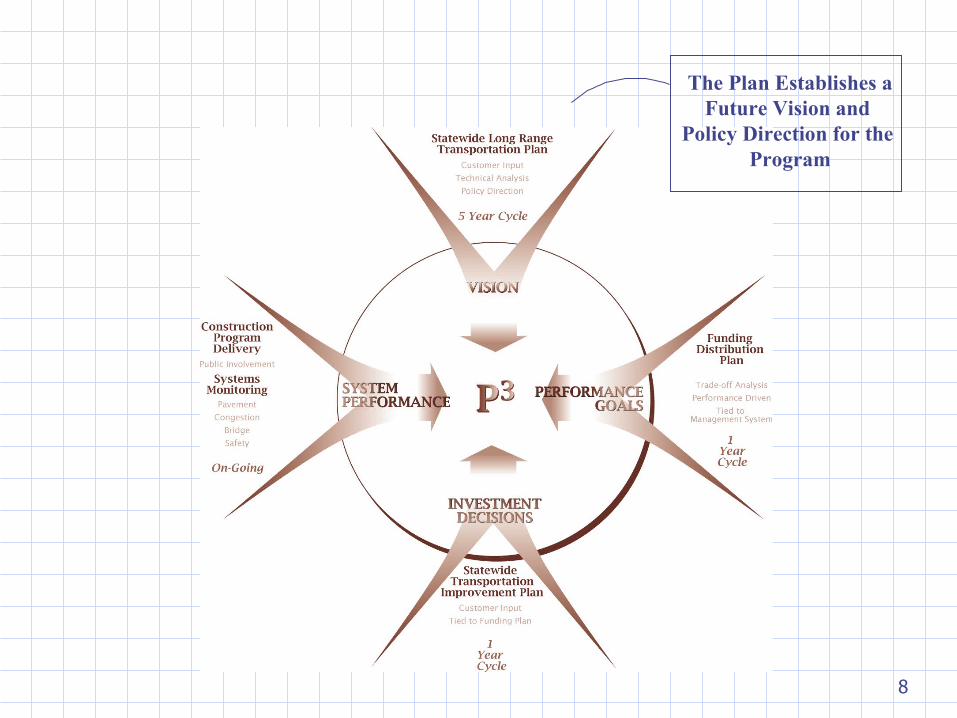
The Plan Establishes aFuture Vision and
Policy Direction for the Program
9
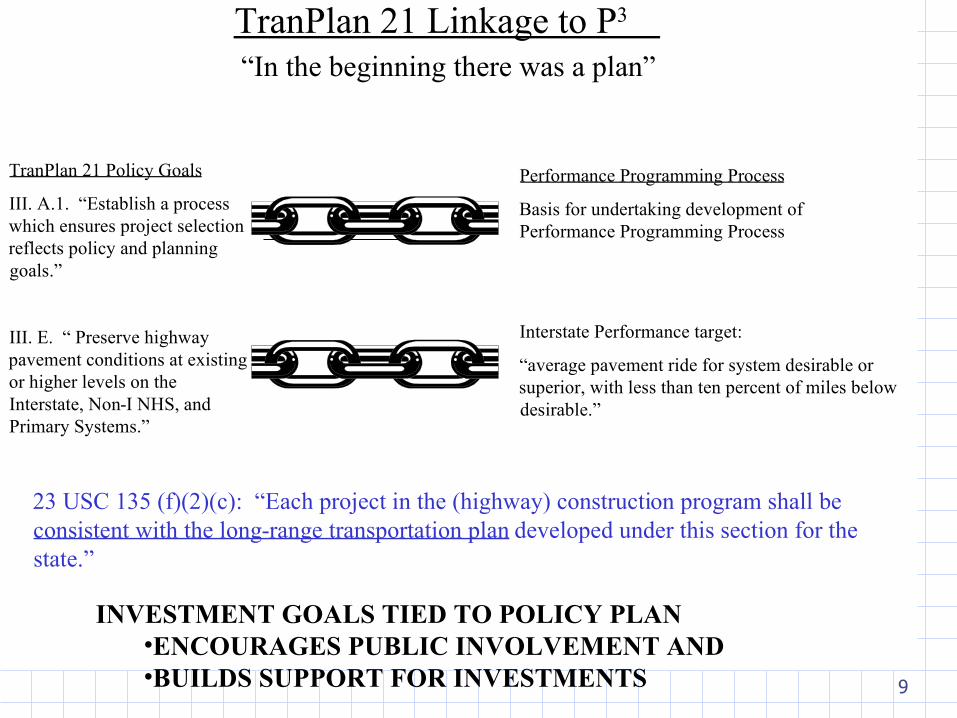
TranPlan 21 Linkage to P3
“In the beginning there was a plan”
TranPlan 21 Policy Goals
III. A.1. “Establish a process which ensures project selection reflects policy and planning goals.”
III. E. “ Preserve highway pavement conditions at existing or higher levels on the Interstate, Non-I NHS, and Primary Systems.”
Performance Programming Process
Basis for undertaking development of Performance Programming Process
Interstate Performance target:
“average pavement ride for system desirable or superior, with less than ten percent of miles below desirable.”
23 USC 135 (f)(2)(c): “Each project in the (highway) construction program shall be consistent with the long-range transportation plan developed under this section for the state.”
INVESTMENT GOALS TIED TO POLICY PLAN •ENCOURAGES PUBLIC INVOLVEMENT AND •BUILDS SUPPORT FOR INVESTMENTS
10
Linkage to Longrange Plan (continued)
• Process Survivability Provides an opportunity for a new
administration to effect the program Supports political policy shifts while preserving
the analytical basis of allocation and project decisions.
• Strategic Shifts Update cycle can respond to change but the
program will not be disrupted.
11
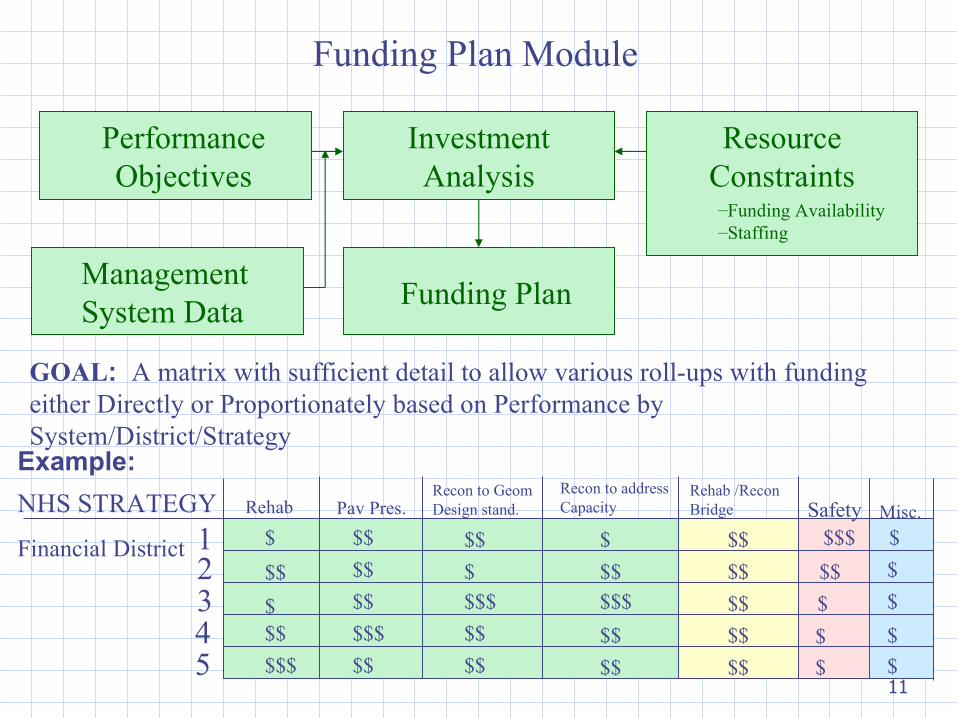
Funding Plan Module
Investment Analysis
Performance Objectives
Resource Constraints
Funding Plan
GOAL: A matrix with sufficient detail to allow various roll-ups with funding either Directly or Proportionately based on Performance by System/District/Strategy
NHS STRATEGY
Financial District
2345
Rehab Pav Pres.Recon to Geom Design stand.
Recon to address Capacity
Rehab /Recon Bridge Safety
$
$$
$
$$$
$$
$
$
$
$$
$$
$$
$$
$$
$$
$$
$$
$$$
$$
$$$
$
$$$
$$
$$
$$
$$
$$
$$$
$$
Misc.
$$$
$
$
$
$
$1
Example:
Management System Data
–Funding Availability–Staffing
12
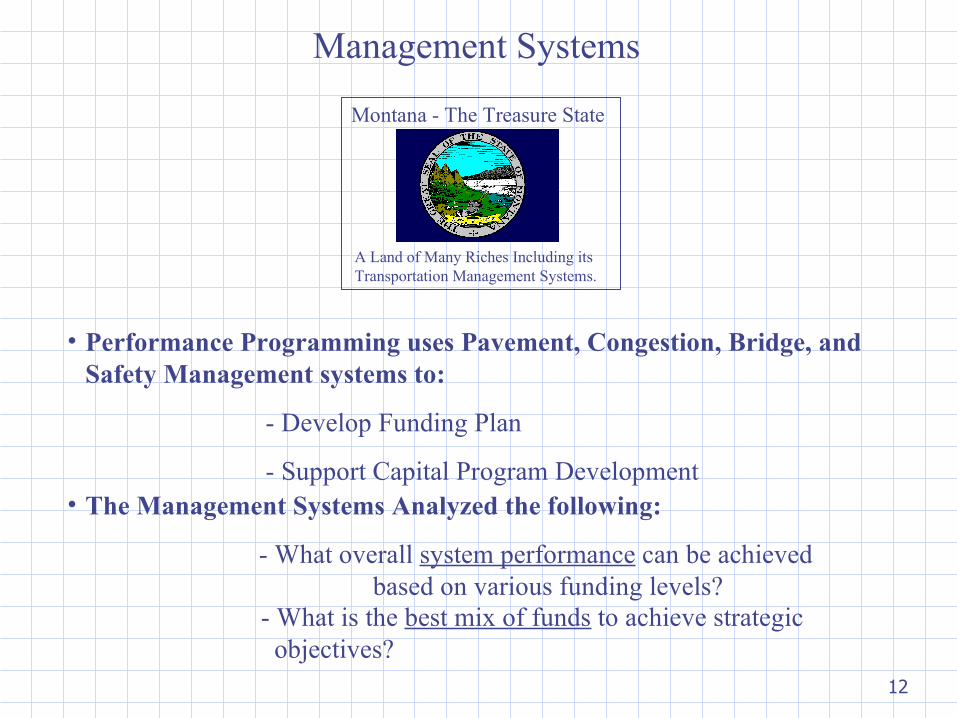
Management Systems
Montana - The Treasure State
A Land of Many Riches Including its Transportation Management Systems.
• Performance Programming uses Pavement, Congestion, Bridge, and Safety Management systems to:
- Develop Funding Plan
- Support Capital Program Development
- What is the best mix of funds to achieve strategic objectives?
• The Management Systems Analyzed the following:
- What overall system performance can be achieved based on various funding levels?
13
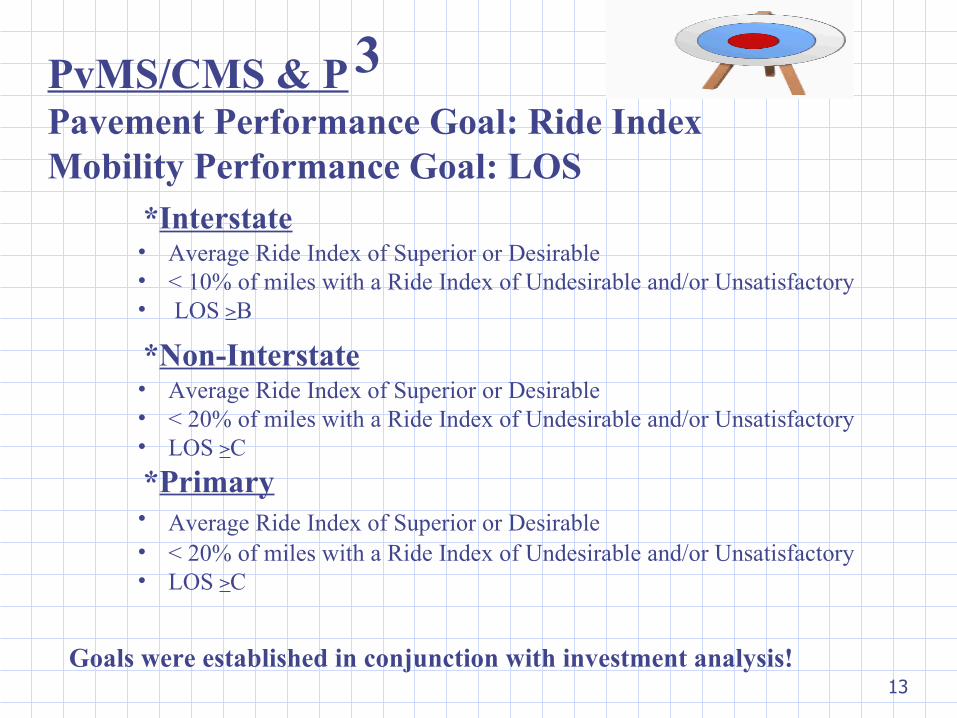
PvMS/CMS & PPavement Performance Goal: Ride IndexMobility Performance Goal: LOS
*Interstate• Average Ride Index of Superior or Desirable• < 10% of miles with a Ride Index of Undesirable and/or Unsatisfactory• LOS >B
*Non-Interstate• Average Ride Index of Superior or Desirable• < 20% of miles with a Ride Index of Undesirable and/or Unsatisfactory• LOS >C
*Primary• Average Ride Index of Superior or Desirable• < 20% of miles with a Ride Index of Undesirable and/or Unsatisfactory• LOS >C
3
Goals were established in conjunction with investment analysis!
14
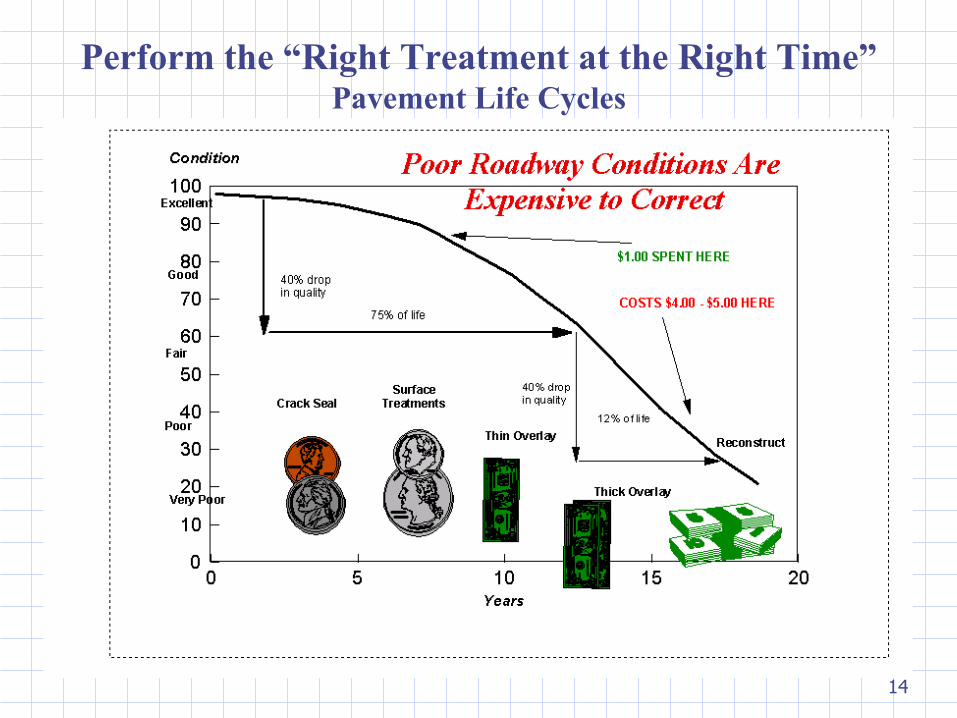
Perform the “Right Treatment at the Right Time”Pavement Life Cycles
15
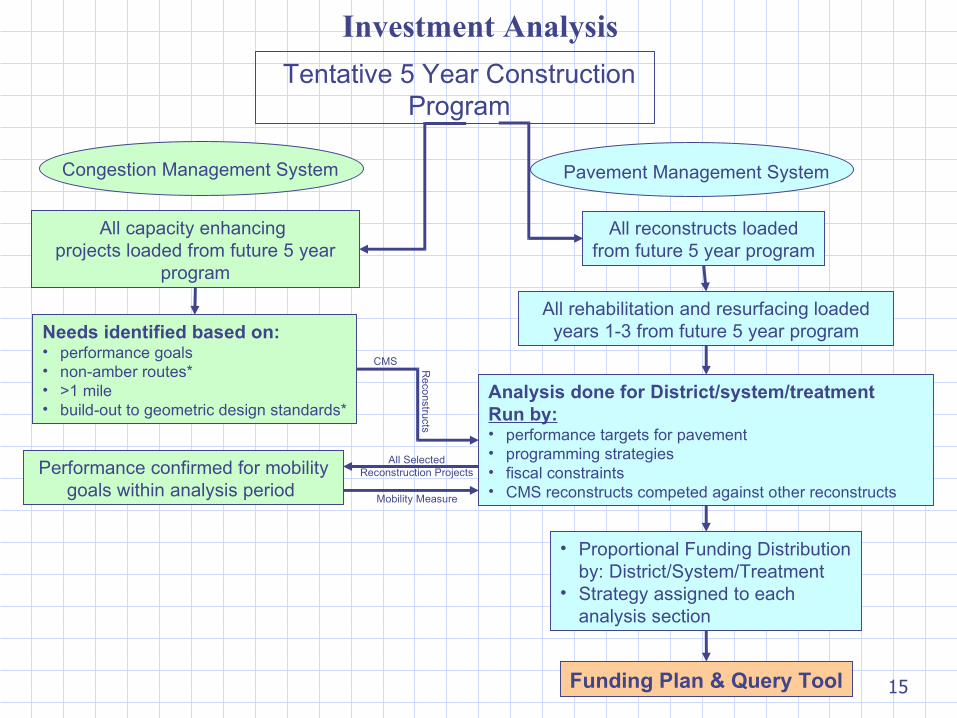
Investment Analysis
Pavement Management System
All capacity enhancing projects loaded from future 5 year
program
Needs identified based on:• performance goals• non-amber routes*• >1 mile• build-out to geometric design standards*
All reconstructs loadedfrom future 5 year program
All rehabilitation and resurfacing loaded years 1-3 from future 5 year program
Analysis done for District/system/treatmentRun by:• performance targets for pavement• programming strategies• fiscal constraints • CMS reconstructs competed against other reconstructs
Tentative 5 Year Construction Program
Congestion Management System
• Proportional Funding Distribution by: District/System/Treatment
• Strategy assigned to each analysis section
Performance confirmed for mobility goals within analysis period
Funding Plan & Query Tool
CMS Re
constructs
All SelectedReconstruction Projects
Mobility Measure
16
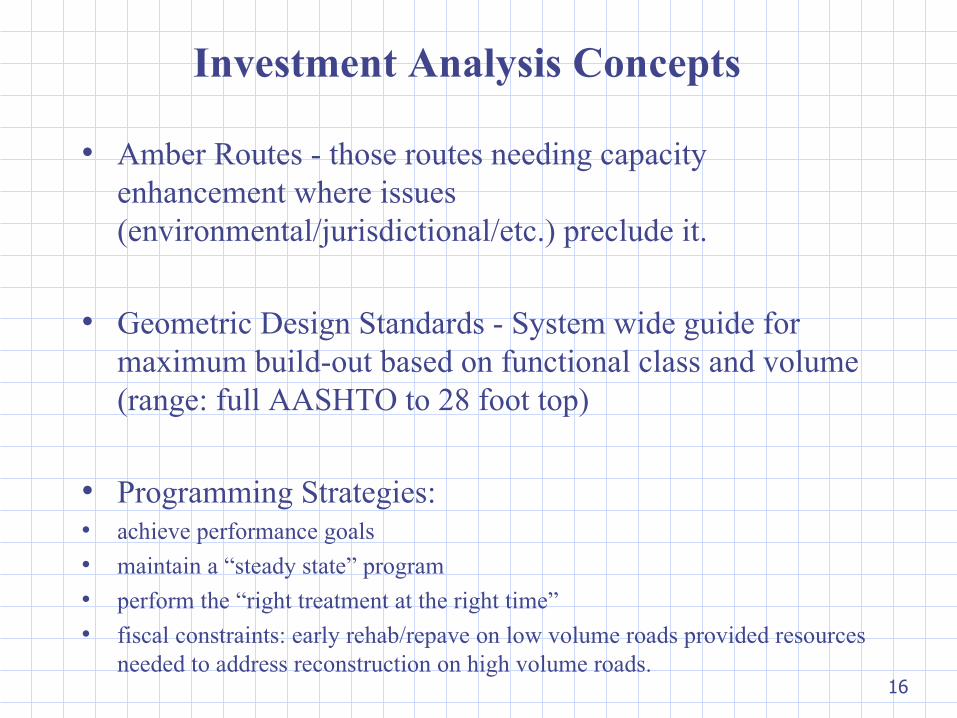
Investment Analysis Concepts
• Amber Routes - those routes needing capacity enhancement where issues (environmental/jurisdictional/etc.) preclude it.
• Geometric Design Standards - System wide guide for maximum build-out based on functional class and volume (range: full AASHTO to 28 foot top)
• Programming Strategies:• achieve performance goals
• maintain a “steady state” program
• perform the “right treatment at the right time”
• fiscal constraints: early rehab/repave on low volume roads provided resources needed to address reconstruction on high volume roads.
17
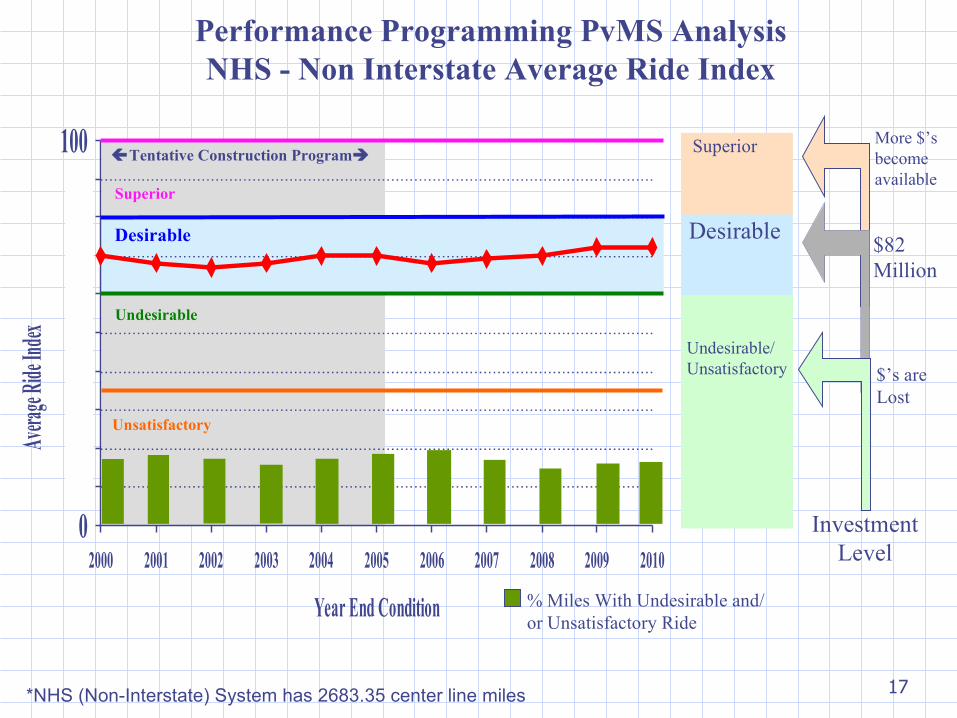
0102030405060708090
100
2000 2001 2002 2003 2004 2005 2006 2007 2008 2009 2010
Year End Condition
Avera
ge Rid
e Ind
ex
Undesirable
Desirable
Superior
Tentative Construction Program
Unsatisfactory
Desirable
Undesirable/ Unsatisfactory
Superior
$’s are Lost
$82 Million
More $’s become available
Investment Level
Performance Programming PvMS Analysis NHS - Non Interstate Average Ride Index
% Miles With Undesirable and/or Unsatisfactory Ride
*NHS (Non-Interstate) System has 2683.35 center line miles
18
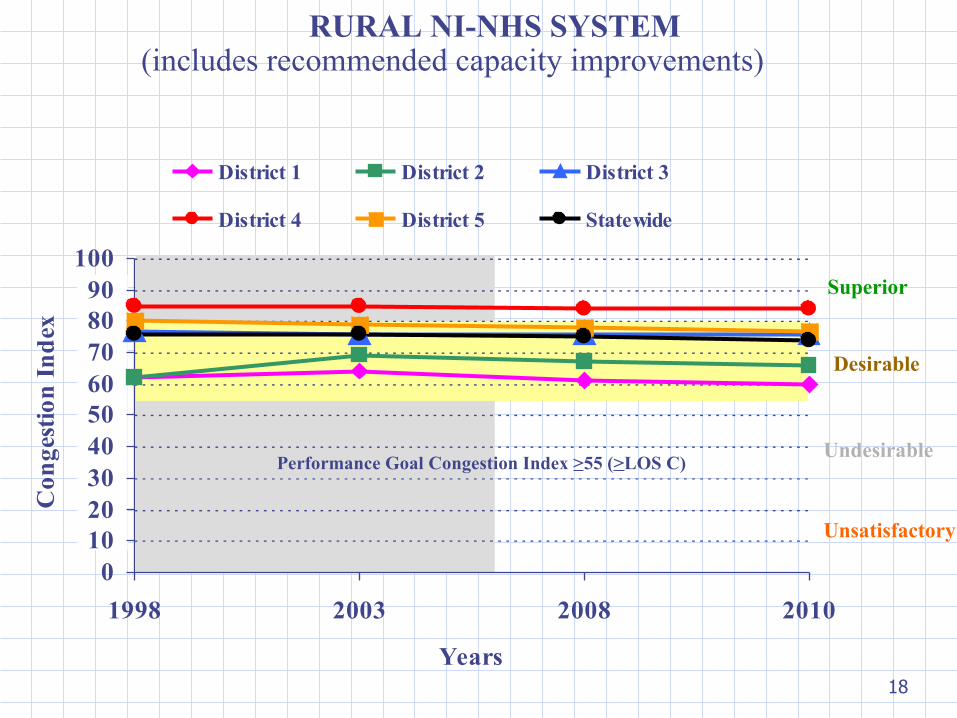
RURAL NI-NHS SYSTEM
Performance Goal Congestion Index >55 (>LOS C)
(includes recommended capacity improvements)
Unsatisfactory
Undesirable
Desirable
Superior
0102030405060708090
100
1998 2003 2008 2010
Years
Con
gest
ion
In
dex
District 1 District 2 District 3
District 4 District 5 Statewide
19
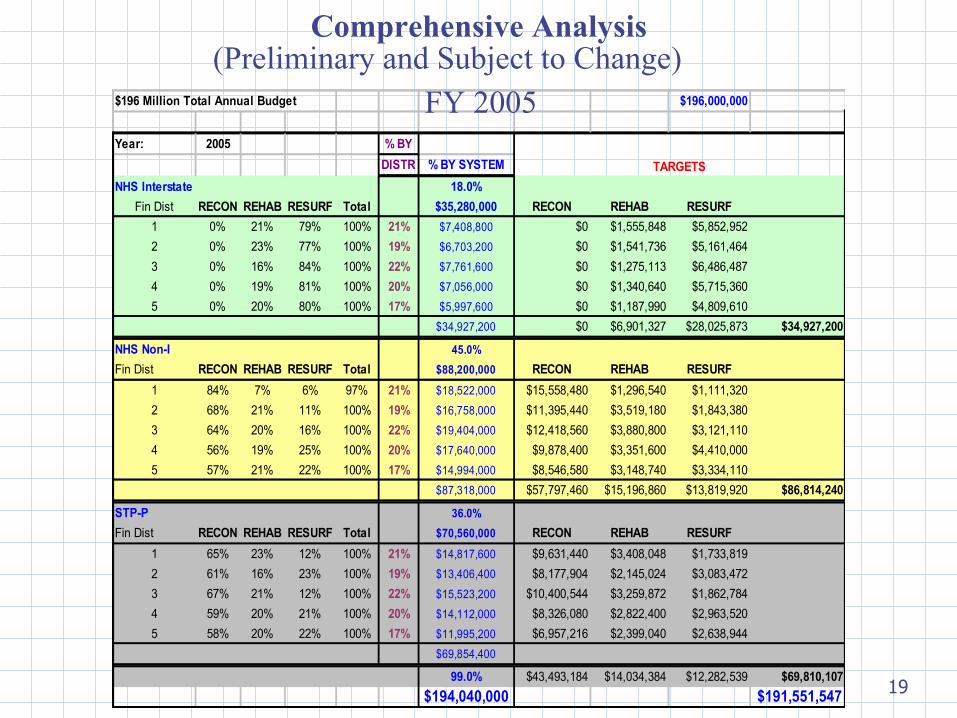
$196 Million Total Annual Budget $196,000,000
Year: 2005 % BY
DISTR % BY SYSTEM
NHS Interstate 18.0%
Fin Dist RECON REHAB RESURF Total $35,280,000 RECON REHAB RESURF
1 0% 21% 79% 100% 21% $7,408,800 $0 $1,555,848 $5,852,952
2 0% 23% 77% 100% 19% $6,703,200 $0 $1,541,736 $5,161,464
3 0% 16% 84% 100% 22% $7,761,600 $0 $1,275,113 $6,486,487
4 0% 19% 81% 100% 20% $7,056,000 $0 $1,340,640 $5,715,360
5 0% 20% 80% 100% 17% $5,997,600 $0 $1,187,990 $4,809,610
$34,927,200 $0 $6,901,327 $28,025,873 $34,927,200
NHS Non-I 45.0%
Fin Dist RECON REHAB RESURF Total $88,200,000 RECON REHAB RESURF
1 84% 7% 6% 97% 21% $18,522,000 $15,558,480 $1,296,540 $1,111,320
2 68% 21% 11% 100% 19% $16,758,000 $11,395,440 $3,519,180 $1,843,380
3 64% 20% 16% 100% 22% $19,404,000 $12,418,560 $3,880,800 $3,121,110
4 56% 19% 25% 100% 20% $17,640,000 $9,878,400 $3,351,600 $4,410,000
5 57% 21% 22% 100% 17% $14,994,000 $8,546,580 $3,148,740 $3,334,110
$87,318,000 $57,797,460 $15,196,860 $13,819,920 $86,814,240
STP-P 36.0%
Fin Dist RECON REHAB RESURF Total $70,560,000 RECON REHAB RESURF
1 65% 23% 12% 100% 21% $14,817,600 $9,631,440 $3,408,048 $1,733,819
2 61% 16% 23% 100% 19% $13,406,400 $8,177,904 $2,145,024 $3,083,472
3 67% 21% 12% 100% 22% $15,523,200 $10,400,544 $3,259,872 $1,862,784
4 59% 20% 21% 100% 20% $14,112,000 $8,326,080 $2,822,400 $2,963,520
5 58% 20% 22% 100% 17% $11,995,200 $6,957,216 $2,399,040 $2,638,944
$69,854,400
99.0% $43,493,184 $14,034,384 $12,282,539 $69,810,107
$194,040,000 $191,551,547
TARGETS
Comprehensive Analysis(Preliminary and Subject to Change)
FY 2005
20
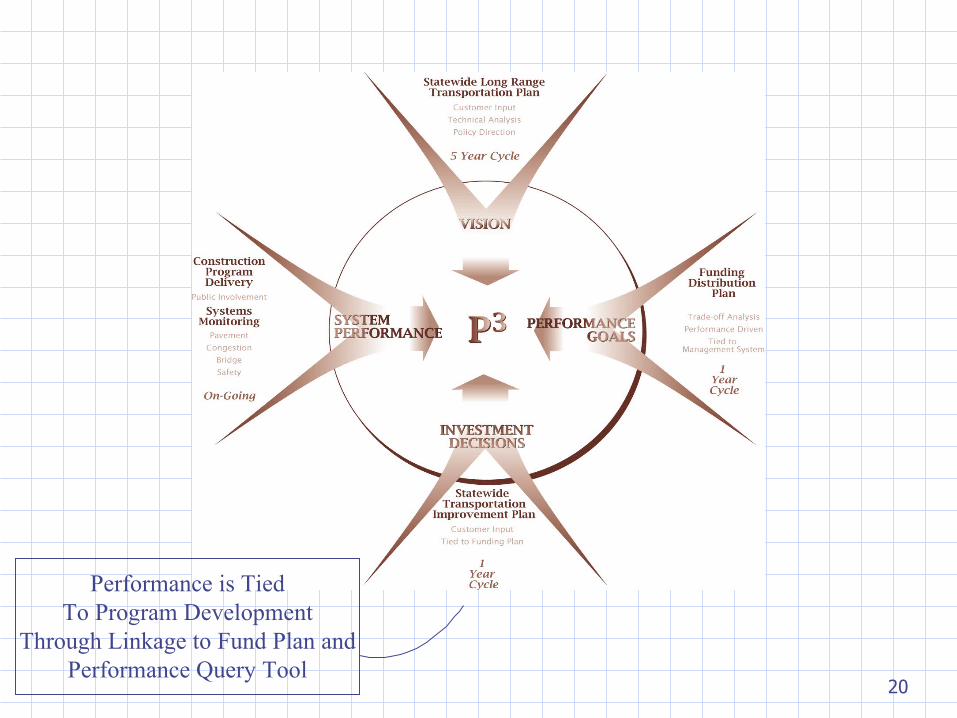
Performance is TiedTo Program Development
Through Linkage to Fund Plan andPerformance Query Tool
21
SYSTEMS PERFORMANCE
QUERY TOOL
PUBLIC COMMENT
FUNDING PLAN
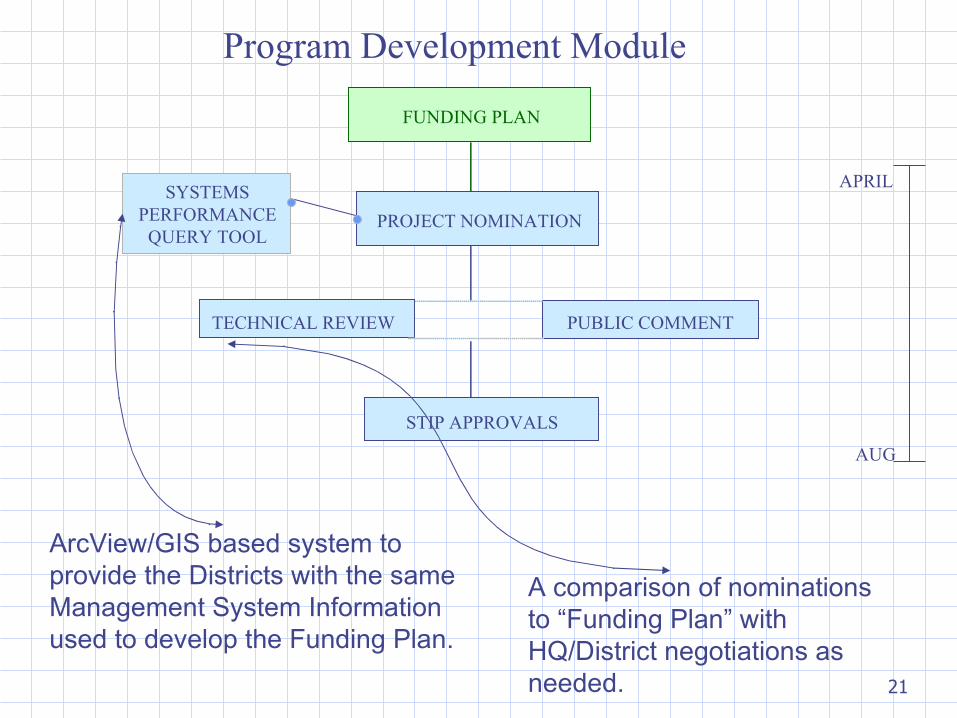
Program Development Module
PROJECT NOMINATION
TECHNICAL REVIEW
STIP APPROVALS
APRIL
AUG
ArcView/GIS based system to provide the Districts with the same Management System Information used to develop the Funding Plan.
A comparison of nominations to “Funding Plan” with HQ/District negotiations as needed.
22
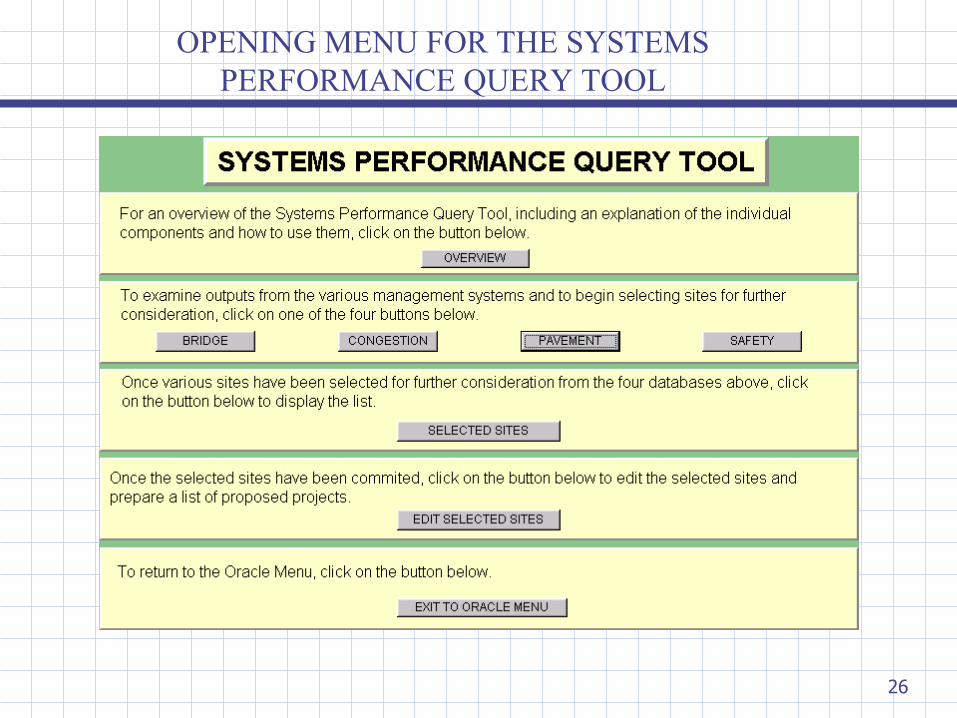
SYSTEMS PERFORMANCE QUERY TOOL
• Oracle based system.
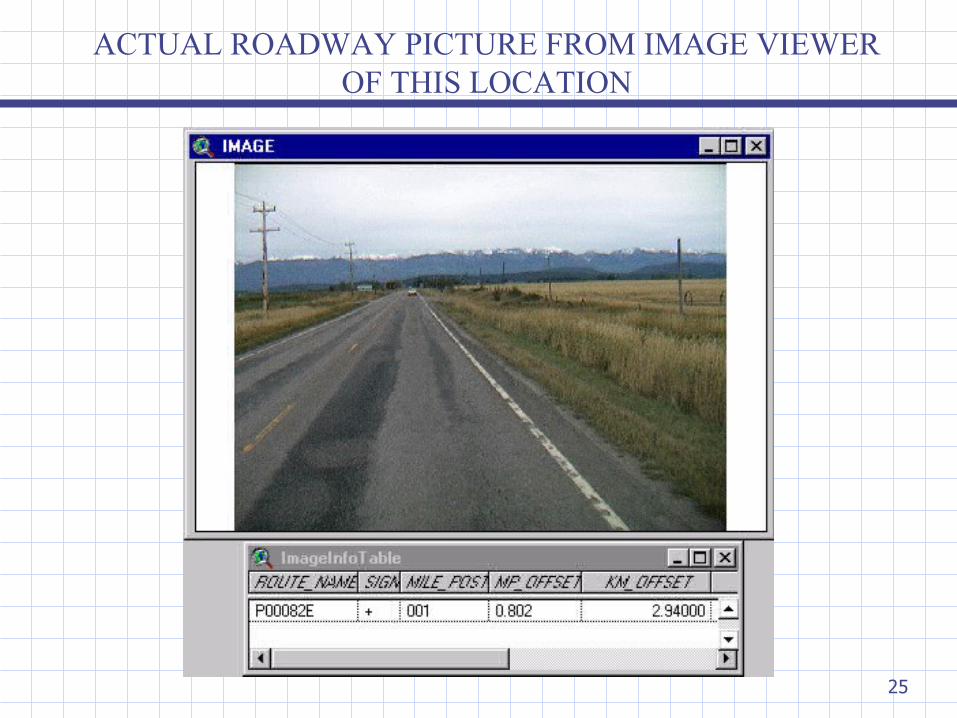
• Graphics support through ArcView maps and Image Viewer.
• Carries the same management system data used in developing the funding plan provided to Districts on CD’s.
• Allows user to nominate projects consistent with project mix developed in the funding plan.
-District personnel choose projects based on engineering judgement.
23
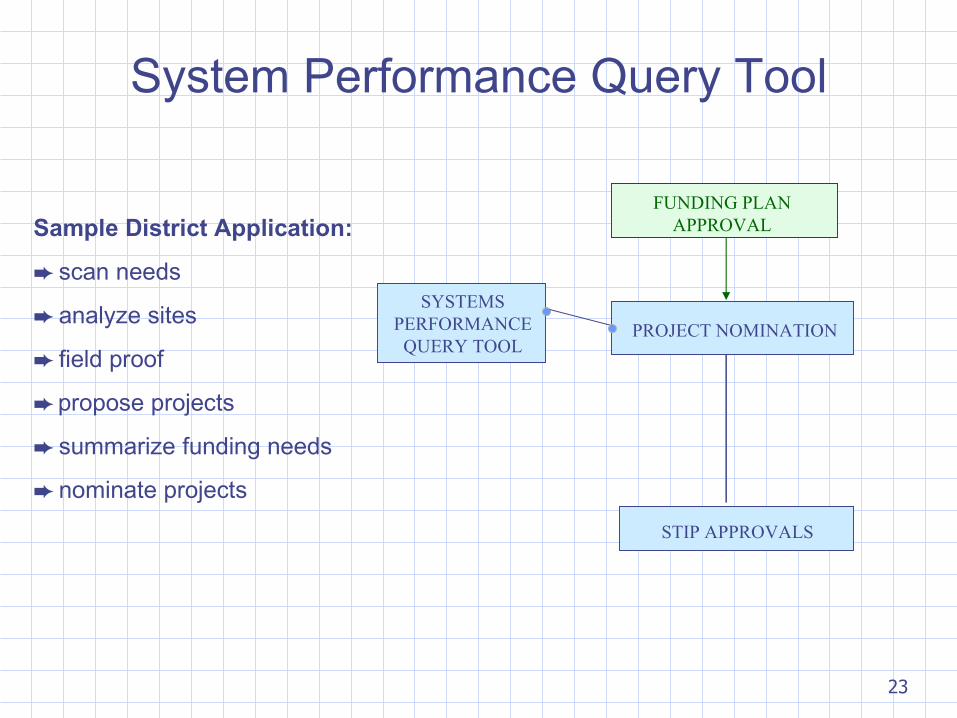
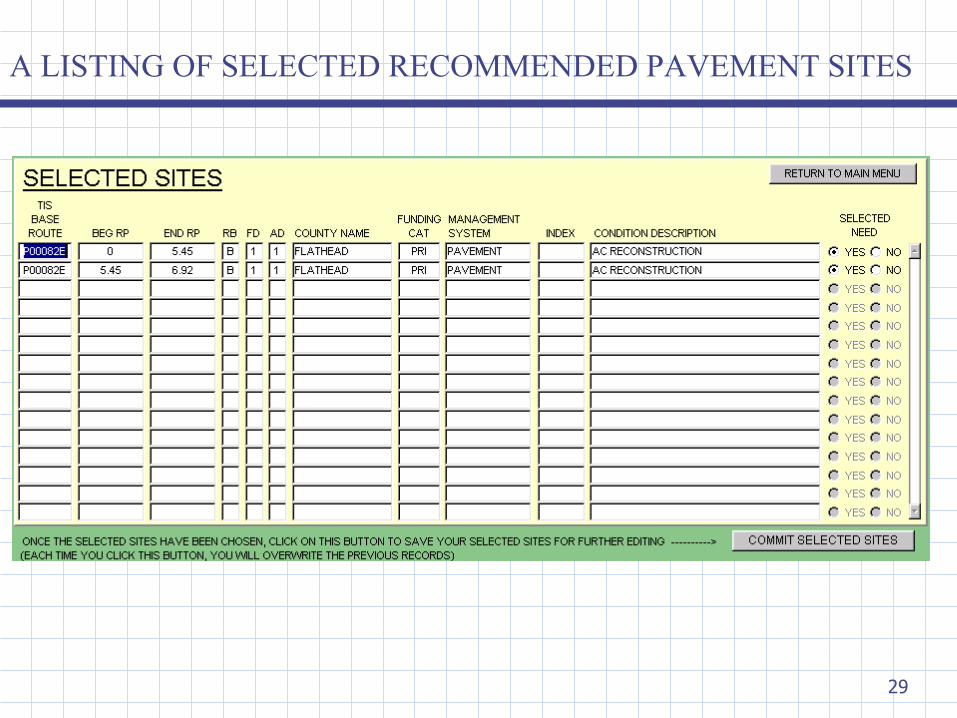
Sample District Application:
➨ scan needs
➨ analyze sites
➨ field proof
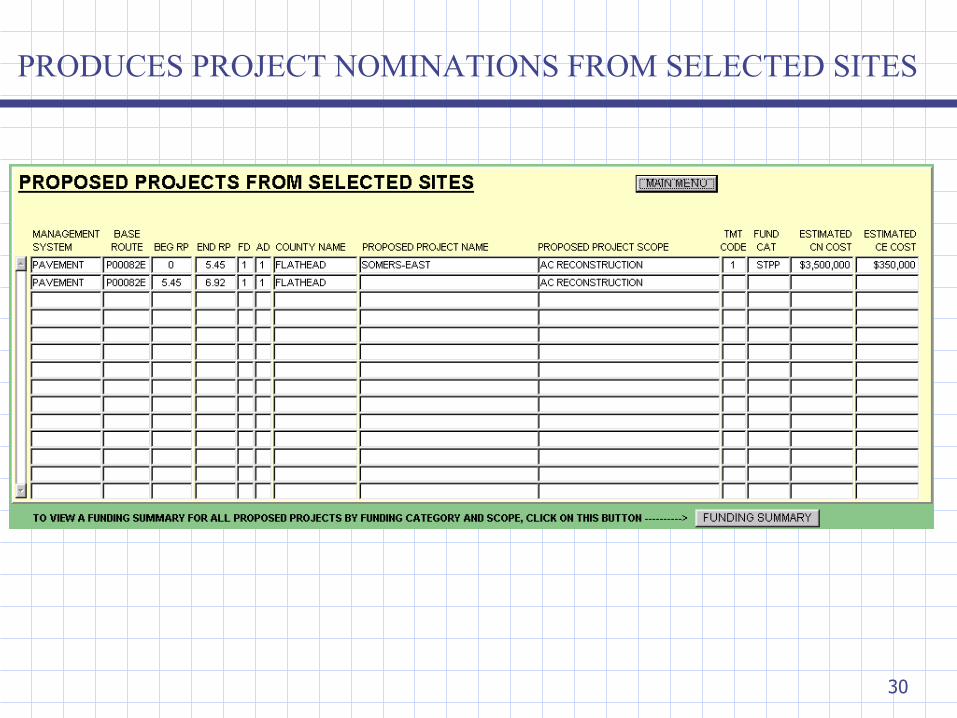
➨ propose projects
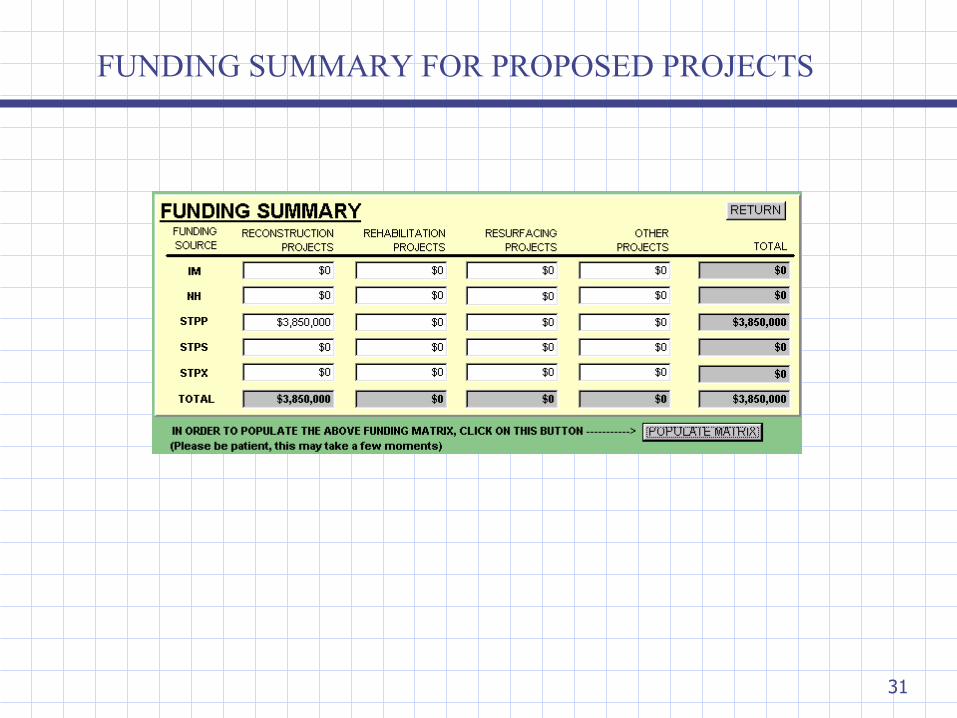
➨ summarize funding needs
➨ nominate projects
FUNDING PLAN APPROVAL
PROJECT NOMINATION
SYSTEMS PERFORMANCE
QUERY TOOL
STIP APPROVALS
System Performance Query Tool
24
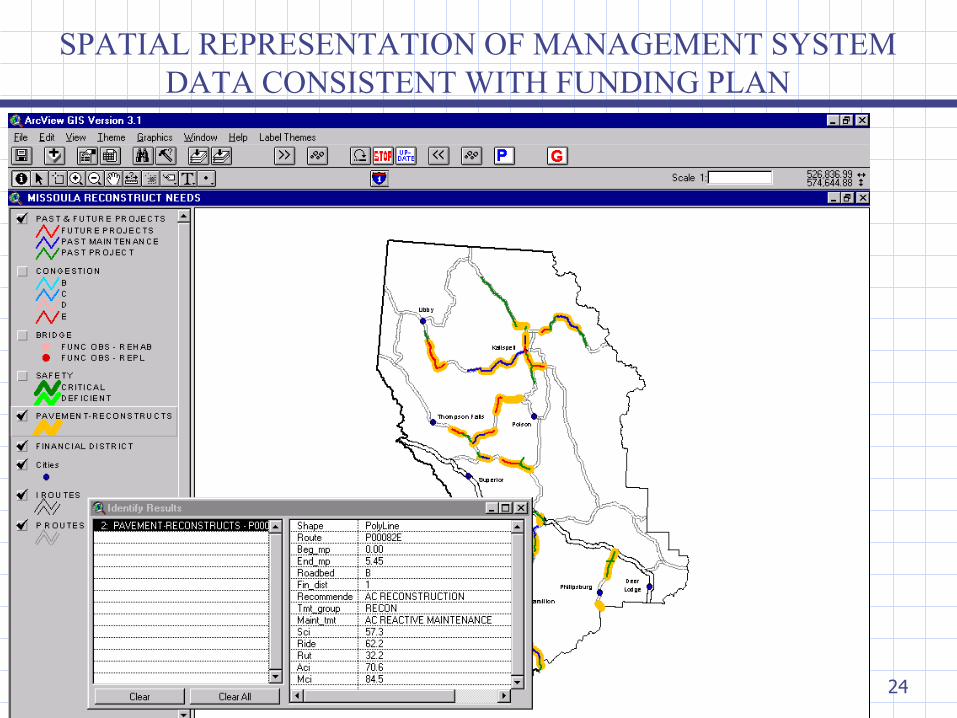
SPATIAL REPRESENTATION OF MANAGEMENT SYSTEM DATA CONSISTENT WITH FUNDING PLAN
25
ACTUAL ROADWAY PICTURE FROM IMAGE VIEWER OF THIS LOCATION
26
OPENING MENU FOR THE SYSTEMS PERFORMANCE QUERY TOOL
27
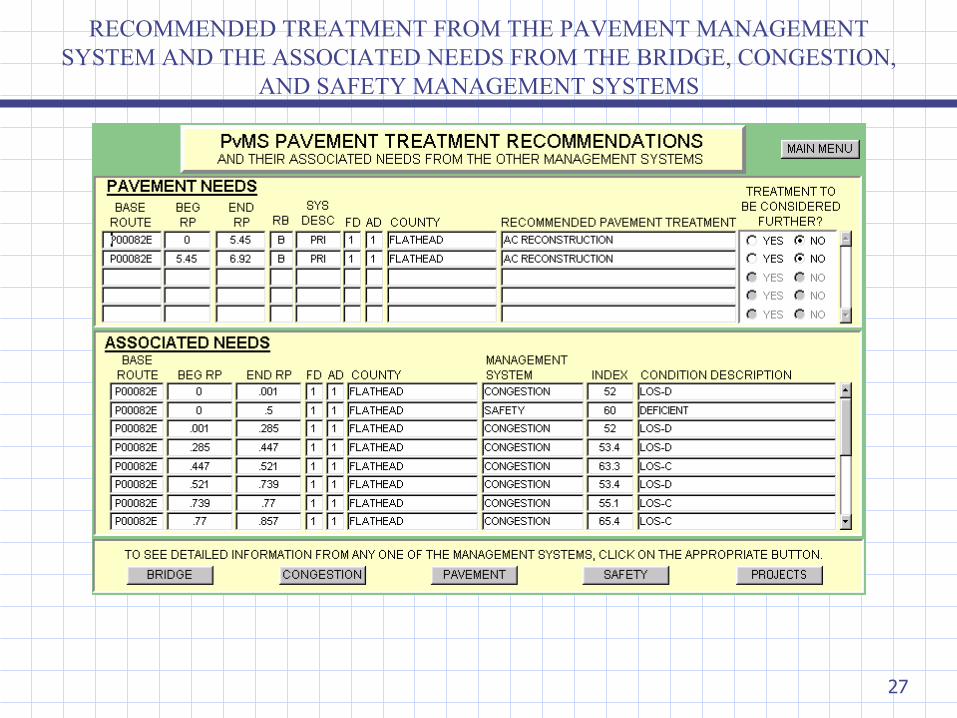
RECOMMENDED TREATMENT FROM THE PAVEMENT MANAGEMENT SYSTEM AND THE ASSOCIATED NEEDS FROM THE BRIDGE, CONGESTION,
AND SAFETY MANAGEMENT SYSTEMS
28
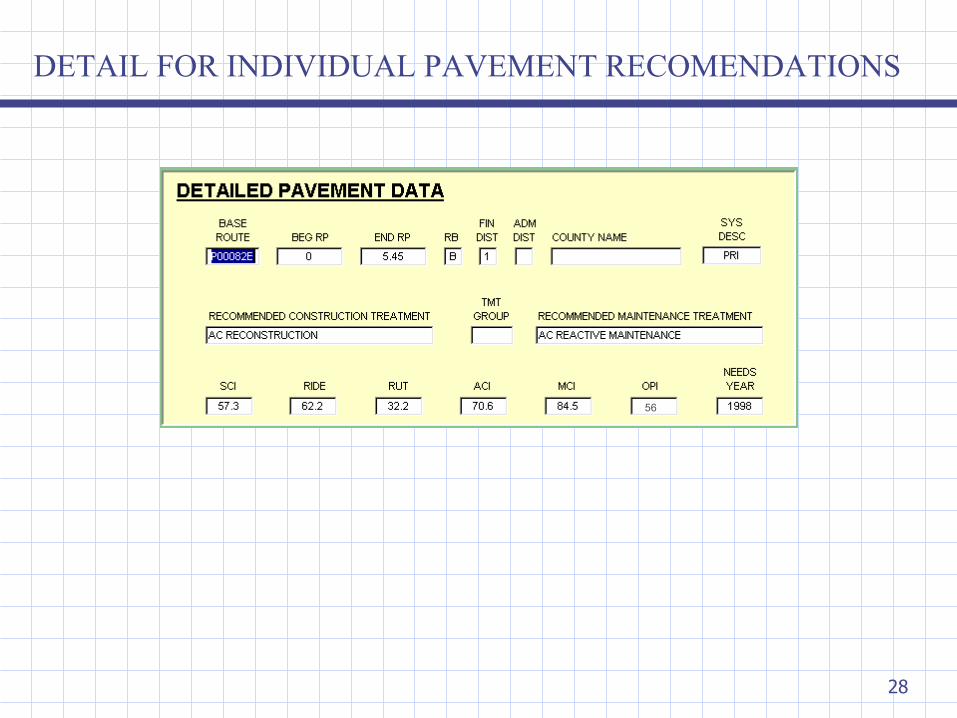
DETAIL FOR INDIVIDUAL PAVEMENT RECOMENDATIONS
56
29
A LISTING OF SELECTED RECOMMENDED PAVEMENT SITES
30
PRODUCES PROJECT NOMINATIONS FROM SELECTED SITES
31
FUNDING SUMMARY FOR PROPOSED PROJECTS
32
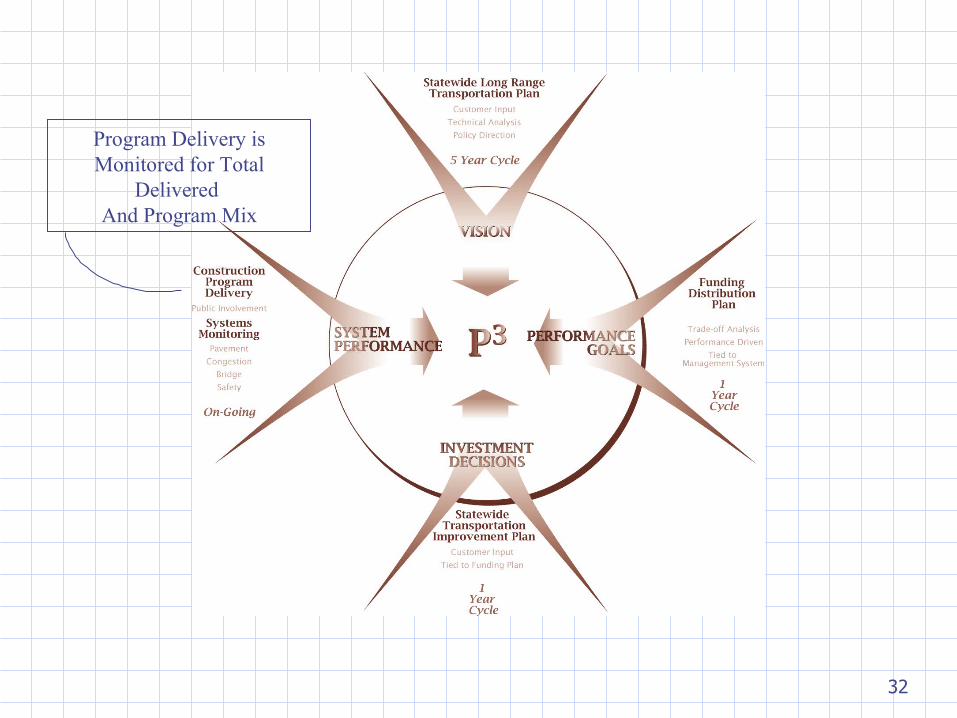
Program Delivery isMonitored for Total
Delivered And Program Mix
AUG.
MA
NA
GE
ME
NT
SY
ST
EM
DA
TA
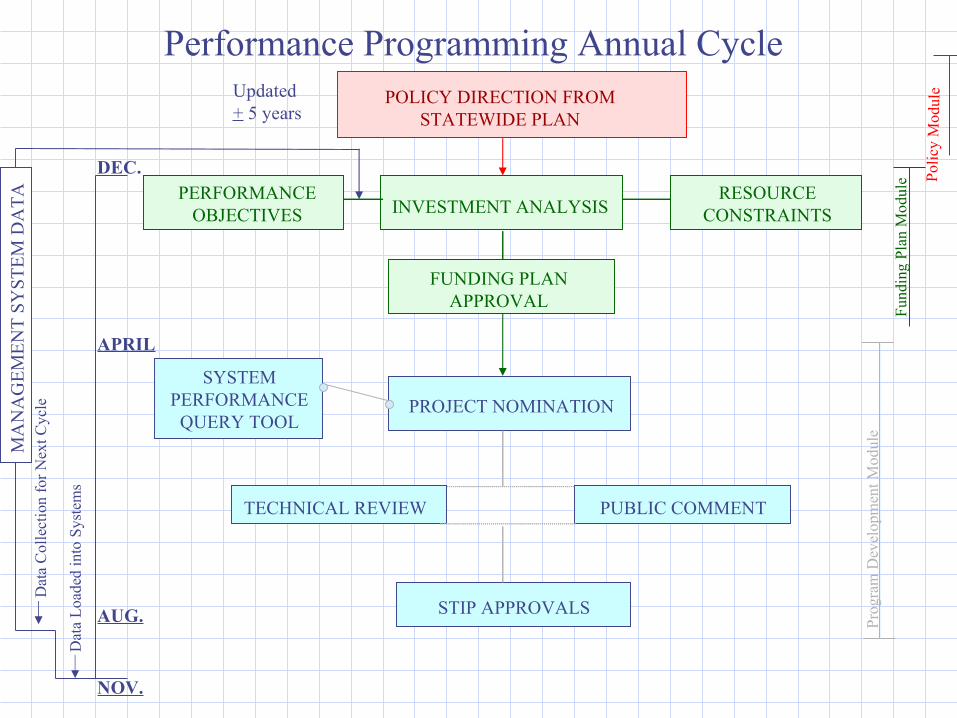
Performance Programming Annual Cycle
INVESTMENT ANALYSISPERFORMANCE
OBJECTIVESRESOURCE
CONSTRAINTS
FUNDING PLAN APPROVAL
PROJECT NOMINATION
SYSTEM PERFORMANCE
QUERY TOOL
TECHNICAL REVIEW PUBLIC COMMENT
STIP APPROVALS
POLICY DIRECTION FROM STATEWIDE PLAN
DEC.
APRIL
Pro
gram
Dev
elop
men
t Mod
ule
Fun
ding
Pla
n M
odul
e Pol
icy
Mod
uleUpdated
+ 5 years
Dat
a L
oade
d in
to S
yste
ms
NOV.
Dat
a C
olle
ctio
n fo
r N
ext C
ycle
34
Advantages MDT will Realize from P3
• Improved Accountability for MDT’s transportation program
• Sets clear guidelines for making sound and cost effective investment decisions
• Improves the ability of measuring progress in system performance and program delivery
• Allows tangible justification of the Department’s fiscal needs before Montana’s Legislature
• Management Benefits: predictability resource planning
35
Initial Focus and Next Steps
The focus of initial cycle:Cross management system analysis for pavement and congestion
Next: Incorporating Urban Delay/Pavement and Bridge refinements by Mar. 02
Recommended