Contents
Sector trends: Performance of the primary and secondary sectors of the South African economy: Statistical overview
November 2020 Department of Research and Information

Contents
Performance snapshot - First semester of 2020 1
Performance of the primary and secondary sectors 2
▪ Physical volume of production 2
▪ Production capacity utilisation 2
▪ Employment 3
▪ Remuneration 3
▪ Exports 4
▪ Imports 4
Selected trade trends 5
▪ Trade balance 5
▪ Major traded products 5
▪ Composition of trade 5
▪ Regional trade 5
Trade trends with major regions or regional blocs 6
Performance of the primary and secondary sub-sectors: statistical synopsis
▪ Agriculture, forestry and fishing 8
▪ Total mining 10
- Gold and uranium mining 12
- Coal mining 14
- PGM mining 16
- Iron ore mining 18
- Other mining 20
▪ Total manufacturing 22
- Food 24
- Beverages 26
- Textiles 28
- Wearing apparel 30
- Leather and leather products 32
- Footwear 34
- Wood and wood products 36
- Paper and paper products 38
- Printing, publishing and recorded media 40
- Coke and refined petroleum products 42
- Basic chemicals 44
- Other chemicals and man-made fibres 46
- Rubber products 48
- Plastic products 50
- Glass and glass products 52
- Non-metallic mineral products 54
- Basic iron and steel 56
- Basic non-ferrous metallic products 58
- Metal products excluding machinery 60
- Machinery and equipment 62
- Electrical machinery 64
- Television, radio and communication equipment 66
- Professional and scientific equipment 68
- Motor vehicles, parts and accessories 70
- Other transport equipment 72
- Furniture 74
- Other manufacturing 76
Acronyms, notes and data sources 78

November 2020 IDC – Research and Information – Sectoral Trends 1
Performance snapshot - First semester of 2020
This section provides a snapshot, on an aggregated basis, of the performance of the agriculture, mining and
manufacturing sectors (either in value terms, or as a proportion of the total and/or as a percentage change
year-on-year (y-o-y)) during the first half of 2020 compared to the same period in 2019.
-9.4%% y-o-y
Change in rand prices
of SA commodity
basket (production weighted
utilising select
commodities)
2.47 million Total formal employment in agriculture (799 033),
mining (455 722) and manufacturing (1.2 mil.)
-0.3% y-o-y
-15.4% y-o-y
Growth in real value
added by agriculture,
mining and
manufacturing
R600 billion
Value of SA exports to
the world
-2.1% y-o-y
34.1%
Proportion of youth
formally and informally
employed in
agriculture, mining and
manufacturing
-9.0% y-o-y
Estimated change in
total manufacturing
production capacity
R537 billion
Value of SA imports
from the world
-13.0% y-o-y
23.5%
Proportion of formally
and informally
employed individuals
located in Gauteng
R1.2 trillion
Value of nominal
mining and
manufacturing sales
-14.0% y-o-y
R41.1 billion
SA imports from the
USMCA countries
7.7% of total imports
-10.7% y-o-y
48.8%
Proportion of the
formally and informally
employed with less
than secondary
schooling completed
R140 billion
SA exports to the EU
23.3% of total exports
-5.5% y-o-y

November 2020 IDC – Research and Information – Sectoral Trends 2
Performance of the primary and secondary sectors
Figure 1 Figure 2
Figures in brackets refer to the sub-sector's percentage
share in mining/manufacturing product ion in the second quarter of 2020
Second quarter of 2020 compared to second quarter of 2019
Figures in brackets refer to the sub-sector's average capacity
ut ilisat ion in the second quarter of 2020
Average for the first half of 2020 compared to average for the first half of 2019 (Seasonally adjusted)
* Real value add
Total manufacturing (60.9)
Manufacturing: Change in the utilisation of production capacity Growth in physical volume of production in the primary and secondary sectors
-50 -40 -30 -20 -10 0
Beverages (37.5)
Other manufacturing (37.3)
Furniture (42.5)
Wearing apparel (33.1)
Glass & glass products (49.5)
Basic iron & steel products (40.2)
Motor vehicles, parts & accessories (50.9)
Printing, publishing & recorded media (39.0)
Rubber products (50.9)
Non-metallic mineral products (42.1)
Leather & leather products (32.4)
Other transport equipment (41.7)
Metal products (excl machinery) (44.7)
Basic chemicals (57.5)
Basic non-ferrous metal products (55.2)
Electrical machinery & equipment (55.1)
Coke & refined petroleum products (62.0)
Wood & wood products (63.7)
Professional & scientific equipment (63.2)
Paper & paper products (74.1)
Textiles (55.5)
Footwear (75.5)
Machinery & equipment (73.4)
Other chemicals & man-made fibres (79.1)
Plastic products (76.6)
Television, radio & communication equipment (78.3)
Food (78.2)
Percentage points
-50% -40% -30% -20% -10% 0% 10%
Motor vehicles, parts & accessories (6.3)
Furniture (1.1)
Basic iron & steel products (3.6)
Footwear (0.4)
Non-metallic mineral products (2.5)
Leather & leather products (0.5)
Other transport equipment (1.2)
Textiles (1.2)
Beverages (6.3)
Wood & wood products (4.3)
Coke & refined petroleum products (8.7)
Electrical machinery & equipment (1.6)
Printing, publishing & recorded media (3.0)
Wearing apparel (1.1)
Television, radio & communication equipment (0.9)
Other manufacturing (2.0)
Metal products (excl machinery) (5.8)
Rubber products (1.2)
Glass & glass products (0.7)
Machinery & equipment (6.8)
Basic non-ferrous metal products (2.6)
Plastic products (2.7)
Professional & scientific equipment (0.6)
Paper & paper products (4.1)
Other chemicals & man-made fibres (6.2)
Food (20.4)
Basic chemicals (4.3)
Iron ore mining (10.8)
PGM mining (22.4)
Other mining (25.0)
Gold & uranium mining (16.8)
Coal mining (25.0)
Percent
Agriculture, forestry & fishing *
Total mining
Agriculture, forestry & fishing *
Total mining
Total manufacturing

November 2020 IDC – Research and Information – Sectoral Trends 3
Performance of the primary and secondary sectors
Figure 3 Figure 4
Growth in formal employment in the primary and secondary sectors
Second quarter of 2020 compared to second quarter of 2019
Figures in brackets refer to the sub-sector's share in
mining/manufacturing employment in the second quarter of 2020
Growth in gross monthly remuneration per worker in the primary and secondary sectors
Second quarter of 2020 compared to second quarter of 2019
-30% -25% -20% -15% -10% -5% 0% 5% 10% 15%
Other manufacturing (3.2)
Other transport equipment (1.4)
Footwear (0.6)
Printing, publishing & recorded media (4.1)
Basic non-ferrous metal products (1.2)
Wearing apparel (3.7)
Glass & glass products (0.7)
Electrical machinery & equipment (3.4)
Furniture (2.1)
Wood & wood products (3.6)
Motor vehicles, parts & accessories (7.8)
Basic iron & steel products (2.3)
Metal products (excl machinery) (9.0)
Rubber products (1.0)
Paper & paper products (2.7)
Non-metallic mineral products (4.1)
Basic chemicals (1.8)
Textiles (2.5)
Television, radio & communication equipment (0.5)
Leather & leather products (0.5)
Professional & scientific equipment (1.1)
Machinery & equipment (10.0)
Plastic products (4.0)
Beverages (3.5)
Coke & refined petroleum products (2.0)
Food (17.9)
Other chemicals & man-made fibres (5.2)
Gold & uranium mining (20.1)
PGM mining (36.2)
Other mining (18.5)
Coal mining (20.6)
Iron ore mining (4.6)
Percent
Agriculture, forestry & fishing
Total mining
Total manufacturing
-40% -30% -20% -10% 0% 10% 20% 30%
Furniture
Leather & leather products
Footwear
Wood & wood products
Metal products (excl machinery)
Electrical machinery & equipment
Rubber products
Textiles
Basic iron & steel products
Wearing apparel
Non-metallic mineral products
Other manufacturing
Television, radio & communication equipment
Machinery & equipment
Other transport equipment
Motor vehicles, parts & accessories
Professional & scientific equipment
Plastic products
Printing, publishing & recorded media
Other chemicals & man-made fibres
Basic chemicals
Glass & glass products
Beverages
Paper & paper products
Food
Coke & refined petroleum products
Basic non-ferrous metal products
Iron ore mining
Other mining
Coal mining
PGM mining
Gold & uranium mining
Percent
Total manufacturing
Total mining
Agriculture, forestry & fishing

November 2020 IDC – Research and Information – Sectoral Trends 4
Performance of the primary and secondary sectors
Figure 5 Figure 6
Figures in brackets refer to the sub-sector's percentage
share in mining/manufacturing imports in Q2 of 2020
Figures in brackets refer to the sub-sector's percentage
share in mining/manufacturing exports in Q2 of 2020
First half of 2020 (cumulative total) compared to first half of 2019 (cumulative total)
Growth in the value of imports in the primary and secondary sectorsGrowth in the value of exports in the primary and secondary sectors
First half of 2020 (cumulative total) compared to first half of 2019 (cumulative total)
-60% -40% -20% 0% 20% 40% 60% 80% 100%
Other transport equipment (1.0)
Furniture (0.3)
Footwear (0.2)
Leather & leather products (0.3)
Motor vehicles, parts & accessories (20.5)
Basic iron & steel products (10.4)
Glass & glass products (0.2)
Metal products (excl machinery) (2.1)
Wood & wood products (0.9)
Wearing apparel (0.8)
Beverages (2.4)
Electrical machinery & equipment (1.8)
Non-metallic mineral products (0.9)
Machinery & equipment (7.0)
Coke & refined petroleum products (6.6)
Rubber products (0.9)
Basic chemicals (8.2)
Textiles (1.1)
Television, radio & communication equipment (1.1)
Basic non-ferrous metal products (6.0)
Other manufacturing (4.1)
Plastic products (1.4)
Professional & scientific equipment (1.5)
Other chemicals & man-made fibres (7.3)
Food (9.5)
Printing, publishing & recorded media (0.4)
Paper & paper products (3.3)
Other mining (21.9)
Coal mining (14.5)
Iron ore mining (17.7)
PGM mining (28.0)
Gold & uranium mining (17.9)
Percent
Agriculture, forestry & fishing
Total mining
Total manufacturing
-60% -40% -20% 0% 20%
Footwear (0.7)
Other transport equipment (1.4)
Leather & leather products (0.3)
Motor vehicles, parts & accessories (17.0)
Furniture (0.6)
Non-metallic mineral products (1.1)
Television, radio & communication equipment (4.8)
Wood & wood products (0.4)
Other manufacturing (1.4)
Wearing apparel (2.7)
Basic non-ferrous metal products (2.5)
Glass & glass products (0.3)
Coke & refined petroleum products (6.8)
Machinery & equipment (13.8)
Basic iron & steel products (1.7)
Rubber products (1.5)
Beverages (0.9)
Plastic products (1.8)
Electrical machinery & equipment (4.9)
Metal products (excl machinery) (2.2)
Paper & paper products (1.7)
Basic chemicals (5.7)
Professional & scientific equipment (3.6)
Printing, publishing & recorded media (1.7)
Food (7.0)
Other chemicals & man-made fibres (10.7)
Textiles (3.0)
Iron ore mining (0.0)
Coal mining (3.0)
Other mining (90.0)
PGM mining (1.3)
Gold & uranium mining (5.7)
Percent
Agriculture, forestry & fishing
Total mining
Total manufacturing
+78%
+70%
-100%

November 2020 IDC – Research and Information – Sectoral Trends 5
Selected trade trends
HS2 code ZAR m
H71: Natural or cultured pearls, precious stones and metals 127 053.17
H26: Ores, slag and ash 89 186.15
H27: Coal, petroleum and petroleum products 61 035.58
H87: Vehicles, parts and accessories 51 143.07
H72: Iron and steel 30 791.42
Exports Total (including others) 599 831.31
H27: Coal, petroleum and petroleum products 83 840.44
H84: Machinery and equipment, mechanical appliances 60 571.84
H85: Electrical machinery and electronic equipment 46 799.34
H98: Original equipment components for the motor vehicle industry 41 215.79
H87: Vehicles, parts and accessories 33 641.30
Imports Total (including others) 536 757.43
Imp
ort
s
Major traded products
First half of 2020 (cumulative total)
Ex
po
rts
SA trade per region
First half of 2020 (cumulative total)
SA trade growth by region
First half of 2020 (cumulative total) compared to first half of 2019 (cumulative total)
0% 10% 20% 30% 40%
Oceania
Europe (excl. EU)
Other Americas
USMCA
Middle East
Africa
EU
Asia
Other Americas
Oceania
Europe (excl. EU)
Middle East
USMCA
EU
Africa
Asia
Share of exports
Share of imports
0
30
60
90
120
150
Q1 Q22016
Q3 Q4| Q1 Q22017
Q3 Q4| Q1 Q22018
Q3 Q4| Q1 Q22019
Q3 Q4| Q1 Q22020
SA exports by broad economic classification
Capital goods Consumption goods
Intermediate goods Raw materials
ZAR billion per quarter (current v alues)
-50% -40% -30% -20% -10% 0% 10%
Middle East
Oceania
Africa
EU
USMCA
Asia
Other Americas
USMCA
Other Americas
Oceania
Europe (excl. EU)
Africa
EU
USMCA
Asia
USMCA
Export growth
Import growth
0
40
80
120
160
Q1 Q22016
Q3 Q4| Q1 Q22017
Q3 Q4| Q1 Q22018
Q3 Q4| Q1 Q22019
Q3 Q4| Q1 Q22020
SA imports by broad economic classification
Capital goods Consumption goods
Intermediate goods Raw materials
ZAR billion per quarter (current v alues)
-400
-300
-200
-100
0
100
200
300
400
Q1 Q22016
Q3 Q4| Q1 Q22017
Q3 Q4| Q1 Q22018
Q3 Q4| Q1 Q22019
Q3 Q4| Q1 Q22020
SA trade balance
Imports Exports Trade balance
ZAR billion per quarter (current v alues)
November 2020 IDC – Research and Information – Sectoral Trends 6
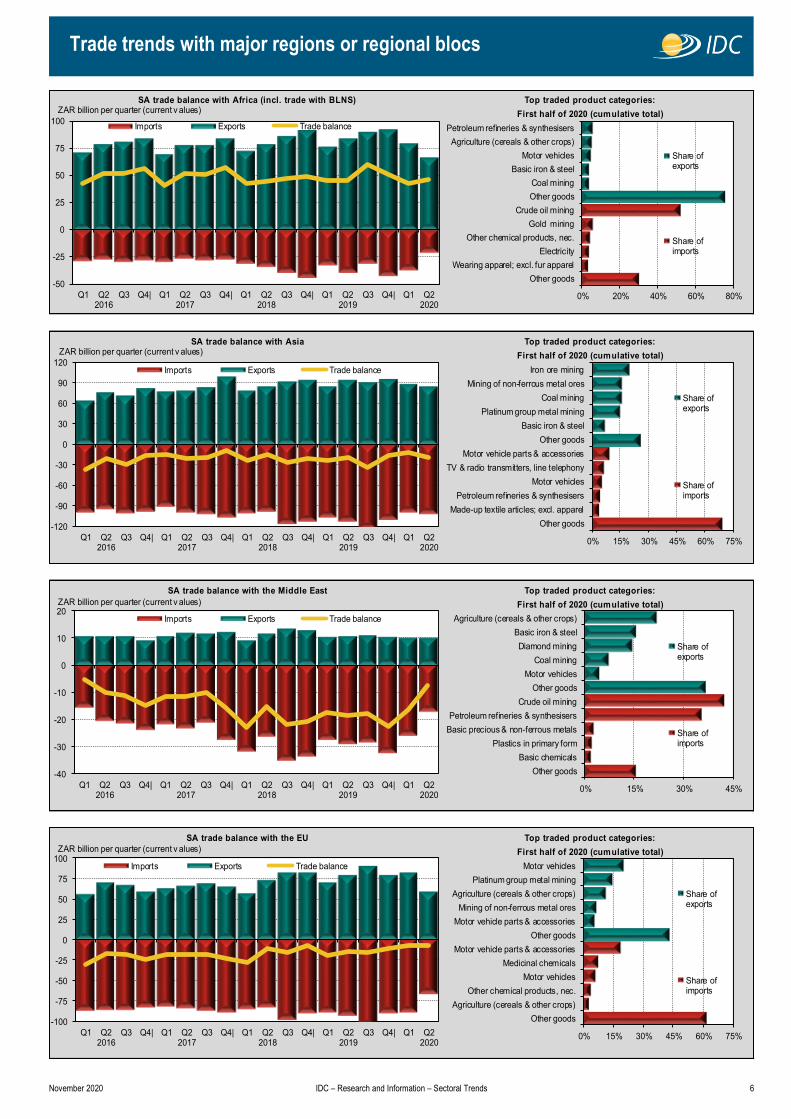
Trade trends with major regions or regional blocs
First half of 2020 (cumulative total)
SA trade balance with the EU Top traded product categories:
First half of 2020 (cumulative total)
First half of 2020 (cumulative total)
SA trade balance with Asia
SA trade balance with the Middle East Top traded product categories:
Top traded product categories:
SA trade balance with Africa (incl. trade with BLNS) Top traded product categories:
First half of 2020 (cumulative total)
-50
-25
0
25
50
75
100
Q1 Q22016
Q3 Q4| Q1 Q22017
Q3 Q4| Q1 Q22018
Q3 Q4| Q1 Q22019
Q3 Q4| Q1 Q22020
Imports Exports Trade balance
ZAR billion per quarter (current v alues)
0% 20% 40% 60% 80%
Other goods
Wearing apparel; excl. fur apparel
Electricity
Other chemical products, nec.
Gold mining
Crude oil mining
Other goods
Coal mining
Basic iron & steel
Motor vehicles
Agriculture (cereals & other crops)
Petroleum refineries & synthesisers
Share ofexports
Share ofimports
-120
-90
-60
-30
0
30
60
90
120
Q1 Q22016
Q3 Q4| Q1 Q22017
Q3 Q4| Q1 Q22018
Q3 Q4| Q1 Q22019
Q3 Q4| Q1 Q22020
Imports Exports Trade balance
ZAR billion per quarter (current v alues)
0% 15% 30% 45% 60% 75%
Other goods
Made-up textile articles; excl. apparel
Petroleum refineries & synthesisers
Motor vehicles
TV & radio transmitters, line telephony
Motor vehicle parts & accessories
Other goods
Basic iron & steel
Platinum group metal mining
Coal mining
Mining of non-ferrous metal ores
Iron ore mining
Share ofexports
Share ofimports
-100
-75
-50
-25
0
25
50
75
100
Q1 Q22016
Q3 Q4| Q1 Q22017
Q3 Q4| Q1 Q22018
Q3 Q4| Q1 Q22019
Q3 Q4| Q1 Q22020
Imports Exports Trade balance
ZAR billion per quarter (current v alues)
0% 15% 30% 45% 60% 75%
Other goods
Agriculture (cereals & other crops)
Other chemical products, nec.
Motor vehicles
Medicinal chemicals
Motor vehicle parts & accessories
Other goods
Motor vehicle parts & accessories
Mining of non-ferrous metal ores
Agriculture (cereals & other crops)
Platinum group metal mining
Motor vehicles
Share ofexports
Share ofimports
-40
-30
-20
-10
0
10
20
Q1 Q22016
Q3 Q4| Q1 Q22017
Q3 Q4| Q1 Q22018
Q3 Q4| Q1 Q22019
Q3 Q4| Q1 Q22020
Imports Exports Trade balance
ZAR billion per quarter (current v alues)
0% 15% 30% 45%
Other goods
Basic chemicals
Plastics in primary form
Basic precious & non-ferrous metals
Petroleum refineries & synthesisers
Crude oil mining
Other goods
Motor vehicles
Coal mining
Diamond mining
Basic iron & steel
Agriculture (cereals & other crops)
Share ofexports
Share ofimports

November 2020 IDC – Research and Information – Sectoral Trends 7
Trade trends with major regions or regional blocs
SA trade balance with Oceania Top traded product categories:
First half of 2020 (cumulative total)
First half of 2020 (cumulative total)
First half of 2020 (cumulative total)
First half of 2020 (cumulative total)
SA trade balance with USMCA Top traded product categories:
SA trade balance with the Americas (excluding USMCA) Top traded product categories:
SA trade balance with Europe (excluding the EU) Top traded product categories:
-8
-6
-4
-2
0
2
4
6
8
10
Q1 Q22016
Q3 Q4| Q1 Q22017
Q3 Q4| Q1 Q22018
Q3 Q4| Q1 Q22019
Q3 Q4| Q1 Q22020
Imports Exports Trade balance
ZAR billion per quarter (current v alues)
0% 15% 30% 45% 60%
Other goods
Tobacco products
Medicinal chemicals
Agriculture (cereals & other crops)
Printing industries
Basic precious & non-ferrous metals
Other goods
Basic precious & non-ferrous metals
Motor vehicles
Mining of non-ferrous metal ores
Platinum group metal mining
Agriculture (cereals & other crops)
Shareofexports
Shareofimports
-30
-20
-10
0
10
20
30
40
Q1 Q22016
Q3 Q4| Q1 Q22017
Q3 Q4| Q1 Q22018
Q3 Q4| Q1 Q22019
Q3 Q4| Q1 Q22020
Imports Exports Trade balance
ZAR billion per quarter (current v alues)
0% 15% 30% 45% 60% 75%
Other goods
Mining & construction machinery
Medical & surgical equipment, etc.
Basic chemicals
Other chemical products, nec.
Motor vehicle parts & accessories
Other goods
Basic precious & non-ferrous metals
Basic iron & steel
Basic chemicals
Motor vehicles
Platinum group metal mining
Share ofexports
Share ofimports
-12
-10
-8
-6
-4
-2
0
2
4
6
Q1 Q22016
Q3 Q4| Q1 Q22017
Q3 Q4| Q1 Q22018
Q3 Q4| Q1 Q22019
Q3 Q4| Q1 Q22020
Imports Exports Trade balance
ZAR billion per quarter (current v alues)
0% 15% 30% 45% 60%
Other goods
Pulp, paper & paperboard
Agriculture (cereals & other crops)
Slaughtering, processing of meat
Vegetable & animal oils & fats
Motor vehicle parts & accessories
Other goods
Basic chemicals
Pesticides& other agro-chemical…
Motor vehicle parts & accessories
Basic iron & steel
Basic precious & non-ferrous metals
Share ofexports
Share ofimports
-6
-4
-2
0
2
4
6
Q1 Q22016
Q3 Q4| Q1 Q22017
Q3 Q4| Q1 Q22018
Q3 Q4| Q1 Q22019
Q3 Q4| Q1 Q22020
Imports Exports Trade balance
ZAR billion per quarter (current v alues)
0% 20% 40% 60%
Other goods
Slaughtering, processing of meat
Basic iron & steel
Dairy products
Coal mining
Basic precious & non-ferrous metals
Other goods
Processing & preserving of fruit & veg
Other chemical products, nec.
Mining & construction machinery
Basic chemicals
Motor vehicles
Share ofexports
Share ofimports
November 2020 IDC – Research and Information – Sectoral Trends 8
Total Maize
Sunflow er seed
Soy beans
Groundnuts
Sorghum
Dry beans
Formal employ ment % of total employ ment Youth employ ment % of total employ ment
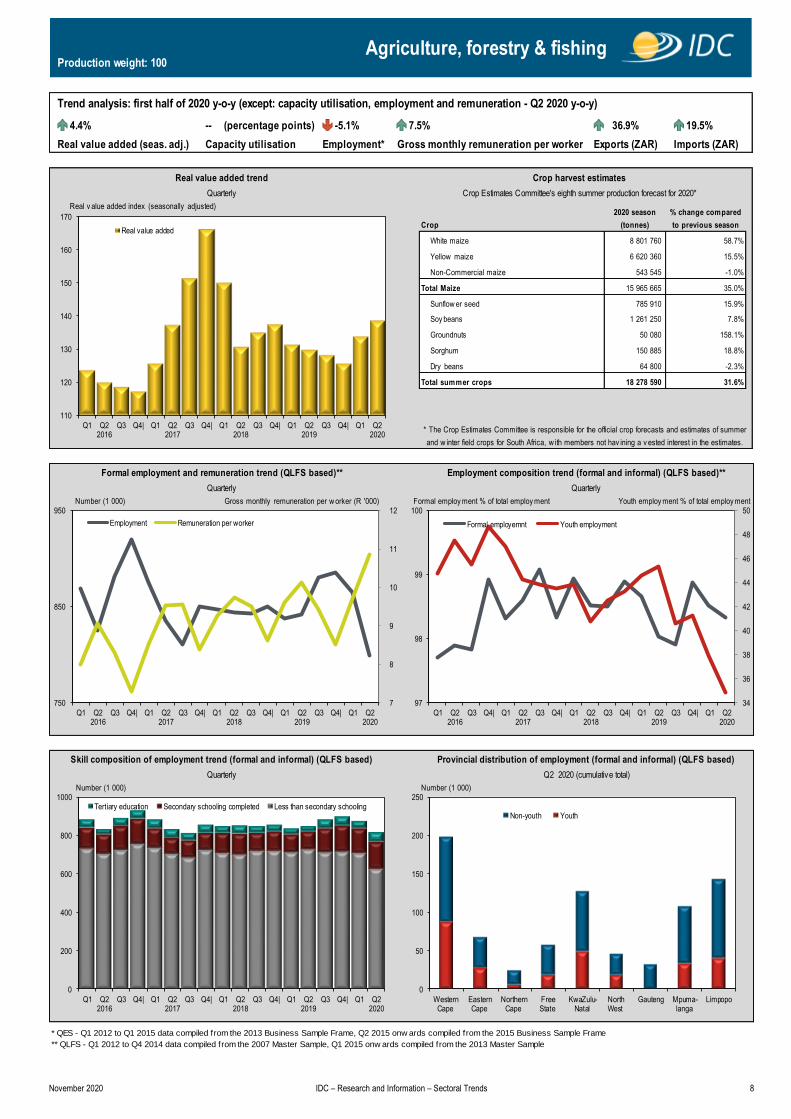
Production weight: 100
Number (1 000)
19.5%
Trend analysis: first half of 2020 y-o-y (except: capacity utilisation, employment and remuneration - Q2 2020 y-o-y)
-- (percentage points)
Capacity utilisation Exports (ZAR)
36.9%
Employment* Gross monthly remuneration per worker
-5.1% 7.5%
Crop harvest estimates
Crop Estimates Committee's eighth summer production forecast for 2020*
Agriculture, forestry & fishing
Skill composition of employment trend (formal and informal) (QLFS based)
Formal employment and remuneration trend (QLFS based)**
Quarterly
Quarterly
Real v alue added index (seasonally adjusted)% change compared
to previous season
White maize
Yellow maize
58.7%
15.5%
Crop
18.8%
-2.3%
8 801 760
31.6%
* The Crop Estimates Committee is responsible for the official crop forecasts and estimates of summer
and w inter field crops for South Africa, w ith members not hav ining a v ested interest in the estimates.
Total summer crops
6 620 360
2020 season
(tonnes)
50 080
150 885
64 800
Number (1 000)
Real value added (seas. adj.)
4.4%
Imports (ZAR)
Real value added trend
Employment composition trend (formal and informal) (QLFS based)**
Quarterly
Number (1 000) Gross monthly remuneration per w orker (R '000)
Provincial distribution of employment (formal and informal) (QLFS based)
Quarterly Q2 2020 (cumulative total)
* QES - Q1 2012 to Q1 2015 data compiled from the 2013 Business Sample Frame, Q2 2015 onw ards compiled from the 2015 Business Sample Frame
** QLFS - Q1 2012 to Q4 2014 data compiled from the 2007 Master Sample, Q1 2015 onw ards compiled from the 2013 Master Sample
Non-Commercial maize 543 545 -1.0%
15 965 665 35.0%
15.9%
7.8%
158.1%
1 261 250
18 278 590
785 910
110
120
130
140
150
160
170
Q1 Q22016
Q3 Q4| Q1 Q22017
Q3 Q4| Q1 Q22018
Q3 Q4| Q1 Q22019
Q3 Q4| Q1 Q22020
Real value added
7
8
9
10
11
12
750
850
950
Q1 Q22016
Q3 Q4| Q1 Q22017
Q3 Q4| Q1 Q22018
Q3 Q4| Q1 Q22019
Q3 Q4| Q1 Q22020
Employment Remuneration per worker
34
36
38
40
42
44
46
48
50
97
98
99
100
Q1 Q22016
Q3 Q4| Q1 Q22017
Q3 Q4| Q1 Q22018
Q3 Q4| Q1 Q22019
Q3 Q4| Q1 Q22020
Formal employemnt Youth employment
0
200
400
600
800
1000
Q1 Q22016
Q3 Q4| Q1 Q22017
Q3 Q4| Q1 Q22018
Q3 Q4| Q1 Q22019
Q3 Q4| Q1 Q22020
Tertiary education Secondary schooling completed Less than secondary schooling
0
50
100
150
200
250
WesternCape
EasternCape
NorthernCape
FreeState
KwaZulu-Natal
NorthWest
Gauteng Mpuma-langa
Limpopo
Non-youth Youth

November 2020 IDC – Research and Information – Sectoral Trends 9
Trade trends
Total per quarter
ZAR billion per quarter (current v alues)
Production weight: 100Agriculture, forestry & fishing (cont.)
Trade trends
Quarterly
% share of SA's ov erall merchandise ex ports/imports
H07: Edible vegetables and certain roots and tubers
H44: Wood and articles of wood, wood charcoal - 56.81
- 214.43
To
p e
xpo
rts
H08: Edible fruit, nuts, peel o f citrus fruit, melons
H10: Cereals
H51: Wool, animal hair, horsehair yarn and fabric thereof
H01: Live animals
H12: Oil seed, o leagic fruits, grain, seed, fruit, etc
H09: Coffee, tea, mate and spices
441.55
205.09
127.01
114.61
- 270.34
Expo rts T o tal ( including o thers) 42 859.10
Major traded export products
H08: Edible fruit, nuts, peel o f citrus fruit, melons
HS2 code: sector description
H10: Cereals
H51: Wool, animal hair, horsehair yarn and fabric thereof
H10: Cereals
H12: Oil seed, o leagic fruits, grain, seed, fruit, etc
H08: Edible fruit, nuts, peel o f citrus fruit, melons
H09: Coffee, tea, mate and spices
H07: Edible vegetables and certain roots and tubers
610.34
ZAR m
29 485.93
5 484.37
1 973.16
1 729.34
1 528.26
H08: Edible fruit, nuts, peel o f citrus fruit, melons
H01: Live animals
Major traded import products
HS2 code: sector description ZAR m
5 561.98
To
p i
mp
ort
s
497.17
H10: Cereals
440.90
H40: Rubber and articles thereof
H07: Edible vegetables and certain roots and tubers
Top trading partners (share of exports/imports) Top trading partners (value of export/imports)
First half of 2020 (cumulative total) First half of 2020 (cumulative total)
Impo rts T o tal ( including o thers)
H13: Lac, gums, resins, vegetable saps and extracts nes
H24: Tobacco and manufactured tobacco substitutes
- 30.34
- 14.89 H52: Cotton, yarn and woven fabric
- 45.02
To
p g
ain
ers
To
p l
ose
rs
7 355.28
3 520.24
440.11
244.51
- 51.64
H01: Live animals
12 813.66
First half of 2020 (cumulative total) First half of 2020 (cumulative total)
To
p g
ain
ers
To
p l
ose
rs
H12: Oil seed, o leagic fruits, grain, seed, fruit, etc
644.39
H51: Wool, animal hair, horsehair yarn and fabric thereof - 63.52
H07: Edible vegetables and certain roots and tubers 242.65
H44: Wood and articles of wood, wood charcoal - 108.76
H06: Live trees, plants, bulbs, roots, cut flowers etc - 94.93
H52: Cotton, yarn and woven fabric
H24: Tobacco and manufactured tobacco substitutes
H01: Live animals
1 271.42
1 244.74
1 242.73
1 116.76
1 858.67
H09: Coffee, tea, mate and spices
0
5
10
15
20
25
30
Q1 Q22016
Q3 Q4| Q1 Q22017
Q3 Q4| Q1 Q22018
Q3 Q4| Q1 Q22019
Q3 Q4| Q1 Q22020
Exports Imports
0% 4% 8% 12% 16% 20%
Poland
Germany
Russia
Namibia
Brazil
USA
Botswana
Netherlands
UK
China
Zimbabwe
Russia
UAE
USA
Top export destinations' share
Top import sources' share
0%
2%
4%
6%
8%
Q1 Q22016
Q3 Q4| Q1 Q22017
Q3 Q4| Q1 Q22018
Q3 Q4| Q1 Q22019
Q3 Q4| Q1 Q22020
Exports Imports
0 2 4 6 8
Poland
Germany
Russia
Namibia
Brazil
USA
Botswana
Netherlands
UK
China
Zimbabwe
Russia
UAE
USA
R billion
Top export destinations' value
Top import sources' value

November 2020 IDC – Research and Information – Sectoral Trends 10
Total miningProduction weight: 100
Trend analysis: first half of 2020 y-o-y (except: capacity utilisation, employment and remuneration - Q2 2020 y-o-y)
-18.1%
Production and sales trend
Quarterly Quarterly
-0.2% 10.0% 12.3% -26.4%
Production (seas. adj.) Rand Commodity Index Employment* Gross monthly remuneration per worker Exports (ZAR) Imports (ZAR)
Commodity index price trend (weighted - see notes)
Formal employment and remuneration trend (QES based)* Employment composition trend (formal and informal) (QLFS based)**
Quarterly Quarterly
Number (1 000) Gross monthly remuneration per w orker (R '000) Formal employ ment % of total employ ment Youth employ ment % of total employ ment
Skill composition of employment trend (formal and informal) (QLFS based) Provincial distribution of employment (formal and informal) (QLFS based)
Quarterly Q2 2020 (cumulative total)
Number (1 000)
* QES - Q1 2012 to Q1 2015 data compiled from the 2013 Business Sample Frame, Q2 2015 to Q1 2016 compiled from the 2015 Business Sample Frame, Q2 2016 onw ards compiled from
the 2017 Business Sample Frame
** QLFS - Q1 2012 to Q4 2014 data compiled from the 2007 Master Sample, Q1 2015 onw ards compiled from the 2013 Master Sample
20.3%
Production index (seasonally adjusted) Value of sales (R billion) Dollar price index (2014 =100) Rand price index (2014 = 100)
Number (1 000)
80
90
100
110
120
130
140
150
160
65
70
75
80
85
90
95
100
105
Q1 Q22016
Q3 Q4| Q1 Q22017
Q3 Q4| Q1 Q22018
Q3 Q4| Q1 Q22019
Q3 Q4| Q1 Q22020
Volume of production Value of sales
17
19
21
23
25
27
440
450
460
470
Q1 Q22016
Q3 Q4| Q1 Q22017
Q3 Q4| Q1 Q22018
Q3 Q4| Q1 Q22019
Q3 Q4| Q1 Q22020
Employment Remuneration per worker
29
32
35
38
41
97
98
99
100
Q1 Q22016
Q3 Q4| Q1 Q22017
Q3 Q4| Q1 Q22018
Q3 Q4| Q1 Q22019
Q3 Q4| Q1 Q22020
Formal employment Youth employment
0
50
100
150
200
250
300
350
400
450
500
Q1 Q22016
Q3 Q4| Q1 Q22017
Q3 Q4| Q1 Q22018
Q3 Q4| Q1 Q22019
Q3 Q4| Q1 Q22020
Tertiary education Secondary schooling completed Less than secondary schooling
0
20
40
60
80
100
120
140
WesternCape
EasternCape
NorthernCape
FreeState
KwaZulu-Natal
NorthWest
Gauteng Mpuma-langa
Limpopo
Non-youth Youth
90
100
110
120
130
140
150
160
60
70
80
90
100
110
120
130
140
Q1 Q22016
Q3 Q4| Q1 Q22017
Q3 Q4| Q1 Q22018
Q3 Q4| Q1 Q22019
Q3 Q4| Q1 Q22020
Dollar index Rand index

November 2020 IDC – Research and Information – Sectoral Trends 11
Total mining (cont.)Production weight: 100
Trade trends (value terms)
Total per quarter
ZAR billion per quarter (current v alues)
Trade trends (% of total exports/imports)
Quarterly
% share of SA's ov erall merchandise ex ports/imports
Major traded export products Major traded import products
First half of 2020 (cumulative total) First half of 2020 (cumulative total)
HS2 code: sector description ZAR m HS2 code: sector description ZAR m
To
p e
xpo
rts
H71: Natural or cultured pearls, precious stones and metals 120 766.70
To
p i
mp
ort
s
H27: Coal, petro leum and petro leum products 51 254.46
H26: Ores, slag and ash 87 368.99 H71: Natural or cultured pearls, precious stones and metals 6 604.66
H27: Coal, petro leum and petro leum products 35 759.74 H25: Salt, sulphur, earth, stone, plaster, lime and cement 894.21
H25: Salt, sulphur, earth, stone, plaster, lime and cement 2 527.03 H26: Ores, slag and ash 169.50
Expo rts T o tal ( including o thers) 246 422.46 Impo rts T o tal ( including o thers) 58 922.83
To
p g
ain
ers
H71: Natural or cultured pearls, precious stones and metals 31 600.27
To
p g
ain
ers
H27: Coal, petro leum and petro leum products 619.92
To
p l
ose
rs
H26: Ores, slag and ash -4 627.39
To
p l
ose
rs
H27: Coal, petro leum and petro leum products -19 719.37
H25: Salt, sulphur, earth, stone, plaster, lime and cement - 578.77 H26: Ores, slag and ash - 548.01
H71: Natural or cultured pearls, precious stones and metals - 482.66
Top trading partners (share of exports/imports) Top trading partners (value of export/imports)
First half of 2020 (cumulative total) First half of 2020 (cumulative total)
H25: Salt, sulphur, earth, stone, plaster, lime and cement - 386.69
20
50
80
110
140
Q1 Q22016
Q3 Q4| Q1 Q22017
Q3 Q4| Q1 Q22018
Q3 Q4| Q1 Q22019
Q3 Q4| Q1 Q22020
Exports Imports
0% 10% 20% 30% 40%
Nigeria
Saudi Arabia
Ghana
UAE
Namibia
Mozambique
Australia
China
USA
India
Japan
UK
Hong Kong
Germany
Top export destinations' share
Top import sources' share
0%
10%
20%
30%
40%
50%
Q1 Q22016
Q3 Q4| Q1 Q22017
Q3 Q4| Q1 Q22018
Q3 Q4| Q1 Q22019
Q3 Q4| Q1 Q22020
Exports Imports
0 15 30 45 60
Nigeria
Saudi Arabia
Ghana
UAE
Namibia
Mozambique
Australia
China
USA
India
Japan
UK
Hong Kong
Germany
R billion
Top export destinations' value
Top import sources' value

November 2020 IDC – Research and Information – Sectoral Trends 12
Skill composition of employment trend (formal and informal) (QLFS based) Provincial distribution of employment (formal and informal) (QLFS based)
Quarterly Q2 2020 (cumulative total)
Number (1 000) Number (1 000)
* QES - Q1 2012 to Q1 2015 data compiled from the 2013 Business Sample Frame, Q2 2015 to Q1 2016 compiled from the 2015 Business Sample Frame, Q2 2016 onw ards compiled from
the 2017 Business Sample Frame
** QLFS - Q1 2012 to Q4 2014 data compiled from the 2007 Master Sample, Q1 2015 onw ards compiled from the 2013 Master Sample
Formal employment and remuneration trend (QES based)* Employment composition trend (formal and informal) (QLFS based)**
Quarterly Quarterly
Number (1 000) Gross monthly remuneration per w orker (R '000) Formal employ ment % of total employ ment Youth employ ment % of total employ ment
Production and sales trend Gold price trend
Quarterly Quarterly
Production index (seasonally adjusted) Value of sales (R billion) Dollar price($/oz) Rand price (R/oz)
Gold & uranium miningProduction weight: 16.8
Trend analysis: first half of 2020 y-o-y (except: capacity utilisation, employment and remuneration - Q2 2020 y-o-y)
-11.6% -3.0% 18.6% 66.2% 78.0%
Production (seas. adj.) Rand gold price Employment* Gross monthly remuneration per worker Exports (ZAR) Imports (ZAR)
63.3%
10
14
18
22
26
30
34
38
40
50
60
70
80
90
100
110
Q1 Q22016
Q3 Q4| Q1 Q22017
Q3 Q4| Q1 Q22018
Q3 Q4| Q1 Q22019
Q3 Q4| Q1 Q22020
Volume of production Value of sales
17
19
21
23
25
85
90
95
100
105
110
115
120
125
Q1 Q22016
Q3 Q4| Q1 Q22017
Q3 Q4| Q1 Q22018
Q3 Q4| Q1 Q22019
Q3 Q4| Q1 Q22020
Employment Remuneration per worker
15
25
35
45
92
95
98
101
Q1 Q22016
Q3 Q4| Q1 Q22017
Q3 Q4| Q1 Q22018
Q3 Q4| Q1 Q22019
Q3 Q4| Q1 Q22020
Formal employment Youth employment
0
20
40
60
80
100
120
140
Q1 Q22016
Q3 Q4| Q1 Q22017
Q3 Q4| Q1 Q22018
Q3 Q4| Q1 Q22019
Q3 Q4| Q1 Q22020
Tertiary education
Secondary schooling completed
Less than secondary schooling
0
10
20
30
40
WesternCape
EasternCape
NorthernCape
FreeState
KwaZulu-Natal
NorthWest
Gauteng Mpuma-langa
Limpopo
Non-youth Youth
12 000
16 000
20 000
24 000
28 000
32 000
1100
1300
1500
1700
1900
Q1 Q2
2016
Q3 Q4| Q1 Q2
2017
Q3 Q4| Q1 Q2
2018
Q3 Q4| Q1 Q2
2019
Q3 Q4| Q1 Q2
2020
Dollar price Rand price

November 2020 IDC – Research and Information – Sectoral Trends 13
Top trading partners (share of exports/imports) Top trading partners (value of export/imports)
First half of 2020 (cumulative total) First half of 2020 (cumulative total)
To
p l
ose
rs
To
p l
ose
rs
To
p g
ain
ers
H7108: Gold, unwrought, semi-manufactured, etc 17 563.30
To
p g
ain
ers
H7108: Gold, unwrought, semi-manufactured, etc 1 470.29
Expo rts T o tal ( including o thers) 44 106.63 Impo rts T o tal ( including o thers) 3 355.46
Major traded export products Major traded import products
First half of 2020 (cumulative total) First half of 2020 (cumulative total)
HS4 code: sector description ZAR m HS4 code: sector description ZAR m
To
p e
xpo
rts
H7108: Gold, unwrought, semi-manufactured, etc 44 106.63
To
p i
mp
ort
s
H7108: Gold, unwrought, semi-manufactured, etc 3 355.46
Trade trends (value terms) Trade trends (% of total exports/imports)
Total per quarter Quarterly
ZAR billion per quarter (current v alues) % share of SA's ov erall merchandise ex ports/imports
Gold & uranium mining (cont.)Production weight: 16.8
0
5
10
15
20
25
30
Q1 Q22016
Q3 Q4| Q1 Q22017
Q3 Q4| Q1 Q22018
Q3 Q4| Q1 Q22019
Q3 Q4| Q1 Q22020
Exports Imports
0% 25% 50% 75% 100%
Namibia
Botswana
Antigua and Barbuda
China
Armenia
Åland Islands
Bulgaria
Top export destinations' share
Top import sources' share
Gold exports are classified as unallocated
0%
2%
4%
6%
8%
Q1 Q22016
Q3 Q4| Q1 Q22017
Q3 Q4| Q1 Q22018
Q3 Q4| Q1 Q22019
Q3 Q4| Q1 Q22020
Exports Imports
0.0 0.5 1.0 1.5 2.0 2.5 3.0 3.5
Namibia
Botswana
Antigua and Barbuda
China
Armenia
Åland Islands
Bulgaria
R billion
Top export destinations' value
Top import sources' value
Gold exports are classified as unallocated

November 2020 IDC – Research and Information – Sectoral Trends 14
Coal miningProduction weight: 25.0
Trend analysis: first half of 2020 y-o-y (except: capacity utilisation, employment and remuneration - Q2 2020 y-o-y)
-4.3% 3.0% 1.9% 9.5% 2.0% -53.3%
Production (seas. adj.) Rand iron ore price Employment* Gross monthly remuneration per worker Exports (ZAR) Imports (ZAR)
Production and sales trend Iron ore price trend
Quarterly Quarterly
Production index (seasonally adjusted) Value of sales (R billion) Dollar price ($/tonne) Rand price (R/tonne)
Formal employment and remuneration trend (QES based)* Employment composition trend (formal and informal) (QLFS based)**
Quarterly Quarterly
Number (1 000) Gross monthly remuneration per w orker (R '000) Formal employ ment % of total employ ment Youth employ ment % of total employ ment
* QES - Q1 2012 to Q1 2015 data compiled from the 2013 Business Sample Frame, Q2 2015 to Q1 2016 compiled from the 2015 Business Sample Frame, Q2 2016 onw ards compiled from
the 2017 Business Sample Frame
** QLFS - Q1 2012 to Q4 2014 data compiled from the 2007 Master Sample, Q1 2015 onw ards compiled from the 2013 Master Sample
Skill composition of employment trend (formal and informal) (QLFS based) Provincial distribution of employment (formal and informal) (QLFS based)
Quarterly Q2 2020 (cumulative total)
Number (1 000) Number (1 000)
20
25
30
35
40
45
90
93
96
99
102
105
108
Q1 Q22016
Q3 Q4| Q1 Q22017
Q3 Q4| Q1 Q22018
Q3 Q4| Q1 Q22019
Q3 Q4| Q1 Q22020
Volume of production Value of sales
19
21
23
25
27
70
75
80
85
90
95
100
Q1 Q22016
Q3 Q4| Q1 Q22017
Q3 Q4| Q1 Q22018
Q3 Q4| Q1 Q22019
Q3 Q4| Q1 Q22020
Employment Remuneration per worker
25
35
45
55
91
94
97
100
103
Q1 Q22016
Q3 Q4| Q1 Q22017
Q3 Q4| Q1 Q22018
Q3 Q4| Q1 Q22019
Q3 Q4| Q1 Q22020
Formal employment Youth employment
0
10
20
30
40
50
60
70
80
90
Q1 Q22016
Q3 Q4| Q1 Q22017
Q3 Q4| Q1 Q22018
Q3 Q4| Q1 Q22019
Q3 Q4| Q1 Q22020
Tertiary education Secondary schooling completed Less than secondary schooling
0
10
20
30
40
50
60
70
WesternCape
EasternCape
NorthernCape
FreeState
KwaZulu-Natal
NorthWest
Gauteng Mpuma-langa
Limpopo
Non-youth Youth
600
800
1 000
1 200
1 400
1 600
40
55
70
85
100
115
Q1 Q22016
Q3 Q4| Q1 Q22017
Q3 Q4| Q1 Q22018
Q3 Q4| Q1 Q22019
Q3 Q4| Q1 Q22020
Dollar price Rand price

November 2020 IDC – Research and Information – Sectoral Trends 15
Coal mining (cont.)Production weight: 25.0
Trade trends (value terms) Trade trends (% of total exports/imports)
Total per quarter Quarterly
ZAR billion per quarter (current v alues) % share of SA's ov erall merchandise ex ports/imports
Major traded export products Major traded import products
First half of 2020 (cumulative total) First half of 2020 (cumulative total)
HS4 code: sector description ZAR m
H2703: Peat (including peat litter) 56.93
H2702: Lignite, except jet 0.03 H2702: Lignite, except jet 0.95
HS4 code: sector description ZAR m
To
p e
xpo
rts
H2701: Coal, briquettes, ovoids etc, made from coal 35 672.51
To
p i
mp
ort
s
H2701: Coal, briquettes, ovoids etc, made from coal 1 734.76
H2703: Peat (including peat litter) 2.23
Expo rts T o tal ( including o thers) 35 674.78 Impo rts T o tal ( including o thers) 1 792.64
To
p g
ain
ers
H2701: Coal, briquettes, ovoids etc, made from coal 715.33
To
p g
ain
ers
H2702: Lignite, except jet 0.00
- 7.97
H2702: Lignite, except jet - 0.02
First half of 2020 (cumulative total)
Top trading partners (share of exports/imports) Top trading partners (value of export/imports)
First half of 2020 (cumulative total)
To
p l
ose
rs
H2703: Peat (including peat litter) - 4.97
To
p l
ose
rs
H2701: Coal, briquettes, ovoids etc, made from coal -2 041.52
H2703: Peat (including peat litter)
0
5
10
15
20
25
30
Q1 Q22016
Q3 Q4| Q1 Q22017
Q3 Q4| Q1 Q22018
Q3 Q4| Q1 Q22019
Q3 Q4| Q1 Q22020
Exports Imports
0% 15% 30% 45% 60%
Australia
Mozambique
Russia
Swaziland
Botswana
Vietnam
Netherlands
India
Pakistan
Vietnam
Morocco
Sri Lanka
South Korea
UAE
Top export destinations' share
Top import sources' share
0%
3%
6%
9%
Q1 Q22016
Q3 Q4| Q1 Q22017
Q3 Q4| Q1 Q22018
Q3 Q4| Q1 Q22019
Q3 Q4| Q1 Q22020
Exports Imports
0 5 10 15 20
Australia
Mozambique
Russia
Swaziland
Botswana
Vietnam
Netherlands
India
Pakistan
Vietnam
Morocco
Sri Lanka
South Korea
UAE
R billion
Top export destinations' value
Top import sources' value

November 2020 IDC – Research and Information – Sectoral Trends 16
PGM miningProduction weight: 22.4
Trend analysis: first half of 2020 y-o-y (except: capacity utilisation, employment and remuneration - Q2 2020 y-o-y)
-25.8% 17.1% -1.5% 9.9% 35.3% -15.2%
Production (seas. adj.) Rand iron ore price Employment* Gross monthly remuneration per worker Exports (ZAR) Imports (ZAR)
Production and sales trend Iron ore price trend
Quarterly Quarterly
Production index (seasonally adjusted) Value of sales (R billion) Dollar price ($/tonne) Rand price (R/tonne)
Formal employment and remuneration trend (QES based)* Employment composition trend (formal and informal) (QLFS based)**
Quarterly Quarterly
Number (1 000) Gross monthly remuneration per w orker (R '000) Formal employ ment % of total employ ment Youth employ ment % of total employ ment
* QES - Q1 2012 to Q1 2015 data compiled from the 2013 Business Sample Frame, Q2 2015 to Q1 2016 compiled from the 2015 Business Sample Frame, Q2 2016 onw ards compiled from
the 2017 Business Sample Frame
** QLFS - Q1 2012 to Q4 2014 data compiled from the 2007 Master Sample, Q1 2015 onw ards compiled from the 2013 Master Sample
Skill composition of employment trend (formal and informal) (QLFS based) Provincial distribution of employment (formal and informal) (QLFS based)
Quarterly Q2 2020 (cumulative total)
Number (1 000) Number (1 000)
15
20
25
30
35
40
45
50
50
60
70
80
90
100
110
120
Q1 Q22016
Q3 Q4| Q1 Q22017
Q3 Q4| Q1 Q22018
Q3 Q4| Q1 Q22019
Q3 Q4| Q1 Q22020
Volume of production Value of sales
18
20
22
24
26
28
30
160
170
180
Q1 Q22016
Q3 Q4| Q1 Q22017
Q3 Q4| Q1 Q22018
Q3 Q4| Q1 Q22019
Q3 Q4| Q1 Q22020
Employment Remuneration per worker
Q1 Q22016
Q3 Q4| Q1 Q22017
Q3 Q4| Q1 Q22018
Q3 Q4| Q1 Q22019
Q3 Q4| Q1 Q22020
Q1 Q22016
Q3 Q4| Q1 Q22017
Q3 Q4| Q1 Q22018
Q3 Q4| Q1 Q22019
Q3 Q4| Q1 Q22020
PGM employment data is not reported seperately by StatsSA, but instead included in "other mining" data
WesternCape
EasternCape
NorthernCape
FreeState
KwaZulu-Natal
NorthWest
Gauteng Mpuma-langa
Limpopo
PGM employment data is not reported seperately by StatsSA, but instead included in "other mining" data
11 000
12 000
13 000
14 000
15 000
16 000
700
800
900
1 000
1 100
1 200
Q1 Q22016
Q3 Q4| Q1 Q22017
Q3 Q4| Q1 Q22018
Q3 Q4| Q1 Q22019
Q3 Q4| Q1 Q22020
Dollar price Rand price
PGM employment data is not reported seperately by StatsSA, but instead included in "other mining" data

November 2020 IDC – Research and Information – Sectoral Trends 17
PGM mining (cont.)Production weight: 22.4
Trade trends (value terms) Trade trends (% of total exports/imports)
Total per quarter Quarterly
ZAR billion per quarter (current v alues) % share of SA's ov erall merchandise ex ports/imports
Major traded export products Major traded import products
First half of 2020 (cumulative total) First half of 2020 (cumulative total)
HS4 code: sector description ZAR m
H7111: M etals, clad with platinum, semi-manufactured 0.01
HS4 code: sector description ZAR m
To
p e
xpo
rts
H7110: P latinum, unwrought, semi-manufactured 69 049.30
To
p i
mp
ort
s
H7110: P latinum, unwrought, semi-manufactured 741.52
H7111: M etals, clad with platinum, semi-manufactured 0.00
Expo rts T o tal ( including o thers) 69 049.30 Impo rts T o tal ( including o thers) 741.53
To
p g
ain
ers
H7110: P latinum, unwrought, semi-manufactured 18 023.55
To
p g
ain
ers
- 0.05
First half of 2020 (cumulative total)
Top trading partners (share of exports/imports) Top trading partners (value of export/imports)
First half of 2020 (cumulative total)
To
p l
ose
rs
H7111: M etals, clad with platinum, semi-manufactured - 0.04
To
p l
ose
rs
H7110: P latinum, unwrought, semi-manufactured - 133.22
H7111: M etals, clad with platinum, semi-manufactured
0
5
10
15
20
25
30
35
40
45
Q1 Q22016
Q3 Q4| Q1 Q22017
Q3 Q4| Q1 Q22018
Q3 Q4| Q1 Q22019
Q3 Q4| Q1 Q22020
Exports Imports
0% 10% 20% 30% 40% 50%
Germany
Russia
Switzerland
Japan
UK
Italy
Belgium
USA
UK
Japan
Hong Kong
Germany
Switzerland
Netherlands
Top export destinations' share
Top import sources' share
0%
3%
6%
9%
12%
15%
Q1 Q22016
Q3 Q4| Q1 Q22017
Q3 Q4| Q1 Q22018
Q3 Q4| Q1 Q22019
Q3 Q4| Q1 Q22020
Exports Imports
0 5 10 15 20
Germany
Russia
Switzerland
Japan
UK
Italy
Belgium
USA
UK
Japan
Hong Kong
Germany
Switzerland
Netherlands
R billion
Top export destinations' value
Top import sources' value

November 2020 IDC – Research and Information – Sectoral Trends 18
Skill composition of employment trend (formal and informal) (QLFS based) Provincial distribution of employment (formal and informal) (QLFS based)
Quarterly Q2 2020 (cumulative total)
Number (1 000) Number (1 000)
* QES - Q1 2012 to Q1 2015 data compiled from the 2013 Business Sample Frame, Q2 2015 to Q1 2016 compiled from the 2015 Business Sample Frame, Q2 2016 onw ards compiled from
the 2017 Business Sample Frame
** QLFS - Q1 2012 to Q4 2014 data compiled from the 2007 Master Sample, Q1 2015 onw ards compiled from the 2013 Master Sample
Formal employment and remuneration trend (QES based)* Employment composition trend (formal and informal) (QLFS based)**
Quarterly Quarterly
Number (1 000) Gross monthly remuneration per w orker (R '000) Formal employ ment % of total employ ment Youth employ ment % of total employ ment
Production and sales trend Iron ore price trend
Quarterly Quarterly
Production index (seasonally adjusted) Value of sales (R billion) Dollar price ($/tonne) Rand price (R/tonne)
Iron ore miningProduction weight: 10.8
Trend analysis: first half of 2020 y-o-y (except: capacity utilisation, employment and remuneration - Q2 2020 y-o-y)
-37.5% 10.1% 0.0% 8.8% -100.0%
Production (seas. adj.) Rand iron ore price Employment* Gross monthly remuneration per worker Exports (ZAR) Imports (ZAR)
3.0%
5
8
11
14
17
20
23
30
45
60
75
90
105
120
Q1 Q22016
Q3 Q4| Q1 Q22017
Q3 Q4| Q1 Q22018
Q3 Q4| Q1 Q22019
Q3 Q4| Q1 Q22020
Volume of production Value of sales
15
20
25
30
35
14
16
18
20
22
24
Q1 Q22016
Q3 Q4| Q1 Q22017
Q3 Q4| Q1 Q22018
Q3 Q4| Q1 Q22019
Q3 Q4| Q1 Q22020
Employment Remuneration per worker
25
40
55
70
93
95
97
99
101
Q1 Q22016
Q3 Q4| Q1 Q22017
Q3 Q4| Q1 Q22018
Q3 Q4| Q1 Q22019
Q3 Q4| Q1 Q22020
Formal employment Youth employment
0
5
10
15
20
25
Q1 Q22016
Q3 Q4| Q1 Q22017
Q3 Q4| Q1 Q22018
Q3 Q4| Q1 Q22019
Q3 Q4| Q1 Q22020
Tertiary education Secondary schooling completed Less than secondary schooling
0
4
8
12
WesternCape
EasternCape
NorthernCape
FreeState
KwaZulu-Natal
NorthWest
Gauteng Mpuma-langa
Limpopo
Non-youth Youth
700
1000
1300
1600
40
50
60
70
80
90
100
110
Q1 Q22016
Q3 Q4| Q1 Q22017
Q3 Q4| Q1 Q22018
Q3 Q4| Q1 Q22019
Q3 Q4| Q1 Q22020
Dollar price Rand price

November 2020 IDC – Research and Information – Sectoral Trends 19
Top trading partners (share of exports/imports) Top trading partners (value of export/imports)
First half of 2020 (cumulative total) First half of 2020 (cumulative total)
To
p l
ose
rs
To
p l
ose
rs
H2601: Iron ores and concentrates, roasted iron pyrites - 511.69
To
p g
ain
ers
H2601: Iron ores and concentrates, roasted iron pyrites 3 536.65
To
p g
ain
ers
Expo rts T o tal ( including o thers) 43 710.73 Impo rts T o tal ( including o thers) 0.17
Major traded export products Major traded import products
First half of 2020 (cumulative total) First half of 2020 (cumulative total)
HS4 code: sector description ZAR m HS4 code: sector description ZAR m
To
p e
xpo
rts
H2601: Iron ores and concentrates, roasted iron pyrites 43 710.73
To
p i
mp
ort
s
H2601: Iron ores and concentrates, roasted iron pyrites 0.17
Trade trends (value terms) Trade trends (% of total exports/imports)
Total per quarter Quarterly
ZAR billion per quarter (current v alues) % share of SA's ov erall merchandise ex ports/imports
Iron ore mining (cont.)Production weight: 10.8
0
5
10
15
20
25
Q1 Q22016
Q3 Q4| Q1 Q22017
Q3 Q4| Q1 Q22018
Q3 Q4| Q1 Q22019
Q3 Q4| Q1 Q22020
Exports Imports
0% 15% 30% 45% 60% 75%
Namibia
USA
Turkey
Australia
Brazil
Belgium
Canada
China
Netherlands
South Korea
Mozambique
Japan
Germany
Slovenia
Top export destinations' share
Top import sources' share
0%
3%
6%
9%
Q1 Q22016
Q3 Q4| Q1 Q22017
Q3 Q4| Q1 Q22018
Q3 Q4| Q1 Q22019
Q3 Q4| Q1 Q22020
Exports Imports
0 5 10 15 20 25 30
Namibia
USA
Turkey
Australia
Brazil
Belgium
Canada
China
Netherlands
South Korea
Mozambique
Japan
Germany
Slovenia
R billion
Top export destinations' value
Top import sources' value

November 2020 IDC – Research and Information – Sectoral Trends 20
Skill composition of employment trend (formal and informal) (QLFS based) Provincial distribution of employment (formal and informal) (QLFS based)
Quarterly Q2 2020 (cumulative total)
Number (1 000) Number (1 000)
* QES - Q1 2012 to Q1 2015 data compiled from the 2013 Business Sample Frame, Q2 2015 to Q1 2016 compiled from the 2015 Business Sample Frame, Q2 2016 onw ards compiled from
the 2017 Business Sample Frame
** QLFS - Q1 2012 to Q4 2014 data compiled from the 2007 Master Sample, Q1 2015 onw ards compiled from the 2013 Master Sample
Formal employment and remuneration trend (QES based)* Employment composition trend (formal and informal) (QLFS based)**
Quarterly Quarterly
Number (1 000) Gross monthly remuneration per w orker (R '000) Formal employ ment % of total employ ment Youth employ ment % of total employ ment
Production and sales trend Oil price trend
Quarterly Quarterly
Production index (seasonally adjusted) Value of sales (R billion) Dollar price ($/barrel) Rand price (R/barrel)
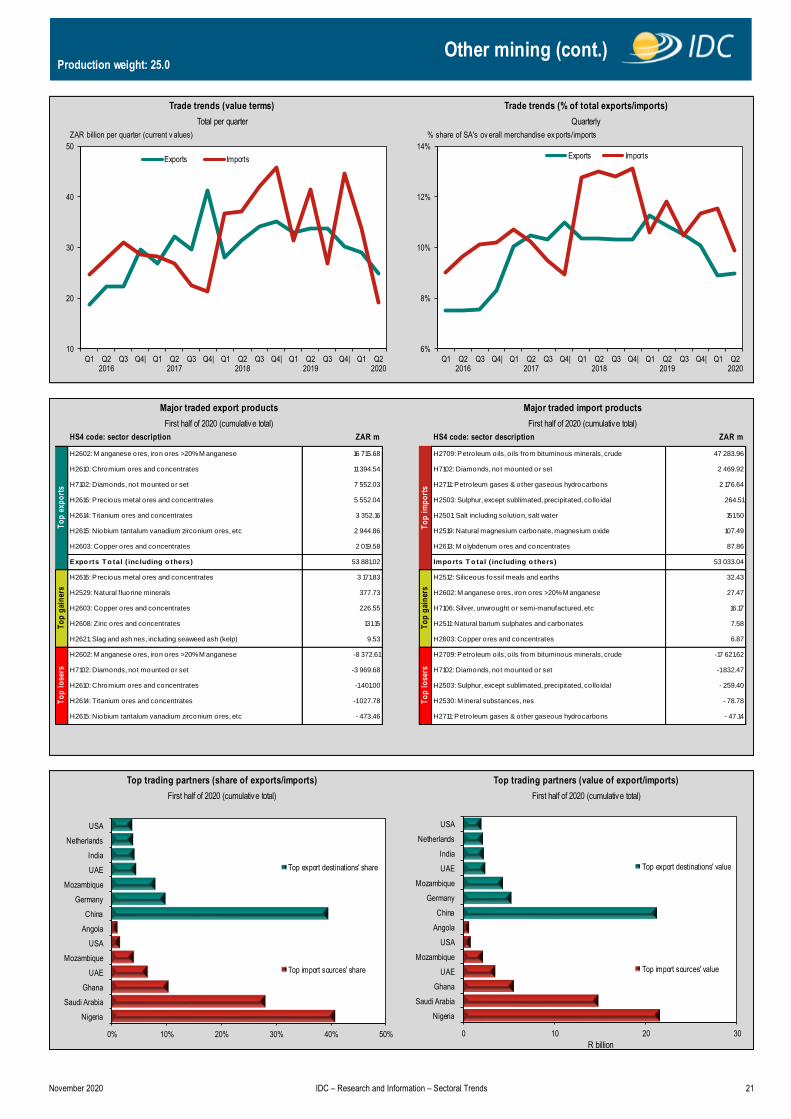
Other miningProduction weight: 25.0
Trend analysis: first half of 2020 y-o-y (except: capacity utilisation, employment and remuneration - Q2 2020 y-o-y)
-20.2% 0.9% 4.8% -19.2% -27.3%
Production (seas. adj.) Rand oil price Employment* Gross monthly remuneration per worker Exports (ZAR) Imports (ZAR)
-40.5%
20
25
30
35
40
70
80
90
100
110
120
130
Q1 Q22016
Q3 Q4| Q1 Q22017
Q3 Q4| Q1 Q22018
Q3 Q4| Q1 Q22019
Q3 Q4| Q1 Q22020
Volume of production Value of sales
14
16
18
20
22
24
26
72
75
78
81
84
87
90
Q1 Q22016
Q3 Q4| Q1 Q22017
Q3 Q4| Q1 Q22018
Q3 Q4| Q1 Q22019
Q3 Q4| Q1 Q22020
Employment Remuneration per worker
25
30
35
40
45
96
97
98
99
100
101
Q1 Q22016
Q3 Q4| Q1 Q22017
Q3 Q4| Q1 Q22018
Q3 Q4| Q1 Q22019
Q3 Q4| Q1 Q22020
Formal employment Youth employment
0
50
100
150
200
250
300
350
Q1 Q22016
Q3 Q4| Q1 Q22017
Q3 Q4| Q1 Q22018
Q3 Q4| Q1 Q22019
Q3 Q4| Q1 Q22020
Tertiary education
Secondary schooling completed
Less than secondary schooling
Note that PGM employment is included in this data
0
30
60
90
120
WesternCape
EasternCape
NorthernCape
FreeState
KwaZulu-Natal
NorthWest
Gauteng Mpuma-langa
Limpopo
Non-youth Youth
Note that PGM employment is included in this data
500
600
700
800
900
1000
1100
1200
30
40
50
60
70
80
90
Q1 Q22016
Q3 Q4| Q1 Q22017
Q3 Q4| Q1 Q22018
Q3 Q4| Q1 Q22019
Q3 Q4| Q1 Q22020
Dollar price Rand price
Note that PGM employment is included in this data
November 2020 IDC – Research and Information – Sectoral Trends 21
Top trading partners (share of exports/imports) Top trading partners (value of export/imports)
First half of 2020 (cumulative total) First half of 2020 (cumulative total)
To
p l
ose
rs
H2602: M anganese ores, iron ores >20% M anganese -8 372.61
To
p l
ose
rs
H2709: Petro leum oils, o ils from bituminous minerals, crude -17 621.62
H2614: Titanium ores and concentrates -1 027.78 H2530: M ineral substances, nes - 78.78
H2615: Niobium tantalum vanadium zirconium ores, etc - 473.46 H2711: Petro leum gases & other gaseous hydrocarbons - 47.14
H7102: Diamonds, not mounted or set -3 969.68 H7102: Diamonds, not mounted or set -1 832.47
H2610: Chromium ores and concentrates -1 401.00 H2503: Sulphur, except sublimated, precipitated, co llo idal - 259.40
H2603: Copper ores and concentrates 226.55 H7106: Silver, unwrought or semi-manufactured, etc 16.17
H2608: Zinc ores and concentrates 131.15 H2511: Natural barium sulphates and carbonates 7.58To
p g
ain
ers
H2616: Precious metal ores and concentrates 3 171.83
To
p g
ain
ers
H2512: Siliceous fossil meals and earths 32.43
H2529: Natural fluorine minerals 377.73 H2602: M anganese ores, iron ores >20% M anganese 27.47
H2621: Slag and ash nes, including seaweed ash (kelp) 9.53 H2603: Copper ores and concentrates 6.87
Expo rts T o tal ( including o thers) 53 881.02 Impo rts T o tal ( including o thers) 53 033.04
H2614: Titanium ores and concentrates 3 352.16 H2501: Salt including so lution, salt water 151.50
H2615: Niobium tantalum vanadium zirconium ores, etc 2 944.86 H2519: Natural magnesium carbonate, magnesium oxide 107.49
2 176.64
H2616: Precious metal ores and concentrates 5 552.04 H2503: Sulphur, except sublimated, precipitated, co llo idal 264.51
H2603: Copper ores and concentrates 2 019.58 H2613: M olybdenum ores and concentrates 87.86
Major traded export products Major traded import products
First half of 2020 (cumulative total) First half of 2020 (cumulative total)
HS4 code: sector description ZAR m HS4 code: sector description ZAR m
To
p e
xpo
rts
H2602: M anganese ores, iron ores >20% M anganese 16 715.68
To
p i
mp
ort
s
H2709: Petro leum oils, o ils from bituminous minerals, crude 47 283.96
H2610: Chromium ores and concentrates 11 394.54 H7102: Diamonds, not mounted or set 2 469.92
H7102: Diamonds, not mounted or set 7 552.03 H2711: Petro leum gases & other gaseous hydrocarbons
Trade trends (value terms) Trade trends (% of total exports/imports)
Total per quarter Quarterly
ZAR billion per quarter (current v alues) % share of SA's ov erall merchandise ex ports/imports
Other mining (cont.)Production weight: 25.0
10
20
30
40
50
Q1 Q22016
Q3 Q4| Q1 Q22017
Q3 Q4| Q1 Q22018
Q3 Q4| Q1 Q22019
Q3 Q4| Q1 Q22020
Exports Imports
0% 10% 20% 30% 40% 50%
Nigeria
Saudi Arabia
Ghana
UAE
Mozambique
USA
Angola
China
Germany
Mozambique
UAE
India
Netherlands
USA
Top export destinations' share
Top import sources' share
6%
8%
10%
12%
14%
Q1 Q22016
Q3 Q4| Q1 Q22017
Q3 Q4| Q1 Q22018
Q3 Q4| Q1 Q22019
Q3 Q4| Q1 Q22020
Exports Imports
0 10 20 30
Nigeria
Saudi Arabia
Ghana
UAE
Mozambique
USA
Angola
China
Germany
Mozambique
UAE
India
Netherlands
USA
R billion
Top export destinations' value
Top import sources' value

November 2020 IDC – Research and Information – Sectoral Trends 22
.Total manufacturing
Production weight: 100
Trend analysis: first half of 2020 y-o-y (except: capacity utilisation, employment and remuneration - Q2 2020 y-o-y)
-8.2% 15.0% -15.0% -13.2%
Employment* Gross monthly remuneration per worker Exports (ZAR) Imports (ZAR)Production (seas. adj.) Capacity utilisation
(percentage points)-17.8% -20.4
Production and sales trend Utilisation of production capacity
Quarterly Quarterly
Production index (seasonally adjusted) Value of sales (R billion) Capacity utilisation (%)
Formal employment and remuneration trend (QES based)* Employment composition trend (formal and informal) (QLFS based)**
Quarterly Quarterly
Number (1 000) Gross monthly remuneration per w orker (R '000) Formal employ ment % of total employ ment Youth employ ment % of total employ ment
Skill composition of employment trend (formal and informal) (QLFS based) Provincial distribution of employment (formal and informal) (QLFS based)
Quarterly Q2 2020 (cumulative total)
Number (1 000) Number (1 000)
* QES - Q1 2012 to Q1 2015 data compiled from the 2013 Business Sample Frame, Q2 2015 to Q1 2016 compiled from the 2015 Business Sample Frame, Q2 2016 onw ards compiled from
the 2017 Business Sample Frame
** QLFS - Q1 2012 to Q4 2014 data compiled from the 2007 Master Sample, Q1 2015 onw ards compiled from the 2013 Master Sample
400
450
500
550
600
650
60
70
80
90
100
110
Q1 Q22016
Q3 Q4| Q1 Q22017
Q3 Q4| Q1 Q22018
Q3 Q4| Q1 Q22019
Q3 Q4| Q1 Q22020
Volume of production Value of sales
,15
,17
,19
,21
,23
1 100
1 125
1 150
1 175
1 200
1 225
1 250
Q1 Q22016
Q3 Q4| Q1 Q22017
Q3 Q4| Q1 Q22018
Q3 Q4| Q1 Q22019
Q3 Q4| Q1 Q22020
Employment Remuneration per worker
34
36
38
40
42
85
86
87
88
89
90
Q1 Q22016
Q3 Q4| Q1 Q22017
Q3 Q4| Q1 Q22018
Q3 Q4| Q1 Q22019
Q3 Q4| Q1 Q22020
Formal employemnt Youth employment
0
300
600
900
1 200
1 500
1 800
2 100
Q1 Q22016
Q3 Q4| Q1 Q22017
Q3 Q4| Q1 Q22018
Q3 Q4| Q1 Q22019
Q3 Q4| Q1 Q22020
Tertiary education Secondary schooling completed Less than secondary schooling
0
100
200
300
400
500
600
WesternCape
EasternCape
NorthernCape
FreeState
KwaZulu-Natal
NorthWest
Gauteng Mpuma-langa
Limpopo
Non-youth Youth
55
60
65
70
75
80
85
Q1 Q22016
Q3 Q4| Q1 Q22017
Q3 Q4| Q1 Q22018
Q3 Q4| Q1 Q22019
Q3 Q4| Q1 Q22020
Capacity utilisation

November 2020 IDC – Research and Information – Sectoral Trends 23
Total manufacturing (cont.)Production weight: 100
Trade trends (value terms)
Total per quarter
ZAR billion per quarter (current v alues)
Trade trends (% of total exports/imports)
Quarterly
% share of SA's ov erall merchandise ex ports/imports
Major traded export products Major traded import products
First half of 2020 (cumulative total) First half of 2020 (cumulative total)
HS2 code: sector description ZAR m HS2 code: sector description ZAR m
To
p e
xpo
rts
H87: Vehicles, parts and accessories 51 143.07
To
p i
mp
ort
s
H84: M achinery and equipment, mechanical appliances 60 571.84
H72: Iron and steel 30 791.42 H85: Electrical machinery and electronic equipment 46 799.34
H84: M achinery and equipment, mechanical appliances 29 895.01 H98: Original equipment components for the motor vehicle industry 41 215.79
H27: Coal, petro leum and petro leum products 20 122.27 H87: Vehicles, parts and accessories 33 641.30
H39: P lastics and articles thereof 9 207.50 H90: Optical, photographic, measuring and medical equipment 14 920.20
Expo rts T o tal ( including o thers) 298 416.31 Impo rts T o tal ( including o thers) 443 759.99
H76: A luminium and articles thereof 11 984.05 H27: Coal, petro leum and petro leum products 30 422.78
H85: Electrical machinery and electronic equipment 9 501.02 H30: Pharmaceutical products 19 313.89
H11: M illing products, malt, starches, inulin, wheat gluten 886.89 H38: M iscellaneous chemical products 2 223.35
H75: Nickel and articles thereof 867.41 H15: Animal,vegetable fats and o ils, cleavage products, etc 1 278.23To
p g
ain
ers
H47: Pulp of wood, fibrous cellulosic material, waste, etc 4 002.97
To
p g
ain
ers
H63: Other made textile articles, sets, worn clo thing, etc 6 799.60
H38: M iscellaneous chemical products 1 423.49 H30: Pharmaceutical products 2 350.44
H71: Natural or cultured pearls, precious stones and metals 851.34 H10: Cereals 747.42
To
p l
ose
rs
H87: Vehicles, parts and accessories -24 157.86
To
p l
ose
rs
H98: Original equipment components for the motor vehicle industry -14 573.75
H27: Coal, petro leum and petro leum products -3 524.88 H85: Electrical machinery and electronic equipment -9 060.83
H73: Articles of iron or steel -2 589.20 H27: Coal, petro leum and petro leum products -5 807.45
H72: Iron and steel -11 923.13 H87: Vehicles, parts and accessories -13 978.96
H84: M achinery and equipment, mechanical appliances -6 919.53 H84: M achinery and equipment, mechanical appliances -12 027.29
Top trading partners (share of exports/imports) Top trading partners (value of export/imports)
First half of 2020 (cumulative total) First half of 2020 (cumulative total)
100
150
200
250
300
Q1 Q22016
Q3 Q4| Q1 Q22017
Q3 Q4| Q1 Q22018
Q3 Q4| Q1 Q22019
Q3 Q4| Q1 Q22020
Exports Imports
0% 5% 10% 15% 20% 25%
China
Germany
USA
India
Japan
Thailand
UK
Germany
USA
Botswana
Namibia
China
Belgium
Mozambique
Top export destinations' share
Top import sources' share
45%
55%
65%
75%
85%
95%
Q1 Q22016
Q3 Q4| Q1 Q22017
Q3 Q4| Q1 Q22018
Q3 Q4| Q1 Q22019
Q3 Q4| Q1 Q22020
Exports Imports
0 30 60 90 120
China
Germany
USA
India
Japan
Thailand
UK
Germany
USA
Botswana
Namibia
China
Belgium
Mozambique
R billion
Top export destinations' value
Top import sources' value

November 2020 IDC – Research and Information – Sectoral Trends 24
Skill composition of employment trend (formal and informal) (QLFS based) Provincial distribution of employment (formal and informal) (QLFS based)
Quarterly Q2 2020 (cumulative total)
Number (1 000) Number (1 000)
* QES - Q1 2012 to Q1 2015 data compiled from the 2013 Business Sample Frame, Q2 2015 to Q1 2016 compiled from the 2015 Business Sample Frame, Q2 2016 onw ards compiled from
the 2017 Business Sample Frame
** QLFS - Q1 2012 to Q4 2014 data compiled from the 2007 Master Sample, Q1 2015 onw ards compiled from the 2013 Master Sample
Formal employment and remuneration trend (QES based)* Employment composition trend (formal and informal) (QLFS based)**
Quarterly Quarterly
Number (1 000) Gross monthly remuneration per w orker (R '000) Formal employ ment % of total employ ment Youth employ ment % of total employ ment
Production and sales trend Utilisation of production capacity
Quarterly Quarterly
Production index (seasonally adjusted) Value of sales (R billion) Capacity utilisation (%)
FoodProduction weight: 20.4
Trend analysis: first half of 2020 y-o-y (except: capacity utilisation, employment and remuneration - Q2 2020 y-o-y)
-1.7% 1.8% 11.3% 7.3%
Production (seas. adj.) Capacity utilisation Employment* Gross monthly remuneration per worker Exports (ZAR) Imports (ZAR)
(percentage points)-1.3% -2.9
24
26
28
30
32
95
100
105
110
115
Q1 Q22016
Q3 Q4| Q1 Q22017
Q3 Q4| Q1 Q22018
Q3 Q4| Q1 Q22019
Q3 Q4| Q1 Q22020
Volume of production Value of sales
10
12
14
16
18
175
185
195
205
215
225
Q1 Q22016
Q3 Q4| Q1 Q22017
Q3 Q4| Q1 Q22018
Q3 Q4| Q1 Q22019
Q3 Q4| Q1 Q22020
Employment Remuneration per worker
42
46
50
54
58
85
87
89
91
93
95
Q1 Q22016
Q3 Q4| Q1 Q22017
Q3 Q4| Q1 Q22018
Q3 Q4| Q1 Q22019
Q3 Q4| Q1 Q22020
Formal employemnt Youth employment
0
100
200
300
400
Q1 Q22016
Q3 Q4| Q1 Q22017
Q3 Q4| Q1 Q22018
Q3 Q4| Q1 Q22019
Q3 Q4| Q1 Q22020
Tertiary education Secondary schooling completed Less than secondary schooling
0
20
40
60
80
100
120
WesternCape
EasternCape
NorthernCape
FreeState
KwaZulu-Natal
NorthWest
Gauteng Mpuma-langa
Limpopo
Non-youth Youth
72
75
78
81
84
Q1 Q22016
Q3 Q4| Q1 Q22017
Q3 Q4| Q1 Q22018
Q3 Q4| Q1 Q22019
Q3 Q4| Q1 Q22020
Capacity utilisation

November 2020 IDC – Research and Information – Sectoral Trends 25
Top trading partners (share of exports/imports) Top trading partners (value of export/imports)
First half of 2020 (cumulative total) First half of 2020 (cumulative total)
To
p l
ose
rs
H0307: M olluscs - 324.73
To
p l
ose
rs
H0207: M eat, edible offal o f domestic poultry - 525.35
H0304: Fish fillets, fish meat, mince except liver, roe - 149.12 H2009: Fruit and vegetable juices, not fermented/ spirited - 203.36
H1102: Cereal flours other than of wheat or meslin - 131.12 H2306: Oil-cake other than soya-bean or groundnut - 189.48
H0306: Crustaceans - 183.37 H0303: Fish, frozen, whole - 326.86
H2008: Fruit, edible plant parts nes, prepared/preserved - 155.30 H0202: M eat o f bovine animals, frozen - 210.24
H0303: Fish, frozen, whole 388.65 H1511: Palm o il and its fractions, not chemically modified 451.08
H2301: Flour etc of meat, fish or o ffal for animal feed 277.51 H5101: Wool, not carded or combed 317.45To
p g
ain
ers
H1103: Cereal grouts, meal and pellets 974.57
To
p g
ain
ers
H1006: Rice 747.42
H0202: M eat o f bovine animals, frozen 401.75 H1507: Soya-bean o il, fractions, not chemically modified 645.48
H1701: Solid cane/ beet sugar & chemically pure sucrose 236.55 H0402: M ilk and cream, concentrated or sweetened 292.93
Expo rts T o tal ( including o thers) 28 452.85 Impo rts T o tal ( including o thers) 31 105.32
H2008: Fruit, edible plant parts nes, prepared/preserved 1 424.83 H2106: Food preparations, nes 1 470.54
H0303: Fish, frozen, whole 1 267.96 H1512: Safflower, sunflower & cotton-seed o il, fractions 1 319.33
2 432.22
H2106: Food preparations, nes 1 518.71 H1701: Solid cane/ beet sugar & chemically pure sucrose 2 225.69
H2309: Animal feed preparations 1 225.65 H2309: Animal feed preparations 1 181.71
Major traded export products Major traded import products
First half of 2020 (cumulative total) First half of 2020 (cumulative total)
HS4 code: sector description ZAR m HS4 code: sector description ZAR m
To
p e
xpo
rts
H1701: Solid cane/ beet sugar & chemically pure sucrose 2 968.85
To
p i
mp
ort
s
H1006: Rice 3 316.73
H2009: Fruit and vegetable juices, not fermented/ spirited 1 733.50 H0207: M eat, edible offal o f domestic poultry 2 608.12
H1103: Cereal grouts, meal and pellets 1 555.56 H1511: Palm o il and its fractions, not chemically modified
Trade trends (value terms) Trade trends (% of total exports/imports)
Total per quarter Quarterly
ZAR billion per quarter (current v alues) % share of SA's ov erall merchandise ex ports/imports
Food (cont.)Production weight: 20.4
8
10
12
14
16
18
Q1 Q22016
Q3 Q4| Q1 Q22017
Q3 Q4| Q1 Q22018
Q3 Q4| Q1 Q22019
Q3 Q4| Q1 Q22020
Exports Imports
0% 3% 6% 9% 12%
Thailand
Swaziland
Argentina
Indonesia
Brazil
China
USA
Botswana
Namibia
Mozambique
Lesotho
Zimbabwe
China
Swaziland
Top export destinations' share
Top import sources' share
3%
4%
5%
6%
7%
Q1 Q22016
Q3 Q4| Q1 Q22017
Q3 Q4| Q1 Q22018
Q3 Q4| Q1 Q22019
Q3 Q4| Q1 Q22020
Exports Imports
0 1 2 3 4
Thailand
Swaziland
Argentina
Indonesia
Brazil
China
USA
Botswana
Namibia
Mozambique
Lesotho
Zimbabwe
China
Swaziland
R billion
Top export destinations' value
Top import sources' value

November 2020 IDC – Research and Information – Sectoral Trends 26
Skill composition of employment trend (formal and informal) (QLFS based) Provincial distribution of employment (formal and informal) (QLFS based)
Quarterly Q2 2020 (cumulative total)
Number (1 000) Number (1 000)
* QES - Q1 2012 to Q1 2015 data compiled from the 2013 Business Sample Frame, Q2 2015 to Q1 2016 compiled from the 2015 Business Sample Frame, Q2 2016 onw ards compiled from
the 2017 Business Sample Frame
** QLFS - Q1 2012 to Q4 2014 data compiled from the 2007 Master Sample, Q1 2015 onw ards compiled from the 2013 Master Sample
Formal employment and remuneration trend (QES based)* Employment composition trend (formal and informal) (QLFS based)**
Quarterly Quarterly
Number (1 000) Gross monthly remuneration per w orker (R '000) Formal employ ment % of total employ ment Youth employ ment % of total employ ment
Production and sales trend Utilisation of production capacity
Quarterly Quarterly
Production index (seasonally adjusted) Value of sales (R billion) Capacity utilisation (%)
BeveragesProduction weight: 6.3
Trend analysis: first half of 2020 y-o-y (except: capacity utilisation, employment and remuneration - Q2 2020 y-o-y)
-3.2% -1.8% -22.8% -14.3%
Production (seas. adj.) Capacity utilisation Employment* Gross monthly remuneration per worker Exports (ZAR) Imports (ZAR)
(percentage points)-28.3% -45.6
20
24
28
32
36
40
44
50
55
60
65
70
75
80
85
90
95
100
105
110
115
120
Q1 Q22016
Q3 Q4| Q1 Q22017
Q3 Q4| Q1 Q22018
Q3 Q4| Q1 Q22019
Q3 Q4| Q1 Q22020
Volume of production Value of sales
20
23
26
29
32
38
40
42
44
46
Q1 Q22016
Q3 Q4| Q1 Q22017
Q3 Q4| Q1 Q22018
Q3 Q4| Q1 Q22019
Q3 Q4| Q1 Q22020
Employment Remuneration per worker
20
30
40
50
65
75
85
95
Q1 Q22016
Q3 Q4| Q1 Q22017
Q3 Q4| Q1 Q22018
Q3 Q4| Q1 Q22019
Q3 Q4| Q1 Q22020
Formal employemnt Youth employment
0
20
40
60
80
100
120
Q1 Q22016
Q3 Q4| Q1 Q22017
Q3 Q4| Q1 Q22018
Q3 Q4| Q1 Q22019
Q3 Q4| Q1 Q22020
Tertiary education Secondary schooling completed Less than secondary schooling
0
5
10
15
20
25
30
35
40
WesternCape
EasternCape
NorthernCape
FreeState
KwaZulu-Natal
NorthWest
Gauteng Mpuma-langa
Limpopo
Non-youth Youth
30
40
50
60
70
80
90
100
Q1 Q22016
Q3 Q4| Q1 Q22017
Q3 Q4| Q1 Q22018
Q3 Q4| Q1 Q22019
Q3 Q4| Q1 Q22020
Capacity utilisation

November 2020 IDC – Research and Information – Sectoral Trends 27
Top trading partners (share of exports/imports) Top trading partners (value of export/imports)
First half of 2020 (cumulative total) First half of 2020 (cumulative total)
To
p l
ose
rs
H2204: Grape wines (including fortified), grape must - 643.58
To
p l
ose
rs
H2208: Liqueur, spirits & undenatured ethyl alcohol <80% - 655.02
H2208: Liqueur, spirits & undenatured ethyl alcohol <80% - 307.30 H2203: Beer made from malt - 6.42
H2203: Beer made from malt - 207.55 H2201: Unsweetened beverage waters, ice and snow - 5.49
H2207: Ethyl alcohol, undenatured and > 80%, /denatured - 428.28 H2204: Grape wines (including fortified), grape must - 131.24
H2202: Waters, non-alcoholic flavoured beverages - 307.68 H1107: M alt - 37.63
H2205: Vermouth and other flavoured grape wine 0.31
To
p g
ain
ers
H1107: M alt 3.88
To
p g
ain
ers
H2202: Waters, non-alcoholic flavoured beverages 101.03
H2207: Ethyl alcohol, undenatured and > 80%, /denatured 87.47
Expo rts T o tal ( including o thers) 7 042.25 Impo rts T o tal ( including o thers) 3 877.94
H2203: Beer made from malt 389.79 H2204: Grape wines (including fortified), grape must 179.25
H2206: Fermented beverages (eg cider, perry, mead) 313.05 H2207: Ethyl alcohol, undenatured and > 80%, /denatured 119.40
722.76
H2208: Liqueur, spirits & undenatured ethyl alcohol <80% 636.74 H1107: M alt 254.63
H1107: M alt 138.90 H2206: Fermented beverages (eg cider, perry, mead) 22.03
Major traded export products Major traded import products
First half of 2020 (cumulative total) First half of 2020 (cumulative total)
HS4 code: sector description ZAR m HS4 code: sector description ZAR m
To
p e
xpo
rts
H2204: Grape wines (including fortified), grape must 3 841.39
To
p i
mp
ort
s
H2203: Beer made from malt 1 355.89
H2207: Ethyl alcohol, undenatured and > 80%, /denatured 845.34 H2208: Liqueur, spirits & undenatured ethyl alcohol <80% 1 205.47
H2202: Waters, non-alcoholic flavoured beverages 828.58 H2202: Waters, non-alcoholic flavoured beverages
Trade trends (value terms) Trade trends (% of total exports/imports)
Total per quarter Quarterly
ZAR billion per quarter (current v alues) % share of SA's ov erall merchandise ex ports/imports
Beverages (cont.)Production weight: 6.3
0
2
4
6
8
Q1 Q22016
Q3 Q4| Q1 Q22017
Q3 Q4| Q1 Q22018
Q3 Q4| Q1 Q22019
Q3 Q4| Q1 Q22020
Exports Imports
0% 10% 20% 30%
Mexico
UK
France
Netherlands
Namibia
Austria
Belgium
UK
Germany
Namibia
Botswana
USA
UAE
Mozambique
Top export destinations' share
Top import sources' share
0.0%
0.5%
1.0%
1.5%
2.0%
Q1 Q22016
Q3 Q4| Q1 Q22017
Q3 Q4| Q1 Q22018
Q3 Q4| Q1 Q22019
Q3 Q4| Q1 Q22020
Exports Imports
0.0 0.2 0.4 0.6 0.8 1.0
Mexico
UK
France
Netherlands
Namibia
Austria
Belgium
UK
Germany
Namibia
Botswana
USA
UAE
Mozambique
R billion
Top export destinations' value
Top import sources' value
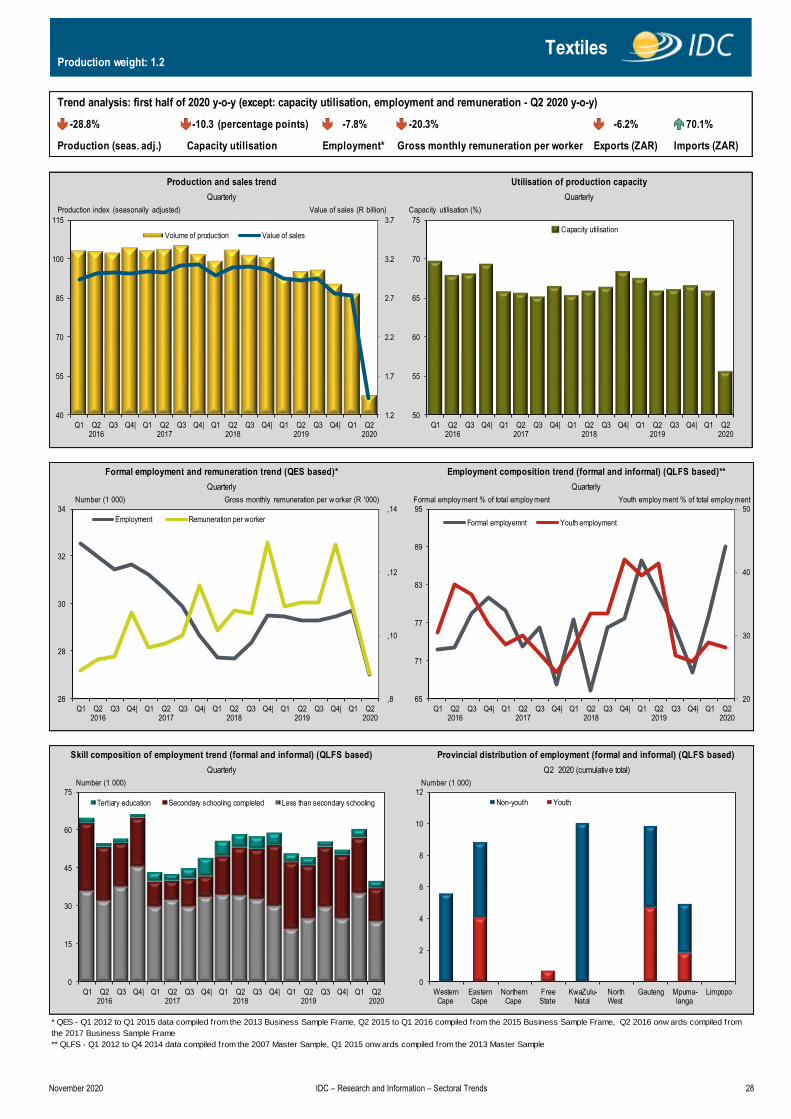
November 2020 IDC – Research and Information – Sectoral Trends 28
Skill composition of employment trend (formal and informal) (QLFS based) Provincial distribution of employment (formal and informal) (QLFS based)
Quarterly Q2 2020 (cumulative total)
Number (1 000) Number (1 000)
* QES - Q1 2012 to Q1 2015 data compiled from the 2013 Business Sample Frame, Q2 2015 to Q1 2016 compiled from the 2015 Business Sample Frame, Q2 2016 onw ards compiled from
the 2017 Business Sample Frame
** QLFS - Q1 2012 to Q4 2014 data compiled from the 2007 Master Sample, Q1 2015 onw ards compiled from the 2013 Master Sample
Formal employment and remuneration trend (QES based)* Employment composition trend (formal and informal) (QLFS based)**
Quarterly Quarterly
Number (1 000) Gross monthly remuneration per w orker (R '000) Formal employ ment % of total employ ment Youth employ ment % of total employ ment
Production and sales trend Utilisation of production capacity
Quarterly Quarterly
Production index (seasonally adjusted) Value of sales (R billion) Capacity utilisation (%)
TextilesProduction weight: 1.2
Trend analysis: first half of 2020 y-o-y (except: capacity utilisation, employment and remuneration - Q2 2020 y-o-y)
-7.8% -20.3% -6.2% 70.1%
Production (seas. adj.) Capacity utilisation Employment* Gross monthly remuneration per worker Exports (ZAR) Imports (ZAR)
(percentage points)-28.8% -10.3
1.2
1.7
2.2
2.7
3.2
3.7
40
55
70
85
100
115
Q1 Q22016
Q3 Q4| Q1 Q22017
Q3 Q4| Q1 Q22018
Q3 Q4| Q1 Q22019
Q3 Q4| Q1 Q22020
Volume of production Value of sales
,8
,10
,12
,14
26
28
30
32
34
Q1 Q22016
Q3 Q4| Q1 Q22017
Q3 Q4| Q1 Q22018
Q3 Q4| Q1 Q22019
Q3 Q4| Q1 Q22020
Employment Remuneration per worker
20
30
40
50
65
71
77
83
89
95
Q1 Q22016
Q3 Q4| Q1 Q22017
Q3 Q4| Q1 Q22018
Q3 Q4| Q1 Q22019
Q3 Q4| Q1 Q22020
Formal employemnt Youth employment
0
15
30
45
60
75
Q1 Q22016
Q3 Q4| Q1 Q22017
Q3 Q4| Q1 Q22018
Q3 Q4| Q1 Q22019
Q3 Q4| Q1 Q22020
Tertiary education Secondary schooling completed Less than secondary schooling
0
2
4
6
8
10
12
WesternCape
EasternCape
NorthernCape
FreeState
KwaZulu-Natal
NorthWest
Gauteng Mpuma-langa
Limpopo
Non-youth Youth
50
55
60
65
70
75
Q1 Q22016
Q3 Q4| Q1 Q22017
Q3 Q4| Q1 Q22018
Q3 Q4| Q1 Q22019
Q3 Q4| Q1 Q22020
Capacity utilisation

November 2020 IDC – Research and Information – Sectoral Trends 29
Top trading partners (share of exports/imports) Top trading partners (value of export/imports)
First half of 2020 (cumulative total) First half of 2020 (cumulative total)
To
p l
ose
rs
H9619: Sanitary towels and tampons, napkins and napkin liners for babies - 164.99
To
p l
ose
rs
H9619: Sanitary towels and tampons, napkins and napkin liners for babies - 291.54
H5209: Woven cotton nes, >85% cotton, >200g/m2 - 54.22 H6304: Furnishing articles nes, except mattresses, etc - 134.42
H9404: M attress supports, mattresses, bedding - 46.98 H5208: Woven cotton fabric, >85% cotton, < 200g/m2 - 127.11
H6306: Textile tarpaulin, sail, awning, tent, camping goods - 103.94 H5407: Woven synth filament yarn, monofilament >67dtex - 158.30
H5407: Woven synth filament yarn, monofilament >67dtex - 69.24 H6302: Bed, table, to ilet and kitchen linens - 147.33
H5601: Textile wadding and articles, textile flock, dust 14.01 H5809: Woven fabric incorporating metal threads, nes 22.36
H5205: Coton yarn not sewing thread>85% coton,unretail 4.13 H5910: Transmission or conveyor belts or belting of textile 8.57To
p g
ain
ers
H6307: M ade up articles nes, including dress patterns 558.58
To
p g
ain
ers
H6307: M ade up articles nes, including dress patterns 7 169.71
H5603: Nonwoven textiles, except felt 19.65 H5203: Cotton, carded, combed 43.70
H5212: Woven cotton fabric 2.12 H5604: Rubber thread & cord or plastic coated fabrics 7.97
Expo rts T o tal ( including o thers) 3 296.57 Impo rts T o tal ( including o thers) 13 195.46
H6306: Textile tarpaulin, sail, awning, tent, camping goods 204.74 H5208: Woven cotton fabric, >85% cotton, < 200g/m2 287.36
H5603: Nonwoven textiles, except felt 187.91 H5911: Special textile products for technical purposes 280.83
535.45
H9619: Sanitary towels and tampons, napkins and napkin liners for babies 217.33 H6302: Bed, table, to ilet and kitchen linens 329.43
H5407: Woven synth filament yarn, monofilament >67dtex 138.45 H5903: Fabric impregnated, coated/ covered with plastic 274.65
Major traded export products Major traded import products
First half of 2020 (cumulative total) First half of 2020 (cumulative total)
HS4 code: sector description ZAR m HS4 code: sector description ZAR m
To
p e
xpo
rts
H6307: M ade up articles nes, including dress patterns 700.15
To
p i
mp
ort
s
H6307: M ade up articles nes, including dress patterns 7 510.53
H5105: Wool and animal hair, carded or combed 334.03 H5407: Woven synth filament yarn, monofilament >67dtex 759.34
H6305: Sacks& bags of a kind used for packing of goods 226.68 H5603: Nonwoven textiles, except felt
Trade trends (value terms) Trade trends (% of total exports/imports)
Total per quarter Quarterly
ZAR billion per quarter (current v alues) % share of SA's ov erall merchandise ex ports/imports
Textiles (cont.)Production weight: 1.2
0
2
4
6
8
10
12
Q1 Q22016
Q3 Q4| Q1 Q22017
Q3 Q4| Q1 Q22018
Q3 Q4| Q1 Q22019
Q3 Q4| Q1 Q22020
Exports Imports
0% 15% 30% 45% 60% 75%
China
Pakistan
India
Germany
Czech Republic
Hong Kong
Turkey
Namibia
Botswana
China
Lesotho
Swaziland
Italy
Mozambique
Top export destinations' share
Top import sources' share
0%
1%
2%
3%
Q1 Q22016
Q3 Q4| Q1 Q22017
Q3 Q4| Q1 Q22018
Q3 Q4| Q1 Q22019
Q3 Q4| Q1 Q22020
Exports Imports
0 2 4 6 8 10
China
Pakistan
India
Germany
Czech Republic
Hong Kong
Turkey
Namibia
Botswana
China
Lesotho
Swaziland
Italy
Mozambique
R billion
Top export destinations' value
Top import sources' value

November 2020 IDC – Research and Information – Sectoral Trends 30
Skill composition of employment trend (formal and informal) (QLFS based) Provincial distribution of employment (formal and informal) (QLFS based)
Quarterly Q2 2020 (cumulative total)
Number (1 000) Number (1 000)
* QES - Q1 2012 to Q1 2015 data compiled from the 2013 Business Sample Frame, Q2 2015 to Q1 2016 compiled from the 2015 Business Sample Frame, Q2 2016 onw ards compiled from
the 2017 Business Sample Frame
** QLFS - Q1 2012 to Q4 2014 data compiled from the 2007 Master Sample, Q1 2015 onw ards compiled from the 2013 Master Sample
Formal employment and remuneration trend (QES based)* Employment composition trend (formal and informal) (QLFS based)**
Quarterly Quarterly
Number (1 000) Gross monthly remuneration per w orker (R '000) Formal employ ment % of total employ ment Youth employ ment % of total employ ment
Production and sales trend Utilisation of production capacity
Quarterly Quarterly
Production index (seasonally adjusted) Value of sales (R billion) Capacity utilisation (%)
Wearing apparelProduction weight: 1.1
Trend analysis: first half of 2020 y-o-y (except: capacity utilisation, employment and remuneration - Q2 2020 y-o-y)
-14.0% -13.4% -23.4% -20.5%
Production (seas. adj.) Capacity utilisation Employment* Gross monthly remuneration per worker Exports (ZAR) Imports (ZAR)
(percentage points)-26.0% -42.4
2.5
3.0
3.5
4.0
4.5
5.0
40
50
60
70
80
90
100
110
Q1 Q22016
Q3 Q4| Q1 Q22017
Q3 Q4| Q1 Q22018
Q3 Q4| Q1 Q22019
Q3 Q4| Q1 Q22020
Volume of production Value of sales
,6
,7
,8
,9
,10
37
40
43
46
49
52
Q1 Q22016
Q3 Q4| Q1 Q22017
Q3 Q4| Q1 Q22018
Q3 Q4| Q1 Q22019
Q3 Q4| Q1 Q22020
Employment Remuneration per worker
20
25
30
35
40
45
56
60
64
68
72
76
Q1 Q22016
Q3 Q4| Q1 Q22017
Q3 Q4| Q1 Q22018
Q3 Q4| Q1 Q22019
Q3 Q4| Q1 Q22020
Formal employemnt Youth employment
0
30
60
90
120
150
180
210
Q1 Q22016
Q3 Q4| Q1 Q22017
Q3 Q4| Q1 Q22018
Q3 Q4| Q1 Q22019
Q3 Q4| Q1 Q22020
Tertiary education Secondary schooling completed Less than secondary schooling
0
15
30
45
60
WesternCape
EasternCape
NorthernCape
FreeState
KwaZulu-Natal
NorthWest
Gauteng Mpuma-langa
Limpopo
Non-youth Youth
30
40
50
60
70
80
90
Q1 Q22016
Q3 Q4| Q1 Q22017
Q3 Q4| Q1 Q22018
Q3 Q4| Q1 Q22019
Q3 Q4| Q1 Q22020
Capacity utilisation

November 2020 IDC – Research and Information – Sectoral Trends 31
Top trading partners (share of exports/imports) Top trading partners (value of export/imports)
First half of 2020 (cumulative total) First half of 2020 (cumulative total)
To
p l
ose
rs
H6203: M ens or boys suits, jackets, trousers, etc not knit - 83.63
To
p l
ose
rs
H6203: M ens or boys suits, jackets, trousers, etc not knit - 498.68
H6103: M ens, boys suits,jackets,trousers, etc knit/crochet - 54.85 H6109: T-shirts, singlets and other vests, knit or crochet - 206.58
H6204: Woven female suits, jacket, dress, etc - 52.94 H6103: M ens, boys suits,jackets,trousers, etc knit/crochet - 174.08
H6109: T-shirts, singlets and other vests, knit or crochet - 65.74 H6204: Woven female suits, jacket, dress, etc - 442.82
H6104: Female suit, dress, skirt, etc, knit or crochet - 63.26 H6110: Jerseys, pullovers, cardigans, etc, knit or crochet - 213.15
H6002: Knit or crochet fabric 0.83
H6502: Hat-forms, strip material, unshaped, etc 0.75To
p g
ain
ers
H6210: Garments made up of felt or coated fabric 97.54
To
p g
ain
ers
H6210: Garments made up of felt or coated fabric 90.32
H6004: Knitted/crocheted fabrics of a width > 30 cm 1.58 H6501: Hat-forms, etc of felt, not shaped, no formed brim 1.07
H6003: Knitted or crocheted fabrics of a width < 30 cm 0.11
Expo rts T o tal ( including o thers) 2 274.56 Impo rts T o tal ( including o thers) 11 795.08
H6103: M ens, boys suits,jackets,trousers, etc knit/crochet 124.43 H6104: Female suit, dress, skirt, etc, knit or crochet 651.86
H6115: Panty hose, tights, hosiery nes, knit or crochet 122.62 H6201: Woven male overcoats, windjackets, etc 468.94
1 245.12
H6104: Female suit, dress, skirt, etc, knit or crochet 140.10 H6109: T-shirts, singlets and other vests, knit or crochet 1 005.07
H6110: Jerseys, pullovers, cardigans, etc, knit or crochet 115.34 H6108: Womens, girls underwear, nightwear, knit/crochet 453.88
Major traded export products Major traded import products
First half of 2020 (cumulative total) First half of 2020 (cumulative total)
HS4 code: sector description ZAR m HS4 code: sector description ZAR m
To
p e
xpo
rts
H6203: M ens or boys suits, jackets, trousers, etc not knit 303.24
To
p i
mp
ort
s
H6203: M ens or boys suits, jackets, trousers, etc not knit 1 533.05
H6204: Woven female suits, jacket, dress, etc 183.66 H6204: Woven female suits, jacket, dress, etc 1 286.94
H6109: T-shirts, singlets and other vests, knit or crochet 165.02 H6110: Jerseys, pullovers, cardigans, etc, knit or crochet
Trade trends (value terms) Trade trends (% of total exports/imports)
Total per quarter Quarterly
ZAR billion per quarter (current v alues) % share of SA's ov erall merchandise ex ports/imports
Wearing apparel (cont.)Production weight: 1.1
0
3
6
9
Q1 Q22016
Q3 Q4| Q1 Q22017
Q3 Q4| Q1 Q22018
Q3 Q4| Q1 Q22019
Q3 Q4| Q1 Q22020
Exports Imports
0% 15% 30% 45% 60%
China
Swaziland
Mauritius
Lesotho
Bangladesh
Madagascar
India
Namibia
Botswana
Lesotho
Swaziland
Zambia
Mozambique
USA
Top export destinations' share
Top import sources' share
0%
1%
2%
3%
4%
Q1 Q22016
Q3 Q4| Q1 Q22017
Q3 Q4| Q1 Q22018
Q3 Q4| Q1 Q22019
Q3 Q4| Q1 Q22020
Exports Imports
0 2 4 6 8
China
Swaziland
Mauritius
Lesotho
Bangladesh
Madagascar
India
Namibia
Botswana
Lesotho
Swaziland
Zambia
Mozambique
USA
R billion
Top export destinations' value
Top import sources' value

November 2020 IDC – Research and Information – Sectoral Trends 32
Skill composition of employment trend (formal and informal) (QLFS based) Provincial distribution of employment (formal and informal) (QLFS based)
Quarterly Q2 2020 (cumulative total)
Number (1 000) Number (1 000)
* QES - Q1 2012 to Q1 2015 data compiled from the 2013 Business Sample Frame, Q2 2015 to Q1 2016 compiled from the 2015 Business Sample Frame, Q2 2016 onw ards compiled from
the 2017 Business Sample Frame
** QLFS - Q1 2012 to Q4 2014 data compiled from the 2007 Master Sample, Q1 2015 onw ards compiled from the 2013 Master Sample
Formal employment and remuneration trend (QES based)* Employment composition trend (formal and informal) (QLFS based)**
Quarterly Quarterly
Number (1 000) Gross monthly remuneration per w orker (R '000) Formal employ ment % of total employ ment Youth employ ment % of total employ ment
Production and sales trend Utilisation of production capacity
Quarterly Quarterly
Production index (seasonally adjusted) Value of sales (R billion) Capacity utilisation (%)
Leather & leather productsProduction weight: 0.5
Trend analysis: first half of 2020 y-o-y (except: capacity utilisation, employment and remuneration - Q2 2020 y-o-y)
-7.6% -33.5% -37.2% -27.1%
Production (seas. adj.) Capacity utilisation Employment* Gross monthly remuneration per worker Exports (ZAR) Imports (ZAR)
(percentage points)-32.3% -31
1.0
1.2
1.4
1.6
1.8
2.0
2.2
30
40
50
60
70
80
90
100
110
Q1 Q22016
Q3 Q4| Q1 Q22017
Q3 Q4| Q1 Q22018
Q3 Q4| Q1 Q22019
Q3 Q4| Q1 Q22020
Volume of production Value of sales
,6
,8
,10
,12
,14
4.5
5.0
5.5
6.0
Q1 Q22016
Q3 Q4| Q1 Q22017
Q3 Q4| Q1 Q22018
Q3 Q4| Q1 Q22019
Q3 Q4| Q1 Q22020
Employment Remuneration per worker
0
25
50
75
60
70
80
90
100
110
Q1 Q22016
Q3 Q4| Q1 Q22017
Q3 Q4| Q1 Q22018
Q3 Q4| Q1 Q22019
Q3 Q4| Q1 Q22020
Formal employemnt Youth employment
0
10
20
Q1 Q22016
Q3 Q4| Q1 Q22017
Q3 Q4| Q1 Q22018
Q3 Q4| Q1 Q22019
Q3 Q4| Q1 Q22020
Tertiary education Secondary schooling completed Less than secondary schooling
0
2
4
WesternCape
EasternCape
NorthernCape
FreeState
KwaZulu-Natal
NorthWest
Gauteng Mpuma-langa
Limpopo
Non-youth Youth
30
40
50
60
70
80
Q1 Q22016
Q3 Q4| Q1 Q22017
Q3 Q4| Q1 Q22018
Q3 Q4| Q1 Q22019
Q3 Q4| Q1 Q22020
Capacity utilisation

November 2020 IDC – Research and Information – Sectoral Trends 33
Top trading partners (share of exports/imports) Top trading partners (value of export/imports)
First half of 2020 (cumulative total) First half of 2020 (cumulative total)
To
p l
ose
rs
H4107: Leather o f o ther animals, no hair, not chamois, etc - 190.69
To
p l
ose
rs
H4202: Trunks, suit-cases, camera cases, handbags, etc - 327.21
H4113: Composition leather, in slabs, sheets or strips - 32.65 H4201: Saddlery and harness, o f any material - 11.87
H4205: Articles of leather and composition leather, nes - 29.39 H4115: Composition leather, in slabs, sheets or strips - 10.91
H4104: Bovine/equine leather, no hair, not chamois, patent - 153.29 H4104: Bovine/equine leather, no hair, not chamois, patent - 30.90
H4202: Trunks, suit-cases, camera cases, handbags, etc - 69.25 H4107: Leather o f o ther animals, no hair, not chamois, etc - 21.17
H4201: Saddlery and harness, o f any material 3.43
To
p g
ain
ers
H4102: Raw skins of sheep or lambs 7.87
To
p g
ain
ers
H4102: Raw skins of sheep or lambs 0.03
H9113: Watch straps, bands, bracelets, & parts thereof 5.32
Expo rts T o tal ( including o thers) 869.65 Impo rts T o tal ( including o thers) 1 145.39
H4115: Composition leather, in slabs, sheets or strips 36.90 H9113: Watch straps, bands, bracelets, & parts thereof 10.66
H4201: Saddlery and harness, o f any material 23.52 H4115: Composition leather, in slabs, sheets or strips 9.31
49.26
H4202: Trunks, suit-cases, camera cases, handbags, etc 152.71 H4201: Saddlery and harness, o f any material 22.47
H4106: Goat or kid skin leather, without hair 18.12 H4205: Articles of leather and composition leather, nes 8.56
Major traded export products Major traded import products
First half of 2020 (cumulative total) First half of 2020 (cumulative total)
HS4 code: sector description ZAR m HS4 code: sector description ZAR m
To
p e
xpo
rts
H4104: Bovine/equine leather, no hair, not chamois, patent 217.74
To
p i
mp
ort
s
H4202: Trunks, suit-cases, camera cases, handbags, etc 925.59
H4107: Leather o f o ther animals, no hair, not chamois, etc 209.67 H4107: Leather o f o ther animals, no hair, not chamois, etc 101.07
H4113: Composition leather, in slabs, sheets or strips 176.72 H4104: Bovine/equine leather, no hair, not chamois, patent
Trade trends (value terms) Trade trends (% of total exports/imports)
Total per quarter Quarterly
ZAR billion per quarter (current v alues) % share of SA's ov erall merchandise ex ports/imports
Leather & leather products (cont.)Production weight: 0.5
0.2
0.5
0.8
1.1
1.4
Q1 Q22016
Q3 Q4| Q1 Q22017
Q3 Q4| Q1 Q22018
Q3 Q4| Q1 Q22019
Q3 Q4| Q1 Q22020
Exports Imports
0% 15% 30% 45% 60% 75%
China
India
Italy
Pakistan
Vietnam
Indonesia
France
Germany
France
USA
Italy
Namibia
Lesotho
Poland
Top export destinations' share
Top import sources' share
0.1%
0.2%
0.3%
0.4%
Q1 Q22016
Q3 Q4| Q1 Q22017
Q3 Q4| Q1 Q22018
Q3 Q4| Q1 Q22019
Q3 Q4| Q1 Q22020
Exports Imports
0.0 0.3 0.6 0.9
China
India
Italy
Pakistan
Vietnam
Indonesia
France
Germany
France
USA
Italy
Namibia
Lesotho
Poland
R billion
Top export destinations' value
Top import sources' value

November 2020 IDC – Research and Information – Sectoral Trends 34
(percentage points)
Skill composition of employment trend (formal and informal) (QLFS based) Provincial distribution of employment (formal and informal) (QLFS based)
Quarterly Q2 2020 (cumulative total)
Number (1 000) Number (1 000)
* QES - Q1 2012 to Q1 2015 data compiled from the 2013 Business Sample Frame, Q2 2015 to Q1 2016 compiled from the 2015 Business Sample Frame, Q2 2016 onw ards compiled from
the 2017 Business Sample Frame
** QLFS - Q1 2012 to Q4 2014 data compiled from the 2007 Master Sample, Q1 2015 onw ards compiled from the 2013 Master Sample
Formal employment and remuneration trend (QES based)* Employment composition trend (formal and informal) (QLFS based)**
Quarterly Quarterly
Number (1 000) Gross monthly remuneration per w orker (R '000) Formal employ ment % of total employ ment Youth employ ment % of total employ ment
Production and sales trend Utilisation of production capacity
Quarterly Quarterly
Production index (seasonally adjusted) Value of sales (R billion) Capacity utilisation (%)
FootwearProduction weight: 0.4
Trend analysis: first half of 2020 y-o-y (except: capacity utilisation, employment and remuneration - Q2 2020 y-o-y)
-15.9% -28.5% -41.6% -45.8%
Production (seas. adj.) Capacity utilisation Employment* Gross monthly remuneration per worker Exports (ZAR) Imports (ZAR)
-33.9% -8.8
0.5
1.0
1.5
2.0
30
45
60
75
90
105
120
Q1 Q22016
Q3 Q4| Q1 Q22017
Q3 Q4| Q1 Q22018
Q3 Q4| Q1 Q22019
Q3 Q4| Q1 Q22020
Volume of production Value of sales
,5
,6
,7
,8
,9
,10
,11
6.0
6.5
7.0
7.5
8.0
8.5
9.0
9.5
10.0
10.5
Q1 Q22016
Q3 Q4| Q1 Q22017
Q3 Q4| Q1 Q22018
Q3 Q4| Q1 Q22019
Q3 Q4| Q1 Q22020
Employment Remuneration per worker
25
40
55
70
85
70
80
90
100
110
Q1 Q22016
Q3 Q4| Q1 Q22017
Q3 Q4| Q1 Q22018
Q3 Q4| Q1 Q22019
Q3 Q4| Q1 Q22020
Formal employemnt Youth employment
0
10
20
30
40
Q1 Q22016
Q3 Q4| Q1 Q22017
Q3 Q4| Q1 Q22018
Q3 Q4| Q1 Q22019
Q3 Q4| Q1 Q22020
Tertiary education Secondary schooling completed Less than secondary schooling
0
1
2
3
4
5
6
7
8
WesternCape
EasternCape
NorthernCape
FreeState
KwaZulu-Natal
NorthWest
Gauteng Mpuma-langa
Limpopo
Non-youth Youth
70
75
80
85
90
95
Q1 Q22016
Q3 Q4| Q1 Q22017
Q3 Q4| Q1 Q22018
Q3 Q4| Q1 Q22019
Q3 Q4| Q1 Q22020
Capacity utilisation

November 2020 IDC – Research and Information – Sectoral Trends 35
Top trading partners (share of exports/imports) Top trading partners (value of export/imports)
First half of 2020 (cumulative total) First half of 2020 (cumulative total)
To
p l
ose
rs
H6404: Footwear with uppers of textile materials - 208.12
To
p l
ose
rs
H6404: Footwear with uppers of textile materials -1 811.02
H6405: Footwear nes, so le not leather, rubber or plastic - 38.92 H6406: Parts o f footwear, in-so les, heel cushion, etc - 7.66
H6401: Waterproof footwear, rubber, plastic - 3.89 H6401: Waterproof footwear, rubber, plastic - 4.88
H6403: Footwear with uppers of leather - 94.37 H6402: Footwear, with outer so le, upper rubber or plastic - 649.61
H6402: Footwear, with outer so le, upper rubber or plastic - 57.82 H6403: Footwear with uppers of leather - 228.99
To
p g
ain
ers
To
p g
ain
ers
H6405: Footwear nes, so le not leather, rubber or plastic 2.95
Expo rts T o tal ( including o thers) 568.41 Impo rts T o tal ( including o thers) 3 194.35
H6404: Footwear with uppers of textile materials 54.87 H6405: Footwear nes, so le not leather, rubber or plastic 78.31
H6406: Parts o f footwear, in-so les, heel cushion, etc 13.26 H6401: Waterproof footwear, rubber, plastic 22.71
573.84
H6401: Waterproof footwear, rubber, plastic 57.52 H6406: Parts o f footwear, in-so les, heel cushion, etc 83.04
Major traded export products Major traded import products
First half of 2020 (cumulative total) First half of 2020 (cumulative total)
HS4 code: sector description ZAR m HS4 code: sector description ZAR m
To
p e
xpo
rts
H6403: Footwear with uppers of leather 209.79
To
p i
mp
ort
s
H6402: Footwear, with outer so le, upper rubber or plastic 1 278.91
H6402: Footwear, with outer so le, upper rubber or plastic 163.57 H6403: Footwear with uppers of leather 1 157.53
H6405: Footwear nes, so le not leather, rubber or plastic 69.40 H6404: Footwear with uppers of textile materials
Trade trends (value terms) Trade trends (% of total exports/imports)
Total per quarter Quarterly
ZAR billion per quarter (current v alues) % share of SA's ov erall merchandise ex ports/imports
Footwear (cont.)Production weight: 0.4
0
1
2
3
4
5
Q1 Q22016
Q3 Q4| Q1 Q22017
Q3 Q4| Q1 Q22018
Q3 Q4| Q1 Q22019
Q3 Q4| Q1 Q22020
Exports Imports
0% 15% 30% 45% 60%
China
Vietnam
Indonesia
Italy
India
Cambodia
Lesotho
Botswana
Namibia
Lesotho
Swaziland
Zambia
Mozambique
Zimbabwe
Top export destinations' share
Top import sources' share
0.0%
0.5%
1.0%
1.5%
Q1 Q22016
Q3 Q4| Q1 Q22017
Q3 Q4| Q1 Q22018
Q3 Q4| Q1 Q22019
Q3 Q4| Q1 Q22020
Exports Imports
0.0 0.5 1.0 1.5 2.0
China
Vietnam
Indonesia
Italy
India
Cambodia
Lesotho
Botswana
Namibia
Lesotho
Swaziland
Zambia
Mozambique
Zimbabwe
R billion
Top export destinations' value
Top import sources' value

November 2020 IDC – Research and Information – Sectoral Trends 36
(percentage points)
Skill composition of employment trend (formal and informal) (QLFS based) Provincial distribution of employment (formal and informal) (QLFS based)
Quarterly Q2 2020 (cumulative total)
Number (1 000) Number (1 000)
* QES - Q1 2012 to Q1 2015 data compiled from the 2013 Business Sample Frame, Q2 2015 to Q1 2016 compiled from the 2015 Business Sample Frame, Q2 2016 onw ards compiled from
the 2017 Business Sample Frame
** QLFS - Q1 2012 to Q4 2014 data compiled from the 2007 Master Sample, Q1 2015 onw ards compiled from the 2013 Master Sample
Formal employment and remuneration trend (QES based)* Employment composition trend (formal and informal) (QLFS based)**
Quarterly Quarterly
Number (1 000) Gross monthly remuneration per w orker (R '000) Formal employ ment % of total employ ment Youth employ ment % of total employ ment
Production and sales trend Utilisation of production capacity
Quarterly Quarterly
Production index (seasonally adjusted) Value of sales (R billion) Capacity utilisation (%)
Wood & wood productsProduction weight: 4.3
Trend analysis: first half of 2020 y-o-y (except: capacity utilisation, employment and remuneration - Q2 2020 y-o-y)
-13.2% -28.0% -23.8% -24.0%
Production (seas. adj.) Capacity utilisation Employment* Gross monthly remuneration per worker Exports (ZAR) Imports (ZAR)
-26.9% -19.2
2.5
3.0
3.5
4.0
4.5
5.0
50
60
70
80
90
100
110
120
Q1 Q22016
Q3 Q4| Q1 Q22017
Q3 Q4| Q1 Q22018
Q3 Q4| Q1 Q22019
Q3 Q4| Q1 Q22020
Volume of production Value of sales
,6
,7
,8
,9
,10
,11
,12
38
40
42
44
46
48
Q1 Q22016
Q3 Q4| Q1 Q22017
Q3 Q4| Q1 Q22018
Q3 Q4| Q1 Q22019
Q3 Q4| Q1 Q22020
Employment Remuneration per worker
30
40
50
60
65
75
85
95
Q1 Q22016
Q3 Q4| Q1 Q22017
Q3 Q4| Q1 Q22018
Q3 Q4| Q1 Q22019
Q3 Q4| Q1 Q22020
Formal employemnt Youth employment
0
30
60
90
120
Q1 Q22016
Q3 Q4| Q1 Q22017
Q3 Q4| Q1 Q22018
Q3 Q4| Q1 Q22019
Q3 Q4| Q1 Q22020
Tertiary education Secondary schooling completed Less than secondary schooling
0
4
8
12
WesternCape
EasternCape
NorthernCape
FreeState
KwaZulu-Natal
NorthWest
Gauteng Mpuma-langa
Limpopo
Non-youth Youth
60
65
70
75
80
85
90
Q1 Q22016
Q3 Q4| Q1 Q22017
Q3 Q4| Q1 Q22018
Q3 Q4| Q1 Q22019
Q3 Q4| Q1 Q22020
Capacity utilisation

November 2020 IDC – Research and Information – Sectoral Trends 37
Top trading partners (share of exports/imports) Top trading partners (value of export/imports)
First half of 2020 (cumulative total) First half of 2020 (cumulative total)
To
p l
ose
rs
H4401: Fuel wood, wood in chips/ particles, wood waste - 318.18
To
p l
ose
rs
H4412: P lywood, veneered panels, etc - 189.63
H4407: Wood sawn, chipped lengthwise, sliced or peeled - 90.01 H4410: Particle board, wood, ligneous material - 52.35
H4411: Fibreboard of wood or o ther ligneous materials - 83.00 H4402: Wood charcoal (including shell or nut charcoal) - 39.67
H4410: Particle board, wood, ligneous material - 227.24 H4407: Wood sawn, chipped lengthwise, sliced or peeled - 129.67
H4418: Builders jo inery and carpentry, o f wood - 125.12 H4418: Builders jo inery and carpentry, o f wood - 68.83
H4421: Articles of wood, nes 6.20 H4416: Wooden casks, barrels, vats, tubs, etc 5.37
H4413: Densified wood, in blocks, plates, strips or profile 0.21 H4415: Wooden cases, boxes, crates, drums, pallets, etc 1.66To
p g
ain
ers
H4402: Wood charcoal (including shell or nut charcoal) 44.19
To
p g
ain
ers
H4504: Agglomerated cork and articles thereof 6.67
H4412: P lywood, veneered panels, etc 23.47 H4408: Veneers and sheets for plywood, etc <6mm thick 6.06
H4416: Wooden casks, barrels, vats, tubs, etc 0.11 H4413: Densified wood, in blocks, plates, strips or profile 1.54
Expo rts T o tal ( including o thers) 2 758.31 Impo rts T o tal ( including o thers) 1 949.23
H4403: Wood in the rough or roughly squared 195.61 H4402: Wood charcoal (including shell or nut charcoal) 87.54
H4412: P lywood, veneered panels, etc 110.63 H4418: Builders jo inery and carpentry, o f wood 86.28
214.42
H4402: Wood charcoal (including shell or nut charcoal) 242.79 H4412: P lywood, veneered panels, etc 166.14
H4415: Wooden cases, boxes, crates, drums, pallets, etc 109.44 H4421: Articles of wood, nes 80.66
Major traded export products Major traded import products
First half of 2020 (cumulative total) First half of 2020 (cumulative total)
HS4 code: sector description ZAR m HS4 code: sector description ZAR m
To
p e
xpo
rts
H4401: Fuel wood, wood in chips/ particles, wood waste 1 270.69
To
p i
mp
ort
s
H4407: Wood sawn, chipped lengthwise, sliced or peeled 670.54
H4407: Wood sawn, chipped lengthwise, sliced or peeled 298.25 H4416: Wooden casks, barrels, vats, tubs, etc 265.80
H4418: Builders jo inery and carpentry, o f wood 282.15 H4411: Fibreboard of wood or o ther ligneous materials
Trade trends (value terms) Trade trends (% of total exports/imports)
Total per quarter Quarterly
ZAR billion per quarter (current v alues) % share of SA's ov erall merchandise ex ports/imports
Wood & wood products (cont.)Production weight: 4.3
0.5
1.0
1.5
2.0
2.5
Q1 Q22016
Q3 Q4| Q1 Q22017
Q3 Q4| Q1 Q22018
Q3 Q4| Q1 Q22019
Q3 Q4| Q1 Q22020
Exports Imports
0% 10% 20% 30% 40%
Swaziland
France
China
Malaysia
Indonesia
Namibia
Brazil
Japan
China
UK
Namibia
Botswana
Mozambique
Lesotho
Top export destinations' share
Top import sources' share
0.3%
0.5%
0.7%
Q1 Q22016
Q3 Q4| Q1 Q22017
Q3 Q4| Q1 Q22018
Q3 Q4| Q1 Q22019
Q3 Q4| Q1 Q22020
Exports Imports
0.0 0.4 0.8 1.2
Swaziland
France
China
Malaysia
Indonesia
Namibia
Brazil
Japan
China
UK
Namibia
Botswana
Mozambique
Lesotho
R billion
Top export destinations' value
Top import sources' value

November 2020 IDC – Research and Information – Sectoral Trends 38
(percentage points)
Skill composition of employment trend (formal and informal) (QLFS based) Provincial distribution of employment (formal and informal) (QLFS based)
Quarterly Q2 2020 (cumulative total)
Number (1 000) Number (1 000)
* QES - Q1 2012 to Q1 2015 data compiled from the 2013 Business Sample Frame, Q2 2015 to Q1 2016 compiled from the 2015 Business Sample Frame, Q2 2016 onw ards compiled from
the 2017 Business Sample Frame
** QLFS - Q1 2012 to Q4 2014 data compiled from the 2007 Master Sample, Q1 2015 onw ards compiled from the 2013 Master Sample
Formal employment and remuneration trend (QES based)* Employment composition trend (formal and informal) (QLFS based)**
Quarterly Quarterly
Number (1 000) Gross monthly remuneration per w orker (R '000) Formal employ ment % of total employ ment Youth employ ment % of total employ ment
Production and sales trend Utilisation of production capacity
Quarterly Quarterly
Production index (seasonally adjusted) Value of sales (R billion) Capacity utilisation (%)
Paper & paper productsProduction weight: 4.1
Trend analysis: first half of 2020 y-o-y (except: capacity utilisation, employment and remuneration - Q2 2020 y-o-y)
-8.5% 0.5% 80.6% -5.0%
Production (seas. adj.) Capacity utilisation Employment* Gross monthly remuneration per worker Exports (ZAR) Imports (ZAR)
-10.1% -12
16
18
20
22
80
85
90
95
100
105
110
Q1 Q22016
Q3 Q4| Q1 Q22017
Q3 Q4| Q1 Q22018
Q3 Q4| Q1 Q22019
Q3 Q4| Q1 Q22020
Volume of production Value of sales
,15
,18
,21
,24
,27
30
32
34
36
38
40
Q1 Q22016
Q3 Q4| Q1 Q22017
Q3 Q4| Q1 Q22018
Q3 Q4| Q1 Q22019
Q3 Q4| Q1 Q22020
Employment Remuneration per worker
15
30
45
60
90
92
94
96
98
100
102
Q1 Q22016
Q3 Q4| Q1 Q22017
Q3 Q4| Q1 Q22018
Q3 Q4| Q1 Q22019
Q3 Q4| Q1 Q22020
Formal employemnt Youth employment
0
20
40
60
80
Q1 Q22016
Q3 Q4| Q1 Q22017
Q3 Q4| Q1 Q22018
Q3 Q4| Q1 Q22019
Q3 Q4| Q1 Q22020
Tertiary education Secondary schooling completed Less than secondary schooling
0
4
8
12
16
20
24
28
WesternCape
EasternCape
NorthernCape
FreeState
KwaZulu-Natal
NorthWest
Gauteng Mpuma-langa
Limpopo
Non-youth Youth
70
75
80
85
90
Q1 Q22016
Q3 Q4| Q1 Q22017
Q3 Q4| Q1 Q22018
Q3 Q4| Q1 Q22019
Q3 Q4| Q1 Q22020
Capacity utilisation

November 2020 IDC – Research and Information – Sectoral Trends 39
Top trading partners (share of exports/imports) Top trading partners (value of export/imports)
First half of 2020 (cumulative total) First half of 2020 (cumulative total)
To
p l
ose
rs
H4802: Uncoated paper for writing, printing office machin - 157.45
To
p l
ose
rs
H4703: Chemical wood pulp, soda/sulphate, undissolving - 244.17
H4801: Newsprint - 17.78 H4801: Newsprint - 64.66
H4810: Paper, board, inorganic coated at least one side - 17.26 H4809: Carbon, self-copy paper, etc, width > 36 cm - 55.79
H4819: Paper, board containers, packing items, box files - 42.42 H4802: Uncoated paper for writing, printing office machin - 196.84
H4821: Paper/ paperboard labels including printed labels - 29.85 H4810: Paper, board, inorganic coated at least one side - 112.20
H4804: Uncoated kraft paper and paperboard 231.59 H4818: H.Hold, sanitary, hospital paper articles, clo thing 52.69
H4706: Pulps of o ther fibrous cellulosic material 81.52 H4819: Paper, board containers, packing items, box files 32.07To
p g
ain
ers
H4702: Chemical wood pulp, disso lving grades 3 942.06
To
p g
ain
ers
H4811: Paper, board, etc coated, impregnated, co loured 163.32
H4805: Uncoated paper and paperboard nes 268.23 H4805: Uncoated paper and paperboard nes 85.36
H4818: H.Hold, sanitary, hospital paper articles, clo thing 61.96 H4804: Uncoated kraft paper and paperboard 26.45
Expo rts T o tal ( including o thers) 9 918.97 Impo rts T o tal ( including o thers) 7 425.31
H4819: Paper, board containers, packing items, box files 561.93 H4703: Chemical wood pulp, soda/sulphate, undissolving 544.03
H4802: Uncoated paper for writing, printing office machin 504.71 H4819: Paper, board containers, packing items, box files 425.08
813.51
H4805: Uncoated paper and paperboard nes 571.65 H4802: Uncoated paper for writing, printing office machin 759.68
H4818: H.Hold, sanitary, hospital paper articles, clo thing 382.08 H4805: Uncoated paper and paperboard nes 366.35
Major traded export products Major traded import products
First half of 2020 (cumulative total) First half of 2020 (cumulative total)
HS4 code: sector description ZAR m HS4 code: sector description ZAR m
To
p e
xpo
rts
H4702: Chemical wood pulp, disso lving grades 5 065.39
To
p i
mp
ort
s
H4811: Paper, board, etc coated, impregnated, co loured 1 783.11
H4804: Uncoated kraft paper and paperboard 1 143.75 H4810: Paper, board, inorganic coated at least one side 1 497.83
H4703: Chemical wood pulp, soda/sulphate, undissolving 593.06 H4804: Uncoated kraft paper and paperboard
Trade trends (value terms) Trade trends (% of total exports/imports)
Total per quarter Quarterly
ZAR billion per quarter (current v alues) % share of SA's ov erall merchandise ex ports/imports
Paper & paper products (cont.)Production weight: 4.1
2
3
4
5
6
Q1 Q22016
Q3 Q4| Q1 Q22017
Q3 Q4| Q1 Q22018
Q3 Q4| Q1 Q22019
Q3 Q4| Q1 Q22020
Exports Imports
0% 4% 8% 12% 16% 20% 24% 28%
Germany
Brazil
China
USA
Finland
Sweden
Italy
China
India
Indonesia
Zimbabwe
Thailand
Namibia
Botswana
Top export destinations' share
Top import sources' share
0%
1%
2%
3%
Q1 Q22016
Q3 Q4| Q1 Q22017
Q3 Q4| Q1 Q22018
Q3 Q4| Q1 Q22019
Q3 Q4| Q1 Q22020
Exports Imports
0 1 2 3
Germany
Brazil
China
USA
Finland
Sweden
Italy
China
India
Indonesia
Zimbabwe
Thailand
Namibia
Botswana
R billion
Top export destinations' value
Top import sources' value

November 2020 IDC – Research and Information – Sectoral Trends 40
(percentage points)
Skill composition of employment trend (formal and informal) (QLFS based) Provincial distribution of employment (formal and informal) (QLFS based)
Quarterly Q2 2020 (cumulative total)
Number (1 000) Number (1 000)
* QES - Q1 2012 to Q1 2015 data compiled from the 2013 Business Sample Frame, Q2 2015 to Q1 2016 compiled from the 2015 Business Sample Frame, Q2 2016 onw ards compiled from
the 2017 Business Sample Frame
** QLFS - Q1 2012 to Q4 2014 data compiled from the 2007 Master Sample, Q1 2015 onw ards compiled from the 2013 Master Sample
Formal employment and remuneration trend (QES based)* Employment composition trend (formal and informal) (QLFS based)**
Quarterly Quarterly
Number (1 000) Gross monthly remuneration per w orker (R '000) Formal employ ment % of total employ ment Youth employ ment % of total employ ment
Production and sales trend Utilisation of production capacity
Quarterly Quarterly
Production index (seasonally adjusted) Value of sales (R billion) Capacity utilisation (%)
Printing, publishing & recorded mediaProduction weight: 3.0
Trend analysis: first half of 2020 y-o-y (except: capacity utilisation, employment and remuneration - Q2 2020 y-o-y)
-14.8% -6.8% 35.0% 0.2%
Production (seas. adj.) Capacity utilisation Employment* Gross monthly remuneration per worker Exports (ZAR) Imports (ZAR)
-26.1% -35.3
3.0
3.5
4.0
4.5
5.0
5.5
6.0
6.5
7.0
40
55
70
85
100
115
Q1 Q22016
Q3 Q4| Q1 Q22017
Q3 Q4| Q1 Q22018
Q3 Q4| Q1 Q22019
Q3 Q4| Q1 Q22020
Volume of production Value of sales
15
17
19
21
23
44
47
50
53
56
Q1 Q22016
Q3 Q4| Q1 Q22017
Q3 Q4| Q1 Q22018
Q3 Q4| Q1 Q22019
Q3 Q4| Q1 Q22020
Employment Remuneration per worker
18
23
28
33
38
43
48
53
80
85
90
95
100
Q1 Q22016
Q3 Q4| Q1 Q22017
Q3 Q4| Q1 Q22018
Q3 Q4| Q1 Q22019
Q3 Q4| Q1 Q22020
Formal employemnt Youth employment
0
30
60
90
120
Q1 Q22016
Q3 Q4| Q1 Q22017
Q3 Q4| Q1 Q22018
Q3 Q4| Q1 Q22019
Q3 Q4| Q1 Q22020
Tertiary education Secondary schooling completed Less than secondary schooling
0
10
20
30
WesternCape
EasternCape
NorthernCape
FreeState
KwaZulu-Natal
NorthWest
Gauteng Mpuma-langa
Limpopo
Non-youth Youth
30
40
50
60
70
80
90
Q1 Q22016
Q3 Q4| Q1 Q22017
Q3 Q4| Q1 Q22018
Q3 Q4| Q1 Q22019
Q3 Q4| Q1 Q22020
Capacity utilisation

November 2020 IDC – Research and Information – Sectoral Trends 41
Top trading partners (share of exports/imports) Top trading partners (value of export/imports)
First half of 2020 (cumulative total) First half of 2020 (cumulative total)
To
p l
ose
rs
H4911: Printed matter, catalogues, pictures and photos - 41.63
To
p l
ose
rs
H4901: Printed reading books, brochures, leaflets, etc - 174.31
H8442: M achinery or equipment for print preparation - 4.13 H4902: Newspapers, journals and periodicals - 8.62
H4904: M usic, printed or in manuscript - 3.15 H4908: Transfers (decalcomanias) - 5.52
H4820: Office books, forms, exercise books, fo lders, etc - 39.76 H4911: Printed matter, catalogues, pictures and photos - 164.68
H4902: Newspapers, journals and periodicals - 23.71 H4820: Office books, forms, exercise books, fo lders, etc - 21.22
H4903: Children's picture, drawing or co louring books 4.54
To
p g
ain
ers
H4901: Printed reading books, brochures, leaflets, etc 389.68
To
p g
ain
ers
H4907: Documents of title (bonds etc), unused stamps, etc 375.01
H4903: Children's picture, drawing or co louring books 0.03 H8442: M achinery or equipment for print preparation 10.90
Expo rts T o tal ( including o thers) 1 051.05 Impo rts T o tal ( including o thers) 7 403.38
H4908: Transfers (decalcomanias) 18.30 H8442: M achinery or equipment for print preparation 32.87
H8442: M achinery or equipment for print preparation 6.48 H4903: Children's picture, drawing or co louring books 23.62
237.14
H4902: Newspapers, journals and periodicals 36.72 H4820: Office books, forms, exercise books, fo lders, etc 72.88
H4910: Calendars, printed 2.74 H4908: Transfers (decalcomanias) 9.20
Major traded export products Major traded import products
First half of 2020 (cumulative total) First half of 2020 (cumulative total)
HS4 code: sector description ZAR m HS4 code: sector description ZAR m
To
p e
xpo
rts
H4901: Printed reading books, brochures, leaflets, etc 745.47
To
p i
mp
ort
s
H4907: Documents of title (bonds etc), unused stamps, etc 6 518.87
H4820: Office books, forms, exercise books, fo lders, etc 122.53 H4901: Printed reading books, brochures, leaflets, etc 489.52
H4911: Printed matter, catalogues, pictures and photos 111.94 H4911: Printed matter, catalogues, pictures and photos
Trade trends (value terms) Trade trends (% of total exports/imports)
Total per quarter Quarterly
ZAR billion per quarter (current v alues) % share of SA's ov erall merchandise ex ports/imports
Printing, publishing & recorded media (cont.)Production weight: 3.0
0
1
2
3
4
5
6
7
8
Q1 Q22016
Q3 Q4| Q1 Q22017
Q3 Q4| Q1 Q22018
Q3 Q4| Q1 Q22019
Q3 Q4| Q1 Q22020
Exports Imports
0% 15% 30% 45% 60%
UK
Switzerland
USA
China
Kenya
Ireland
Belgium
Angola
Namibia
Swaziland
Botswana
Zimbabwe
Lesotho
Zambia
Top export destinations' share
Top import sources' share
0.0%
0.5%
1.0%
1.5%
2.0%
Q1 Q22016
Q3 Q4| Q1 Q22017
Q3 Q4| Q1 Q22018
Q3 Q4| Q1 Q22019
Q3 Q4| Q1 Q22020
Exports Imports
0 1 2 3 4
UK
Switzerland
USA
China
Kenya
Ireland
Belgium
Angola
Namibia
Swaziland
Botswana
Zimbabwe
Lesotho
Zambia
R billion
Top export destinations' value
Top import sources' value

November 2020 IDC – Research and Information – Sectoral Trends 42
(percentage points)
Skill composition of employment trend (formal and informal) (QLFS based) Provincial distribution of employment (formal and informal) (QLFS based)
Quarterly Q2 2020 (cumulative total)
Number (1 000) Number (1 000)
* QES - Q1 2012 to Q1 2015 data compiled from the 2013 Business Sample Frame, Q2 2015 to Q1 2016 compiled from the 2015 Business Sample Frame, Q2 2016 onw ards compiled from
the 2017 Business Sample Frame
** QLFS - Q1 2012 to Q4 2014 data compiled from the 2007 Master Sample, Q1 2015 onw ards compiled from the 2013 Master Sample
Formal employment and remuneration trend (QES based)* Employment composition trend (formal and informal) (QLFS based)**
Quarterly Quarterly
Number (1 000) Gross monthly remuneration per w orker (R '000) Formal employ ment % of total employ ment Youth employ ment % of total employ ment
Production and sales trend Utilisation of production capacity
Quarterly Quarterly
Production index (seasonally adjusted) Value of sales (R billion) Capacity utilisation (%)
Coke & refined petroleum productsProduction weight: 8.7
Trend analysis: first half of 2020 y-o-y (except: capacity utilisation, employment and remuneration - Q2 2020 y-o-y)
-1.8% 4.0% -12.1% -17.5%
Production (seas. adj.) Capacity utilisation Employment* Gross monthly remuneration per worker Exports (ZAR) Imports (ZAR)
-26.6% -22.4
15
20
25
30
35
40
45
50
50
60
70
80
90
100
110
120
Q1 Q22016
Q3 Q4| Q1 Q22017
Q3 Q4| Q1 Q22018
Q3 Q4| Q1 Q22019
Q3 Q4| Q1 Q22020
Volume of production Value of sales
38
42
46
50
54
22
24
26
Q1 Q22016
Q3 Q4| Q1 Q22017
Q3 Q4| Q1 Q22018
Q3 Q4| Q1 Q22019
Q3 Q4| Q1 Q22020
Employment Remuneration per worker
15
25
35
45
55
94
96
98
100
102
Q1 Q22016
Q3 Q4| Q1 Q22017
Q3 Q4| Q1 Q22018
Q3 Q4| Q1 Q22019
Q3 Q4| Q1 Q22020
Formal employemnt Youth employment
0
20
40
60
80
Q1 Q22016
Q3 Q4| Q1 Q22017
Q3 Q4| Q1 Q22018
Q3 Q4| Q1 Q22019
Q3 Q4| Q1 Q22020
Tertiary education Secondary schooling completed Less than secondary schooling
0
5
10
15
20
25
30
WesternCape
EasternCape
NorthernCape
FreeState
KwaZulu-Natal
NorthWest
Gauteng Mpuma-langa
Limpopo
Non-youth Youth
60
65
70
75
80
85
90
Q1 Q22016
Q3 Q4| Q1 Q22017
Q3 Q4| Q1 Q22018
Q3 Q4| Q1 Q22019
Q3 Q4| Q1 Q22020
Capacity utilisation

November 2020 IDC – Research and Information – Sectoral Trends 43
Top trading partners (share of exports/imports) Top trading partners (value of export/imports)
First half of 2020 (cumulative total) First half of 2020 (cumulative total)
To
p l
ose
rs
H2710: Petro leum oils, bituminous, distillates, except crude -3 294.98
To
p l
ose
rs
H2710: Petro leum oils, bituminous, distillates, except crude -4 380.87
H2706: Tar from coal, lignite or peat, o ther mineral tars - 0.66 H2713: Petro leum coke, bitumen & other o il industry residues - 139.23
H8401: Nuclear reactors,fuel elements,isotope separators - 0.22 H2844: Radioactive elements, isotopes, compounds and mixtures - 10.45
H2704: Retort carbon, coke/semi-coke of coal, lignite,peat - 108.22 H2704: Retort carbon, coke/semi-coke of coal, lignite,peat -1 545.32
H2713: Petro leum coke, bitumen & other o il industry residues - 98.20 H8401: Nuclear reactors,fuel elements,isotope separators - 564.56
H2711: Petro leum gases & other gaseous hydrocarbons 37.14 H3826: B iodiesel and mixtures thereof, containing ≤70 per cent by mass of petro leum oils 1.26
H3826: B iodiesel and mixtures thereof, containing ≤70 per cent by mass of petro leum oils 4.54 H2706: Tar from coal, lignite or peat, o ther mineral tars 0.30To
p g
ain
ers
H2712: Petro leum jelly and wax, o ther mineral waxes 610.89
To
p g
ain
ers
H2711: Petro leum gases & other gaseous hydrocarbons 164.92
H2844: Radioactive elements, isotopes, compounds and mixtures 122.19 H2712: Petro leum jelly and wax, o ther mineral waxes 40.19
Expo rts T o tal ( including o thers) 19 794.64 Impo rts T o tal ( including o thers) 30 264.91
H2713: Petro leum coke, bitumen & other o il industry residues 223.26 H2704: Retort carbon, coke/semi-coke of coal, lignite,peat 143.88
H2704: Retort carbon, coke/semi-coke of coal, lignite,peat 156.74 H2844: Radioactive elements, isotopes, compounds and mixtures 50.91
550.77
H2844: Radioactive elements, isotopes, compounds and mixtures 291.84 H2712: Petro leum jelly and wax, o ther mineral waxes 265.88
H3826: B iodiesel and mixtures thereof, containing ≤70 per cent by mass of petro leum oils 5.07 H3826: B iodiesel and mixtures thereof, containing ≤70 per cent by mass of petro leum oils 2.21
Major traded export products Major traded import products
First half of 2020 (cumulative total) First half of 2020 (cumulative total)
HS4 code: sector description ZAR m HS4 code: sector description ZAR m
To
p e
xpo
rts
H2710: Petro leum oils, bituminous, distillates, except crude 16 876.90
To
p i
mp
ort
s
H2710: Petro leum oils, bituminous, distillates, except crude 28 393.97
H2712: Petro leum jelly and wax, o ther mineral waxes 1 804.62 H2711: Petro leum gases & other gaseous hydrocarbons 855.21
H2711: Petro leum gases & other gaseous hydrocarbons 435.59 H2713: Petro leum coke, bitumen & other o il industry residues
Trade trends (value terms) Trade trends (% of total exports/imports)
Total per quarter Quarterly
ZAR billion per quarter (current v alues) % share of SA's ov erall merchandise ex ports/imports
Coke & refined petroleum products (cont.)Production weight: 8.7
6
10
14
18
22
26
Q1 Q22016
Q3 Q4| Q1 Q22017
Q3 Q4| Q1 Q22018
Q3 Q4| Q1 Q22019
Q3 Q4| Q1 Q22020
Exports Imports
0% 10% 20%
UAE
Oman
India
Saudi Arabia
Malaysia
USA
Singapore
Botswana
Lesotho
Namibia
Germany
Swaziland
Zimbabwe
DRC
Top export destinations' share
Top import sources' share
2%
4%
6%
8%
Q1 Q22016
Q3 Q4| Q1 Q22017
Q3 Q4| Q1 Q22018
Q3 Q4| Q1 Q22019
Q3 Q4| Q1 Q22020
Exports Imports
0 2 4 6
UAE
Oman
India
Saudi Arabia
Malaysia
USA
Singapore
Botswana
Lesotho
Namibia
Germany
Swaziland
Zimbabwe
DRC
R billion
Top export destinations' value
Top import sources' value

November 2020 IDC – Research and Information – Sectoral Trends 44
(percentage points)
Skill composition of employment trend (formal and informal) (QLFS based) Provincial distribution of employment (formal and informal) (QLFS based)
Quarterly Q2 2020 (cumulative total)
Number (1 000) Number (1 000)
* QES - Q1 2012 to Q1 2015 data compiled from the 2013 Business Sample Frame, Q2 2015 to Q1 2016 compiled from the 2015 Business Sample Frame, Q2 2016 onw ards compiled from
the 2017 Business Sample Frame
** QLFS - Q1 2012 to Q4 2014 data compiled from the 2007 Master Sample, Q1 2015 onw ards compiled from the 2013 Master Sample
Formal employment and remuneration trend (QES based)* Employment composition trend (formal and informal) (QLFS based)**
Quarterly Quarterly
Number (1 000) Gross monthly remuneration per w orker (R '000) Formal employ ment % of total employ ment Youth employ ment % of total employ ment
Production and sales trend Utilisation of production capacity
Quarterly Quarterly
Production index (seasonally adjusted) Value of sales (R billion) Capacity utilisation (%)
Basic chemicalsProduction weight: 4.3
Trend analysis: first half of 2020 y-o-y (except: capacity utilisation, employment and remuneration - Q2 2020 y-o-y)
-7.9% -4.3% -6.9% -3.0%
Production (seas. adj.) Capacity utilisation Employment* Gross monthly remuneration per worker Exports (ZAR) Imports (ZAR)
3.9% -25.9
22
23
24
25
26
27
85
90
95
100
105
110
Q1 Q22016
Q3 Q4| Q1 Q22017
Q3 Q4| Q1 Q22018
Q3 Q4| Q1 Q22019
Q3 Q4| Q1 Q22020
Volume of production Value of sales
22
24
26
28
30
32
20
21
22
23
24
25
Q1 Q22016
Q3 Q4| Q1 Q22017
Q3 Q4| Q1 Q22018
Q3 Q4| Q1 Q22019
Q3 Q4| Q1 Q22020
Employment Remuneration per worker
0
20
40
60
80
85
90
95
100
105
Q1 Q22016
Q3 Q4| Q1 Q22017
Q3 Q4| Q1 Q22018
Q3 Q4| Q1 Q22019
Q3 Q4| Q1 Q22020
Formal employemnt Youth employment
0
2
4
6
8
10
12
14
16
18
20
Q1 Q22016
Q3 Q4| Q1 Q22017
Q3 Q4| Q1 Q22018
Q3 Q4| Q1 Q22019
Q3 Q4| Q1 Q22020
Tertiary education Secondary schooling completed Less than secondary schooling
0
1
2
3
4
5
6
7
8
9
10
11
12
13
WesternCape
EasternCape
NorthernCape
FreeState
KwaZulu-Natal
NorthWest
Gauteng Mpuma-langa
Limpopo
Non-youth Youth
50
60
70
80
90
100
Q1 Q22016
Q3 Q4| Q1 Q22017
Q3 Q4| Q1 Q22018
Q3 Q4| Q1 Q22019
Q3 Q4| Q1 Q22020
Capacity utilisation

November 2020 IDC – Research and Information – Sectoral Trends 45
Top trading partners (share of exports/imports) Top trading partners (value of export/imports)
First half of 2020 (cumulative total) First half of 2020 (cumulative total)
To
p l
ose
rs
H2825: Hydrazine, hydroxylamine, metal oxides etc -1 320.74
To
p l
ose
rs
H3105: Fertilizer mixtures in packs of < 10kg - 361.87
H2707: Coal-tar distillation products including o ils - 631.23 H3901: Polymers of ethylene, in primary forms - 191.66
H3901: Polymers of ethylene, in primary forms - 381.16 H3907: Polyacetals, po lyethers, etc, primary - 185.96
H2849: Carbides, whether or not chemically defined -1 052.25 H2917: Polycarboxylic acid, derivatives - 236.28
H3902: Polymers of propylene, o lefins in primary forms - 646.71 H2905: Acyclic alcohols and their derivatives - 195.77
H2901: Acyclic hydrocarbons 301.28 H2930: Organo-sulphur compounds 121.58
H2835: Phosphatic compounds 292.64 H3102: M ineral or chemical fertilizers, nitrogenous 89.62To
p g
ain
ers
H2833: Sulphates, alums, peroxosulphates (persulphates) 1 244.01
To
p g
ain
ers
H2843: Precious metal co llo ids, compounds & amalgams 933.82
H3507: Enzymes, prepared enzymes 365.28 H2933: Heterocyclics, nitrogen hetero atom only, etc 232.33
H2905: Acyclic alcohols and their derivatives 201.18 H3507: Enzymes, prepared enzymes 78.92
Expo rts T o tal ( including o thers) 24 351.90 Impo rts T o tal ( including o thers) 25 147.48
H3102: M ineral or chemical fertilizers, nitrogenous 1 312.80 H2917: Polycarboxylic acid, derivatives 882.94
H2914: Ketones and quinones, their derivatives 1 112.81 H2933: Heterocyclics, nitrogen hetero atom only, etc 882.05
1 311.62
H2905: Acyclic alcohols and their derivatives 1 690.77 H3907: Polyacetals, po lyethers, etc, primary 1 084.61
H3901: Polymers of ethylene, in primary forms 820.73 H2836: Carbonates 808.17
Major traded export products Major traded import products
First half of 2020 (cumulative total) First half of 2020 (cumulative total)
HS4 code: sector description ZAR m HS4 code: sector description ZAR m
To
p e
xpo
rts
H2901: Acyclic hydrocarbons 3 366.56
To
p i
mp
ort
s
H3901: Polymers of ethylene, in primary forms 1 496.40
H3902: Polymers of propylene, o lefins in primary forms 2 820.30 H2843: Precious metal co llo ids, compounds & amalgams 1 440.16
H2833: Sulphates, alums, peroxosulphates (persulphates) 2 812.38 H3102: M ineral or chemical fertilizers, nitrogenous
Trade trends (value terms) Trade trends (% of total exports/imports)
Total per quarter Quarterly
ZAR billion per quarter (current v alues) % share of SA's ov erall merchandise ex ports/imports
Basic chemicals (cont.)Production weight: 4.3
9
12
15
18
Q1 Q22016
Q3 Q4| Q1 Q22017
Q3 Q4| Q1 Q22018
Q3 Q4| Q1 Q22019
Q3 Q4| Q1 Q22020
Exports Imports
0% 5% 10% 15% 20% 25%
China
USA
Germany
India
Saudi Arabia
Netherlands
South Korea
Belgium
USA
Zambia
Zimbabwe
Netherlands
Singapore
India
Top export destinations' share
Top import sources' share
3.5%
4.0%
4.5%
5.0%
Q1 Q22016
Q3 Q4| Q1 Q22017
Q3 Q4| Q1 Q22018
Q3 Q4| Q1 Q22019
Q3 Q4| Q1 Q22020
Exports Imports
0 2 4 6
China
USA
Germany
India
Saudi Arabia
Netherlands
South Korea
Belgium
USA
Zambia
Zimbabwe
Netherlands
Singapore
India
R billion
Top export destinations' value
Top import sources' value

November 2020 IDC – Research and Information – Sectoral Trends 46
(percentage points)
Skill composition of employment trend (formal and informal) (QLFS based) Provincial distribution of employment (formal and informal) (QLFS based)
Quarterly Q2 2020 (cumulative total)
Number (1 000) Number (1 000)
* QES - Q1 2012 to Q1 2015 data compiled from the 2013 Business Sample Frame, Q2 2015 to Q1 2016 compiled from the 2015 Business Sample Frame, Q2 2016 onw ards compiled from
the 2017 Business Sample Frame
** QLFS - Q1 2012 to Q4 2014 data compiled from the 2007 Master Sample, Q1 2015 onw ards compiled from the 2013 Master Sample
Formal employment and remuneration trend (QES based)* Employment composition trend (formal and informal) (QLFS based)**
Quarterly Quarterly
Number (1 000) Gross monthly remuneration per w orker (R '000) Formal employ ment % of total employ ment Youth employ ment % of total employ ment
Production and sales trend Utilisation of production capacity
Quarterly Quarterly
Production index (seasonally adjusted) Value of sales (R billion) Capacity utilisation (%)
Other chemicals & man-made fibresProduction weight: 6.2
Trend analysis: first half of 2020 y-o-y (except: capacity utilisation, employment and remuneration - Q2 2020 y-o-y)
-0.1% -4.3% 8.5% 8.9%
Production (seas. adj.) Capacity utilisation Employment* Gross monthly remuneration per worker Exports (ZAR) Imports (ZAR)
-1.8% -6.2
28
30
32
34
36
38
90
95
100
105
110
Q1 Q22016
Q3 Q4| Q1 Q22017
Q3 Q4| Q1 Q22018
Q3 Q4| Q1 Q22019
Q3 Q4| Q1 Q22020
Volume of production Value of sales
,20
,22
,24
,26
,28
,30
55
60
65
70
Q1 Q22016
Q3 Q4| Q1 Q22017
Q3 Q4| Q1 Q22018
Q3 Q4| Q1 Q22019
Q3 Q4| Q1 Q22020
Employment Remuneration per worker
26
30
34
38
42
46
50
90
92
94
96
98
100
102
Q1 Q22016
Q3 Q4| Q1 Q22017
Q3 Q4| Q1 Q22018
Q3 Q4| Q1 Q22019
Q3 Q4| Q1 Q22020
Formal employemnt Youth employment
0
25
50
75
100
125
Q1 Q22016
Q3 Q4| Q1 Q22017
Q3 Q4| Q1 Q22018
Q3 Q4| Q1 Q22019
Q3 Q4| Q1 Q22020
Tertiary education Secondary schooling completed Less than secondary schooling
0
15
30
45
60
75
WesternCape
EasternCape
NorthernCape
FreeState
KwaZulu-Natal
NorthWest
Gauteng Mpuma-langa
Limpopo
Non-youth Youth
75
77
79
81
83
85
87
89
Q1 Q22016
Q3 Q4| Q1 Q22017
Q3 Q4| Q1 Q22018
Q3 Q4| Q1 Q22019
Q3 Q4| Q1 Q22020
Capacity utilisation

November 2020 IDC – Research and Information – Sectoral Trends 47
Top trading partners (share of exports/imports) Top trading partners (value of export/imports)
First half of 2020 (cumulative total) First half of 2020 (cumulative total)
To
p l
ose
rs
H3814: Organic composite so lvents,paint,varnish remover - 130.70
To
p l
ose
rs
H3302: M ixted odoriferous substances for industrial use - 421.66
H3208: Polymer based paints, non-aqueous varnishes - 75.21 H3824: Prepared binders for foundary moulds or cores - 251.05
H3305: Hair preparations - 58.49 H5402: Synth. filament yarn(not sewing thread) not retail - 144.96
H3307: Shaving and to ilet preparations nes, deodorizers - 92.57 H8523: Prepared unrecorded sound recording media - 297.72
H8523: Prepared unrecorded sound recording media - 85.57 H3304: Beauty, make-up and skin care preparations - 264.59
H3402: Organic surface active agent, preparation, except soap 238.44 H3808: Insecticides, fungicides, herbicides etc (retail) 636.09
H3822: Composite diagnostic or laboratory reagents 195.86 H3811: Gasoline and o il additives 364.12To
p g
ain
ers
H3808: Insecticides, fungicides, herbicides etc (retail) 644.43
To
p g
ain
ers
H3004: M edicaments, therapeutic, prophylactic use 2 121.24
H3815: Reaction initiators, accelerators & catalysts 549.12 H3822: Composite diagnostic or laboratory reagents 1 187.11
H3824: Prepared binders for foundary moulds or cores 166.78 H3002: B lood, antisera, vaccines, toxins and cultures 267.23
Expo rts T o tal ( including o thers) 21 651.23 Impo rts T o tal ( including o thers) 47 496.00
H3402: Organic surface active agent, preparation, except soap 1 550.33 H3808: Insecticides, fungicides, herbicides etc (retail) 2 877.88
H3401: Soaps 1 175.09 H3824: Prepared binders for foundary moulds or cores 2 012.34
3 317.14
H3304: Beauty, make-up and skin care preparations 1 871.60 H3822: Composite diagnostic or laboratory reagents 2 933.12
H3824: Prepared binders for foundary moulds or cores 1 075.62 H3811: Gasoline and o il additives 1 528.38
Major traded export products Major traded import products
First half of 2020 (cumulative total) First half of 2020 (cumulative total)
HS4 code: sector description ZAR m HS4 code: sector description ZAR m
To
p e
xpo
rts
H3815: Reaction initiators, accelerators & catalysts 3 029.73
To
p i
mp
ort
s
H3004: M edicaments, therapeutic, prophylactic use 14 349.57
H3004: M edicaments, therapeutic, prophylactic use 2 244.90 H3002: B lood, antisera, vaccines, toxins and cultures 3 849.70
H3808: Insecticides, fungicides, herbicides etc (retail) 2 183.54 H3302: M ixted odoriferous substances for industrial use
Trade trends (value terms) Trade trends (% of total exports/imports)
Total per quarter Quarterly
ZAR billion per quarter (current v alues) % share of SA's ov erall merchandise ex ports/imports
Other chemicals & man-made fibres (cont.)Production weight: 6.2
5
10
15
20
25
30
Q1 Q22016
Q3 Q4| Q1 Q22017
Q3 Q4| Q1 Q22018
Q3 Q4| Q1 Q22019
Q3 Q4| Q1 Q22020
Exports Imports
0% 3% 6% 9% 12% 15%
USA
Germany
India
China
France
Swaziland
Spain
Namibia
Netherlands
Botswana
USA
Zambia
Zimbabwe
Mozambique
Top export destinations' share
Top import sources' share
2%
4%
6%
8%
10%
Q1 Q22016
Q3 Q4| Q1 Q22017
Q3 Q4| Q1 Q22018
Q3 Q4| Q1 Q22019
Q3 Q4| Q1 Q22020
Exports Imports
0 2 4 6 8
USA
Germany
India
China
France
Swaziland
Spain
Namibia
Netherlands
Botswana
USA
Zambia
Zimbabwe
Mozambique
R billion
Top export destinations' value
Top import sources' value

November 2020 IDC – Research and Information – Sectoral Trends 48
(percentage points)
Skill composition of employment trend (formal and informal) (QLFS based) Provincial distribution of employment (formal and informal) (QLFS based)
Quarterly Q2 2020 (cumulative total)
Number (1 000) Number (1 000)
* QES - Q1 2012 to Q1 2015 data compiled from the 2013 Business Sample Frame, Q2 2015 to Q1 2016 compiled from the 2015 Business Sample Frame, Q2 2016 onw ards compiled from
the 2017 Business Sample Frame
** QLFS - Q1 2012 to Q4 2014 data compiled from the 2007 Master Sample, Q1 2015 onw ards compiled from the 2013 Master Sample
Formal employment and remuneration trend (QES based)* Employment composition trend (formal and informal) (QLFS based)**
Quarterly Quarterly
Number (1 000) Gross monthly remuneration per w orker (R '000) Formal employ ment % of total employ ment Youth employ ment % of total employ ment
Production and sales trend Utilisation of production capacity
Quarterly Quarterly
Production index (seasonally adjusted) Value of sales (R billion) Capacity utilisation (%)
Rubber productsProduction weight: 1.2
Trend analysis: first half of 2020 y-o-y (except: capacity utilisation, employment and remuneration - Q2 2020 y-o-y)
-8.6% -22.2% -11.5% -14.5%
Production (seas. adj.) Capacity utilisation Employment* Gross monthly remuneration per worker Exports (ZAR) Imports (ZAR)
-22.0% -34
2
3
4
5
50
60
70
80
90
100
110
Q1 Q22016
Q3 Q4| Q1 Q22017
Q3 Q4| Q1 Q22018
Q3 Q4| Q1 Q22019
Q3 Q4| Q1 Q22020
Volume of production Value of sales
,18
,20
,22
,24
,26
,28
10
11
12
13
14
Q1 Q22016
Q3 Q4| Q1 Q22017
Q3 Q4| Q1 Q22018
Q3 Q4| Q1 Q22019
Q3 Q4| Q1 Q22020
Employment Remuneration per worker
20
35
50
65
85
88
91
94
97
100
103
Q1 Q22016
Q3 Q4| Q1 Q22017
Q3 Q4| Q1 Q22018
Q3 Q4| Q1 Q22019
Q3 Q4| Q1 Q22020
Formal employemnt Youth employment
0
10
20
30
40
Q1 Q22016
Q3 Q4| Q1 Q22017
Q3 Q4| Q1 Q22018
Q3 Q4| Q1 Q22019
Q3 Q4| Q1 Q22020
Tertiary education Secondary schooling completed Less than secondary schooling
0
3
6
9
WesternCape
EasternCape
NorthernCape
FreeState
KwaZulu-Natal
NorthWest
Gauteng Mpuma-langa
Limpopo
Non-youth Youth
45
55
65
75
85
95
Q1 Q22016
Q3 Q4| Q1 Q22017
Q3 Q4| Q1 Q22018
Q3 Q4| Q1 Q22019
Q3 Q4| Q1 Q22020
Capacity utilisation

November 2020 IDC – Research and Information – Sectoral Trends 49
Top trading partners (share of exports/imports) Top trading partners (value of export/imports)
First half of 2020 (cumulative total) First half of 2020 (cumulative total)
To
p l
ose
rs
H4011: New pneumatic tyres, o f rubber - 193.47
To
p l
ose
rs
H4011: New pneumatic tyres, o f rubber - 992.54
H4009: Rubber tube, pipe, hose, except hard rubber - 27.32 H4009: Rubber tube, pipe, hose, except hard rubber - 29.50
H4012: Tyres nes, retreaded, etc, so lid, cushioned - 16.74 H5906: Rubberised textile fabric, except tyre cord - 21.54
H4010: Conveyor and similar belts or belting of rubber - 74.45 H4016: Articles of vulcanised rubber except hard rubber - 114.53
H4016: Articles of vulcanised rubber except hard rubber - 50.55 H9801: Original equipment components - 63.41
H4005: Compounded unvulcanised rubber in primary form 3.24
H4007: Vulcanised rubber thread and cord 1.53To
p g
ain
ers
H4015: Rubber clo thing & accessories, but hard rubber 19.91
To
p g
ain
ers
H4015: Rubber clo thing & accessories, but hard rubber 123.25
H5906: Rubberised textile fabric, except tyre cord 10.16 H4006: Unvulcanised rubber as rods, tubes, discs, etc 3.40
H4003: Reclaimed rubber in primary forms or in sheets 0.64
Expo rts T o tal ( including o thers) 2 643.35 Impo rts T o tal ( including o thers) 6 772.98
H4015: Rubber clo thing & accessories, but hard rubber 59.52 H4015: Rubber clo thing & accessories, but hard rubber 414.51
H4005: Compounded unvulcanised rubber in primary form 48.69 H9801: Original equipment components 274.07
594.07
H4009: Rubber tube, pipe, hose, except hard rubber 221.97 H4009: Rubber tube, pipe, hose, except hard rubber 474.73
H4012: Tyres nes, retreaded, etc, so lid, cushioned 47.54 H4014: Hygienic or pharmaceutical articles of rubber 163.18
Major traded export products Major traded import products
First half of 2020 (cumulative total) First half of 2020 (cumulative total)
HS4 code: sector description ZAR m HS4 code: sector description ZAR m
To
p e
xpo
rts
H4011: New pneumatic tyres, o f rubber 1 581.37
To
p i
mp
ort
s
H4011: New pneumatic tyres, o f rubber 3 602.19
H4010: Conveyor and similar belts or belting of rubber 318.50 H4016: Articles of vulcanised rubber except hard rubber 863.54
H4016: Articles of vulcanised rubber except hard rubber 270.88 H4010: Conveyor and similar belts or belting of rubber
Trade trends (value terms) Trade trends (% of total exports/imports)
Total per quarter Quarterly
ZAR billion per quarter (current v alues) % share of SA's ov erall merchandise ex ports/imports
Rubber products (cont.)Production weight: 1.2
1
2
3
4
5
Q1 Q22016
Q3 Q4| Q1 Q22017
Q3 Q4| Q1 Q22018
Q3 Q4| Q1 Q22019
Q3 Q4| Q1 Q22020
Exports Imports
0% 5% 10% 15% 20% 25% 30%
China
USA
Germany
Japan
Thailand
Malaysia
Poland
Zambia
Namibia
Botswana
Zimbabwe
DRC
Swaziland
Mozambique
Top export destinations' share
Top import sources' share
0.0%
0.5%
1.0%
1.5%
Q1 Q22016
Q3 Q4| Q1 Q22017
Q3 Q4| Q1 Q22018
Q3 Q4| Q1 Q22019
Q3 Q4| Q1 Q22020
Exports Imports
0 1 2
China
USA
Germany
Japan
Thailand
Malaysia
Poland
Zambia
Namibia
Botswana
Zimbabwe
DRC
Swaziland
Mozambique
R billion
Top export destinations' value
Top import sources' value

November 2020 IDC – Research and Information – Sectoral Trends 50
(percentage points)
Skill composition of employment trend (formal and informal) (QLFS based) Provincial distribution of employment (formal and informal) (QLFS based)
Quarterly Q2 2020 (cumulative total)
Number (1 000) Number (1 000)
* QES - Q1 2012 to Q1 2015 data compiled from the 2013 Business Sample Frame, Q2 2015 to Q1 2016 compiled from the 2015 Business Sample Frame, Q2 2016 onw ards compiled from
the 2017 Business Sample Frame
** QLFS - Q1 2012 to Q4 2014 data compiled from the 2007 Master Sample, Q1 2015 onw ards compiled from the 2013 Master Sample
Formal employment and remuneration trend (QES based)* Employment composition trend (formal and informal) (QLFS based)**
Quarterly Quarterly
Number (1 000) Gross monthly remuneration per w orker (R '000) Formal employ ment % of total employ ment Youth employ ment % of total employ ment
Production and sales trend Utilisation of production capacity
Quarterly Quarterly
Production index (seasonally adjusted) Value of sales (R billion) Capacity utilisation (%)
Plastic productsProduction weight: 2.7
Trend analysis: first half of 2020 y-o-y (except: capacity utilisation, employment and remuneration - Q2 2020 y-o-y)
-4.9% -7.3% 5.1% -7.7%
Production (seas. adj.) Capacity utilisation Employment* Gross monthly remuneration per worker Exports (ZAR) Imports (ZAR)
-12.8% -6.1
13
14
15
16
17
18
19
80
83
86
89
92
95
98
101
104
107
110
Q1 Q22016
Q3 Q4| Q1 Q22017
Q3 Q4| Q1 Q22018
Q3 Q4| Q1 Q22019
Q3 Q4| Q1 Q22020
Volume of production Value of sales
11
13
15
17
19
40
42
44
46
48
50
Q1 Q22016
Q3 Q4| Q1 Q22017
Q3 Q4| Q1 Q22018
Q3 Q4| Q1 Q22019
Q3 Q4| Q1 Q22020
Employment Remuneration per worker
25
30
35
40
45
50
55
88
91
94
97
100
103
Q1 Q22016
Q3 Q4| Q1 Q22017
Q3 Q4| Q1 Q22018
Q3 Q4| Q1 Q22019
Q3 Q4| Q1 Q22020
Formal employemnt Youth employment
0
15
30
45
60
75
Q1 Q22016
Q3 Q4| Q1 Q22017
Q3 Q4| Q1 Q22018
Q3 Q4| Q1 Q22019
Q3 Q4| Q1 Q22020
Tertiary education Secondary schooling completed Less than secondary schooling
0
4
8
12
16
WesternCape
EasternCape
NorthernCape
FreeState
KwaZulu-Natal
NorthWest
Gauteng Mpuma-langa
Limpopo
Non-youth Youth
75
78
81
84
87
Q1 Q22016
Q3 Q4| Q1 Q22017
Q3 Q4| Q1 Q22018
Q3 Q4| Q1 Q22019
Q3 Q4| Q1 Q22020
Capacity utilisation

November 2020 IDC – Research and Information – Sectoral Trends 51
Top trading partners (share of exports/imports) Top trading partners (value of export/imports)
First half of 2020 (cumulative total) First half of 2020 (cumulative total)
To
p l
ose
rs
H3926: P lastic articles nes - 86.13
To
p l
ose
rs
H3917: P lastic tube, pipe, hose and fittings - 210.20
H3917: P lastic tube, pipe, hose and fittings - 39.95 H3918: P lastic floor, wall or ceiling covering, ro ll or tiles - 62.86
H3925: P lastic articles for use in construction nes - 37.35 H3924: P lastic table, kitchen, household, to ilet articles - 53.52
H3924: P lastic table, kitchen, household, to ilet articles - 48.34 H3920: P lastic plate, sheet, film not cellular, reinforced - 107.21
H3920: P lastic plate, sheet, film not cellular, reinforced - 43.87 H3919: Self-adhesive plates, sheets, film, etc of plastic - 99.47
To
p g
ain
ers
H3923: Containers, bobbins and packages, o f plastics 573.21
To
p g
ain
ers
H3923: Containers, bobbins and packages, o f plastics 31.23
H8547: Insulating fittings for electrical equipment 0.79
Expo rts T o tal ( including o thers) 4 225.20 Impo rts T o tal ( including o thers) 7 968.27
H3924: P lastic table, kitchen, household, to ilet articles 215.20 H3919: Self-adhesive plates, sheets, film, etc of plastic 916.93
H3921: P lastic plate, sheet, film, fo il, strip, cellular, nes 140.13 H3917: P lastic tube, pipe, hose and fittings 761.21
1 163.02
H3920: P lastic plate, sheet, film not cellular, reinforced 382.13 H3921: P lastic plate, sheet, film, fo il, strip, cellular, nes 957.68
H3919: Self-adhesive plates, sheets, film, etc of plastic 125.96 H3924: P lastic table, kitchen, household, to ilet articles 371.66
Major traded export products Major traded import products
First half of 2020 (cumulative total) First half of 2020 (cumulative total)
HS4 code: sector description ZAR m HS4 code: sector description ZAR m
To
p e
xpo
rts
H3923: Containers, bobbins and packages, o f plastics 1 790.77
To
p i
mp
ort
s
H3926: P lastic articles nes 1 626.55
H3917: P lastic tube, pipe, hose and fittings 676.58 H3920: P lastic plate, sheet, film not cellular, reinforced 1 429.85
H3926: P lastic articles nes 561.60 H3923: Containers, bobbins and packages, o f plastics
Trade trends (value terms) Trade trends (% of total exports/imports)
Total per quarter Quarterly
ZAR billion per quarter (current v alues) % share of SA's ov erall merchandise ex ports/imports
Plastic products (cont.)Production weight: 2.7
1
2
3
4
5
6
Q1 Q22016
Q3 Q4| Q1 Q22017
Q3 Q4| Q1 Q22018
Q3 Q4| Q1 Q22019
Q3 Q4| Q1 Q22020
Exports Imports
0% 10% 20% 30%
China
Germany
India
USA
Italy
UK
Spain
UK
Namibia
Botswana
Mozambique
Zambia
Swaziland
Zimbabwe
Top export destinations' share
Top import sources' share
0%
1%
2%
Q1 Q22016
Q3 Q4| Q1 Q22017
Q3 Q4| Q1 Q22018
Q3 Q4| Q1 Q22019
Q3 Q4| Q1 Q22020
Exports Imports
0 1 2 3
China
Germany
India
USA
Italy
UK
Spain
UK
Namibia
Botswana
Mozambique
Zambia
Swaziland
Zimbabwe
R billion
Top export destinations' value
Top import sources' value

November 2020 IDC – Research and Information – Sectoral Trends 52
(percentage points)
Skill composition of employment trend (formal and informal) (QLFS based) Provincial distribution of employment (formal and informal) (QLFS based)
Quarterly Q2 2020 (cumulative total)
Number (1 000) Number (1 000)
* QES - Q1 2012 to Q1 2015 data compiled from the 2013 Business Sample Frame, Q2 2015 to Q1 2016 compiled from the 2015 Business Sample Frame, Q2 2016 onw ards compiled from
the 2017 Business Sample Frame
** QLFS - Q1 2012 to Q4 2014 data compiled from the 2007 Master Sample, Q1 2015 onw ards compiled from the 2013 Master Sample
Formal employment and remuneration trend (QES based)* Employment composition trend (formal and informal) (QLFS based)**
Quarterly Quarterly
Number (1 000) Gross monthly remuneration per w orker (R '000) Formal employ ment % of total employ ment Youth employ ment % of total employ ment
Production and sales trend Utilisation of production capacity
Quarterly Quarterly
Production index (seasonally adjusted) Value of sales (R billion) Capacity utilisation (%)
Glass & glass productsProduction weight: 0.7
Trend analysis: first half of 2020 y-o-y (except: capacity utilisation, employment and remuneration - Q2 2020 y-o-y)
-13.7% -3.7% -29.4% -19.3%
Production (seas. adj.) Capacity utilisation Employment* Gross monthly remuneration per worker Exports (ZAR) Imports (ZAR)
-20.6% -40.4
1.5
2.0
2.5
3.0
3.5
60
70
80
90
100
110
120
Q1 Q22016
Q3 Q4| Q1 Q22017
Q3 Q4| Q1 Q22018
Q3 Q4| Q1 Q22019
Q3 Q4| Q1 Q22020
Volume of production Value of sales
,15
,17
,19
,21
7.5
8.0
8.5
9.0
9.5
Q1 Q22016
Q3 Q4| Q1 Q22017
Q3 Q4| Q1 Q22018
Q3 Q4| Q1 Q22019
Q3 Q4| Q1 Q22020
Employment Remuneration per worker
15
30
45
60
75
75
85
95
105
Q1 Q22016
Q3 Q4| Q1 Q22017
Q3 Q4| Q1 Q22018
Q3 Q4| Q1 Q22019
Q3 Q4| Q1 Q22020
Formal employemnt Youth employment
0
10
20
30
Q1 Q22016
Q3 Q4| Q1 Q22017
Q3 Q4| Q1 Q22018
Q3 Q4| Q1 Q22019
Q3 Q4| Q1 Q22020
Tertiary education Secondary schooling completed Less than secondary schooling
0
3
6
WesternCape
EasternCape
NorthernCape
FreeState
KwaZulu-Natal
NorthWest
Gauteng Mpuma-langa
Limpopo
Non-youth Youth
40
50
60
70
80
90
100
Q1 Q22016
Q3 Q4| Q1 Q22017
Q3 Q4| Q1 Q22018
Q3 Q4| Q1 Q22019
Q3 Q4| Q1 Q22020
Capacity utilisation

November 2020 IDC – Research and Information – Sectoral Trends 53
Top trading partners (share of exports/imports) Top trading partners (value of export/imports)
First half of 2020 (cumulative total) First half of 2020 (cumulative total)
To
p l
ose
rs
H7010: Glass bottles, flasks, jars, phials, stoppers, etc - 115.28
To
p l
ose
rs
H7013: Glassware for table, kitchen, to ilet, decoration - 110.32
H7013: Glassware for table, kitchen, to ilet, decoration - 18.16 H7009: Glass mirrors, whether or not framed - 36.04
H7019: Glass fibres, glass wool, and articles thereof - 7.49 H7019: Glass fibres, glass wool, and articles thereof - 24.68
H7005: Float glass, surface ground, po lished glass - 78.53 H7005: Float glass, surface ground, po lished glass - 77.59
H7007: Safety glass (toughened, tempered, laminated) - 74.98 H7007: Safety glass (toughened, tempered, laminated) - 39.15
H7015: Glasses for spectacles, clocks, watches, unworked 0.65
H7003: Cast and ro lled glass, sheets and profiles 0.42To
p g
ain
ers
H7018: Glass beads, imitation stones (not jewelery), etc 0.91
To
p g
ain
ers
H7008: M ultiple-walled insulating units o f glass 0.07
H7006: Cast, drawn/float glass sheet, edge worked/ bent 0.74
H7001: Glass cullet, waste or scrap, glass in the mass 0.03
Expo rts T o tal ( including o thers) 744.90 Impo rts T o tal ( including o thers) 1 504.76
H7019: Glass fibres, glass wool, and articles thereof 32.58 H7009: Glass mirrors, whether or not framed 188.82
H7009: Glass mirrors, whether or not framed 20.85 H7005: Float glass, surface ground, po lished glass 84.89
217.14
H7013: Glassware for table, kitchen, to ilet, decoration 48.79 H7019: Glass fibres, glass wool, and articles thereof 192.89
H7003: Cast and ro lled glass, sheets and profiles 9.35 H7020: Articles of glass, nes 63.99
Major traded export products Major traded import products
First half of 2020 (cumulative total) First half of 2020 (cumulative total)
HS4 code: sector description ZAR m HS4 code: sector description ZAR m
To
p e
xpo
rts
H7007: Safety glass (toughened, tempered, laminated) 231.90
To
p i
mp
ort
s
H7013: Glassware for table, kitchen, to ilet, decoration 337.98
H7010: Glass bottles, flasks, jars, phials, stoppers, etc 225.93 H7007: Safety glass (toughened, tempered, laminated) 299.32
H7005: Float glass, surface ground, po lished glass 138.94 H7010: Glass bottles, flasks, jars, phials, stoppers, etc
Trade trends (value terms) Trade trends (% of total exports/imports)
Total per quarter Quarterly
ZAR billion per quarter (current v alues) % share of SA's ov erall merchandise ex ports/imports
Glass & glass products (cont.)Production weight: 0.7
0.0
0.5
1.0
1.5
Q1 Q22016
Q3 Q4| Q1 Q22017
Q3 Q4| Q1 Q22018
Q3 Q4| Q1 Q22019
Q3 Q4| Q1 Q22020
Exports Imports
0% 15% 30% 45%
China
USA
France
Germany
UAE
India
UK
Namibia
Mozambique
Zimbabwe
Belgium
UK
Morocco
Botswana
Top export destinations' share
Top import sources' share
0.1%
0.2%
0.3%
0.4%
Q1 Q22016
Q3 Q4| Q1 Q22017
Q3 Q4| Q1 Q22018
Q3 Q4| Q1 Q22019
Q3 Q4| Q1 Q22020
Exports Imports
0.0 0.2 0.4 0.6 0.8
China
USA
France
Germany
UAE
India
UK
Namibia
Mozambique
Zimbabwe
Belgium
UK
Morocco
Botswana
R billion
Top export destinations' value
Top import sources' value

November 2020 IDC – Research and Information – Sectoral Trends 54
(percentage points)
Skill composition of employment trend (formal and informal) (QLFS based) Provincial distribution of employment (formal and informal) (QLFS based)
Quarterly Q2 2020 (cumulative total)
Number (1 000) Number (1 000)
* QES - Q1 2012 to Q1 2015 data compiled from the 2013 Business Sample Frame, Q2 2015 to Q1 2016 compiled from the 2015 Business Sample Frame, Q2 2016 onw ards compiled from
the 2017 Business Sample Frame
** QLFS - Q1 2012 to Q4 2014 data compiled from the 2007 Master Sample, Q1 2015 onw ards compiled from the 2013 Master Sample
Formal employment and remuneration trend (QES based)* Employment composition trend (formal and informal) (QLFS based)**
Quarterly Quarterly
Number (1 000) Gross monthly remuneration per w orker (R '000) Formal employ ment % of total employ ment Youth employ ment % of total employ ment
Production and sales trend Utilisation of production capacity
Quarterly Quarterly
Production index (seasonally adjusted) Value of sales (R billion) Capacity utilisation (%)
Non-metallic mineral productsProduction weight: 2.5
Trend analysis: first half of 2020 y-o-y (except: capacity utilisation, employment and remuneration - Q2 2020 y-o-y)
-8.3% -13.1% -17.7% -24.7%
Production (seas. adj.) Capacity utilisation Employment* Gross monthly remuneration per worker Exports (ZAR) Imports (ZAR)
-32.4% -33.5
6
8
10
12
14
16
30
40
50
60
70
80
90
100
110
Q1 Q22016
Q3 Q4| Q1 Q22017
Q3 Q4| Q1 Q22018
Q3 Q4| Q1 Q22019
Q3 Q4| Q1 Q22020
Volume of production Value of sales
,12
,14
,16
,18
,20
45
47
49
51
53
Q1 Q22016
Q3 Q4| Q1 Q22017
Q3 Q4| Q1 Q22018
Q3 Q4| Q1 Q22019
Q3 Q4| Q1 Q22020
Employment Remuneration per worker
30
40
50
60
60
70
80
90
Q1 Q22016
Q3 Q4| Q1 Q22017
Q3 Q4| Q1 Q22018
Q3 Q4| Q1 Q22019
Q3 Q4| Q1 Q22020
Formal employemnt Youth employment
0
30
60
90
120
150
Q1 Q22016
Q3 Q4| Q1 Q22017
Q3 Q4| Q1 Q22018
Q3 Q4| Q1 Q22019
Q3 Q4| Q1 Q22020
Tertiary education Secondary schooling completed Less than secondary schooling
0
4
8
12
16
20
24
28
32
WesternCape
EasternCape
NorthernCape
FreeState
KwaZulu-Natal
NorthWest
Gauteng Mpuma-langa
Limpopo
Non-youth Youth
40
50
60
70
80
90
Q1 Q22016
Q3 Q4| Q1 Q22017
Q3 Q4| Q1 Q22018
Q3 Q4| Q1 Q22019
Q3 Q4| Q1 Q22020
Capacity utilisation

November 2020 IDC – Research and Information – Sectoral Trends 55
Top trading partners (share of exports/imports) Top trading partners (value of export/imports)
First half of 2020 (cumulative total) First half of 2020 (cumulative total)
To
p l
ose
rs
H2522: Quicklime,slaked, hydraulic lime for construction - 110.26
To
p l
ose
rs
H6909: Ceramic laboratory, technical, packaging articles - 519.77
H6806: Slag wool, rock wool, insulating minerals - 54.39 H2523: Cement (portland, aluminous, slag or hydraulic) - 153.55
H2715: B ituminous mix, mastic from asphalt, bitumen etc - 51.35 H6902: Refractory brick,block, tile, etc not siliceous-earths - 131.19
H2523: Cement (portland, aluminous, slag or hydraulic) - 74.64 H6907: Unglazed ceramic flags, paving, hearth / wall tiles - 324.11
H6902: Refractory brick,block, tile, etc not siliceous-earths - 57.10 H6806: Slag wool, rock wool, insulating minerals - 188.95
H6815: Articles of stone or o ther mineral substances 3.91
H6903: Refractory ceramic articles not for construction 3.19To
p g
ain
ers
H3816: Refractory cements, mortars, etc except graphite 8.65
To
p g
ain
ers
H6815: Articles of stone or o ther mineral substances 99.89
H6809: Articles of plaster or plaster based compositions 4.58 H2715: B ituminous mix, mastic from asphalt, bitumen etc 0.11
H6909: Ceramic laboratory, technical, packaging articles 2.40
Expo rts T o tal ( including o thers) 2 695.20 Impo rts T o tal ( including o thers) 4 689.21
H3801: Artificial, graphite and preparations 118.40 H2523: Cement (portland, aluminous, slag or hydraulic) 346.87
H6910: Ceramic bathroom,kitchen &other sanitary fixtures 97.92 H6806: Slag wool, rock wool, insulating minerals 238.92
527.92
H6802: Worked monumental,building stone,articles thereof 163.27 H6815: Articles of stone or o ther mineral substances 349.47
H6809: Articles of plaster or plaster based compositions 95.96 H6805: Abrasive clo ths, papers, etc (including sandpaper) 162.75
Major traded export products Major traded import products
First half of 2020 (cumulative total) First half of 2020 (cumulative total)
HS4 code: sector description ZAR m HS4 code: sector description ZAR m
To
p e
xpo
rts
H2523: Cement (portland, aluminous, slag or hydraulic) 643.03
To
p i
mp
ort
s
H6909: Ceramic laboratory, technical, packaging articles 1 115.27
H6909: Ceramic laboratory, technical, packaging articles 503.79 H6907: Unglazed ceramic flags, paving, hearth / wall tiles 568.60
H6907: Unglazed ceramic flags, paving, hearth / wall tiles 258.44 H6902: Refractory brick,block, tile, etc not siliceous-earths
Trade trends (value terms) Trade trends (% of total exports/imports)
Total per quarter Quarterly
ZAR billion per quarter (current v alues) % share of SA's ov erall merchandise ex ports/imports
Non-metallic mineral products (cont.)Production weight: 2.5
0
1
2
3
4
Q1 Q22016
Q3 Q4| Q1 Q22017
Q3 Q4| Q1 Q22018
Q3 Q4| Q1 Q22019
Q3 Q4| Q1 Q22020
Exports Imports
0% 10% 20% 30%
China
USA
Germany
Poland
Japan
Italy
India
Botswana
Swaziland
Zimbabwe
Lesotho
Namibia
Zambia
China
Top export destinations' share
Top import sources' share
0.0%
0.5%
1.0%
1.5%
Q1 Q22016
Q3 Q4| Q1 Q22017
Q3 Q4| Q1 Q22018
Q3 Q4| Q1 Q22019
Q3 Q4| Q1 Q22020
Exports Imports
0.0 0.5 1.0 1.5
China
USA
Germany
Poland
Japan
Italy
India
Botswana
Swaziland
Zimbabwe
Lesotho
Namibia
Zambia
China
R billion
Top export destinations' value
Top import sources' value

November 2020 IDC – Research and Information – Sectoral Trends 56
(percentage points)
Skill composition of employment trend (formal and informal) (QLFS based) Provincial distribution of employment (formal and informal) (QLFS based)
Quarterly Q2 2020 (cumulative total)
Number (1 000) Number (1 000)
* QES - Q1 2012 to Q1 2015 data compiled from the 2013 Business Sample Frame, Q2 2015 to Q1 2016 compiled from the 2015 Business Sample Frame, Q2 2016 onw ards compiled from
the 2017 Business Sample Frame
** QLFS - Q1 2012 to Q4 2014 data compiled from the 2007 Master Sample, Q1 2015 onw ards compiled from the 2013 Master Sample
Formal employment and remuneration trend (QES based)* Employment composition trend (formal and informal) (QLFS based)**
Quarterly Quarterly
Number (1 000) Gross monthly remuneration per w orker (R '000) Formal employ ment % of total employ ment Youth employ ment % of total employ ment
Production and sales trend Utilisation of production capacity
Quarterly Quarterly
Production index (seasonally adjusted) Value of sales (R billion) Capacity utilisation (%)
Basic iron & steel productsProduction weight: 3.6
Trend analysis: first half of 2020 y-o-y (except: capacity utilisation, employment and remuneration - Q2 2020 y-o-y)
-9.9% -13.8% -30.3% -15.9%
Production (seas. adj.) Capacity utilisation Employment* Gross monthly remuneration per worker Exports (ZAR) Imports (ZAR)
-34.2% -36.4
15
20
25
30
35
40
30
45
60
75
90
105
120
135
Q1 Q22016
Q3 Q4| Q1 Q22017
Q3 Q4| Q1 Q22018
Q3 Q4| Q1 Q22019
Q3 Q4| Q1 Q22020
Volume of production Value of sales
,22
,24
,26
,28
,30
,32
24
26
28
30
32
Q1 Q22016
Q3 Q4| Q1 Q22017
Q3 Q4| Q1 Q22018
Q3 Q4| Q1 Q22019
Q3 Q4| Q1 Q22020
Employment Remuneration per worker
10
15
20
25
30
35
40
90
93
96
99
102
Q1 Q22016
Q3 Q4| Q1 Q22017
Q3 Q4| Q1 Q22018
Q3 Q4| Q1 Q22019
Q3 Q4| Q1 Q22020
Formal employemnt Youth employment
0
30
60
90
120
Q1 Q22016
Q3 Q4| Q1 Q22017
Q3 Q4| Q1 Q22018
Q3 Q4| Q1 Q22019
Q3 Q4| Q1 Q22020
Tertiary education Secondary schooling completed Less than secondary schooling
0
15
30
45
WesternCape
EasternCape
NorthernCape
FreeState
KwaZulu-Natal
NorthWest
Gauteng Mpuma-langa
Limpopo
Non-youth Youth
30
40
50
60
70
80
90
Q1 Q22016
Q3 Q4| Q1 Q22017
Q3 Q4| Q1 Q22018
Q3 Q4| Q1 Q22019
Q3 Q4| Q1 Q22020
Capacity utilisation

November 2020 IDC – Research and Information – Sectoral Trends 57
Top trading partners (share of exports/imports) Top trading partners (value of export/imports)
First half of 2020 (cumulative total) First half of 2020 (cumulative total)
To
p l
ose
rs
H7202: Ferro-alloys -5 684.42
To
p l
ose
rs
H7225: Flat-ro lled alloy steel, width >600mm - 363.28
H7207: Semi-finished products of iron or non-alloy steel - 756.91 H7202: Ferro-alloys - 84.18
H7201: P ig iron and spiegeleisen in primary forms - 689.65 H7304: Tube/ ho llow profile, seamless iron/steel not cast - 73.41
H7208: Hot-ro lled products, iron/steel, width>600mm, etc -1 721.78 H7307: P ipe fittings, o f iron or steel - 214.18
H7219: Rolled stainless steel sheet, width > 600mm -1 209.95 H7210: Flat-ro lled iron/steel, >600mm, clad, plated/ coated - 202.07
H7224: A lloy steel in ingots in primary form/ semi-finished 2.41 H7303: Tubes, pipes and hollow profiles, o f cast iron 11.20
H7206: Iron and non-alloy steel in primary forms, ingots 0.76 H7206: Iron and non-alloy steel in primary forms, ingots 3.28To
p g
ain
ers
H7302: Railway & tramway track material o f iron or steel 35.59
To
p g
ain
ers
H7302: Railway & tramway track material o f iron or steel 38.28
H7223: Wire of stainless steel 3.30 H7305: P ipe, welded iron/steel, diameter > 406.4mm 11.88
H7218: Stainless steel in primary forms, semi-finish prodts 2.36
Expo rts T o tal ( including o thers) 30 940.42 Impo rts T o tal ( including o thers) 7 519.57
H7208: Hot-ro lled products, iron/steel, width>600mm, etc 646.00 H7306: Tube, pipe of iron/steel, not seamless > 406.4mm 490.81
H7207: Semi-finished products of iron or non-alloy steel 639.06 H7208: Hot-ro lled products, iron/steel, width>600mm, etc 474.30
783.00
H7201: P ig iron and spiegeleisen in primary forms 753.96 H7307: P ipe fittings, o f iron or steel 590.94
H7214: Iron/steel bar, forged hot-ro lled drawn, extruded 571.09 H7219: Rolled stainless steel sheet, width > 600mm 394.28
Major traded export products Major traded import products
First half of 2020 (cumulative total) First half of 2020 (cumulative total)
HS4 code: sector description ZAR m HS4 code: sector description ZAR m
To
p e
xpo
rts
H7202: Ferro-alloys 20 725.80
To
p i
mp
ort
s
H7210: Flat-ro lled iron/steel, >600mm, clad, plated/ coated 1 653.01
H7219: Rolled stainless steel sheet, width > 600mm 3 453.94 H7202: Ferro-alloys 1 113.38
H7210: Flat-ro lled iron/steel, >600mm, clad, plated/ coated 1 131.85 H7225: Flat-ro lled alloy steel, width >600mm
Trade trends (value terms) Trade trends (% of total exports/imports)
Total per quarter Quarterly
ZAR billion per quarter (current v alues) % share of SA's ov erall merchandise ex ports/imports
Basic iron & steel products (cont.)Production weight: 3.6
0
5
10
15
20
25
30
Q1 Q22016
Q3 Q4| Q1 Q22017
Q3 Q4| Q1 Q22018
Q3 Q4| Q1 Q22019
Q3 Q4| Q1 Q22020
Exports Imports
0% 10% 20% 30% 40%
China
Germany
Brazil
Japan
Russia
Taiwan
New Caledonia
China
UAE
USA
Indonesia
Mozambique
Netherlands
Italy
Top export destinations' share
Top import sources' share
0%
2%
4%
6%
8%
10%
Q1 Q22016
Q3 Q4| Q1 Q22017
Q3 Q4| Q1 Q22018
Q3 Q4| Q1 Q22019
Q3 Q4| Q1 Q22020
Exports Imports
0 2 4 6 8
China
Germany
Brazil
Japan
Russia
Taiwan
New Caledonia
China
UAE
USA
Indonesia
Mozambique
Netherlands
Italy
R billion
Top export destinations' value
Top import sources' value

November 2020 IDC – Research and Information – Sectoral Trends 58
(percentage points)
Skill composition of employment trend (formal and informal) (QLFS based) Provincial distribution of employment (formal and informal) (QLFS based)
Quarterly Q2 2020 (cumulative total)
Number (1 000) Number (1 000)
* QES - Q1 2012 to Q1 2015 data compiled from the 2013 Business Sample Frame, Q2 2015 to Q1 2016 compiled from the 2015 Business Sample Frame, Q2 2016 onw ards compiled from
the 2017 Business Sample Frame
** QLFS - Q1 2012 to Q4 2014 data compiled from the 2007 Master Sample, Q1 2015 onw ards compiled from the 2013 Master Sample
Formal employment and remuneration trend (QES based)* Employment composition trend (formal and informal) (QLFS based)**
Quarterly Quarterly
Number (1 000) Gross monthly remuneration per w orker (R '000) Formal employ ment % of total employ ment Youth employ ment % of total employ ment
Production and sales trend Utilisation of production capacity
Quarterly Quarterly
Production index (seasonally adjusted) Value of sales (R billion) Capacity utilisation (%)
Basic non-ferrous metal productsProduction weight: 2.6
Trend analysis: first half of 2020 y-o-y (except: capacity utilisation, employment and remuneration - Q2 2020 y-o-y)
-14.8% 4.1% 2.2% -19.5%
Production (seas. adj.) Capacity utilisation Employment* Gross monthly remuneration per worker Exports (ZAR) Imports (ZAR)
-15.4% -25.3
25
30
35
40
45
50
80
90
100
110
120
Q1 Q22016
Q3 Q4| Q1 Q22017
Q3 Q4| Q1 Q22018
Q3 Q4| Q1 Q22019
Q3 Q4| Q1 Q22020
Volume of production Value of sales
,22
,24
,26
,28
,30
,32
,34
,36
12
14
16
18
20
22
Q1 Q22016
Q3 Q4| Q1 Q22017
Q3 Q4| Q1 Q22018
Q3 Q4| Q1 Q22019
Q3 Q4| Q1 Q22020
Employment Remuneration per worker
10
25
40
55
70
70
80
90
100
110
Q1 Q22016
Q3 Q4| Q1 Q22017
Q3 Q4| Q1 Q22018
Q3 Q4| Q1 Q22019
Q3 Q4| Q1 Q22020
Formal employemnt Youth employment
0
8
16
24
32
Q1 Q22016
Q3 Q4| Q1 Q22017
Q3 Q4| Q1 Q22018
Q3 Q4| Q1 Q22019
Q3 Q4| Q1 Q22020
Tertiary education Secondary schooling completed Less than secondary schooling
0
2
4
6
WesternCape
EasternCape
NorthernCape
FreeState
KwaZulu-Natal
NorthWest
Gauteng Mpuma-langa
Limpopo
Non-youth Youth
50
60
70
80
90
Q1 Q22016
Q3 Q4| Q1 Q22017
Q3 Q4| Q1 Q22018
Q3 Q4| Q1 Q22019
Q3 Q4| Q1 Q22020
Capacity utilisation

November 2020 IDC – Research and Information – Sectoral Trends 59
Top trading partners (share of exports/imports) Top trading partners (value of export/imports)
First half of 2020 (cumulative total) First half of 2020 (cumulative total)
To
p l
ose
rs
H8111: M anganese, articles thereof, waste or scrap - 754.11
To
p l
ose
rs
H2818: A luminium oxide, hydroxide & artificial corundum -1 023.04
H7608: A luminium tubes and pipes - 229.57 H7601: Unwrought aluminium - 244.31
H7411: Copper pipes, tubes - 117.71 H7606: A luminium plates, sheets&strip, thickness> 0.2 mm - 88.38
H7606: A luminium plates, sheets&strip, thickness> 0.2 mm - 554.08 H7408: Copper wire - 976.69
H7402: Unrefined copper, copper anodes, etc - 312.39 H7901: Unwrought zinc - 386.21
H7401: Copper mattes/cement (precipitated copper) 73.76 H7603: A luminium powders and flakes 28.67
H7405: M aster alloys of copper 42.48 H7106: Silver, unwrought or semi-manufactured, etc 22.21To
p g
ain
ers
H7601: Unwrought aluminium 1 697.15
To
p g
ain
ers
H7403: Refined copper and copper alloys, unwrought 191.04
H7502: Unwrought nickel 869.41 H7409: Copper plates, sheets &strips, thickness> 0.15mm 170.21
H7407: Copper bars, rods and profiles 42.20 H7507: Nickel tubes, pipes and tube or pipe fittings 18.63
Expo rts T o tal ( including o thers) 17 890.91 Impo rts T o tal ( including o thers) 11 290.98
H7403: Refined copper and copper alloys, unwrought 960.64 H7403: Refined copper and copper alloys, unwrought 751.43
H8111: M anganese, articles thereof, waste or scrap 453.91 H7604: A luminium bars, rods and profiles 595.76
1 296.86
H7402: Unrefined copper, copper anodes, etc 1 701.26 H7901: Unwrought zinc 782.98
H7608: A luminium tubes and pipes 386.09 H7601: Unwrought aluminium 419.57
Major traded export products Major traded import products
First half of 2020 (cumulative total) First half of 2020 (cumulative total)
HS4 code: sector description ZAR m HS4 code: sector description ZAR m
To
p e
xpo
rts
H7601: Unwrought aluminium 8 434.01
To
p i
mp
ort
s
H2818: A luminium oxide, hydroxide & artificial corundum 3 108.37
H7502: Unwrought nickel 2 289.03 H7408: Copper wire 2 084.39
H7606: A luminium plates, sheets&strip, thickness> 0.2 mm 2 272.65 H7606: A luminium plates, sheets&strip, thickness> 0.2 mm
Trade trends (value terms) Trade trends (% of total exports/imports)
Total per quarter Quarterly
ZAR billion per quarter (current v alues) % share of SA's ov erall merchandise ex ports/imports
Basic non-ferrous metal products (cont.)Production weight: 2.6
4
7
10
13
Q1 Q22016
Q3 Q4| Q1 Q22017
Q3 Q4| Q1 Q22018
Q3 Q4| Q1 Q22019
Q3 Q4| Q1 Q22020
Exports Imports
0% 10% 20% 30%
Australia
China
Russia
Zambia
Brazil
UAE
Belgium
Netherlands
China
USA
Japan
UK
Thailand
Singapore
Top export destinations' share
Top import sources' share
1%
2%
3%
4%
Q1 Q22016
Q3 Q4| Q1 Q22017
Q3 Q4| Q1 Q22018
Q3 Q4| Q1 Q22019
Q3 Q4| Q1 Q22020
Exports Imports
0 1 2 3 4
Australia
China
Russia
Zambia
Brazil
UAE
Belgium
Netherlands
China
USA
Japan
UK
Thailand
Singapore
R billion
Top export destinations' value
Top import sources' value

November 2020 IDC – Research and Information – Sectoral Trends 60
(percentage points)
Skill composition of employment trend (formal and informal) (QLFS based) Provincial distribution of employment (formal and informal) (QLFS based)
Quarterly Q2 2020 (cumulative total)
Number (1 000) Number (1 000)
* QES - Q1 2012 to Q1 2015 data compiled from the 2013 Business Sample Frame, Q2 2015 to Q1 2016 compiled from the 2015 Business Sample Frame, Q2 2016 onw ards compiled from
the 2017 Business Sample Frame
** QLFS - Q1 2012 to Q4 2014 data compiled from the 2007 Master Sample, Q1 2015 onw ards compiled from the 2013 Master Sample
Formal employment and remuneration trend (QES based)* Employment composition trend (formal and informal) (QLFS based)**
Quarterly Quarterly
Number (1 000) Gross monthly remuneration per w orker (R '000) Formal employ ment % of total employ ment Youth employ ment % of total employ ment
Production and sales trend Utilisation of production capacity
Quarterly Quarterly
Production index (seasonally adjusted) Value of sales (R billion) Capacity utilisation (%)
Metal products (excl machinery)Production weight: 5.8
Trend analysis: first half of 2020 y-o-y (except: capacity utilisation, employment and remuneration - Q2 2020 y-o-y)
-9.5% -24.1% -27.0% -6.7%
Production (seas. adj.) Capacity utilisation Employment* Gross monthly remuneration per worker Exports (ZAR) Imports (ZAR)
-24.1% -29.9
8
10
12
14
16
18
50
60
70
80
90
100
110
Q1 Q22016
Q3 Q4| Q1 Q22017
Q3 Q4| Q1 Q22018
Q3 Q4| Q1 Q22019
Q3 Q4| Q1 Q22020
Volume of production Value of sales
,12
,14
,16
,18
,20
,22
95
100
105
110
115
Q1 Q22016
Q3 Q4| Q1 Q22017
Q3 Q4| Q1 Q22018
Q3 Q4| Q1 Q22019
Q3 Q4| Q1 Q22020
Employment Remuneration per worker
30
33
36
39
42
45
48
60
65
70
75
80
85
Q1 Q22016
Q3 Q4| Q1 Q22017
Q3 Q4| Q1 Q22018
Q3 Q4| Q1 Q22019
Q3 Q4| Q1 Q22020
Formal employemnt Youth employment
0
30
60
90
120
150
180
210
Q1 Q22016
Q3 Q4| Q1 Q22017
Q3 Q4| Q1 Q22018
Q3 Q4| Q1 Q22019
Q3 Q4| Q1 Q22020
Tertiary education Secondary schooling completed Less than secondary schooling
0
15
30
45
WesternCape
EasternCape
NorthernCape
FreeState
KwaZulu-Natal
NorthWest
Gauteng Mpuma-langa
Limpopo
Non-youth Youth
40
50
60
70
80
Q1 Q22016
Q3 Q4| Q1 Q22017
Q3 Q4| Q1 Q22018
Q3 Q4| Q1 Q22019
Q3 Q4| Q1 Q22020
Capacity utilisation

November 2020 IDC – Research and Information – Sectoral Trends 61
Top trading partners (share of exports/imports) Top trading partners (value of export/imports)
First half of 2020 (cumulative total) First half of 2020 (cumulative total)
To
p l
ose
rs
H7326: Articles of iron or steel nes - 794.07
To
p l
ose
rs
H7318: Screws, bo lts, nuts, rivets, etc, iron or steel - 191.38
H7612: A luminium casks, drums, etc capacity <300l - 124.67 H8301: Padlocks, locks, clasps with locks, keys - 95.24
H7610: A luminium structures, parts nes, for construction - 76.01 H7323: Table, kitchen, household items of iron or steel - 92.75
H8207: Interchangeable too ls & dies for hand/power too ls - 564.54 H8302: Base metal fittings for furniture, doors, cars, etc - 157.57
H7308: Structures, parts o f structures of iron or steel - 207.87 H7325: Cast articles, o f iron or steel nes - 131.38
H7314: Iron/ steel clo th, grill, fencing and expanded metal 20.05 H7309: Reservoirs, tanks, vats, etc, iron/ steel cap >300l 46.31
H8209: Tool plates, etc, sintered metal carbide, cermet 4.81 H7311: Containers for compressed gas (iron/steel) 43.29To
p g
ain
ers
H7313: Wire for fencing, including barbed wire 58.58
To
p g
ain
ers
H8207: Interchangeable too ls & dies for hand/power too ls 510.93
H7325: Cast articles, o f iron or steel nes 21.47 H8404: Auxiliary plant for bo ilers 67.83
H7324: Sanitary ware and parts thereof, o f iron or steel 4.12 H8202: Hand saws and blades for saws of all kinds 10.61
Expo rts T o tal ( including o thers) 6 328.93 Impo rts T o tal ( including o thers) 9 679.08
H7314: Iron/ steel clo th, grill, fencing and expanded metal 467.30 H7312: Stranded steel wire, etc, without electric insulation 360.74
H7612: A luminium casks, drums, etc capacity <300l 364.40 H8301: Padlocks, locks, clasps with locks, keys 355.93
937.12
H7318: Screws, bo lts, nuts, rivets, etc, iron or steel 535.72 H8302: Base metal fittings for furniture, doors, cars, etc 710.98
H8302: Base metal fittings for furniture, doors, cars, etc 198.12 H8309: Stoppers, caps, lids, etc o f base metal 325.67
Major traded export products Major traded import products
First half of 2020 (cumulative total) First half of 2020 (cumulative total)
HS4 code: sector description ZAR m HS4 code: sector description ZAR m
To
p e
xpo
rts
H7326: Articles of iron or steel nes 1 228.19
To
p i
mp
ort
s
H8207: Interchangeable too ls & dies for hand/power too ls 1 491.16
H8207: Interchangeable too ls & dies for hand/power too ls 570.09 H7318: Screws, bo lts, nuts, rivets, etc, iron or steel 1 105.04
H7308: Structures, parts o f structures of iron or steel 557.26 H7326: Articles of iron or steel nes
Trade trends (value terms) Trade trends (% of total exports/imports)
Total per quarter Quarterly
ZAR billion per quarter (current v alues) % share of SA's ov erall merchandise ex ports/imports
Metal products (excl machinery) (cont.)Production weight: 5.8
2
3
4
5
6
7
Q1 Q22016
Q3 Q4| Q1 Q22017
Q3 Q4| Q1 Q22018
Q3 Q4| Q1 Q22019
Q3 Q4| Q1 Q22020
Exports Imports
0% 10% 20% 30% 40%
China
Germany
India
USA
Italy
Thailand
Taiwan
Namibia
Zimbabwe
Botswana
Mozambique
Zambia
Japan
DRC
Top export destinations' share
Top import sources' share
1.0%
1.5%
2.0%
2.5%
3.0%
Q1 Q22016
Q3 Q4| Q1 Q22017
Q3 Q4| Q1 Q22018
Q3 Q4| Q1 Q22019
Q3 Q4| Q1 Q22020
Exports Imports
0 1 2 3 4
China
Germany
India
USA
Italy
Thailand
Taiwan
Namibia
Zimbabwe
Botswana
Mozambique
Zambia
Japan
DRC
R billion
Top export destinations' value
Top import sources' value
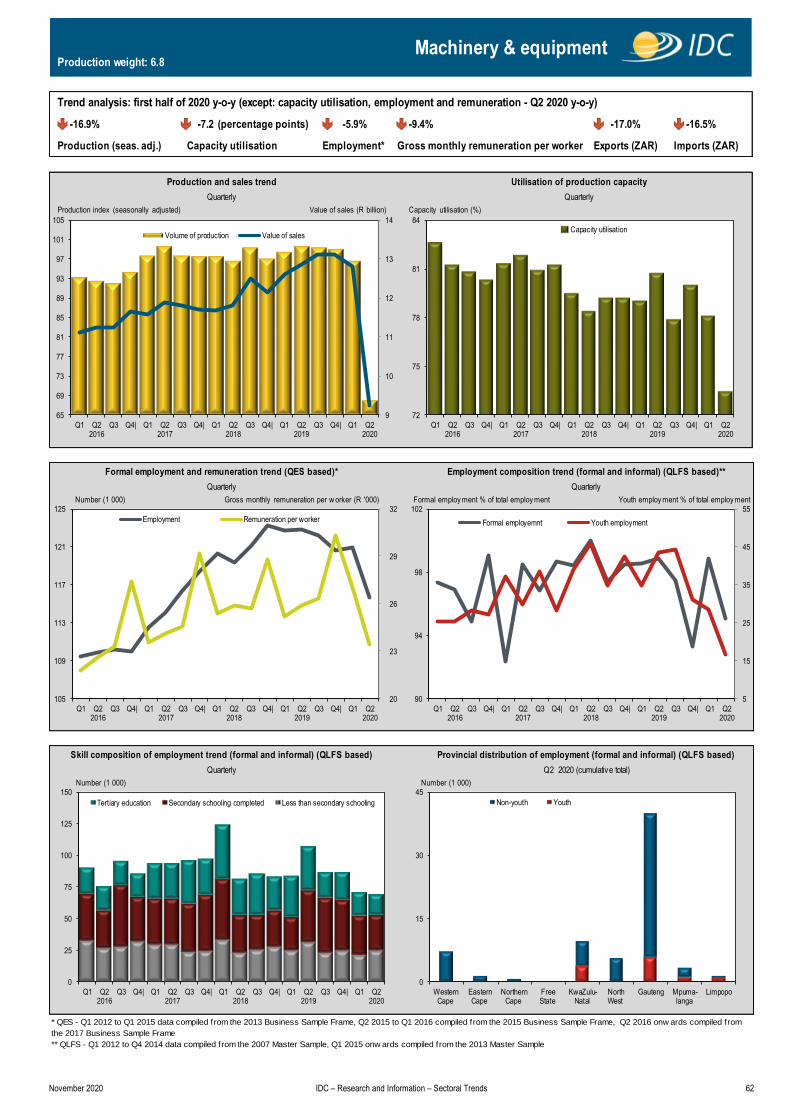
November 2020 IDC – Research and Information – Sectoral Trends 62
(percentage points)
Skill composition of employment trend (formal and informal) (QLFS based) Provincial distribution of employment (formal and informal) (QLFS based)
Quarterly Q2 2020 (cumulative total)
Number (1 000) Number (1 000)
* QES - Q1 2012 to Q1 2015 data compiled from the 2013 Business Sample Frame, Q2 2015 to Q1 2016 compiled from the 2015 Business Sample Frame, Q2 2016 onw ards compiled from
the 2017 Business Sample Frame
** QLFS - Q1 2012 to Q4 2014 data compiled from the 2007 Master Sample, Q1 2015 onw ards compiled from the 2013 Master Sample
Formal employment and remuneration trend (QES based)* Employment composition trend (formal and informal) (QLFS based)**
Quarterly Quarterly
Number (1 000) Gross monthly remuneration per w orker (R '000) Formal employ ment % of total employ ment Youth employ ment % of total employ ment
Production and sales trend Utilisation of production capacity
Quarterly Quarterly
Production index (seasonally adjusted) Value of sales (R billion) Capacity utilisation (%)
Machinery & equipmentProduction weight: 6.8
Trend analysis: first half of 2020 y-o-y (except: capacity utilisation, employment and remuneration - Q2 2020 y-o-y)
-5.9% -9.4% -17.0% -16.5%
Production (seas. adj.) Capacity utilisation Employment* Gross monthly remuneration per worker Exports (ZAR) Imports (ZAR)
-16.9% -7.2
9
10
11
12
13
14
65
69
73
77
81
85
89
93
97
101
105
Q1 Q22016
Q3 Q4| Q1 Q22017
Q3 Q4| Q1 Q22018
Q3 Q4| Q1 Q22019
Q3 Q4| Q1 Q22020
Volume of production Value of sales
20
23
26
29
32
105
109
113
117
121
125
Q1 Q22016
Q3 Q4| Q1 Q22017
Q3 Q4| Q1 Q22018
Q3 Q4| Q1 Q22019
Q3 Q4| Q1 Q22020
Employment Remuneration per worker
5
15
25
35
45
55
90
94
98
102
Q1 Q22016
Q3 Q4| Q1 Q22017
Q3 Q4| Q1 Q22018
Q3 Q4| Q1 Q22019
Q3 Q4| Q1 Q22020
Formal employemnt Youth employment
0
25
50
75
100
125
150
Q1 Q22016
Q3 Q4| Q1 Q22017
Q3 Q4| Q1 Q22018
Q3 Q4| Q1 Q22019
Q3 Q4| Q1 Q22020
Tertiary education Secondary schooling completed Less than secondary schooling
0
15
30
45
WesternCape
EasternCape
NorthernCape
FreeState
KwaZulu-Natal
NorthWest
Gauteng Mpuma-langa
Limpopo
Non-youth Youth
72
75
78
81
84
Q1 Q22016
Q3 Q4| Q1 Q22017
Q3 Q4| Q1 Q22018
Q3 Q4| Q1 Q22019
Q3 Q4| Q1 Q22020
Capacity utilisation

November 2020 IDC – Research and Information – Sectoral Trends 63
Top trading partners (share of exports/imports) Top trading partners (value of export/imports)
First half of 2020 (cumulative total) First half of 2020 (cumulative total)
To
p l
ose
rs
H8471: Automatic data processing machines (computers) - 415.23
To
p l
ose
rs
H8471: Automatic data processing machines (computers) -3 792.14
H8431: Parts for use with lifting, moving machinery - 334.53 H8443: Printing and ancillary machinery - 673.41
H8418: Refrigerators, freezers and heat pumps - 272.89 H8431: Parts for use with lifting, moving machinery - 472.10
H8413: Pumps for liquids - 378.10 H8429: Self-propeled earth moving, road making machines -1 179.09
H8474: M achinery to sort, screen, etc mineral products - 345.39 H8701: Tractors (besides works, warehouse equipment) - 929.03
H8480: M oulds for metals (except ingot), plastic, etc 39.26 H8480: M oulds for metals (except ingot), plastic, etc 294.30
H8411: Turbo-jets/-propellers/other gas turbine engines 31.99 H8441: M achinery for paper pulp & paperboard making 273.03To
p g
ain
ers
H8443: Printing and ancillary machinery 187.03
To
p g
ain
ers
H8428: Lifting, handling, loading machinery 301.27
H8425: Pulley tackle, ho ists, winches, capstans and jacks 46.00 H8426: Derricks, cranes, straddle carriers, crane trucks 299.05
H8441: M achinery for paper pulp & paperboard making 29.62 H8470: Calculators, cash registers, ticket-machines, etc 154.51
Expo rts T o tal ( including o thers) 20 811.12 Impo rts T o tal ( including o thers) 61 059.79
H8483: Shafts, cranks, gears, clutches, flywheel, pulleys, etc 1 089.00 H8481: Taps, cocks, valves for pipes, tanks, bo ilers, etc 2 531.79
H8429: Self-propeled earth moving, road making machines 1 028.60 H8413: Pumps for liquids 2 472.63
3 726.84
H8421: Liquid, gas centrifuges, filtering, purifying machine 1 265.91 H8431: Parts for use with lifting, moving machinery 3 615.25
H8443: Printing and ancillary machinery 938.73 H8483: Shafts, cranks, gears, clutches, flywheel, pulleys, etc 2 197.91
Major traded export products Major traded import products
First half of 2020 (cumulative total) First half of 2020 (cumulative total)
HS4 code: sector description ZAR m HS4 code: sector description ZAR m
To
p e
xpo
rts
H8431: Parts for use with lifting, moving machinery 2 177.76
To
p i
mp
ort
s
H8471: Automatic data processing machines (computers) 5 214.16
H8474: M achinery to sort, screen, etc mineral products 2 070.87 H8443: Printing and ancillary machinery 3 746.96
H8413: Pumps for liquids 1 876.46 H8429: Self-propeled earth moving, road making machines
Trade trends (value terms) Trade trends (% of total exports/imports)
Total per quarter Quarterly
ZAR billion per quarter (current v alues) % share of SA's ov erall merchandise ex ports/imports
Machinery & equipment (cont.)Production weight: 6.8
5
15
25
35
45
55
Q1 Q22016
Q3 Q4| Q1 Q22017
Q3 Q4| Q1 Q22018
Q3 Q4| Q1 Q22019
Q3 Q4| Q1 Q22020
Exports Imports
0% 10% 20% 30%
China
Germany
USA
Italy
Japan
UK
India
Namibia
Zambia
Zimbabwe
Mozambique
Botswana
DRC
USA
Top export destinations' share
Top import sources' share
2%
6%
10%
14%
18%
Q1 Q22016
Q3 Q4| Q1 Q22017
Q3 Q4| Q1 Q22018
Q3 Q4| Q1 Q22019
Q3 Q4| Q1 Q22020
Exports Imports
0 5 10 15 20
China
Germany
USA
Italy
Japan
UK
India
Namibia
Zambia
Zimbabwe
Mozambique
Botswana
DRC
USA
R billion
Top export destinations' value
Top import sources' value

November 2020 IDC – Research and Information – Sectoral Trends 64
(percentage points)
Skill composition of employment trend (formal and informal) (QLFS based) Provincial distribution of employment (formal and informal) (QLFS based)
Quarterly Q2 2020 (cumulative total)
Number (1 000) Number (1 000)
* QES - Q1 2012 to Q1 2015 data compiled from the 2013 Business Sample Frame, Q2 2015 to Q1 2016 compiled from the 2015 Business Sample Frame, Q2 2016 onw ards compiled from
the 2017 Business Sample Frame
** QLFS - Q1 2012 to Q4 2014 data compiled from the 2007 Master Sample, Q1 2015 onw ards compiled from the 2013 Master Sample
Formal employment and remuneration trend (QES based)* Employment composition trend (formal and informal) (QLFS based)**
Quarterly Quarterly
Number (1 000) Gross monthly remuneration per w orker (R '000) Formal employ ment % of total employ ment Youth employ ment % of total employ ment
Production and sales trend Utilisation of production capacity
Quarterly Quarterly
Production index (seasonally adjusted) Value of sales (R billion) Capacity utilisation (%)
Electrical machinery & equipmentProduction weight: 1.6
Trend analysis: first half of 2020 y-o-y (except: capacity utilisation, employment and remuneration - Q2 2020 y-o-y)
-13.3% -23.9% -19.4% -7.3%
Production (seas. adj.) Capacity utilisation Employment* Gross monthly remuneration per worker Exports (ZAR) Imports (ZAR)
-26.5% -24.7
8
10
12
14
16
18
40
50
60
70
80
90
100
110
Q1 Q22016
Q3 Q4| Q1 Q22017
Q3 Q4| Q1 Q22018
Q3 Q4| Q1 Q22019
Q3 Q4| Q1 Q22020
Volume of production Value of sales
16
18
20
22
24
26
28
35
38
41
44
47
Q1 Q22016
Q3 Q4| Q1 Q22017
Q3 Q4| Q1 Q22018
Q3 Q4| Q1 Q22019
Q3 Q4| Q1 Q22020
Employment Remuneration per worker
10
20
30
40
50
60
85
90
95
100
105
Q1 Q22016
Q3 Q4| Q1 Q22017
Q3 Q4| Q1 Q22018
Q3 Q4| Q1 Q22019
Q3 Q4| Q1 Q22020
Formal employemnt Youth employment
0
10
20
30
40
50
Q1 Q22016
Q3 Q4| Q1 Q22017
Q3 Q4| Q1 Q22018
Q3 Q4| Q1 Q22019
Q3 Q4| Q1 Q22020
Tertiary education Secondary schooling completed Less than secondary schooling
0
2
4
6
8
10
12
14
16
18
WesternCape
EasternCape
NorthernCape
FreeState
KwaZulu-Natal
NorthWest
Gauteng Mpuma-langa
Limpopo
Non-youth Youth
50
60
70
80
90
Q1 Q22016
Q3 Q4| Q1 Q22017
Q3 Q4| Q1 Q22018
Q3 Q4| Q1 Q22019
Q3 Q4| Q1 Q22020
Capacity utilisation

November 2020 IDC – Research and Information – Sectoral Trends 65
Top trading partners (share of exports/imports) Top trading partners (value of export/imports)
First half of 2020 (cumulative total) First half of 2020 (cumulative total)
To
p l
ose
rs
H8504: Electric transformers,static converters & rectifiers - 207.83
To
p l
ose
rs
H8544: Insulated wire and cable, optical fibre cable - 917.48
H8531: Electric sound or visual signal equipment nes - 143.80 H8537: Electrical power, etc, contro l & distribution boards - 401.56
H8536: Electrical switches, connectors, etc, for < 1kV - 139.59 H8536: Electrical switches, connectors, etc, for < 1kV - 288.06
H8544: Insulated wire and cable, optical fibre cable - 191.62 H8504: Electric transformers,static converters & rectifiers - 576.47
H8543: Electrical machinery and apparatus - 191.15 H8545: Carbon electrodes, brushes and electrical items - 552.64
H8545: Carbon electrodes, brushes and electrical items 6.92 H8530: Electrical signalling and traffic contro l equipment 8.07
H8502: Electric generating sets and rotary converters 6.75 H8505: Electro & equipment using magnets 7.89To
p g
ain
ers
H8530: Electrical signalling and traffic contro l equipment 15.77
To
p g
ain
ers
H8502: Electric generating sets and rotary converters 1 772.93
H8505: Electro & equipment using magnets 8.77 H8507: Electric accumulators 481.49
H8547: Insulating fittings for electrical equipment 5.13
Expo rts T o tal ( including o thers) 5 379.86 Impo rts T o tal ( including o thers) 21 630.17
H8501: Electric motors and generators, except generating sets 313.54 H8536: Electrical switches, connectors, etc, for < 1kV 2 074.55
H8538: Parts for electrical switches, protectors, etc 280.15 H8501: Electric motors and generators, except generating sets 1 510.43
2 316.22
H8504: Electric transformers,static converters & rectifiers 495.75 H8544: Insulated wire and cable, optical fibre cable 2 130.72
H9405: Lamps and lighting fittings, illuminated signs, etc 260.92 H8537: Electrical power, etc, contro l & distribution boards 1 039.34
Major traded export products Major traded import products
First half of 2020 (cumulative total) First half of 2020 (cumulative total)
HS4 code: sector description ZAR m HS4 code: sector description ZAR m
To
p e
xpo
rts
H8544: Insulated wire and cable, optical fibre cable 1 086.83
To
p i
mp
ort
s
H8502: Electric generating sets and rotary converters 3 733.47
H8536: Electrical switches, connectors, etc, for < 1kV 674.30 H8504: Electric transformers,static converters & rectifiers 2 754.98
H8537: Electrical power, etc, contro l & distribution boards 531.31 H8507: Electric accumulators
Trade trends (value terms) Trade trends (% of total exports/imports)
Total per quarter Quarterly
ZAR billion per quarter (current v alues) % share of SA's ov erall merchandise ex ports/imports
Electrical machinery & equipment (cont.)Production weight: 1.6
0
4
8
12
16
Q1 Q22016
Q3 Q4| Q1 Q22017
Q3 Q4| Q1 Q22018
Q3 Q4| Q1 Q22019
Q3 Q4| Q1 Q22020
Exports Imports
0% 10% 20% 30% 40%
China
Spain
Germany
India
USA
Italy
Botswana
Botswana
Namibia
Zimbabwe
Mozambique
Zambia
Lesotho
DRC
Top export destinations' share
Top import sources' share
0%
2%
4%
6%
Q1 Q22016
Q3 Q4| Q1 Q22017
Q3 Q4| Q1 Q22018
Q3 Q4| Q1 Q22019
Q3 Q4| Q1 Q22020
Exports Imports
0 2 4 6 8 10
China
Spain
Germany
India
USA
Italy
Botswana
Botswana
Namibia
Zimbabwe
Mozambique
Zambia
Lesotho
DRC
R billion
Top export destinations' value
Top import sources' value

November 2020 IDC – Research and Information – Sectoral Trends 66
(percentage points)
Skill composition of employment trend (formal and informal) (QLFS based) Provincial distribution of employment (formal and informal) (QLFS based)
Quarterly Q2 2020 (cumulative total)
Number (1 000) Number (1 000)
* QES - Q1 2012 to Q1 2015 data compiled from the 2013 Business Sample Frame, Q2 2015 to Q1 2016 compiled from the 2015 Business Sample Frame, Q2 2016 onw ards compiled from
the 2017 Business Sample Frame
** QLFS - Q1 2012 to Q4 2014 data compiled from the 2007 Master Sample, Q1 2015 onw ards compiled from the 2013 Master Sample
Formal employment and remuneration trend (QES based)* Employment composition trend (formal and informal) (QLFS based)**
Quarterly Quarterly
Number (1 000) Gross monthly remuneration per w orker (R '000) Formal employ ment % of total employ ment Youth employ ment % of total employ ment
Production and sales trend Utilisation of production capacity
Quarterly Quarterly
Production index (seasonally adjusted) Value of sales (R billion) Capacity utilisation (%)
Television, radio & communication equipmentProduction weight: 0.9
Trend analysis: first half of 2020 y-o-y (except: capacity utilisation, employment and remuneration - Q2 2020 y-o-y)
-7.8% -10.5% -2.6% -24.4%
Production (seas. adj.) Capacity utilisation Employment* Gross monthly remuneration per worker Exports (ZAR) Imports (ZAR)
-24.7% -4.2
1
2
3
4
50
65
80
95
110
125
Q1 Q22016
Q3 Q4| Q1 Q22017
Q3 Q4| Q1 Q22018
Q3 Q4| Q1 Q22019
Q3 Q4| Q1 Q22020
Volume of production Value of sales
,17
,20
,23
,26
,29
5
6
7
8
Q1 Q22016
Q3 Q4| Q1 Q22017
Q3 Q4| Q1 Q22018
Q3 Q4| Q1 Q22019
Q3 Q4| Q1 Q22020
Employment Remuneration per worker
0
20
40
60
80
70
80
90
100
110
Q1 Q22016
Q3 Q4| Q1 Q22017
Q3 Q4| Q1 Q22018
Q3 Q4| Q1 Q22019
Q3 Q4| Q1 Q22020
Formal employemnt Youth employment
0
3
6
9
12
15
18
Q1 Q22016
Q3 Q4| Q1 Q22017
Q3 Q4| Q1 Q22018
Q3 Q4| Q1 Q22019
Q3 Q4| Q1 Q22020
Tertiary education Secondary schooling completed Less than secondary schooling
0
1
2
3
4
5
6
7
8
WesternCape
EasternCape
NorthernCape
FreeState
KwaZulu-Natal
NorthWest
Gauteng Mpuma-langa
Limpopo
Non-youth Youth
75
79
83
87
Q1 Q22016
Q3 Q4| Q1 Q22017
Q3 Q4| Q1 Q22018
Q3 Q4| Q1 Q22019
Q3 Q4| Q1 Q22020
Capacity utilisation

November 2020 IDC – Research and Information – Sectoral Trends 67
Top trading partners (share of exports/imports) Top trading partners (value of export/imports)
First half of 2020 (cumulative total) First half of 2020 (cumulative total)
To
p l
ose
rs
H8528: Television receivers, video monitors, pro jectors - 243.49
To
p l
ose
rs
H8517: Electric apparatus for line telephony, telegraphy -4 952.95
H8542: Electronic integrated circuits and microassemblies - 41.68 H8528: Television receivers, video monitors, pro jectors - 285.94
H8518: Audio-electronic equipment non-recording devices - 41.06 H8518: Audio-electronic equipment non-recording devices - 159.67
H8534: Electronic printed circuits - 68.12 H8541: Diodes, transistors, semi-conductors, etc - 561.52
H8525: Radio and TV transmitters, television cameras - 60.86 H8529: Parts for radio, tv transmission, receive equipment - 489.20
H8533: Electrical resistors & rheostats except for heating 3.43
H8541: Diodes, transistors, semi-conductors, etc 1.91To
p g
ain
ers
H8517: Electric apparatus for line telephony, telegraphy 384.39
To
p g
ain
ers
H8529: Parts for radio, tv transmission, receive equipment 26.94
Expo rts T o tal ( including o thers) 3 197.88 Impo rts T o tal ( including o thers) 21 310.97
H8525: Radio and TV transmitters, television cameras 152.55 H8518: Audio-electronic equipment non-recording devices 886.25
H8518: Audio-electronic equipment non-recording devices 97.12 H8528: Television receivers, video monitors, pro jectors 855.16
1 623.65
H8541: Diodes, transistors, semi-conductors, etc 164.13 H8525: Radio and TV transmitters, television cameras 926.29
H8542: Electronic integrated circuits and microassemblies 70.80 H8542: Electronic integrated circuits and microassemblies 832.69
Major traded export products Major traded import products
First half of 2020 (cumulative total) First half of 2020 (cumulative total)
HS4 code: sector description ZAR m HS4 code: sector description ZAR m
To
p e
xpo
rts
H8517: Electric apparatus for line telephony, telegraphy 1 472.11
To
p i
mp
ort
s
H8517: Electric apparatus for line telephony, telegraphy 13 284.64
H8528: Television receivers, video monitors, pro jectors 631.16 H8541: Diodes, transistors, semi-conductors, etc 1 988.75
H8529: Parts for radio, tv transmission, receive equipment 510.66 H8529: Parts for radio, tv transmission, receive equipment
Trade trends (value terms) Trade trends (% of total exports/imports)
Total per quarter Quarterly
ZAR billion per quarter (current v alues) % share of SA's ov erall merchandise ex ports/imports
Production weight: 0.9Television, radio & communication equipment (cont.)
0
5
10
15
20
25
Q1 Q22016
Q3 Q4| Q1 Q22017
Q3 Q4| Q1 Q22018
Q3 Q4| Q1 Q22019
Q3 Q4| Q1 Q22020
Exports Imports
0% 15% 30% 45% 60% 75% 90%
China
Vietnam
USA
Malaysia
Taiwan
Mexico
Thailand
Namibia
Botswana
Bangladesh
USA
China
Zimbabwe
Hong Kong
Top export destinations' share
Top import sources' share
0%
2%
4%
6%
8%
Q1 Q22016
Q3 Q4| Q1 Q22017
Q3 Q4| Q1 Q22018
Q3 Q4| Q1 Q22019
Q3 Q4| Q1 Q22020
Exports Imports
0 4 8 12 16
China
Vietnam
USA
Malaysia
Taiwan
Mexico
Thailand
Namibia
Botswana
Bangladesh
USA
China
Zimbabwe
Hong Kong
R billion
Top export destinations' value
Top import sources' value

November 2020 IDC – Research and Information – Sectoral Trends 68
(percentage points)
Skill composition of employment trend (formal and informal) (QLFS based) Provincial distribution of employment (formal and informal) (QLFS based)
Quarterly Q2 2020 (cumulative total)
Number (1 000) Number (1 000)
* QES - Q1 2012 to Q1 2015 data compiled from the 2013 Business Sample Frame, Q2 2015 to Q1 2016 compiled from the 2015 Business Sample Frame, Q2 2016 onw ards compiled from
the 2017 Business Sample Frame
** QLFS - Q1 2012 to Q4 2014 data compiled from the 2007 Master Sample, Q1 2015 onw ards compiled from the 2013 Master Sample
Formal employment and remuneration trend (QES based)* Employment composition trend (formal and informal) (QLFS based)**
Quarterly Quarterly
Number (1 000) Gross monthly remuneration per w orker (R '000) Formal employ ment % of total employ ment Youth employ ment % of total employ ment
Production and sales trend Utilisation of production capacity
Quarterly Quarterly
Production index (seasonally adjusted) Value of sales (R billion) Capacity utilisation (%)
Professional & scientific equipmentProduction weight: 0.6
Trend analysis: first half of 2020 y-o-y (except: capacity utilisation, employment and remuneration - Q2 2020 y-o-y)
-5.9% -7.6% 5.2% -2.9%
Production (seas. adj.) Capacity utilisation Employment* Gross monthly remuneration per worker Exports (ZAR) Imports (ZAR)
-12.4% -17.4
2
3
4
60
70
80
90
100
110
120
Q1 Q22016
Q3 Q4| Q1 Q22017
Q3 Q4| Q1 Q22018
Q3 Q4| Q1 Q22019
Q3 Q4| Q1 Q22020
Volume of production Value of sales
,23
,26
,29
,32
,35
11
12
13
14
Q1 Q22016
Q3 Q4| Q1 Q22017
Q3 Q4| Q1 Q22018
Q3 Q4| Q1 Q22019
Q3 Q4| Q1 Q22020
Employment Remuneration per worker
0
10
20
30
40
50
60
90
95
100
105
Q1 Q22016
Q3 Q4| Q1 Q22017
Q3 Q4| Q1 Q22018
Q3 Q4| Q1 Q22019
Q3 Q4| Q1 Q22020
Formal employemnt Youth employment
0
4
8
12
16
20
24
Q1 Q22016
Q3 Q4| Q1 Q22017
Q3 Q4| Q1 Q22018
Q3 Q4| Q1 Q22019
Q3 Q4| Q1 Q22020
Tertiary education Secondary schooling completed Less than secondary schooling
0
2
4
6
8
10
12
14
16
18
20
WesternCape
EasternCape
NorthernCape
FreeState
KwaZulu-Natal
NorthWest
Gauteng Mpuma-langa
Limpopo
Non-youth Youth
60
65
70
75
80
85
90
95
Q1 Q22016
Q3 Q4| Q1 Q22017
Q3 Q4| Q1 Q22018
Q3 Q4| Q1 Q22019
Q3 Q4| Q1 Q22020
Capacity utilisation

November 2020 IDC – Research and Information – Sectoral Trends 69
Top trading partners (share of exports/imports) Top trading partners (value of export/imports)
First half of 2020 (cumulative total) First half of 2020 (cumulative total)
To
p l
ose
rs
H9015: Survey, oceanographic, meteoro logical instruments - 219.55
To
p l
ose
rs
H9031: M easuring or checking instruments nes - 198.80
H9013: Liquid crystal devices, lasers, optical appliances - 51.60 H9026: Equipment to measure level &pressure of fluidflow - 112.07
H9021: Orthopaedic appliances - 47.85 H9101: Watches with case of/ clad with, precious metal - 110.08
H9014: Navigational instrumts, direction finding compass - 133.44 H9021: Orthopaedic appliances - 161.03
H9029: Revolution counters, taximeters & speedometers - 67.09 H9102: Watches with case of, or clad with, o f base metal - 137.72
H9025: Hydrometers, thermometers, barometers, etc 99.57 H9028: Gas, liquid/ electricity supply or production meters 63.65
H9019: Therapeutic appliances, nes 43.99 H9020: Breathing appliances and gas masks 47.51To
p g
ain
ers
H9018: Instruments, etc for medical, surgical & dental use 367.79
To
p g
ain
ers
H9025: Hydrometers, thermometers, barometers, etc 1 016.03
H9020: Breathing appliances and gas masks 158.05 H9019: Therapeutic appliances, nes 113.76
H8526: Radar, radio navigation & remote contro l apparatus 42.04 H8419: M achinery, non-domestic, for heating or cooling 18.09
Expo rts T o tal ( including o thers) 4 409.63 Impo rts T o tal ( including o thers) 16 005.02
H9026: Equipment to measure level &pressure of fluidflow 215.36 H9031: M easuring or checking instruments nes 877.82
H9022: Equipment using X-rays, alpha, beta, gamma rays 202.03 H9032: Automatic regulating or contro lling equipment 764.83
1 334.98
H8526: Radar, radio navigation & remote contro l apparatus 231.71 H9025: Hydrometers, thermometers, barometers, etc 1 192.34
H9020: Breathing appliances and gas masks 193.65 H9026: Equipment to measure level &pressure of fluidflow 727.72
Major traded export products Major traded import products
First half of 2020 (cumulative total) First half of 2020 (cumulative total)
HS4 code: sector description ZAR m HS4 code: sector description ZAR m
To
p e
xpo
rts
H9018: Instruments, etc for medical, surgical & dental use 1 220.33
To
p i
mp
ort
s
H9018: Instruments, etc for medical, surgical & dental use 4 402.48
H9031: M easuring or checking instruments nes 431.18 H9021: Orthopaedic appliances 1 709.11
H9027: Equipment for physical and chemical analysis 379.73 H9027: Equipment for physical and chemical analysis
Trade trends (value terms) Trade trends (% of total exports/imports)
Total per quarter Quarterly
ZAR billion per quarter (current v alues) % share of SA's ov erall merchandise ex ports/imports
Professional & scientific equipment (cont.)Production weight: 0.6
0
2
4
6
8
10
12
Q1 Q22016
Q3 Q4| Q1 Q22017
Q3 Q4| Q1 Q22018
Q3 Q4| Q1 Q22019
Q3 Q4| Q1 Q22020
Exports Imports
0% 5% 10% 15% 20% 25%
China
USA
Germany
Switzerland
UK
Japan
Mexico
Germany
Namibia
Botswana
USA
Zambia
Zimbabwe
DRC
Top export destinations' share
Top import sources' share
0%
1%
2%
3%
4%
Q1 Q22016
Q3 Q4| Q1 Q22017
Q3 Q4| Q1 Q22018
Q3 Q4| Q1 Q22019
Q3 Q4| Q1 Q22020
Exports Imports
0 1 2 3 4
China
USA
Germany
Switzerland
UK
Japan
Mexico
Germany
Namibia
Botswana
USA
Zambia
Zimbabwe
DRC
R billion
Top export destinations' value
Top import sources' value

November 2020 IDC – Research and Information – Sectoral Trends 70
(percentage points)
Skill composition of employment trend (formal and informal) (QLFS based) Provincial distribution of employment (formal and informal) (QLFS based)
Quarterly Q2 2020 (cumulative total)
Number (1 000) Number (1 000)
* QES - Q1 2012 to Q1 2015 data compiled from the 2013 Business Sample Frame, Q2 2015 to Q1 2016 compiled from the 2015 Business Sample Frame, Q2 2016 onw ards compiled from
the 2017 Business Sample Frame
** QLFS - Q1 2012 to Q4 2014 data compiled from the 2007 Master Sample, Q1 2015 onw ards compiled from the 2013 Master Sample
Formal employment and remuneration trend (QES based)* Employment composition trend (formal and informal) (QLFS based)**
Quarterly Quarterly
Number (1 000) Gross monthly remuneration per w orker (R '000) Formal employ ment % of total employ ment Youth employ ment % of total employ ment
Production and sales trend Utilisation of production capacity
Quarterly Quarterly
Production index (seasonally adjusted) Value of sales (R billion) Capacity utilisation (%)
Motor vehicles, parts & accessoriesProduction weight: 6.3
Trend analysis: first half of 2020 y-o-y (except: capacity utilisation, employment and remuneration - Q2 2020 y-o-y)
-10.4% -8.2% -30.5% -26.8%
Production (seas. adj.) Capacity utilisation Employment* Gross monthly remuneration per worker Exports (ZAR) Imports (ZAR)
-40.9% -35.4
10
15
20
25
30
35
40
20
35
50
65
80
95
110
125
Q1 Q22016
Q3 Q4| Q1 Q22017
Q3 Q4| Q1 Q22018
Q3 Q4| Q1 Q22019
Q3 Q4| Q1 Q22020
Volume of production Value of sales
,18
,20
,22
,24
,26
,28
87
90
93
96
99
102
Q1 Q22016
Q3 Q4| Q1 Q22017
Q3 Q4| Q1 Q22018
Q3 Q4| Q1 Q22019
Q3 Q4| Q1 Q22020
Employment Remuneration per worker
25
30
35
40
45
50
95
97
99
101
Q1 Q22016
Q3 Q4| Q1 Q22017
Q3 Q4| Q1 Q22018
Q3 Q4| Q1 Q22019
Q3 Q4| Q1 Q22020
Formal employemnt Youth employment
0
20
40
60
80
100
120
Q1 Q22016
Q3 Q4| Q1 Q22017
Q3 Q4| Q1 Q22018
Q3 Q4| Q1 Q22019
Q3 Q4| Q1 Q22020
Tertiary education Secondary schooling completed Less than secondary schooling
0
5
10
15
20
25
30
35
WesternCape
EasternCape
NorthernCape
FreeState
KwaZulu-Natal
NorthWest
Gauteng Mpuma-langa
Limpopo
Non-youth Youth
45
55
65
75
85
95
Q1 Q22016
Q3 Q4| Q1 Q22017
Q3 Q4| Q1 Q22018
Q3 Q4| Q1 Q22019
Q3 Q4| Q1 Q22020
Capacity utilisation

November 2020 IDC – Research and Information – Sectoral Trends 71
Top trading partners (share of exports/imports) Top trading partners (value of export/imports)
First half of 2020 (cumulative total) First half of 2020 (cumulative total)
To
p l
ose
rs
H8703: Vehicles for transport o f persons (except buses) -14 101.72
To
p l
ose
rs
H9801: Original equipment components -14 510.34
H8421: Liquid, gas centrifuges, filtering, purifying machine -1 207.04 H8708: Parts and accessories for motor vehicles -1 714.61
H8409: Parts for internal combustion spark ignition engine - 872.73 H8408: Compression-ignition engines (diesel, etc) - 130.61
H8704: M otor vehicles for the transport o f goods -8 207.97 H8703: Vehicles for transport o f persons (except buses) -9 150.20
H8708: Parts and accessories for motor vehicles -1 220.77 H8704: M otor vehicles for the transport o f goods -1 937.87
H8415: A ir conditioning equipment, machinery 3.79
H8705: Special purpose motor vehicles 0.10To
p g
ain
ers
H8716: Trailers and non-mechanically propelled vehicles 85.84
To
p g
ain
ers
H8421: Liquid, gas centrifuges, filtering, purifying machine 46.24
H8702: Public-transport type passenger motor vehicles 20.44
Expo rts T o tal ( including o thers) 61 066.19 Impo rts T o tal ( including o thers) 75 430.58
H8409: Parts for internal combustion spark ignition engine 1 063.01 H8409: Parts for internal combustion spark ignition engine 1 222.43
H8716: Trailers and non-mechanically propelled vehicles 937.30 H8421: Liquid, gas centrifuges, filtering, purifying machine 788.34
10 043.24
H8708: Parts and accessories for motor vehicles 3 585.03 H8704: M otor vehicles for the transport o f goods 3 775.97
H8609: Cargo containers designed for carriage of goods 689.90 H8716: Trailers and non-mechanically propelled vehicles 725.85
Major traded export products Major traded import products
First half of 2020 (cumulative total) First half of 2020 (cumulative total)
HS4 code: sector description ZAR m HS4 code: sector description ZAR m
To
p e
xpo
rts
H8703: Vehicles for transport o f persons (except buses) 29 816.38
To
p i
mp
ort
s
H9801: Original equipment components 40 941.72
H8704: M otor vehicles for the transport o f goods 15 072.34 H8703: Vehicles for transport o f persons (except buses) 16 051.90
H8421: Liquid, gas centrifuges, filtering, purifying machine 8 723.06 H8708: Parts and accessories for motor vehicles
Trade trends (value terms) Trade trends (% of total exports/imports)
Total per quarter Quarterly
ZAR billion per quarter (current v alues) % share of SA's ov erall merchandise ex ports/imports
Motor vehicles, parts & accessories (cont.)Production weight: 6.3
10
20
30
40
50
60
70
Q1 Q22016
Q3 Q4| Q1 Q22017
Q3 Q4| Q1 Q22018
Q3 Q4| Q1 Q22019
Q3 Q4| Q1 Q22020
Exports Imports
0% 10% 20% 30% 40%
Germany
Japan
Thailand
India
China
USA
Spain
Germany
USA
Belgium
UK
Spain
Czech Republic
Japan
Top export destinations' share
Top import sources' share
10%
12%
14%
16%
18%
Q1 Q22016
Q3 Q4| Q1 Q22017
Q3 Q4| Q1 Q22018
Q3 Q4| Q1 Q22019
Q3 Q4| Q1 Q22020
Exports Imports
0 5 10 15 20 25
Germany
Japan
Thailand
India
China
USA
Spain
Germany
USA
Belgium
UK
Spain
Czech Republic
Japan
R billion
Top export destinations' value
Top import sources' value

November 2020 IDC – Research and Information – Sectoral Trends 72
(percentage points)
Skill composition of employment trend (formal and informal) (QLFS based) Provincial distribution of employment (formal and informal) (QLFS based)
Quarterly Q2 2020 (cumulative total)
Number (1 000) Number (1 000)
* QES - Q1 2012 to Q1 2015 data compiled from the 2013 Business Sample Frame, Q2 2015 to Q1 2016 compiled from the 2015 Business Sample Frame, Q2 2016 onw ards compiled from
the 2017 Business Sample Frame
** QLFS - Q1 2012 to Q4 2014 data compiled from the 2007 Master Sample, Q1 2015 onw ards compiled from the 2013 Master Sample
Formal employment and remuneration trend (QES based)* Employment composition trend (formal and informal) (QLFS based)**
Quarterly Quarterly
Number (1 000) Gross monthly remuneration per w orker (R '000) Formal employ ment % of total employ ment Youth employ ment % of total employ ment
Production and sales trend Utilisation of production capacity
Quarterly Quarterly
Production index (seasonally adjusted) Value of sales (R billion) Capacity utilisation (%)
Other transport equipmentProduction weight: 1.2
Trend analysis: first half of 2020 y-o-y (except: capacity utilisation, employment and remuneration - Q2 2020 y-o-y)
-20.1% -8.9% -54.0% -39.0%
Production (seas. adj.) Capacity utilisation Employment* Gross monthly remuneration per worker Exports (ZAR) Imports (ZAR)
-29.9% -30.3
2
4
6
8
10
20
35
50
65
80
95
110
Q1 Q22016
Q3 Q4| Q1 Q22017
Q3 Q4| Q1 Q22018
Q3 Q4| Q1 Q22019
Q3 Q4| Q1 Q22020
Volume of production Value of sales
16
18
20
22
24
14
15
16
17
18
19
Q1 Q22016
Q3 Q4| Q1 Q22017
Q3 Q4| Q1 Q22018
Q3 Q4| Q1 Q22019
Q3 Q4| Q1 Q22020
Employment Remuneration per worker
0
10
20
30
40
50
60
70
85
90
95
100
105
Q1 Q22016
Q3 Q4| Q1 Q22017
Q3 Q4| Q1 Q22018
Q3 Q4| Q1 Q22019
Q3 Q4| Q1 Q22020
Formal employemnt Youth employment
0
5
10
15
20
25
Q1 Q22016
Q3 Q4| Q1 Q22017
Q3 Q4| Q1 Q22018
Q3 Q4| Q1 Q22019
Q3 Q4| Q1 Q22020
Tertiary education Secondary schooling completed Less than secondary schooling
0
2
4
6
8
10
12
14
WesternCape
EasternCape
NorthernCape
FreeState
KwaZulu-Natal
NorthWest
Gauteng Mpuma-langa
Limpopo
Non-youth Youth
40
50
60
70
80
90
Q1 Q22016
Q3 Q4| Q1 Q22017
Q3 Q4| Q1 Q22018
Q3 Q4| Q1 Q22019
Q3 Q4| Q1 Q22020
Capacity utilisation
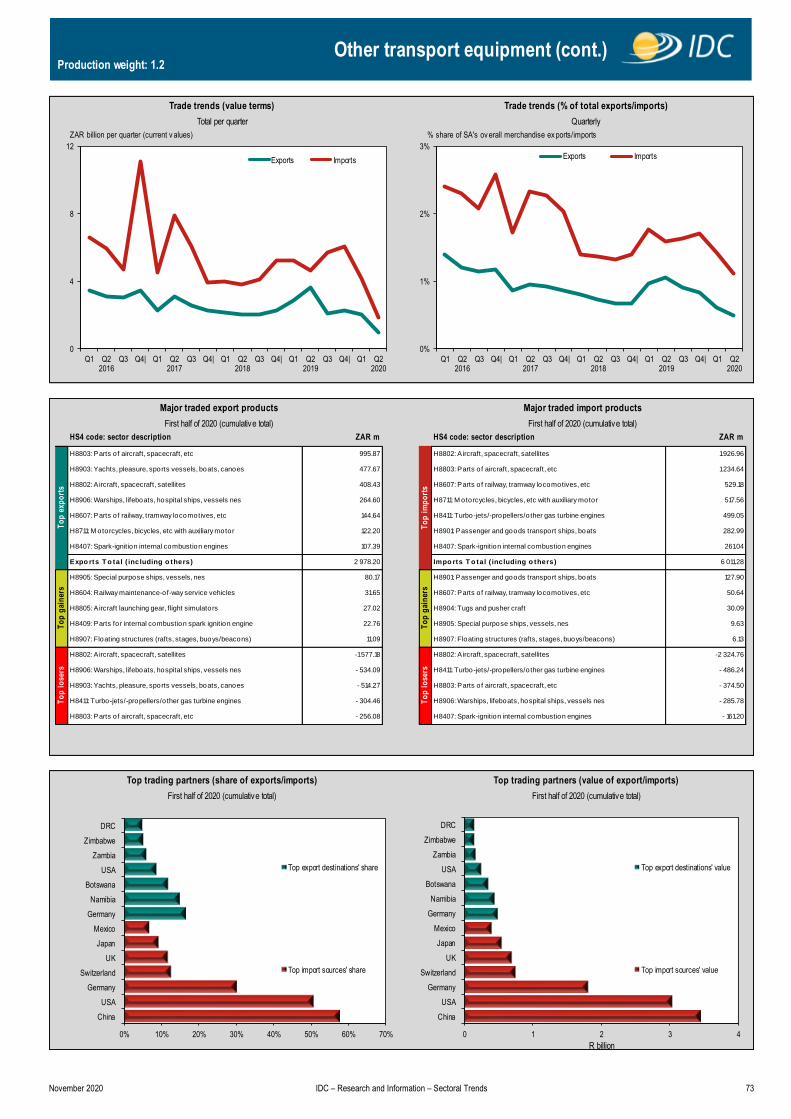
November 2020 IDC – Research and Information – Sectoral Trends 73
Top trading partners (share of exports/imports) Top trading partners (value of export/imports)
First half of 2020 (cumulative total) First half of 2020 (cumulative total)
To
p l
ose
rs
H8802: A ircraft, spacecraft, satellites -1 577.18
To
p l
ose
rs
H8802: A ircraft, spacecraft, satellites -2 324.76
H8411: Turbo-jets/-propellers/other gas turbine engines - 304.46 H8906: Warships, lifeboats, hospital ships, vessels nes - 285.78
H8803: Parts o f aircraft, spacecraft, etc - 256.08 H8407: Spark-ignition internal combustion engines - 161.20
H8906: Warships, lifeboats, hospital ships, vessels nes - 534.09 H8411: Turbo-jets/-propellers/other gas turbine engines - 486.24
H8903: Yachts, pleasure, sports vessels, boats, canoes - 514.27 H8803: Parts o f aircraft, spacecraft, etc - 374.50
H8805: A ircraft launching gear, flight simulators 27.02 H8904: Tugs and pusher craft 30.09
H8409: Parts for internal combustion spark ignition engine 22.76 H8905: Special purpose ships, vessels, nes 9.63To
p g
ain
ers
H8905: Special purpose ships, vessels, nes 80.17
To
p g
ain
ers
H8901: Passenger and goods transport ships, boats 127.90
H8604: Railway maintenance-of-way service vehicles 31.65 H8607: Parts o f railway, tramway locomotives, etc 50.64
H8907: Floating structures (rafts, stages, buoys/beacons) 11.09 H8907: Floating structures (rafts, stages, buoys/beacons) 6.13
Expo rts T o tal ( including o thers) 2 978.20 Impo rts T o tal ( including o thers) 6 011.28
H8607: Parts o f railway, tramway locomotives, etc 144.64 H8411: Turbo-jets/-propellers/other gas turbine engines 499.05
H8711: M otorcycles, bicycles, etc with auxiliary motor 122.20 H8901: Passenger and goods transport ships, boats 282.99
529.18
H8906: Warships, lifeboats, hospital ships, vessels nes 264.60 H8711: M otorcycles, bicycles, etc with auxiliary motor 517.56
H8407: Spark-ignition internal combustion engines 107.39 H8407: Spark-ignition internal combustion engines 261.04
Major traded export products Major traded import products
First half of 2020 (cumulative total) First half of 2020 (cumulative total)
HS4 code: sector description ZAR m HS4 code: sector description ZAR m
To
p e
xpo
rts
H8803: Parts o f aircraft, spacecraft, etc 995.87
To
p i
mp
ort
s
H8802: A ircraft, spacecraft, satellites 1 926.96
H8903: Yachts, pleasure, sports vessels, boats, canoes 477.67 H8803: Parts o f aircraft, spacecraft, etc 1 234.64
H8802: A ircraft, spacecraft, satellites 408.43 H8607: Parts o f railway, tramway locomotives, etc
Trade trends (value terms) Trade trends (% of total exports/imports)
Total per quarter Quarterly
ZAR billion per quarter (current v alues) % share of SA's ov erall merchandise ex ports/imports
Other transport equipment (cont.)Production weight: 1.2
0
4
8
12
Q1 Q22016
Q3 Q4| Q1 Q22017
Q3 Q4| Q1 Q22018
Q3 Q4| Q1 Q22019
Q3 Q4| Q1 Q22020
Exports Imports
0% 10% 20% 30% 40% 50% 60% 70%
China
USA
Germany
Switzerland
UK
Japan
Mexico
Germany
Namibia
Botswana
USA
Zambia
Zimbabwe
DRC
Top export destinations' share
Top import sources' share
0%
1%
2%
3%
Q1 Q22016
Q3 Q4| Q1 Q22017
Q3 Q4| Q1 Q22018
Q3 Q4| Q1 Q22019
Q3 Q4| Q1 Q22020
Exports Imports
0 1 2 3 4
China
USA
Germany
Switzerland
UK
Japan
Mexico
Germany
Namibia
Botswana
USA
Zambia
Zimbabwe
DRC
R billion
Top export destinations' value
Top import sources' value

November 2020 IDC – Research and Information – Sectoral Trends 74
(percentage points)
Skill composition of employment trend (formal and informal) (QLFS based) Provincial distribution of employment (formal and informal) (QLFS based)
Quarterly Q2 2020 (cumulative total)
Number (1 000) Number (1 000)
* QES - Q1 2012 to Q1 2015 data compiled from the 2013 Business Sample Frame, Q2 2015 to Q1 2016 compiled from the 2015 Business Sample Frame, Q2 2016 onw ards compiled from
the 2017 Business Sample Frame
** QLFS - Q1 2012 to Q4 2014 data compiled from the 2007 Master Sample, Q1 2015 onw ards compiled from the 2013 Master Sample
Formal employment and remuneration trend (QES based)* Employment composition trend (formal and informal) (QLFS based)**
Quarterly Quarterly
Number (1 000) Gross monthly remuneration per w orker (R '000) Formal employ ment % of total employ ment Youth employ ment % of total employ ment
Production and sales trend Utilisation of production capacity
Quarterly Quarterly
Production index (seasonally adjusted) Value of sales (R billion) Capacity utilisation (%)
FurnitureProduction weight: 1.1
Trend analysis: first half of 2020 y-o-y (except: capacity utilisation, employment and remuneration - Q2 2020 y-o-y)
-13.2% -36.9% -48.4% -26.3%
Production (seas. adj.) Capacity utilisation Employment* Gross monthly remuneration per worker Exports (ZAR) Imports (ZAR)
-37.3% -43.2
1
2
3
4
5
6
20
35
50
65
80
95
110
Q1 Q22016
Q3 Q4| Q1 Q22017
Q3 Q4| Q1 Q22018
Q3 Q4| Q1 Q22019
Q3 Q4| Q1 Q22020
Volume of production Value of sales
,6
,7
,8
,9
,10
,11
,12
20
25
30
35
Q1 Q22016
Q3 Q4| Q1 Q22017
Q3 Q4| Q1 Q22018
Q3 Q4| Q1 Q22019
Q3 Q4| Q1 Q22020
Employment Remuneration per worker
25
35
45
55
65
60
70
80
90
100
110
Q1 Q22016
Q3 Q4| Q1 Q22017
Q3 Q4| Q1 Q22018
Q3 Q4| Q1 Q22019
Q3 Q4| Q1 Q22020
Formal employemnt Youth employment
0
10
20
30
40
50
60
70
Q1 Q22016
Q3 Q4| Q1 Q22017
Q3 Q4| Q1 Q22018
Q3 Q4| Q1 Q22019
Q3 Q4| Q1 Q22020
Tertiary education Secondary schooling completed Less than secondary schooling
0
2
4
6
8
10
12
WesternCape
EasternCape
NorthernCape
FreeState
KwaZulu-Natal
NorthWest
Gauteng Mpuma-langa
Limpopo
Non-youth Youth
35
45
55
65
75
85
95
Q1 Q22016
Q3 Q4| Q1 Q22017
Q3 Q4| Q1 Q22018
Q3 Q4| Q1 Q22019
Q3 Q4| Q1 Q22020
Capacity utilisation

November 2020 IDC – Research and Information – Sectoral Trends 75
Top trading partners (share of exports/imports) Top trading partners (value of export/imports)
First half of 2020 (cumulative total) First half of 2020 (cumulative total)
To
p l
ose
rs
H9403: Other furniture and parts thereof - 478.81
To
p l
ose
rs
H9401: Seats (except dentist, barber, etc chairs) - 523.23
H9401: Seats (except dentist, barber, etc chairs) - 327.29 H9403: Other furniture and parts thereof - 361.05
H9404: M attress supports, mattresses, bedding - 56.10 H9404: M attress supports, mattresses, bedding - 12.49
To
p g
ain
ers
To
p g
ain
ers
Expo rts T o tal ( including o thers) 918.53 Impo rts T o tal ( including o thers) 2 507.05
17.88
Major traded export products Major traded import products
First half of 2020 (cumulative total) First half of 2020 (cumulative total)
HS4 code: sector description ZAR m HS4 code: sector description ZAR m
To
p e
xpo
rts
H9403: Other furniture and parts thereof 443.14
To
p i
mp
ort
s
H9401: Seats (except dentist, barber, etc chairs) 1 680.09
H9401: Seats (except dentist, barber, etc chairs) 347.95 H9403: Other furniture and parts thereof 809.09
H9404: M attress supports, mattresses, bedding 127.44 H9404: M attress supports, mattresses, bedding
Trade trends (value terms) Trade trends (% of total exports/imports)
Total per quarter Quarterly
ZAR billion per quarter (current v alues) % share of SA's ov erall merchandise ex ports/imports
Furniture (cont.)Production weight: 1.1
0.0
0.5
1.0
1.5
2.0
2.5
Q1 Q22016
Q3 Q4| Q1 Q22017
Q3 Q4| Q1 Q22018
Q3 Q4| Q1 Q22019
Q3 Q4| Q1 Q22020
Exports Imports
0% 10% 20% 30% 40% 50%
China
Thailand
Germany
Italy
Czech Republic
Poland
Vietnam
Botswana
Namibia
Zambia
Swaziland
Mozambique
USA
Lesotho
Top export destinations' share
Top import sources' share
0.1%
0.2%
0.3%
0.4%
0.5%
0.6%
0.7%
Q1 Q22016
Q3 Q4| Q1 Q22017
Q3 Q4| Q1 Q22018
Q3 Q4| Q1 Q22019
Q3 Q4| Q1 Q22020
Exports Imports
0.0 0.2 0.4 0.6 0.8 1.0 1.2
China
Thailand
Germany
Italy
Czech Republic
Poland
Vietnam
Botswana
Namibia
Zambia
Swaziland
Mozambique
USA
Lesotho
R billion
Top export destinations' value
Top import sources' value

November 2020 IDC – Research and Information – Sectoral Trends 76
(percentage points)
Production (seas. adj.) Capacity utilisation
Skill composition of employment trend (formal and informal) (QLFS based)
Quarterly
Number (1 000) Number (1 000)
* QES - Q1 2012 to Q1 2015 data compiled from the 2013 Business Sample Frame, Q2 2015 to Q1 2016 compiled from the 2015 Business Sample Frame, Q2 2016 onw ards compiled from
the 2017 Business Sample Frame
** QLFS - Q1 2012 to Q4 2014 data compiled from the 2007 Master Sample, Q1 2015 onw ards compiled from the 2013 Master Sample
Provincial distribution of employment (formal and informal) (QLFS based)
Q2 2020 (cumulative total)
Formal employment and remuneration trend (QES based)*
Quarterly
Number (1 000) Gross monthly remuneration per w orker (R '000)
Employment composition trend (formal and informal) (QLFS based)**
Quarterly
Formal employ ment % of total employ ment Youth employ ment % of total employ ment
Production and sales trend Utilisation of production capacity
Quarterly Quarterly
Production index (seasonally adjusted) Value of sales (R billion) Capacity utilisation (%)
-24.9% -12.2% 2.8% -22.1%
Employment* Gross monthly remuneration per worker Exports (ZAR) Imports (ZAR)
Other manufacturingProduction weight: 2.0
Trend analysis: first half of 2020 y-o-y (except: capacity utilisation, employment and remuneration - Q2 2020 y-o-y)
-24.3% -43.2
7
10
13
16
19
22
40
50
60
70
80
90
100
110
120
Q1 Q22016
Q3 Q4| Q1 Q22017
Q3 Q4| Q1 Q22018
Q3 Q4| Q1 Q22019
Q3 Q4| Q1 Q22020
Volume of production Value of sales
,10
,11
,12
,13
,14
,15
,16
25
30
35
40
45
50
Q1 Q22016
Q3 Q4| Q1 Q22017
Q3 Q4| Q1 Q22018
Q3 Q4| Q1 Q22019
Q3 Q4| Q1 Q22020
Employment Remuneration per worker
25
35
45
55
50
60
70
80
90
100
Q1 Q22016
Q3 Q4| Q1 Q22017
Q3 Q4| Q1 Q22018
Q3 Q4| Q1 Q22019
Q3 Q4| Q1 Q22020
Formal employemnt Youth employment
0
15
30
45
60
75
Q1 Q22016
Q3 Q4| Q1 Q22017
Q3 Q4| Q1 Q22018
Q3 Q4| Q1 Q22019
Q3 Q4| Q1 Q22020
Tertiary education Secondary schooling completed Less than secondary schooling
0
2
4
6
8
10
12
14
16
WesternCape
EasternCape
NorthernCape
FreeState
KwaZulu-Natal
NorthWest
Gauteng Mpuma-langa
Limpopo
Non-youth Youth
30
40
50
60
70
80
90
Q1 Q22016
Q3 Q4| Q1 Q22017
Q3 Q4| Q1 Q22018
Q3 Q4| Q1 Q22019
Q3 Q4| Q1 Q22020
Capacity utilisation

November 2020 IDC – Research and Information – Sectoral Trends 77
Top trading partners (share of exports/imports) Top trading partners (value of export/imports)
First half of 2020 (cumulative total) First half of 2020 (cumulative total)
H7117: Imitation jewellery - 88.79 H9506: Equipment for gymnastics, sports, outdoor games nes - 172.48
H7404: Copper, copper alloy, waste or scrap - 73.07 H9701: Hand made paintings, drawings, pastels, co llages - 125.50
H7113: Jewellery and parts, containing precious metal - 648.73 H9503: Other toys, scale models, puzzles, etc - 436.68
H2618: Granulated slag from iron & steel industry - 374.09 H9504: Articles for funfairs, table and parlour games - 309.57
H7503: Nickel waste or scrap 8.29 H2308: Veg. waste, residues, etc for animal feed 15.85
To
p l
ose
rs
H7112: Waste or scrap of precious metal - 725.44
To
p l
ose
rs
H7118: Coin - 722.70
H7204: Ferrous waste or scrap, ingots or iron or steel 143.24 H6704: Wigs, false beards, eyebrows and eyelashes 61.92
H2403: Tobacco, tobacco substitute products nes 24.26 H2618: Granulated slag from iron & steel industry 21.27To
p g
ain
ers
H7118: Coin 2 346.07
To
p g
ain
ers
H7112: Waste or scrap of precious metal 664.84
H2620: M etal containing ash/ residue except iron or steel 183.15 H7115: Articles of, or clad with, precious metal nes 100.66
Expo rts T o tal ( including o thers) 12 155.59 Impo rts T o tal ( including o thers) 6 380.41
H2844: Radioactive elements, isotopes, compounds and mixtures 1.16 H4906: P lans and drawings for architectural use 0.56
H9901: Base metal articles 1.13 H9902: Household consumables 0.01
1.02
H9902: Household consumables 11.13 H9901: Base metal articles 0.57
H2705: Coal gas, water gas (not gaseous hydrocarbons) 0.60 H2705: Coal gas, water gas (not gaseous hydrocarbons) 0.00
Major traded export products Major traded import products
First half of 2020 (cumulative total) First half of 2020 (cumulative total)
HS4 code: sector description ZAR m HS4 code: sector description ZAR m
To
p e
xpo
rts
H2716: Electrical energy 4 440.91
To
p i
mp
ort
s
H2716: Electrical energy 1 818.58
H9992: Ships stores, not classified 863.02 H9900: Unspecified 434.34
H9900: Unspecified 548.21 H9992: Ships stores, not classified
Trade trends (value terms) Trade trends (% of total exports/imports)
Total per quarter Quarterly
ZAR billion per quarter (current v alues) % share of SA's ov erall merchandise ex ports/imports
Other manufacturing (cont.)Production weight: 2.0
0
2
4
6
8
10
12
Q1 Q22016
Q3 Q4| Q1 Q22017
Q3 Q4| Q1 Q22018
Q3 Q4| Q1 Q22019
Q3 Q4| Q1 Q22020
Exports Imports
0% 10% 20% 30% 40%
China
Germany
Switzerland
USA
Mozambique
Australia
Malaysia
Germany
USA
Belgium
India
Namibia
Lesotho
Botswana
Top export destinations' share
Top import sources' share
0%
1%
2%
3%
4%
Q1 Q22016
Q3 Q4| Q1 Q22017
Q3 Q4| Q1 Q22018
Q3 Q4| Q1 Q22019
Q3 Q4| Q1 Q22020
Exports Imports
0 1 2 3 4
China
Germany
Switzerland
USA
Mozambique
Australia
Malaysia
Germany
USA
Belgium
India
Namibia
Lesotho
Botswana
R billion
Top export destinations' value
Top import sources' value

November 2020 IDC – Research and Information – Sectoral Trends 78
Acronyms, notes and data sources
Acronyms
COMESA Common Market for Eastern & Southern Africa members are: Burundi, Comoros, DRC, Djibouti, Egypt, Eritrea,
Ethiopia, Kenya, Libya, Madagascar, Malawi, Mauritius, Rwanda, Seychelles, Sudan, Swaziland, Uganda, Zambia &
Zimbabwe.
DRC Democratic Republic of Congo.
EU European Union member states are: Austria, Belgium, Cyprus, Czech Republic, Germany, Denmark, Estonia, Spain,
Finland, France, United Kingdom, Bulgaria, Greece, Hungary, Ireland, Italy, Lithuania, Luxembourg, Latvia, Malta, The
Netherlands, Poland, Portugal, Romania, Sweden, Slovenia and Slovakia.
GDP Gross domestic product.
HS Codes Harmonized system codes.
Middle East The countries in the Middle East grouping are: Bahrain, Iran (Islamic Republic of), Iraq, Israel, Jordan, Kuwait, Lebanon,
Oman, Qatar, Saudi Arabia, Syrian Arab Republic, Turkey, United Arab Emirates and Yemen
NAFTA North American Free Trade Agreement members are: Canada, Mexico and the United States of America.
n.e.s. Not elsewhere specified.
PGM Platinum group metals
ZAR or R South African rand.
SA Republic of South Africa.
SACU Southern African Customs Union members are: Botswana, Lesotho, Namibia, South Africa and Swaziland.
SADC Southern African Development Community members are: Angola, Botswana, Democratic Republic of Congo, Lesotho,
Madagascar, Malawi, Mauritius, Mozambique, Namibia, Seychelles, South Africa, Swaziland, United Republic of Tanzania,
Zambia and Zimbabwe.
QES Quarterly Employment Survey – based on surveying companies that are registered for VAT. Employees are counted if they
received remuneration in the preceding payment period, with contractors, employees on unpaid leave (e.g. maternity leave)
and persons who work at the company but are not paid by the company (e.g. persons on secondment) excluded.
QLFS Quarterly Labour Force Survey – based on a sample of households being surveyed regarding their employment levels in
the 7 days preceding the interview. Employed is defined as having done paid work for at least 1 hour in the previous 7 days.
Formal employment is defined as where there are more than 5 employees working and/or having PAYE deducted and/or
having a formal employment contract.
UK United Kingdom.
USA or US United States of America.
USD United States dollar.
y-o-y Year-on-year growth rate.
q-o-q Quarter-on-quarter growth rate.

November 2020 IDC – Research and Information – Sectoral Trends 79
Acronyms, notes and data sources
Notes
▪ All volume of production data (value add data in the case of the agriculture, forestry and fishing sector) is seasonally adjusted. All other data
is not seasonally adjusted.
▪ The total South African commodity price index is weighted according to the production weights as reported by Stats SA. The PGM group
metals are equally weighted between platinum and palladium. The aluminium price is used for the other metallic minerals component. Mining
segments not included in the price index include: diamonds; chromium ore; copper; manganese ore, nickel, building materials and other non-
metallic minerals.
▪ The methodology utilised by Stats SA and DMR in relation to remuneration data differs in that the DMR includes all income derived due to
employment, such as severance, retrenchment and termination payments as well as income derived from employee share schemes.
Therefore, direct comparisons between remuneration per worker in the mining and manufacturing sectors reported in this document should
be done with great care.
Data sources
Quantec Research based on South African Revenue Services (SARS): South African trade data.
Statistics South Africa (Stats SA): South African employment, production and capacity utilization data.
Department of Mineral Resources: South African employment and remuneration data for the mining sector and sub-sectors.

Compiled by:
Department of Research and Information
Industrial Development Corporation of South Africa Limited
PO Box 784055, Sandton, 2146, Gauteng, South Africa
IDC Head Office:
19 Fredman Drive, Sandown, 2196
PO Box 784055, Sandton, 2146, South Africa
Tel: +27 11 269 3000
Fax: +27 11 269 3116
Call Centre: 0860 693 888
Email: [email protected]
Website: www.idc.co.za
Although every care is taken to ensure the accuracy of this publication, supplements, updates and replacement material; the authors, editors, publishers and printers do not accept responsibility for any act, omission, loss or damage or the consequences thereof, occasioned by a reliance by any person upon the contents hereof.
Recommended