EATA 2013, pages 1 to 13
Performance of bitumen 70/100 obtained from different suppliers
C.P. Plug* — A.H. de Bondt* — H. Roos** *Ooms Civiel bv
Scharwoude 9
1634 EA Scharwoude; The Netherlands
** VBW (Dutch Asphalt Pavement Association)
Zilverstraat 69
2718 RP Zoetermeer; The Netherlands
ABSTRACT. Bitumen in Europe is produced according to the European bitumen specifications
(EN 12591). Even if these specifications are met, the performance of a bitumen can
substantially vary depending on the supplier. This means that the current specifications for
penetration grade bitumen have little correlation with the functional properties of asphalt
concrete.
In this study 5 different deliveries of bitumen 70/100 at 4 different asphalt mixing plants were
collected and its functional properties were tested.
The performed laboratory tests show that especially the fatigue life of the tested bitumen
samples vary significantly. Correlations with functional asphalt characteristics indicate that
this has influence on the performance of asphalt concrete in the field.
KEYWORDS: bitumen tests, fatigue, ravelling, specifications, asphalt performance.
2 EATA 2013
1. Introduction
As from 2008, functional asphalt concrete tests are specified in The Netherlands.
From obtained test results, there is some concern about the variation in quality of the
used bitumen. To verify the quality and the influence of penetration grade bitumen
from different suppliers a pilot study was performed with regular used bitumen
70/100 for pavements by the Dutch Asphalt Pavement Association (VBW-Asfalt).
For the purpose of this, samples of bitumen were collected at different asphalt
mixing plants during unloading of bitumen from a bitumen truck according to an
equal sampling protocol (EN 58). The obtained samples of bitumen were labelled A
to E and tested anonymously in a laboratory for their (functional) properties.
In this paper the results are presented of the performed study in relation with
functional asphalt behaviour. Because of the limited time and available budget, this
study concerned in particular the equality within the bitumen 70/100 grade and in
the course of time (several batches from 1 supplier).
2. Experimental plan
In total 5 bitumen samples of penetration grade 70/100 from 4 different bitumen
suppliers were tested. The performed tests on the bitumen are given below. The
selection of these tests has been based on recent scientific knowledge (Santagata et
al., 2009; De Jonghe et al., 2004). The tests were performed under strictly controlled
conditions. All supplied samples were reheated for maximum 1 time and the tests
were conducted with the same equipment and technician to obtain the highest
possible accuracy and repeatability.
Determination conventional properties.
– Penetration (EN 1426)
– Ring & Ball Softening Point (EN 1427).
Stiffness.
– Determination of the master curve by means of frequency sweeps (0.01 to 50
Hz) with a dynamic shear rheometer (DSR) according to EN 14770 at temperatures
between -10 and 60 °C after RTFOT ageing (EN 12607-1).
Fatigue.
– Determination by means of a DSR on the basis of the RILEM test protocol in
triplicate (RILEM TC 182, 2008) at 10 °C, 10 Hz and a (shear) strain level of 1%,
after RTFOT aging. For this strain level was chosen because of the test duration
(each sample) of approximately 24 hours, giving the best possible scientific
understanding.
Performance of bitumen 3
Bitumen composition.
– Analysis of the determination of the 4 main fractions of the bitumen (saturates,
aromatics, resins and asphaltenes) (Read et al., 2003). In this respect the fraction of
asphaltenes is determined according to ASTM D3279 with n-heptane and the other
fractions by thin layer chromatography (Iatroscan) with the use of n-pentane and
toluene / chloroform.
Rutting.
– Determination of zero shear viscosity (ZSV) at 40 °C in duplicate according to
draft standard prEN 15325, carried out at the following conditions: 2 mm gap; shear
stress (τ) 30 Pa and a maximum loading time of 4 hours.
Ravelling resistance / adhesion.
– Determination of the acid number, by means of a potentiometric titration
method based on ASTM D 664.
– Analysis of the cohesive properties of the bitumen film under high frequency
―shock loading‖ conditions versus temperature with the modified Vialit plate shock
test using Moraine gravel after 30 days aging at 70 °C (based on EN 12272-3 and
(Goos, 2001)). Per bitumen 6 test plates were made, which were tested in duplicate
at 3 temperatures. Stone loss was determined after 1 steel ball dropping.
Asphalt characteristics.
- Performing of 4-point bending tests with 2 selected bitumen in a specific Dutch
asphalt mixture (AC 11 surf 70/100) according to European standard EN 12967-24.
Test conditions: Stiffness at 8 Hz and 20 °C and fatigue at 30 Hz and 20 °C. Beam
dimensions: 450 x 50 x 50 mm.
3. Test results
3.1 Conventional properties
The main properties according to EN 12591 are displayed in table 1. As
expected all the bitumen samples complied with the European standard.
Table 1. Properties according to EN 12591.
Bitumen sample A B C D E Specification
Penetration [0.1 mm] 91 81 77 84 77 70 - 100
R&B [°C] 44.4 46.2 46.0 45.4 46.2 43 - 51
PI [-] -1.3 -1.0 -1.2 -1.2 -1.2 -1.5 - +0.7
4 EATA 2013
1.0E+01
1.0E+02
1.0E+03
1.0E+04
1.0E+05
1.0E+06
1.0E+07
1.0E+08
1.0E+09
1.0E-06 1.0E-04 1.0E-02 1.0E+00 1.0E+02 1.0E+04
Co
mp
lex
sh
ea
r m
od
ulu
s G
* [P
a]
Reduced frequency [Hz]
Bitumen sample A
Bitumen sample B
Bitumen sample C
Bitumen sample D
Bitumen sample E
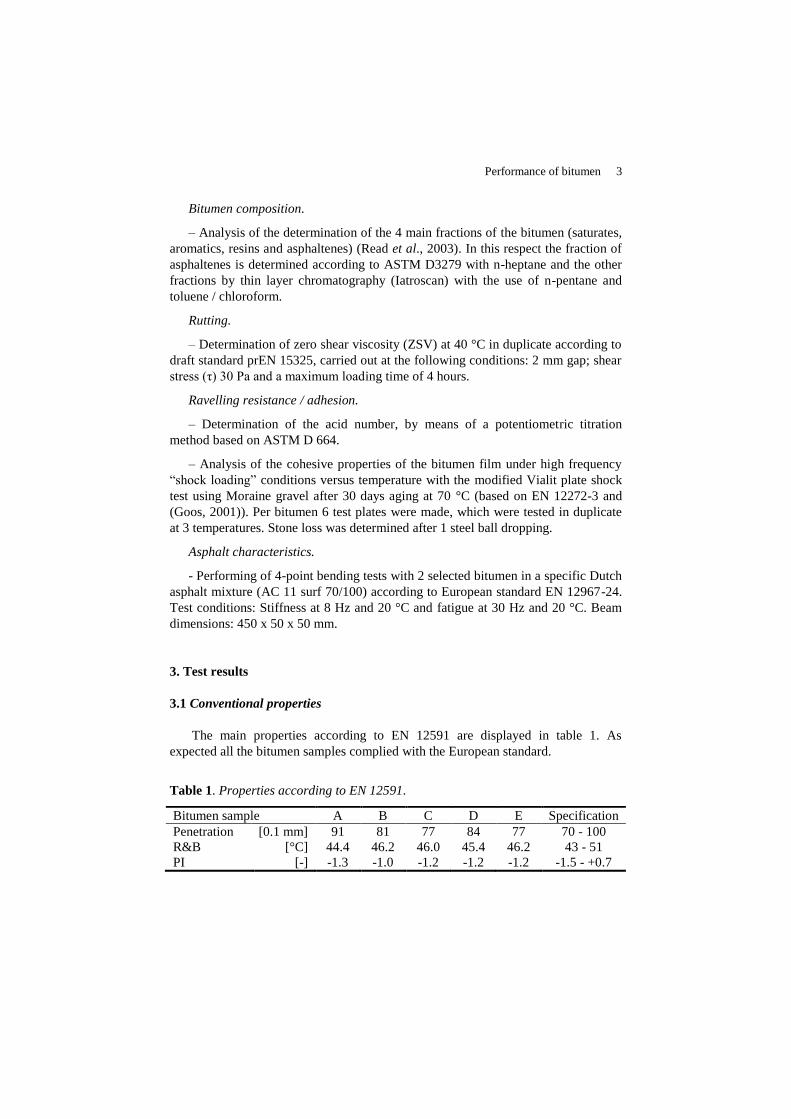
3.2 Stiffness
The master curves of the bitumen samples have been determined after RTFOT
ageing by performing frequency sweep tests at temperatures between -10 and 60 °C.
The obtained curves using the sigmoidal-model (Medani et al., 2004) are presented
in figure 1. From the figure it can be seen that the curves overlap each other most of
the time. Bitumen sample A has the lowest stiffness (as expected).
Figure 1. Master curves bitumen samples at a reference temperature of 20 °C.
More in detail, in table 2 the complex shear modulus G* has been determined at
a frequency of 1.3 Hz and a temperature of 0, 20 en 40 °C and compared with the
penetration. The DSR test frequency of 1.3 Hz (≈ 8 rad/s) corresponds to the asphalt
loading frequency of 8 Hz (Bari et al, 2006). This frequency is used for the stiffness
determination of asphalt in the Dutch CE-marking (4-point bending configuration).
Table 2. Complex shear modulus G* at 1.3 Hz and 3 different temperatures.
Bitumen sample 0 °C
[MPa]
20 °C
[MPa]
40 °C
[MPa]
Penetration
[0.1 mm]
A 81 2.9 0.064 91
B 104 4.5 0.092 81
C 132 4.6 0.076 77
D 115 5.0 0.086 84
E 110 3.9 0.065 77
Performance of bitumen 5
The results in the table show also for bitumen sample A the lowest stiffness. This is
in accordance with the higher penetration value. It looks as if the penetration
predicts the difference in stiffness. However, this is not consistent for all samples.
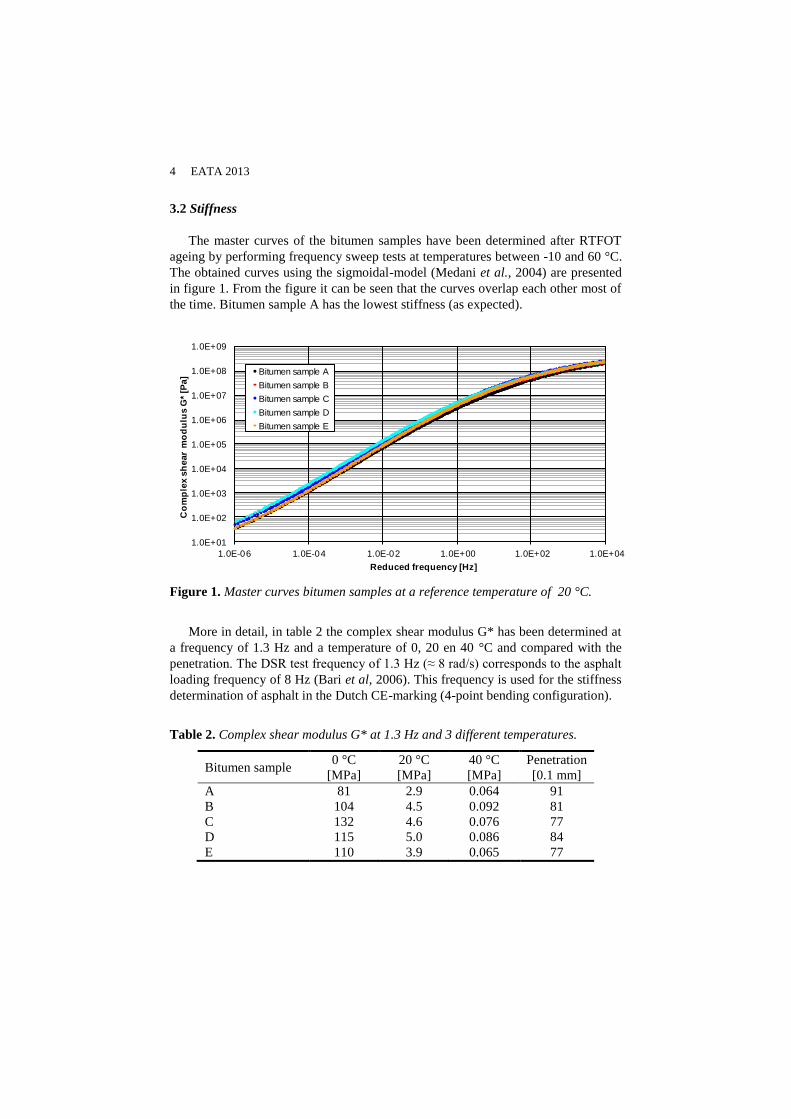
3.3 Fatigue
The fatigue characterization of the bitumen samples has been determined on the
basis of the RILEM test protocol in triplicate at 10 °C, 10 Hz and a (shear) strain
level of 1%, after RTFOT aging. The average curve (n=3) of the fatigue data is
displayed in figure 2 for each bitumen sample.
Figure 2. Average (n=3) fatigue curves at 10 °C and a frequency of 10 Hz.
According to RILEM, the fatigue life can be defined in different ways. One
definition is the number of load repetitions until halving of the stiffness. Another
method is based on dissipated energy ratio (DER). The fatigue life with the latter
method can be obtained from the curve in which the number of load repetitions (N)
times G* is plotted against N. The fatigue life is the maximum of N x G* (figure 3).
6 EATA 2013
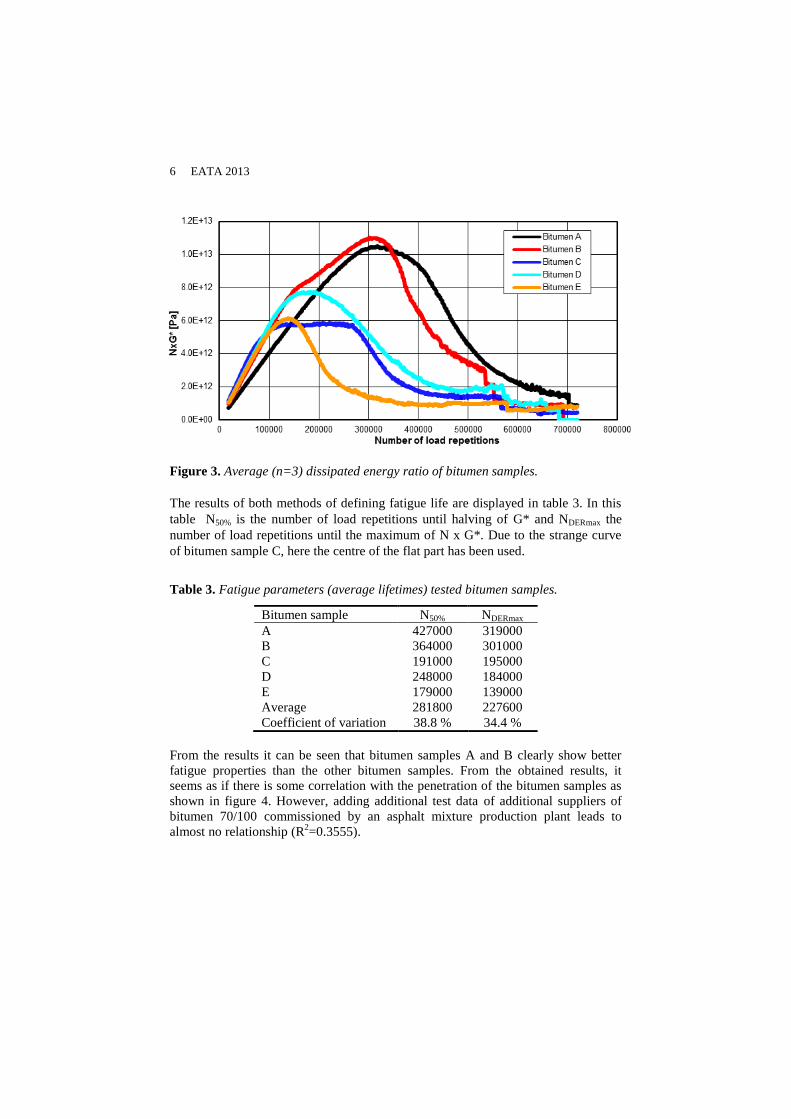
Figure 3. Average (n=3) dissipated energy ratio of bitumen samples.
The results of both methods of defining fatigue life are displayed in table 3. In this
table N50% is the number of load repetitions until halving of G* and NDERmax the
number of load repetitions until the maximum of N x G*. Due to the strange curve
of bitumen sample C, here the centre of the flat part has been used.
Table 3. Fatigue parameters (average lifetimes) tested bitumen samples.
Bitumen sample N50% NDERmax
A 427000 319000
B 364000 301000
C 191000 195000
D 248000 184000
E 179000 139000
Average 281800 227600
Coefficient of variation 38.8 % 34.4 %
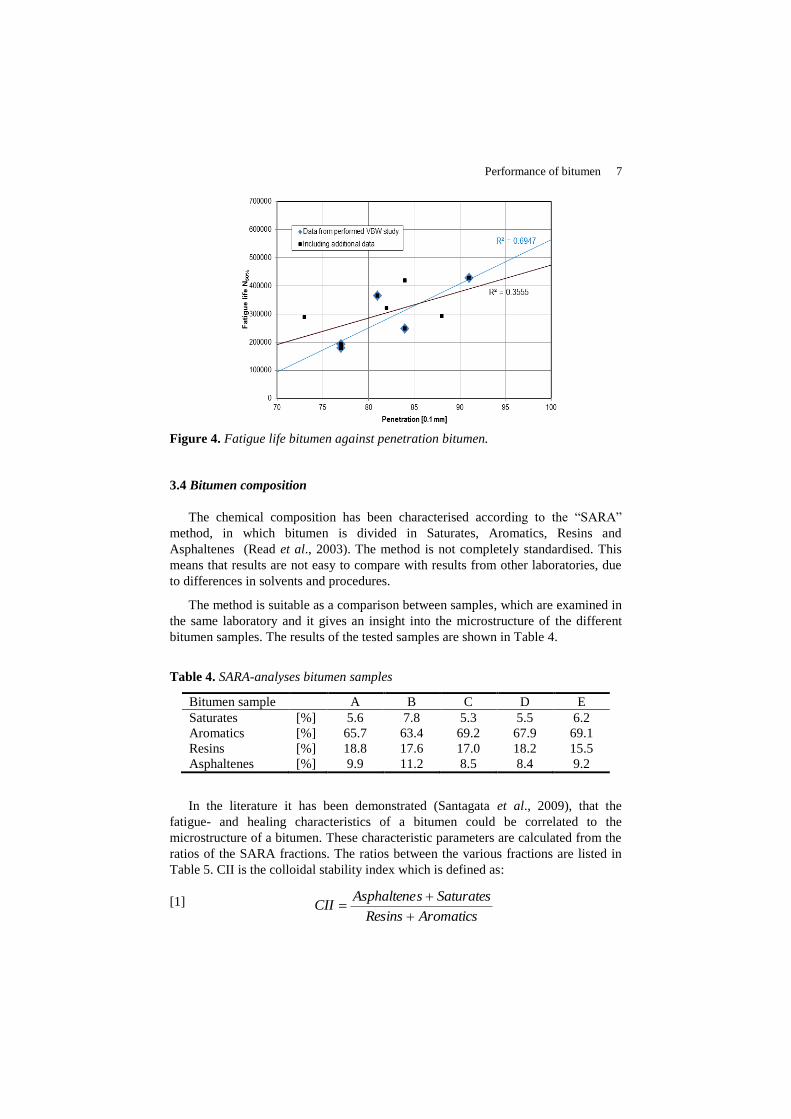
From the results it can be seen that bitumen samples A and B clearly show better
fatigue properties than the other bitumen samples. From the obtained results, it
seems as if there is some correlation with the penetration of the bitumen samples as
shown in figure 4. However, adding additional test data of additional suppliers of
bitumen 70/100 commissioned by an asphalt mixture production plant leads to
almost no relationship (R2=0.3555).
Performance of bitumen 7
AromaticsResins
SaturatessAsphalteneCII
Figure 4. Fatigue life bitumen against penetration bitumen.
3.4 Bitumen composition
The chemical composition has been characterised according to the ―SARA‖
method, in which bitumen is divided in Saturates, Aromatics, Resins and
Asphaltenes (Read et al., 2003). The method is not completely standardised. This
means that results are not easy to compare with results from other laboratories, due
to differences in solvents and procedures.
The method is suitable as a comparison between samples, which are examined in
the same laboratory and it gives an insight into the microstructure of the different
bitumen samples. The results of the tested samples are shown in Table 4.
Table 4. SARA-analyses bitumen samples
Bitumen sample A B C D E
Saturates [%] 5.6 7.8 5.3 5.5 6.2
Aromatics [%] 65.7 63.4 69.2 67.9 69.1
Resins [%] 18.8 17.6 17.0 18.2 15.5
Asphaltenes [%] 9.9 11.2 8.5 8.4 9.2
In the literature it has been demonstrated (Santagata et al., 2009), that the
fatigue- and healing characteristics of a bitumen could be correlated to the
microstructure of a bitumen. These characteristic parameters are calculated from the
ratios of the SARA fractions. The ratios between the various fractions are listed in
Table 5. CII is the colloidal stability index which is defined as:
[1]
8 EATA 2013
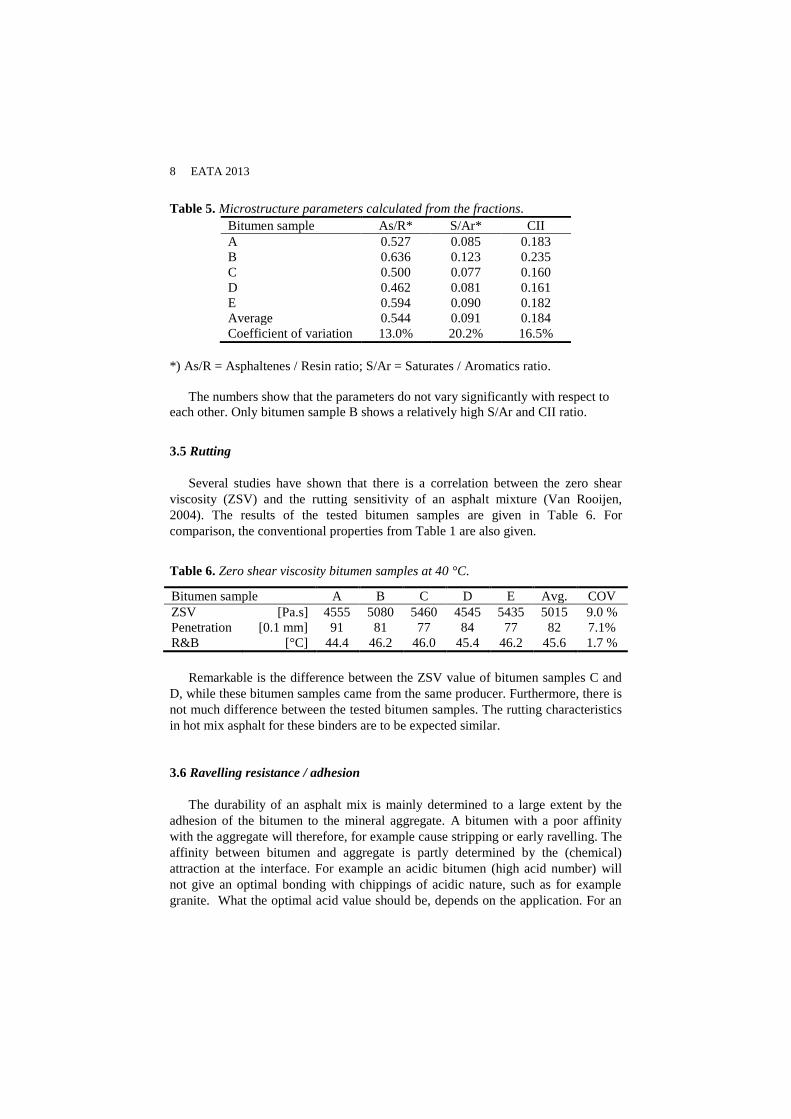
Table 5. Microstructure parameters calculated from the fractions.
Bitumen sample As/R* S/Ar* CII
A 0.527 0.085 0.183
B 0.636 0.123 0.235
C 0.500 0.077 0.160
D 0.462 0.081 0.161
E 0.594 0.090 0.182
Average 0.544 0.091 0.184
Coefficient of variation 13.0% 20.2% 16.5%
*) As/R = Asphaltenes / Resin ratio; S/Ar = Saturates / Aromatics ratio.
The numbers show that the parameters do not vary significantly with respect to
each other. Only bitumen sample B shows a relatively high S/Ar and CII ratio.
3.5 Rutting
Several studies have shown that there is a correlation between the zero shear
viscosity (ZSV) and the rutting sensitivity of an asphalt mixture (Van Rooijen,
2004). The results of the tested bitumen samples are given in Table 6. For
comparison, the conventional properties from Table 1 are also given.
Table 6. Zero shear viscosity bitumen samples at 40 °C.
Bitumen sample A B C D E Avg. COV
ZSV [Pa.s] 4555 5080 5460 4545 5435 5015 9.0 %
Penetration [0.1 mm] 91 81 77 84 77 82 7.1%
R&B [°C] 44.4 46.2 46.0 45.4 46.2 45.6 1.7 %
Remarkable is the difference between the ZSV value of bitumen samples C and
D, while these bitumen samples came from the same producer. Furthermore, there is
not much difference between the tested bitumen samples. The rutting characteristics
in hot mix asphalt for these binders are to be expected similar.
3.6 Ravelling resistance / adhesion
The durability of an asphalt mix is mainly determined to a large extent by the
adhesion of the bitumen to the mineral aggregate. A bitumen with a poor affinity
with the aggregate will therefore, for example cause stripping or early ravelling. The
affinity between bitumen and aggregate is partly determined by the (chemical)
attraction at the interface. For example an acidic bitumen (high acid number) will
not give an optimal bonding with chippings of acidic nature, such as for example
granite. What the optimal acid value should be, depends on the application. For an
Performance of bitumen 9
alkaline type of mineral aggregate a high acid value of the bitumen is favourable.
The acid values of the tested bitumen samples are given in table 7.
The durability of the aggregate – binder bonding was further tested with the
modified Vialit plate shock test using Moraine gravel (Goos, 2001). This test
measures the cohesive and adhesive properties of a bitumen film under high
frequency ―shock loading‖ conditions versus temperature. The results obtained in
this test are in particular of importance for the application of the bitumen in surface
dressings and in porous asphalt. Moraine gravel has been chosen, because this type
of mineral aggregate is generally used and has a (light) acidic character. The results
are also given in table 7.
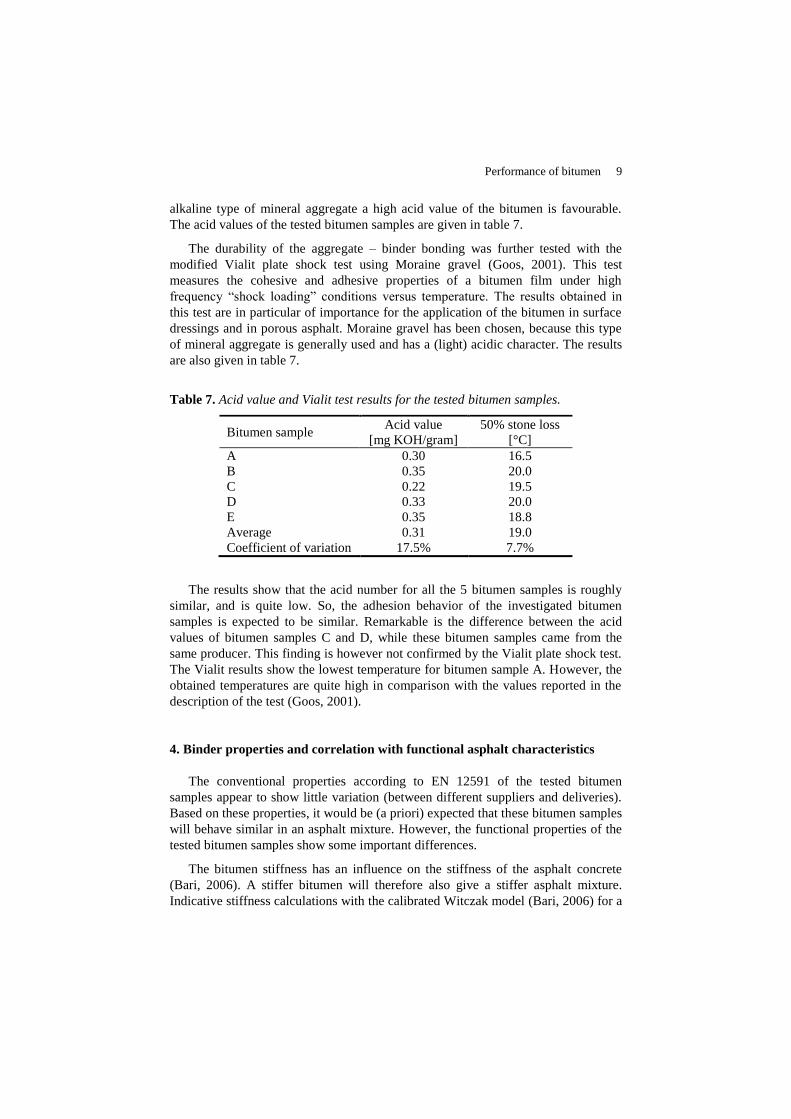
Table 7. Acid value and Vialit test results for the tested bitumen samples.
Bitumen sample Acid value
[mg KOH/gram]
50% stone loss
[°C]
A 0.30 16.5
B 0.35 20.0
C 0.22 19.5
D 0.33 20.0
E 0.35 18.8
Average 0.31 19.0
Coefficient of variation 17.5% 7.7%
The results show that the acid number for all the 5 bitumen samples is roughly
similar, and is quite low. So, the adhesion behavior of the investigated bitumen
samples is expected to be similar. Remarkable is the difference between the acid
values of bitumen samples C and D, while these bitumen samples came from the
same producer. This finding is however not confirmed by the Vialit plate shock test.
The Vialit results show the lowest temperature for bitumen sample A. However, the
obtained temperatures are quite high in comparison with the values reported in the
description of the test (Goos, 2001).
4. Binder properties and correlation with functional asphalt characteristics
The conventional properties according to EN 12591 of the tested bitumen
samples appear to show little variation (between different suppliers and deliveries).
Based on these properties, it would be (a priori) expected that these bitumen samples
will behave similar in an asphalt mixture. However, the functional properties of the
tested bitumen samples show some important differences.
The bitumen stiffness has an influence on the stiffness of the asphalt concrete
(Bari, 2006). A stiffer bitumen will therefore also give a stiffer asphalt mixture.
Indicative stiffness calculations with the calibrated Witczak model (Bari, 2006) for a
10 EATA 2013
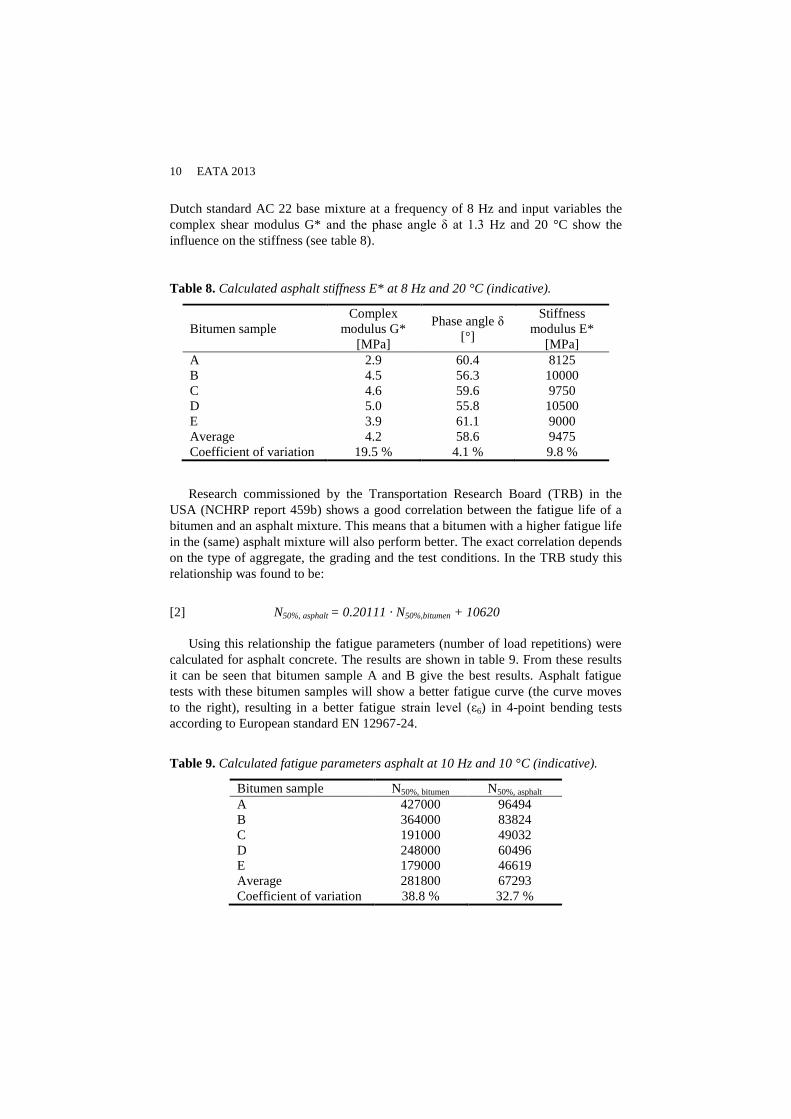
Dutch standard AC 22 base mixture at a frequency of 8 Hz and input variables the
complex shear modulus G* and the phase angle δ at 1.3 Hz and 20 °C show the
influence on the stiffness (see table 8).
Table 8. Calculated asphalt stiffness E* at 8 Hz and 20 °C (indicative).
Bitumen sample
Complex
modulus G*
[MPa]
Phase angle δ
[°]
Stiffness
modulus E*
[MPa]
A 2.9 60.4 8125
B 4.5 56.3 10000
C 4.6 59.6 9750
D 5.0 55.8 10500
E 3.9 61.1 9000
Average 4.2 58.6 9475
Coefficient of variation 19.5 % 4.1 % 9.8 %
Research commissioned by the Transportation Research Board (TRB) in the
USA (NCHRP report 459b) shows a good correlation between the fatigue life of a
bitumen and an asphalt mixture. This means that a bitumen with a higher fatigue life
in the (same) asphalt mixture will also perform better. The exact correlation depends
on the type of aggregate, the grading and the test conditions. In the TRB study this
relationship was found to be:
[2] N50%, asphalt = 0.20111 · N50%,bitumen + 10620
Using this relationship the fatigue parameters (number of load repetitions) were
calculated for asphalt concrete. The results are shown in table 9. From these results
it can be seen that bitumen sample A and B give the best results. Asphalt fatigue
tests with these bitumen samples will show a better fatigue curve (the curve moves
to the right), resulting in a better fatigue strain level (ε6) in 4-point bending tests
according to European standard EN 12967-24.
Table 9. Calculated fatigue parameters asphalt at 10 Hz and 10 °C (indicative).
Bitumen sample N50%, bitumen N50%, asphalt
A 427000 96494
B 364000 83824
C 191000 49032
D 248000 60496
E 179000 46619
Average 281800 67293
Coefficient of variation 38.8 % 32.7 %
Performance of bitumen 11
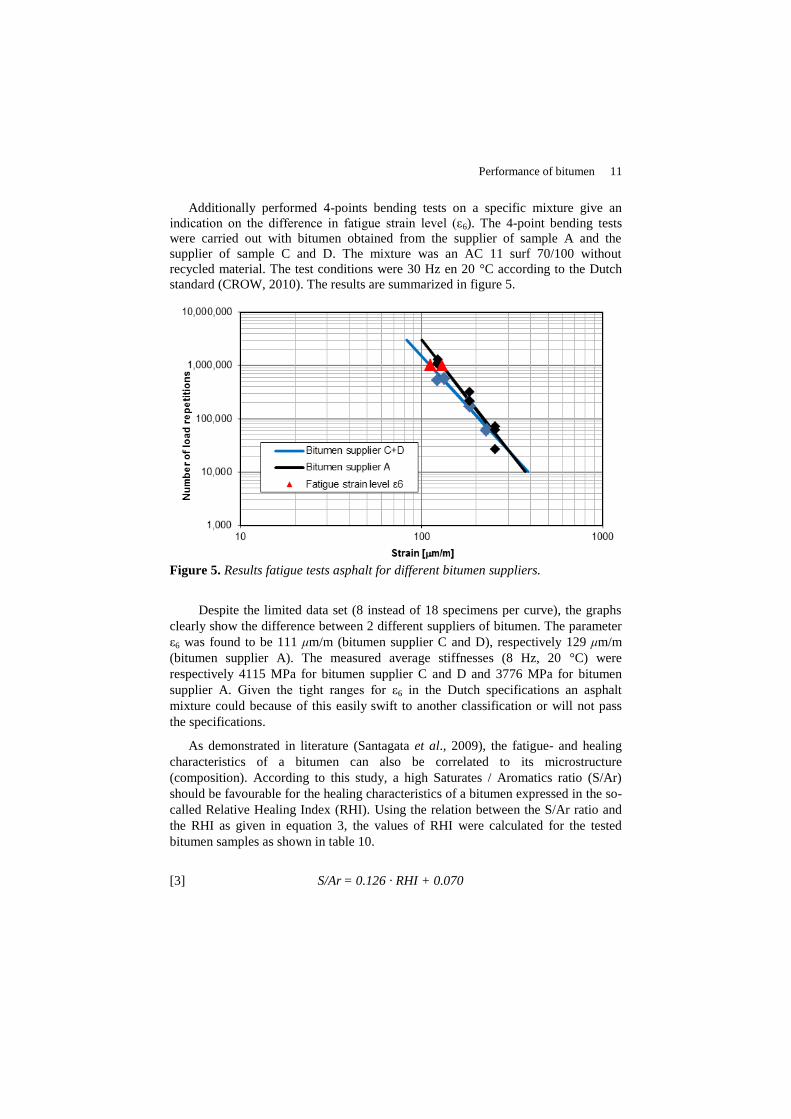
Additionally performed 4-points bending tests on a specific mixture give an
indication on the difference in fatigue strain level (ε6). The 4-point bending tests
were carried out with bitumen obtained from the supplier of sample A and the
supplier of sample C and D. The mixture was an AC 11 surf 70/100 without
recycled material. The test conditions were 30 Hz en 20 °C according to the Dutch
standard (CROW, 2010). The results are summarized in figure 5.
Figure 5. Results fatigue tests asphalt for different bitumen suppliers.
Despite the limited data set (8 instead of 18 specimens per curve), the graphs
clearly show the difference between 2 different suppliers of bitumen. The parameter
ε6 was found to be 111 μm/m (bitumen supplier C and D), respectively 129 μm/m
(bitumen supplier A). The measured average stiffnesses (8 Hz, 20 °C) were
respectively 4115 MPa for bitumen supplier C and D and 3776 MPa for bitumen
supplier A. Given the tight ranges for ε6 in the Dutch specifications an asphalt
mixture could because of this easily swift to another classification or will not pass
the specifications.
As demonstrated in literature (Santagata et al., 2009), the fatigue- and healing
characteristics of a bitumen can also be correlated to its microstructure
(composition). According to this study, a high Saturates / Aromatics ratio (S/Ar)
should be favourable for the healing characteristics of a bitumen expressed in the so-
called Relative Healing Index (RHI). Using the relation between the S/Ar ratio and
the RHI as given in equation 3, the values of RHI were calculated for the tested
bitumen samples as shown in table 10.
[3] S/Ar = 0.126 · RHI + 0.070

12 EATA 2013
Table 10. Calculated values for RHI
Bitumen sample A B C D E
RHI 0.121 0.421 0.052 0.087 0.157
The table shows that the capability for healing of bitumen sample B seems to be
the highest and for bitumen sample C seems to be the lowest.
Furthermore, the chemical composition is also reflected in the colloidal stability
index (CII), which has a correlation with the fatigue life of a bitumen (Santagata et
al., 2009). A high value should give a better (bitumen) fatigue life than a lower
value. The performed DSR fatigue tests show that this correlation is not always
valid. For bitumen sample B (relative high CII) the theory is true, but for bitumen
sample A (low CII) it is not confirmed (see tables 5 and 9).
5. Conclusions and recommendations
From the results of this (limited) study, it can be concluded that different
deliveries of bitumen, which are apparently equal (according to the traditional
specifications currently part of EN 12591), can vary considerably in performance
when applied in asphalt mixtures.
Functional tests suggest that especially the fatigue life of a bitumen can vary
significantly. Correlations with functional asphalt properties show that this has
influence on the performance of an asphalt pavement. CE-marking tests of asphalt
seems to confirm this finding. To validate the (theoretical) results of the functional
asphalt properties, more 4-points bending fatigue tests on (different) asphalt
mixtures have to be carried out.
The traditional specifications according to EN 12591 lack an (easy to apply)
specification for the fatigue life of bituminous binders. DSR fatigue testing e.g.
according to the RILEM test proposal should be included. To validate the findings
testing of bitumen from more exotic sources is also advisable.
6. Bibliography
Santagata E., Baglieri O., Dalmazzo D., Tsantilis L., ―Rheological and chemical investigation
on the damage and healing properties of bituminous binders‖, Journal of the Association
of Asphalt Paving Technologists, Vol. 78, 2009, Minneapolis.
De Jonghe T., De Bondt A., Goos D., Hoppen H., Van Rooijen R., Steernberg K., Teugels
W., ―Development of a PMB pre-selection method for airfield pavements‖, Eurasphalt &
Eurobitume Congress, Vienna, 2004.
RILEM, Round Robin Binder Fatigue Test – Second Phase RILEM TC 182 ATB, TG1
―Binders‖, 2008

Performance of bitumen 13
Read J., Whiteoak D., The Shell Bitumen Handbook, Fifth edition, Londen, 2003.
Goos D., ―Description of the Plate Shock Test procedure‖, Nynas Bitumen information sheet,
Modified test procedure based on EN 12272-3, October 2001.
Medani T., Huurman M., Molenaar A., ―On the computation of master curves for bituminous
mixes‖, Eurasphalt & Eurobitume Congress, Vienna, 2004.
Bari J., Witczak W., ―Development of a new revised version of the Witczak E* predictive
model for hot mix asphalt mixtures‖, Journal of the Association of Asphalt Paving
Technologists, Savannah, volume 75, 2006, Georgia.
Van Rooijen R, De Bondt A., ―Experience with the zero-shear viscosity concept to
characterise rutting‖, Eurasphalt & Eurobitume Congress, Vienna, 2004.
NCHRP report 459b, « Characterization of Modified Asphalt Binders in Superpave Mix
Design », TRB, Washington D.C., 2001.
CROW, Standaard RAW Bepalingen 2010, Dutch tender specifications (in Dutch), Ede, 2010.
Recommended