PERFORMANCE EVALUATION OF BIOMETRIC SYSTEM
YOUNIS ELMADANY HAMED
A project report submitted in partial
fulfillment of the requirement for the award for the Degree of
Master of Engineering
(Electrical-Electronics & Telecommunications)
Faculty of Electrical Engineering
Universiti Teknologi Malaysia
APRIL 2007

iii
Dedication to my parents my Dad, Elmadany Hamed
Mum, Amina Haid
Brothers and sisters
Thank you for your love, support, prayers,
and encouragement.

iv
ACKNOWLEDGEMENTS
By the name of ALLAH and precious prayer on his profit Mohamed, I grateful
ALLAH to give me the ability to reach this level of knowledge by making good people
helps me, support me, and guide me in this work and gave me the advices to make this
work as good as possible my supervisor: Prof. Ir. Dr. Sheikh Hussain Shaikh Salleh and
Amar K. Arief, and all my lecturers during my master course.
I acknowledge sincerely with thanks the many contributions of all those who have
helped in the preparation of this thesis.
v
ABSTRACT
Since biometrics may used to ensure that a person accessing information is
authorized to do so, interest in biometrics for information assurance has increased
recently. New biometric applications are constantly being announced while at the same
time new spoofing technology is being developed to defeat them. One approach to
overcoming the problem of spoofing is the use of multimodal biometric fusion. Most
current research is focused on overcoming the deficiencies of a single biometric trait or
reducing the false acceptance rate, both without any emphasis on the false rejection rate.
Multimodal biometric fusion combines measurements from different biometric traits to
enhance the strengths and diminish the weaknesses of the individual measurements. In
this project we considered three types of biometrics techniques are fingerprint, hand-
scan, and voice-scan. This project examines the use of cost function to set the threshold
point such that an optimization of false acceptance and false rejection rate can be
achieved. Other minimum cost thresholds with different setting of FA and FR prior
probabilities and costs are also shown to be better than EER in terms of total cost. The
experimental results for voice-scan show that the minimum cost is better than EER in
term of combination digits, also the experiments also show that by using cost function
the new threshold be more accurate and by that one could be able to find new FR and
FA which provide a new EER, for example the EER=5.29% for 6 digits in normal case
and by using cost function the EER became 5.28%. The experimental results on the
digits combination show the cost becomes less whenever the number of combination
digits becomes bigger. For 2 digits combination the min-cost is 12.5 while it is 5.287 for
6 digits combination. On the hand-scan and fingerprint-scan the experimental results
were perfect by the methods were used in these tasks. Hence, by considering the cost
vi
function as one way to calculate the cost for any multimodal biometric system, the
different costs depending on the application, become easier to provide.
ABSTRACT
Sejak teknologi biometrik telah diterimapakai dalam memastikan pengguna yang
mendapatkan sesuatu maklumat adalah pengguna yang sah, minat terhadap teknologi ini
sentiasa meningkat. Aplikasi baru teknologi ini sentiasa muncul dan dalam masa yang
sama, teknologi untuk mengalahkan sistem ini turut dibangunkan oleh sesetengah pihak.
Salah satu cara untuk mengelakkan usaha ini ialah dengan menggunakan gabungan
biometrik. Kebanyakan penyelidikan terkini tertumpu pada usaha mengatasi kelemahan
sistem biometrik tunggal atau mengurangkan ’false acceptance rate’ (FAR), tanpa
memberi penekanan pada ’false rejection rate’ (FRR). Dalam projek ini, 3 sistem
biometrik telah digunakan iaitu pengecaman jari, pengecaman tangan dan pengecaman
suara. Projek ini mengkaji penggunaan fungsi kos untuk menetapkan nilai ambang
(’threshold’) bagi membolehkan FAR dan FRR yang optimum diperolehi. Nilai ambang
daripada kos minimum dengan pelbagai kos dan kebarangkalian awalan FA dan FR
memberikan keputusan yang lebih baik dari EER dari segi jumlah kos. Keputusan
eksperimen untuk pengecaman suara menunjukkan kos minimum adalah lebih baik
daripada EER untuk kombinasi digit. Eksperimen juga menunjukkan bahawa dengan
menggunakan fungsi kos, nilai ambang yang diperolehi adalah lebih tepat. Seterusnya
nilai FR dan FA yang baru boleh diperolehi, yang memberikan EER yang baru. Sebagai
contoh, EER bagi kombinasi 6 digit ialah 5.29% manakala menggunakan fungsi kos,
nilai EER yang baru ialah 5.28%. Nilai kos akan semakin berkurang apabila bilangan
kombinasi digit bertambah. Untuk kombinasi 2 digit, kos minimum ialah 12.5 manakala
bagi kos minimum bagi kombinasi 6 digit ialah 5.287. Keputusan bagi pengecaman
tangan dan jari memberikan keputusan yang sempurna berdasarkan kaedah yang
digunakan dalam projek ini. Oleh itu, dengan menggunakan fungsi kos sebagai cara
vii
mendapatkan kos bagi mana-mana sistem gabungan biometrik, kos yang berbeza
berdasarkan aplikasi boleh ditetapkan dengan mudah.
TABLE OF CONTENTS
CHAPTER TITLE
PAGE
TITLE PAGE
ADMISSION PAGE
DEDICATION
ACKNOWLEDGEMENT
ABSTRACT
ABSTRAK
TABLE OF CONTENTS
LIST OF TABLES
LIST OF FIGURES
LIST OF ABBREVIATIONS
LIST OF APPENDICES
i
ii
iii
iv
v
vi
vii
xiii
xiv
xvi
xix
1 PROJECT BACKGROUND
1.0 Introduction
1.1 Problem statement
1.2 Project Objectives
1.3 Project Scope and Methodology
1.3.1 Methodology
1
1
2
3
3
4
viii
1.4 Thesis Organization
5
2 LITERATURE REVIEW
2.0 Background of Research Problem
2.1 Previous Work on Speaker Verification and
Identification
2.2 Voice Scan
2.2.1 Overview of Voice Scan
2.2.2 Voice Scan Biometric: How it Works
2.2.3 Voice Scan Biometric Strengths and
Weaknesses
2.2.4 Voice Scan Biometric Applications
2.2.5 Pattern Matching
6
6
8
10
10
11
12
13
13

ix
3 PROJECT METHODOLOGY
3.0 Introduction
3.1 Project Outline
3.1.1 Overview of Speaker Recognition
3.1.2 Overview of Mel-Frequency Cepstral
Coefficients (MFCC) Algorithm
3.1.3 Overview of Vector Quantization
3.1.4 Overview of Hidden Markov Models
(HMM) Algorithm
3.1.5 Threshold Setting
3.2 Identification
3.3 Verification
15
15
15
16
18
20
20
22
22
23
4 FINGERPRINT BIOMETRIC
4.0 Introduction
4.1 Types of Fingerprint
4.2 Fingerprint Recognition System
4.3 The History of Fingerprints
4.3.1 Why Fingerprint Identification
4.4 Fingerprint Processing
4.4.1 Image Processing Stage
4.4.2 Feature Extraction Stage
4.4.3 Minutiae Extraction
4.4.4 Minutiae Validation
4.4.5 Matching Stage
24
24
25
27
27
28
30
30
30
31
32
33
5 HAND-SCAN GEOMETRY BIOMETRIC 34
x
5.0 Introduction
5.1 How Hand-Scan Works
5.2 Past Projects
5.2.1 A Hand Geometry-Based Verification
System
5.2.2 Deformable Matching of Hand Shapes for
Verification
5.2.3 Web-Access using Biometrics
5.3 Template Generation and Matching
5.4 Applications
5.5 Strengths and Weakness
5.5.1 Strengths
5.5.2 Weaknesses
5.6 Hand Geometry vs Fingerprints
5.7 Combining Biometric Methods
5.8 Registering the Hand
5.9 Security
5.10 Environment
34
35
36
36
37
37
37
37
38
38
38
39
39
40
40
41
6 ACCURACY PERFORMANCE ANALYSIS OF
MULTIMODAL BIOMERIC SYSTEM
6.0 How the Biometric System is Evaluated
6.1 Introduction
6.2 Information Fusion in Biometric
6.3 False Acceptance and False Rejection Rates
6.4 Multi-Modal Error Rate (MMER)
6.5 Failure to Enroll Rate (FTE, also FER)
6.6 False Identification Rate (FIR)
42
42
42
43
44
45
47
48
xi
6.7 Equal Error Rate (EER)
6.7.1 EER Threshold
6.8 Cost Function
6.9 Hit-Rate
6.10 Receiver Operation Curve (ROC)
6.10.1 How Does One Determine The Receiver
Operating Characteristic (ROC) of a Biometric
System?
6.10.2 What Is Essential When Comparing The
ROC Performance Of Biometric Systems?
6.11 Cost Function and ROC
6.12 Separability of a Biometric
6.13 Detection Error Trade-off Curve (DET)
6.14 Advantages and Disadvantage of Some Biometrics
6.15 Combination of Multibiometric
6.16 Conclusion of Using Multi-Biometric System
48
49
50
51
52
53
54
56
56
58
58
61
61
7 DATABASE DESIGN
7.0 Introduction
7.1 TIDIGIT Database Concept
7.2 Description of speakers
7.3 Description of Database in this Project
7.3.1 Vocabulary Definition
7.3.2 Database engine
7.4 Speaker Errors
63
63
63
64
66
66
69
70
xii
8 RESULT DISCUSSION
8.0 Introduction
8.1 Analysis for Single Digit
8.1.1 Single Digit Verification
8.1.2 Hit-Rate Curve
8.1.3 ROC in Verification stage
8.1.4 DET in Verification Stage
8.1.5 Identification
8.2 Analysis of Digit Combination
8.2.1 Digital Combination Identification
8.3 ROC Curve in Digit Combination
8.4 Hit-Rate in Digit Combination
8.5 DET Curve in Digit Combination
8.6 Hand-Scan Results
8.7 Optimization of Threshold Decision
8.8 Conclusion
71
71
71
71
75
76
78
80
81
81
84
86
86
87
89
91
9 CONCLUSION
9.0 Project Summary
9.1 Benefits of the Project
9.2 Suggestion of Future Work
93
93
95
95
REFERENCES
98
APPENDIX A-F 102
xiii
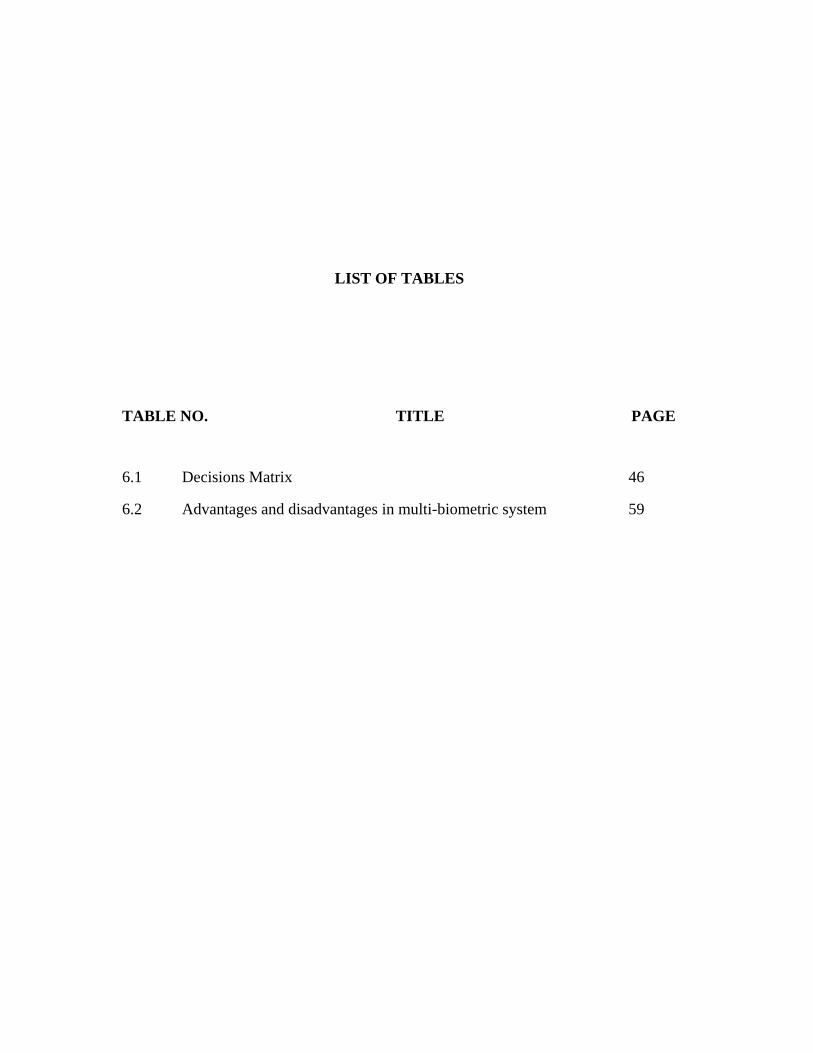
LIST OF TABLES
TABLE NO. TITLE PAGE
6.1 Decisions Matrix 46
6.2 Advantages and disadvantages in multi-biometric system 59
xiv
7.1 Distribution of speakers 64
7.2 Distribution of Job and Speakers 65
8.1 FA and FR with different threshold 72
8.2 shows some values of threshold in negative position 76
8.3 Shows FA, FR, TA and EER for single digit 81
8.4 Comparison of EER 82
8.5 Testing of combination digit for clients and impostors 83
8.6 Total cost in digit combination 85
8.7 Hand-scan result (Clients vs. Impostors) 89
8.8 Hand-scan result (Clients vs. Clients) 89
8.9 New FAR, FRR and new threshold point for seven
Digits.
90
8.10 New FAR, FRR and new threshold point for eight Digits 91
8.11 New FAR, FRR and new threshold point for five Digits 91
8.12 Min cost and EER 92
LIST OF FIGURES
FIGURE NO. TITLE PAGE
1.1 Multi-modal method 4
2.1 Speech processing 7

xv
2.2 Pattern matching 14
3.1 Methodology 16
3.2 Identification 17
3.3 Verification 18
3.4 MFCC transaction 19
3.5 Identification and Verification 23
4.1 Ridge ending and ridge bifurcation 26
4.2 Main process in identify a fingerprint 26
4.3 Image processing stage 30
4.4 Feature extraction stage 31
4.5 Minutia extraction 32
4.6 False minutiae structures 33
5.1 Hand-scan at the biometric center UTM entrance 38
5.2 Biometric Sensory Access 40
6.1 EER point 48
6.2 EER/CER 49
6.3 Q 0 is FA and Q1 is FR 51
6.4 Hit-Rate 52
6.5 ROC (Receiver Operation Curve) 52
6.6 DET curve 58
7.1 Example of two tokens list 67
7.2 List of six tokens to find the first digit in digit stream 67
7.3 10 transition lists as resource to the engine 68
7.4 Database engine 69
8.1 FA/FR vs. Threshold 72
8.2 Comparison between different Costs with EER by using
cost function
74
8.3 Different cost to one client depends on level of security
required
74
8.4 EER by using cost function vs. threshold 75
8.5 Hit-rate (threshold vs. 1-FR) 75

xvi
8.6 Relationship between (Hit-rat and FA) i. e ROC curve 76
8.7.a Standard ROC Curve 77
8.7.b Standard ROC Curve 77
8.8 ROC Curve can cross 78
8.9 FR vs. FA (DET) 79
8.10 Shows Standard shape of Hit-rate 79
8.11 Different settings to threshold 81
8.12 EER in Combination Digit 83
8.13 Total cost function in digit combination 83
8.14 ROC for digit combination 85
8.15 ROC Digit combinations for 2-Digits 85
8.16 ROC Digit combinations for 1-Digits 85
8.17 Hit rat in digit combination 86
8.18 DET Curve for digit combination 3-digits 87
8.19 DET Curve for digit combination 5-digits 87
8.20 Comparisons EER with Min Cost 91
9.1 Methodology of Multibiometric System 96
9.2 Three Biometric Device in One system 97
LIST OF ABREVIATIONS
µ/−
x - Mean
B - Boy
Bi/ Bk - Biometric Trait
C - Codebook
CCD - Charge-coupled device, an electronic light sensor used in digital
xvii
cameras
CER - Cross-over Error Rate
CM - Cross Match
Cm - Cepstral coefficients
C1&C2 - Client Cost & Imposter Cost
mc~ - Weighted cepstral coefficients 3-D - Three dimension picture
DET - Detection Error Trade-off
DFT - Discrete Fourier transform
Dj - Distortion in vector quantization
DTW - Dynamic Time Warping
EER - Equal Error Rate
En = EER - Square prediction error
FA - False Acceptance
FAR - False Acceptance Rate
FBAS - Full Multibiometric Adaptive System
FIR - False Identification Rate
FR - False Rejection
FRR - False Rejection Rate
FMR - False Match Rate
FNMR - False Non-Match Rate
FTA - Failure to Acquire
FTE/FER - Failure to Enroll
G - Girl
GFAR - Generalized False Acceptance Rate
GFRR - Generalized False Rejection Rate
GMM - Gaussian Mixture Model
H0 - Input Biometric Not From the Same Biometric
Hi - Input From Same Biometric
HMM - Hidden Markov Model
I - claimed identity
xviii
L - Lengths of frame of speech
LPC - Linear Predictive Coding
LPCC - Linear Predictive Coding Cepstral Coefficients
M - Similarity measure between two Fingerprint Images
M - Man
MAP - Minimum Adapted System
MFCC - Mel-Frequency Cepstrum Coefficients
MMER - Multi-Modal Error Rate
MS - Multiple similarity
MVE - Minimum Verification Error
Nm - Number of Templates of Database
NN - Nearest Nighbors
P( ) - Probability
Q - Number on input vector to be quantized
QNO - Prior Probability
QRR - =(FTA) Failure to Acquire
ROC - Receive Operating Characteristic
ROCA - Receive Operating Characteristic Area
RSI - Recognition System Inc
σ - Standard deviation
Sk - Normalized Matching Score
SI - Speaker Identification
SV - Speaker Verification
th - Threshold Parameter
Ti - EER Threshold
ti - Training vector in vector quantization
TV - Television
vi,j - Codebook vectors in vector quantization
VQ - Vector Quantization
VQ-CM - Combination of Vector quantization and cross match technique
W - Women
xix
0ω - True Imposter Class
1ω - True Enrollee Class
0ϖ - Corresponding True Imposter Class
1ϖ - Corresponding True Enrollee Class
wm - Weighting function
Wk - Weight Associated With a Biometric Trait
Xi - Score
Z - Scores η - Matching Threshold
LIST OF APPENDICIES
APPENDIX NO. TITLE PAGE
A Client List 102
A Identification 103
xx
A Verification 104
B Database List Sample (Client) 109
B Database List Sample (Imposter) 110
C Fingerprint 111
D Hand-Scan Geometry Biometric 117
E Identification Curves for Digit Combination Threshold 119
F Goldwave Software 126
CHAPTER I
PROJECT BACKGROUND
1.0 INTRODUCTION
On the basis of media hype alone, you might conclude that biometric passwords
will soon replace their alphanumeric counterparts with versions that cannot be stolen,
forgotten, lost, or given to another person. But what if the performance estimates of
these systems are far more impressive than their actual performance? To measure the
real-life performance of biometric systems, and to understand their strengths and
weaknesses better, we must understand the elements that comprise an ideal biometric
system (P. Jonathon et al., 2000).
Biometrics are automated methods of recognizing a person based on a
physiological or behavioral characteristic. Among the features measured are face,
fingerprints, hand geometry, handwriting, iris, retinal, vein, and voice. Biometric
technologies are becoming the foundation of an extensive array of highly secure
identification and personal verification solutions. As the level of security breaches and
transaction fraud increases, the need for highly secure identification and personal
verification technologies is becoming apparent.
Biometric-based solutions are able to provide for confidential financial
transactions and personal data privacy. The need for biometrics can be found in federal,
2
state and local governments, in the military, and in commercial applications. Enterprise-
wide network security infrastructures, government IDs, secure electronic banking,
investing and other financial transactions, retail sales, law enforcement, and health and
social services are already benefiting from these technologies.
Biometric-based authentication applications include workstation, network, and
domain access, single sign-on, application logon, data protection, remote access to
resources, transaction security and Web security. Trust in these electronic transactions is
essential to the healthy growth of the global economy. Utilized alone or integrated with
other technologies such as smart cards, encryption keys and digital signatures,
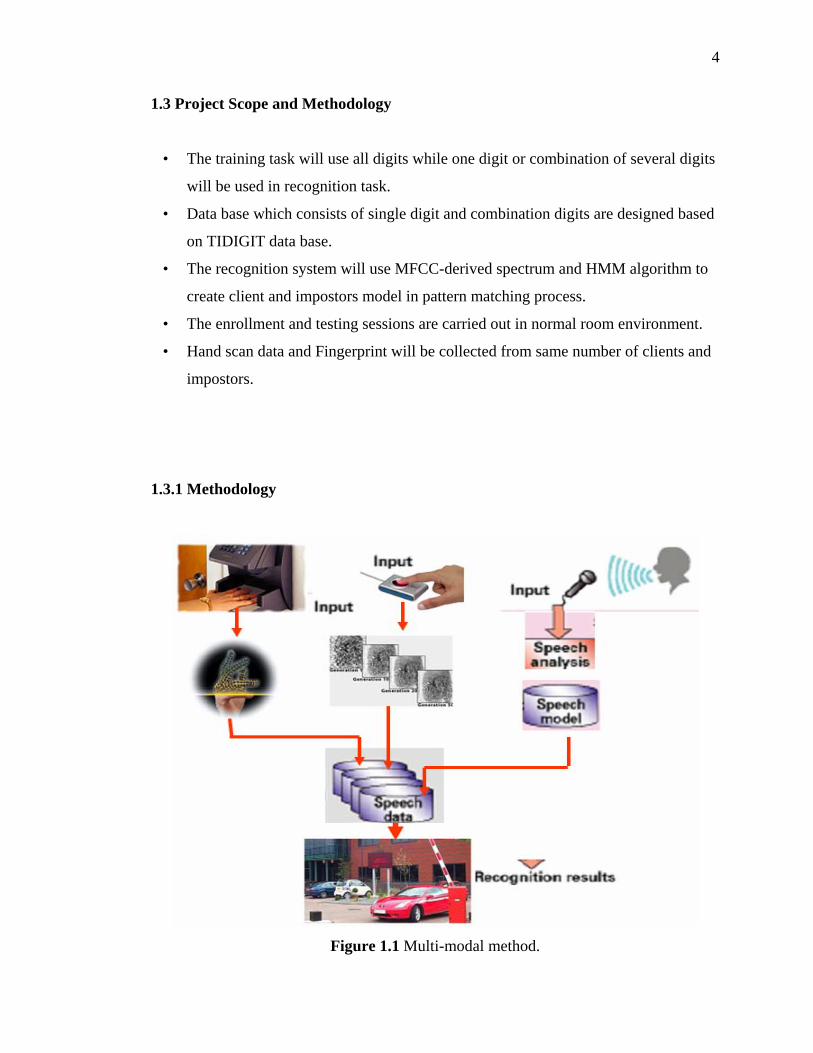
Here we focus on biometric applications that give the user some control over
data acquisition These applications recognize subjects from voice recognition hand-scan
geometry, and scanned fingerprints
The data collection in this project was done by using the set of available devices.
For collect the voice data had done by using Multispeech System (CSL model 4500)
with normal microphone (Shure dynamic lo). In hand-scan experimental the data was
collected by using Recognition System Handkey II. Lastly for the fingerprint part, the
data was collected by using a FIU81/PERS (Puppy suite from Sony).
1.1 Problem statement
A potentially more serious security concern occurs when someone uses the same
biometric in many systems or when many user biometrics are stored on a single system.
Specifically, once an attacker acquires the original biometric, he can use it to
compromise the security of many different systems. This potential, for identify theft is
much more serious for biometrics than passwords since if a password is stolen, it can be
3
easily changed. A biometric such as a fingerprint if is stolen it is difficult or impossible
to change. (Emin Martinian et al., 2005).
By using different biometrics, hand-scan and voice-scan together will reduce this
chance and make the system more secured.
Under the voice-scan biometric category the best (optimum) threshold setting will
be the one that gives the lowest FA or FR rate. Our task will be to solve this problem i.e.
optimize the FA and FR as possible by using an expected misclassification cost
(Masters, 1993). False acceptance errors are the ultimate concern of high security can be
traded off for a higher false rejection rate [Cample, 97]. Since we know the cost of FA or
FR error rate, the cost function can be used to find the optimum threshold so that the
minimum (lowest) total expected cost will be achieved.
1.2 Project Objectives
• To find the threshold which gives the optimum (best ) FR & FA errors rate for
speaker recognition task using cost function.
• To compare the performance of the obtained optimum threshold setting with EER
threshold setting.
• Analyze the recognition performance when word combinations are used as an
input to the speaker recognition system.
• Analyze performance when system is combined with hand-scan and fingerprint
biometrics.
4
1.3 Project Scope and Methodology
• The training task will use all digits while one digit or combination of several digits
will be used in recognition task.
• Data base which consists of single digit and combination digits are designed based
on TIDIGIT data base.
• The recognition system will use MFCC-derived spectrum and HMM algorithm to
create client and impostors model in pattern matching process.
• The enrollment and testing sessions are carried out in normal room environment.
• Hand scan data and Fingerprint will be collected from same number of clients and
impostors.
1.3.1 Methodology
Figure 1.1 Multi-modal method.
98
REFERENCES
A. .K. J. A. Ross and J. Z. Qian. (2001). “Information fusion in biometrics,” ‘in Proc.
3rd International Conference on Audio- and Video-Based Biometric Person
Authentication, Halmstad, Sweden, pp. 354-359, June 2001. http://citeseer.nj.nec.corn/rossOlinformation.h tml.
A. K. Ariff, Arief Ruhullah, M. Alwi, Sh-Hussain,Salleh. (2004) Centre for Biomedical
Engineering Faculty of Electrical Engineering Universiti Teknologi Malaysia 81310
Skudai, Johor, Malaysia
Atal, B.S. (1976). “Automatic Recognition of Speakers from Their Voices”.
Proceedings of the IEEE. Vol 64, No 4, April 1976. Pp 460-475.
Anil K. Jain and Arun Ross (2002). Appeared in Proc. International Conference on
Image Processing (ICIP), Rochester, New York
Arun Ross and Anil Jain (2007) www.biometrics.msc.edu/ Hand_proto.html. updated
By Feb 2007.
Becchetti C., Ricotti L. P.(2002). Speech Recognition Theory and C++ Implementation.
West Sussex: John Wiley & Sons Ltd. 122-301; 2002
Blight, Richard C. (1989). An exegetical summary of 1 & 2 Thessalonians. Dallas:
Summer Institute of Linguistics. 291 p.
99
Dr. Bhavani Thuraisingham (2005).The University of Texas at Dallas Biometric
Technologies: Some Physiological Biometrics October 5, 2005
Emin Martinian, Sergey Yekhanin, and Jonathan S.(2005). Yedidia Secure Biometrics
Via Syndromes 43rd Annual Allerton Conference on Communications, Control, and
Computing, (Monticello, IL) October 2005 28-
Fakotakis, N.; Dermatas, E.; and Kokkinakis, G. (1986). “Optimal Decision Threshold
for Speaker Verification”, Signal Processing III: Theories and Applications, Elsevier
Science Publishers B.V (North-Holland), 1986. Pp. 585-587.
Hong, K. S.( 2001). Implementation of Speech Recognition Using Hidden Markov
Models. Bachelor Thesis. Universiti Teknologi Malaysia. 1-120 ; 2001
Higgins, A., Bhaler, L.; Porter, J. (1993). “Voice Identification Using Nearest
Neighbor Distance Measure”. Proc. IEEE Int. Conf. Acoustics, Speech, and
Signal Processing, Minneapolis, MN. Pp 375-378.
Hermansky, H., Morgan, N. RASTA processing of speech. IEEE Transactions on
Speech and Audio Processing. Oct 1994. 2(4): 578 –589.
J. Kittler and E. F.( 2001). Roli, Decision-level fusaon in fingerprint uerification.
Springer Verlag, 2001.
J. W ang, Q . Z hang, K.( 2001). Ren, M ulti-scaling hierarchical structure analysis.
Joseph P. Campbell , Jr. ,Senior member IEEE.( 1997). Speaker Recognition. A tutorial,
27-June-1997.
Jittiwarangkul, N. et al.(1998). Thai Syllable Sementation for Connected Speech
Based on Energy. IEEE Asia-Pacific Conference on Circuits and Systems.
100
24-27 Nov 1998. Thailand: IEEE, 1998. 169-172.
L. H. A. K. Jain and Y.(1999). Kulkarni, “A multimodal biometric system using
fingerprint, face, and speech,” in Proc. 2nd International Conference on Audio- and
Video- Based Biometric Person Authentication, Halmstad, Sweden, pp. 182-187, March
1999. http://www.cse.msu.edu/cgiuser/
web/tech/document?NUM=98-32.
Master work.(2006). IMPLEMENTATION OF FINGERPRINT BIOMETRIC
TEMPLATE SYSTEM University technology Malaysia 2006.
Masters, T. (1993). “Practical Neural Network Recipes in C++”, Academic Press Inc.,
Canada.
Rabiner, L.R. (1989). “A Tutorial on Hidden Markov Models and Selected Applications
in Speech Recognition”. Proc. IEEE, Vol 77, Feb 1989. Pp 257-286.
Rabiner, L. and Juang, B. H.(1993). Fundamentals of Speech Recognition. Englewood
Cliffs, N.J.: Prentice Hall. 69-481 ;1993
Rosenberg, A.E.; Siohan, O.; Parthasarathy, S. (1998). “Speaker Verification Using
Minimum Verification Error Training”. Acoustics, Speech and Signal Processing, 1998.
Proceedings of the 1998 IEEE International Conference on, Vol:1, 1998. Pp. 105-108.
R. W. Frischholz and U.(2000). Dieckmann, “Bioid: A multimodal biometric
identification system,” IEEE Computer, vol. 33, pp. 64-68, February 2000.
R. Brunelli and D. Falavigna. (1995). “Person identification using multiple
cues,” IEEE Transactions on PAMI, vol. 17, pp. 955-966,
October 1995.
101
P. Jonathon Phillips Alvin Martin C.L. (2000). Wilson Mark Przybocki
National Institute of Standards and Technology .2000
Paper EEL 6586- Final project. (2002). A speaker aidentification and Verification
System. By Zhongmin Lin,. Qizhang Yin , and Weimin Zhang. In 04-24-2002.
Pierrot, J.B; Lindberg, J.; Koolwaij, J.; Hutter, H.P.; Genoud, D.; Blomberg, M.;
Bimbot, F. (1998). “A Comparison of a Priori Threshold Setting Procedures for Speaker
Verification in the Cave Project”. Acoustics, Speech, and Signal Processing, 1998.
Proceedings of the 1998 IEEE International Conference on, Vol:1, 1998. Pp. 125-128.
Parsons, T.W. (1987). “Voice and Speech Processing”. McGraw-Hill Inc. New
York, USA.
Quran Karem. Surah Al-Qiyamat (75:3-4).
Shochet, E. and D. Connolly, (Jan., 1981). "An Investigation into the Effects of
Dialectical Variation on Flight Plan Filing by Machine Recognition", Interim Report,
FAA-RD-80-115
S. K. Dahel and Q. Xiao .(2003).Accuracy Performance Analysis of Multimodal
Biometrics Information Assurance United States Military Academy,
West Point, NY June 2003
www.bromba.com/faq/biofaqe.htm#ROC Updated by Mar 2007.
www.biometricsinfo.org/ copy right Mar 2007
www.oninonin.com/fp/fmiru ..chinese_day-seal/jpg Updated in Fep. 2007
Recommended


![Biometric Standards documents/Standards... · Biometric Profiles Biometric [Application] Profile – a conforming subset or combination of base standards used to effect specific biometric](https://img.pdfslide.us/doc/110x75/5f711372ce578d4ee02aea91/biometric-standards-documentsstandards-biometric-profiles-biometric-application.jpg)