Performance Engineering Laboratories
Computer Engineering Department
King Fahd University of Petroleum & Minerals (KFUPM),
Dhahran
6/3/2002 2 © PEL
Agenda
Performance Engineering Laboratory (PEL) Independent performance evaluation Services Track record
Web server performance comparisons Streaming media server performance evaluation Network traffic analysis
Opportunities for working with us
6/3/2002 3 © PEL
Performance Engineering Laboratory (PEL) A facility established in computer engineering department at
KFUPM Services
Independent evaluation of client products Product spec’s evaluation Performance comparison with competitor’s products
Feedback to developers Technical marketing input
Network traffic analysis Target products and services
IT products Web servers, server accelerators, and streaming media servers
Network infrastructure products Proxy caches, LDAP serves, and layer-4 switches
High-end systems Parallel, SMP, and DSM systems
ISPs and carriers
6/3/2002 4 © PEL
Why Evaluate Performance Performance is central to computer systems
New hardware is typically faster than the existing one New software is supposed to be “better” than the existing one
Competition demands efficient products Marketing a product that is slower than its competitors is hard Highly efficient products can cut cost for customer
Performance is central to any R&D effort Need to compare similar architectures, algorithms, systems,
etc. Determine the efficacy of new designs Understand the differences between different systems
Comparison (meaningful!) of a product with competitor’s products
Sales team can’t provide it Sales team can effectively use it
6/3/2002 5 © PEL
Market Opportunities
Continued demand for client-server and IT products Large number of competing products
Performance is increasingly becoming the distinguishing factor among similar product
Users are becoming increasingly aware of the performance issues and demand efficient products
Time constraints to undertake detailed performance analysis
Especially true with small to medium sized companies with small product development teams
Performance evaluation often left for QA teams Goal of QA is to have a reliable, properly functioning product
rather than an efficient product Third-party performance engineers can greatly help
6/3/2002 6 © PEL
Independent Evaluation Concerns with independent performance evaluation
QA can do it Sales team can do it; even compare performance with
competitors Confidentiality may be compromised
Our vision Anyone can generate measurements but few can “read”
them to understand the story they tell Independent evaluation is significantly more credible for end
user or IT manager who decides to buy the product Sales team’s evaluation result is always predictable: “our”
product is orders of magnitude better than “their” product Predictable no information!!
Independent performance evaluation teams work closely with the developers in a professional manner
6/3/2002 7 © PEL
Services Primary services
Stand-alone product performance, QoS, and reliability analysis
Product Specs evaluation Comparative analysis Network traffic and workload characterization Modeling based analysis Application parallelization Application profiling and/or system monitoring
Other services Setup of in-house testing infrastructure Customized tools
Automated performance regression testing tools Training
6/3/2002 8 © PEL
Resources
We have two types of resources Skilled human resources A client-server based testing environment
6/3/2002 9 © PEL
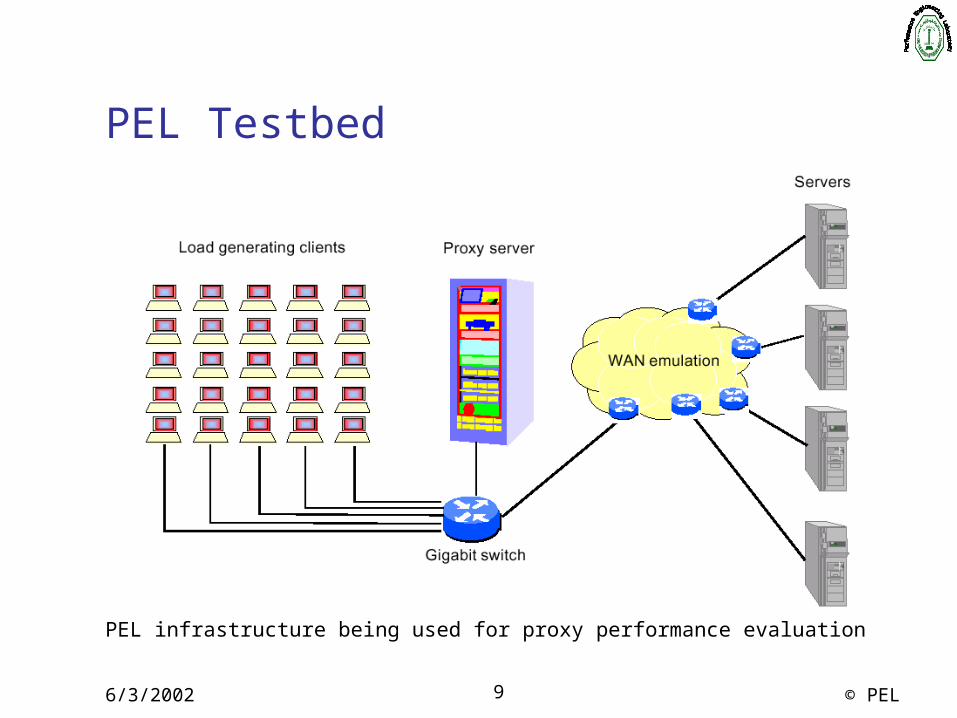
PEL Testbed
PEL infrastructure being used for proxy performance evaluation
6/3/2002 10 © PEL
Track Record
Performance evaluation projects Comparison of Apache and Microsoft IIS web servers Comparison of Darwin Quicktime and Microsoft Windows
Media Server Traffic analysis projects
A campus web traffic analysis Parallel application performance evaluation
Evaluation of automatically parallelized CFD code for high-end DSMs
A trace-driven and measurement based memory performance evaluation for parallel applications on DSMs
Design and evaluation of monitoring systems
6/3/2002 11 © PEL
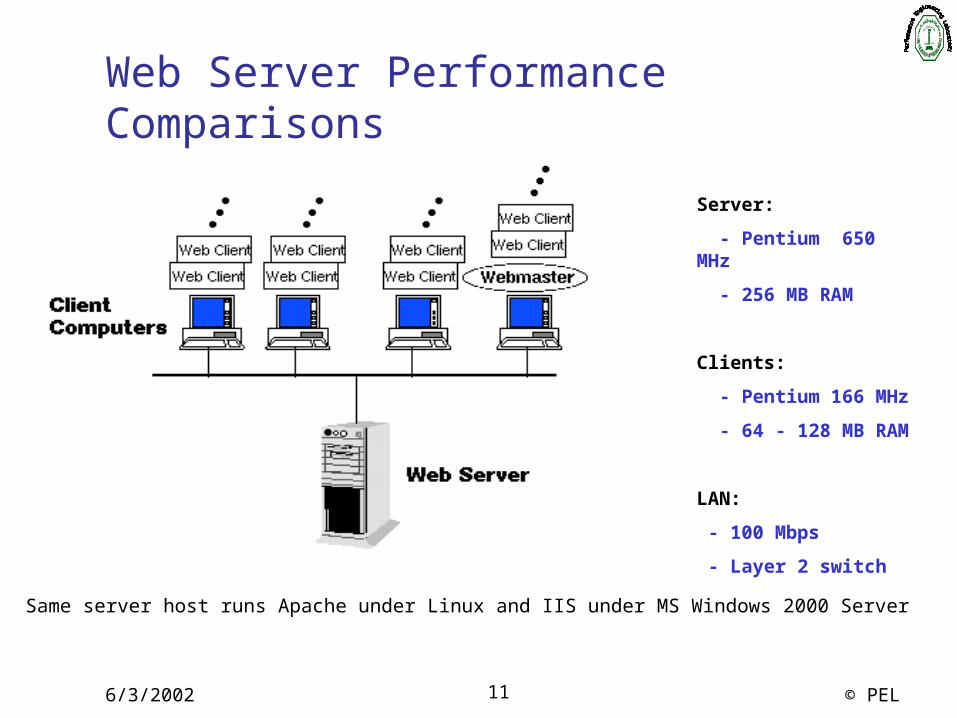
Web Server Performance Comparisons
Same server host runs Apache under Linux and IIS under MS Windows 2000 Server
Server:
- Pentium 650 MHz
- 256 MB RAM
Clients:
- Pentium 166 MHz
- 64 - 128 MB RAM
LAN:
- 100 Mbps
- Layer 2 switch
6/3/2002 12 © PEL
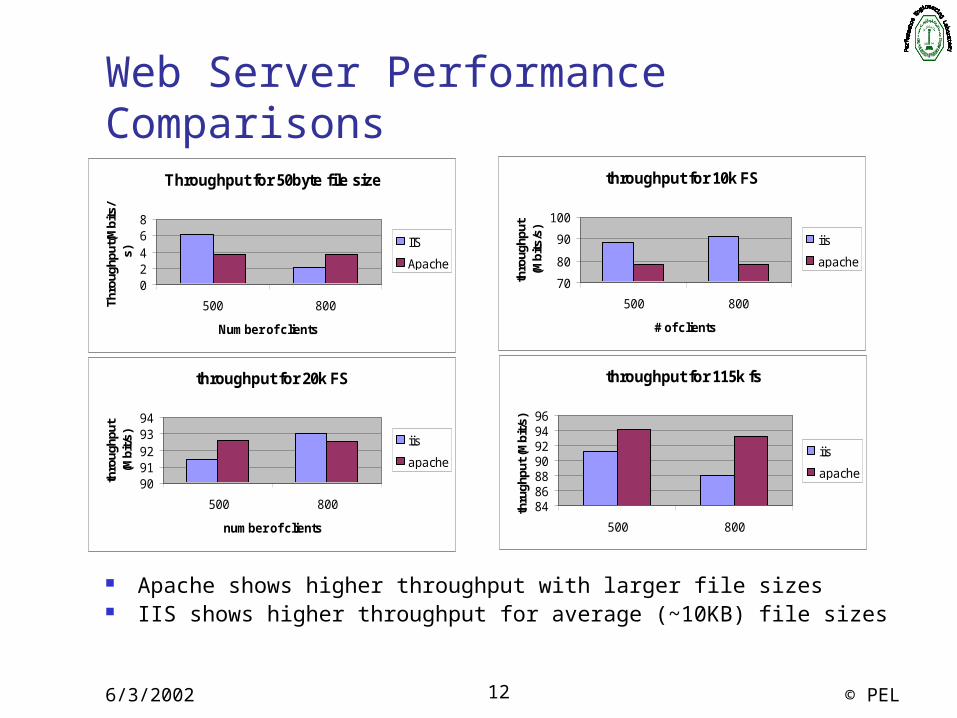
Web Server Performance Comparisons
Apache shows higher throughput with larger file sizes IIS shows higher throughput for average (~10KB) file sizes
Throughput for 50byte file size
02468
500 800
Number of clients
Thro
ughp
ut(M
bits
/s)
IIS
Apache
throughput for 10k FS
70
80
90
100
500 800
# of clients
thro
ughp
ut
(Mbi
ts/s
)
iis
apache
throughput for 20k FS
9091929394
500 800
number of clients
thro
ughp
ut
(Mbi
t/s)
iis
apache
throughput for 115k fs
84868890929496
500 800th
rugh
put (
Mbi
t/s)
iis
apache
6/3/2002 13 © PEL
Web Server Performance Comparisons
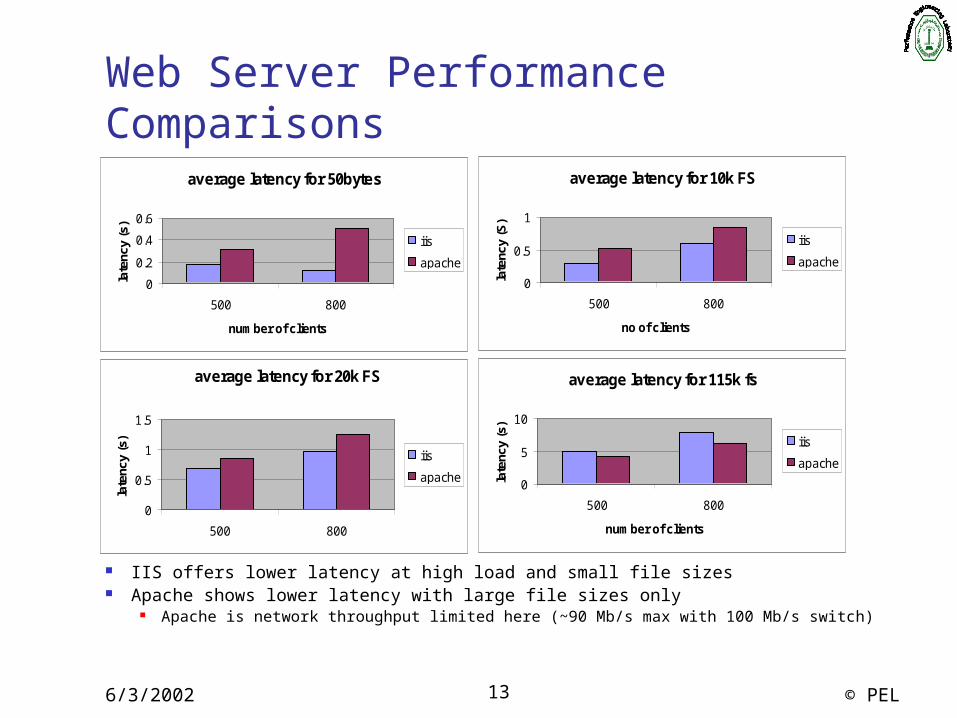
IIS offers lower latency at high load and small file sizes Apache shows lower latency with large file sizes only
Apache is network throughput limited here (~90 Mb/s max with 100 Mb/s switch)
average latency for 50bytes
0
0.2
0.4
0.6
500 800
number of clients
late
ncy
(s)
iis
apache
average latency for 10k FS
0
0.5
1
500 800
no of clients
late
ncy
(S)
iis
apache
average latency for 20k FS
0
0.5
1
1.5
500 800
late
ncy
(s)
iis
apache
average latency for 115k fs
0
5
10
500 800
number of clients
late
ncy
(s)
iis
apache
6/3/2002 14 © PEL
Web Server Performance Comparisons So, which web server is better
Apache can show better throughput but our results are limited due to available network bandwidth (100 Mb/s per port)
IIS shows high throughput and low latency for the average WWW document size (~10KB) case with high transaction loads
Other conclusion Usually, it is an exaggeration to say that one product is better
than the other This is usually true under specific workload conditions This information is useful for developers to tune their code
Performance evaluation by sales departments won’t tell this Also, don’t under-estimate Microsoft products on Windows
platforms…
6/3/2002 15 © PEL
Comparison of Streaming Media Servers
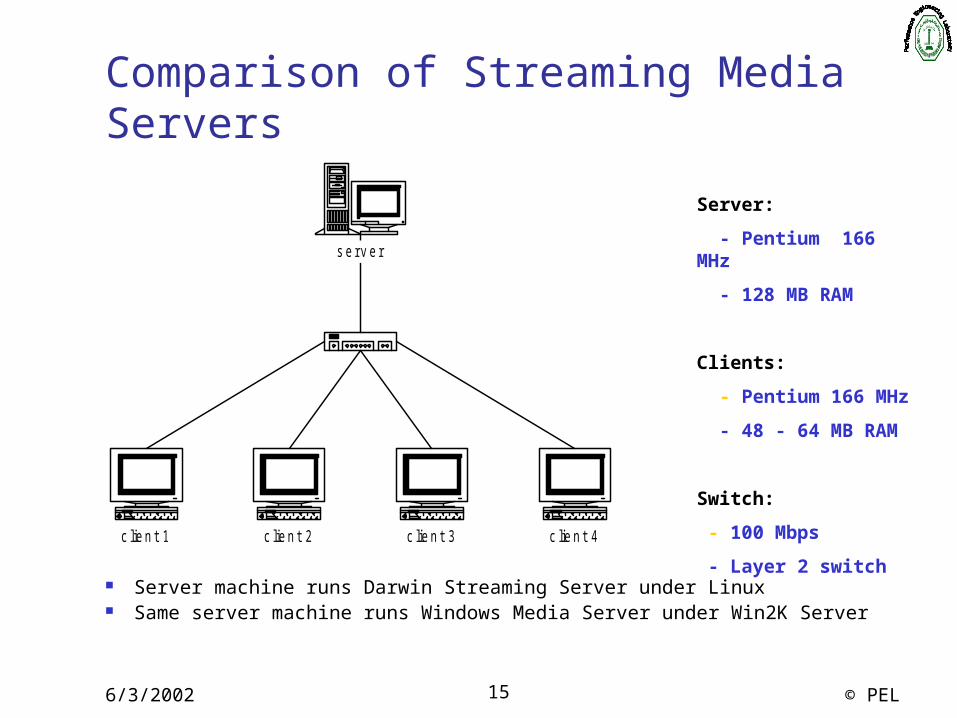
Server machine runs Darwin Streaming Server under Linux Same server machine runs Windows Media Server under Win2K Server
c lient 1 c lient 3 c lient 4c lient 2
s erv er
Server:
- Pentium 166 MHz
- 128 MB RAM
Clients:
- Pentium 166 MHz
- 48 - 64 MB RAM
Switch:
- 100 Mbps
- Layer 2 switch
6/3/2002 16 © PEL
Comparison of Streaming Media Servers
Average throughput (single, 300k)
0
5
10
15
20
25
30
4 100 400
Number of client requests
Avg
. th
rou
gh
pu
t (M
bp
s)
DSS
WMS
Server CPU Utilization (300k, multiple streams)
0
20
40
60
80
100
120
4 100 400
Number of client requests
CP
U % DSS
WMS
cache miss (multiple, 300k)
0
0.5
1
1.5
2
2.5
4 100 400
Number of client requests
cach
e m
iss/
sec
DSS
WMS
page faults (multiple, 300k)
0
10
20
30
40
50
4 100 400
Number of client requests
pag
e fa
ult
s/se
cDSS
WMS
6/3/2002 17 © PEL
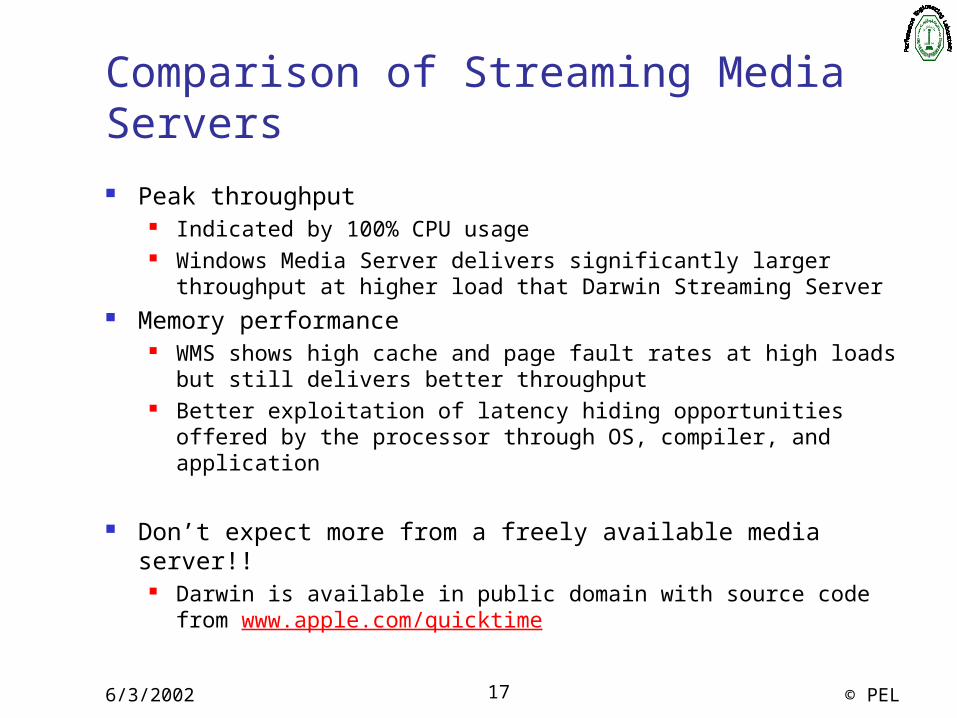
Comparison of Streaming Media Servers
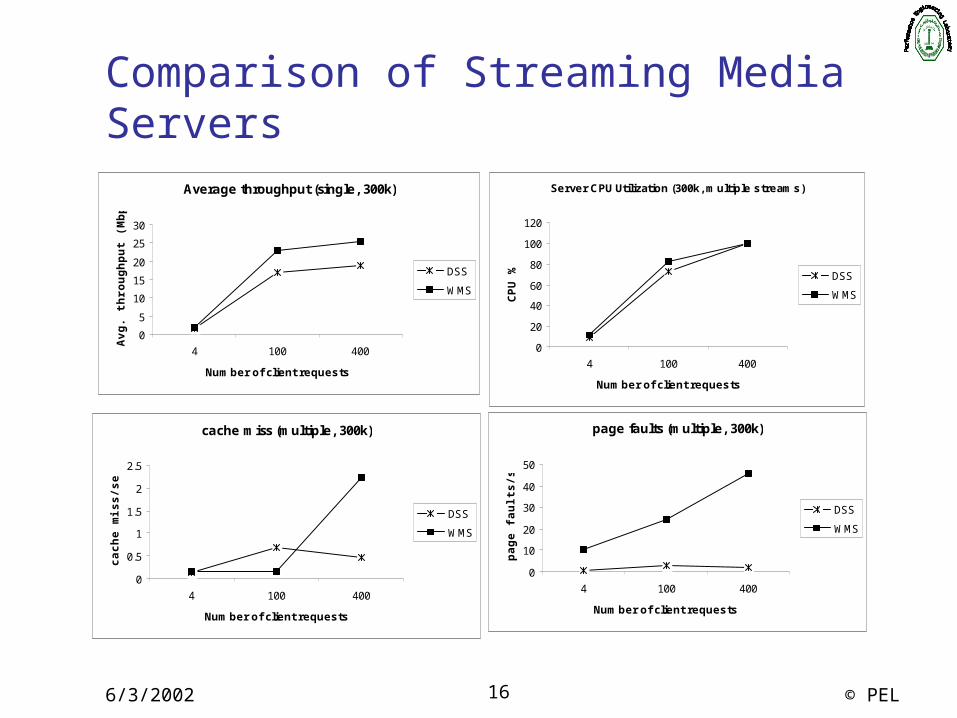
Peak throughput Indicated by 100% CPU usage Windows Media Server delivers significantly larger
throughput at higher load that Darwin Streaming Server Memory performance
WMS shows high cache and page fault rates at high loads but still delivers better throughput
Better exploitation of latency hiding opportunities offered by the processor through OS, compiler, and application
Don’t expect more from a freely available media server!!
Darwin is available in public domain with source code from www.apple.com/quicktime
6/3/2002 18 © PEL
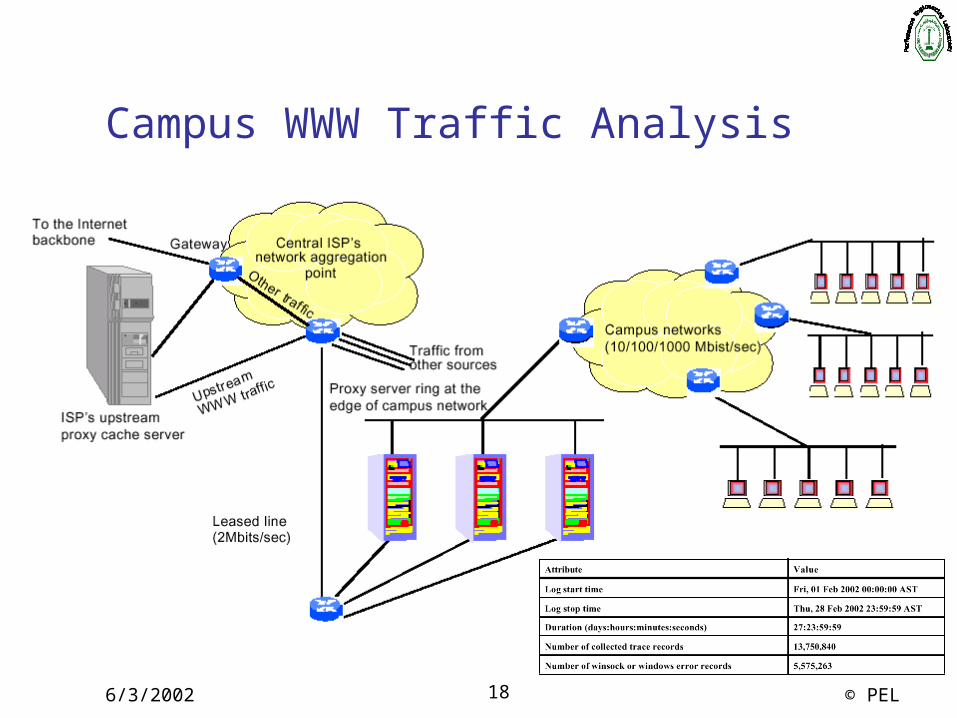
Campus WWW Traffic Analysis
6/3/2002 19 © PEL
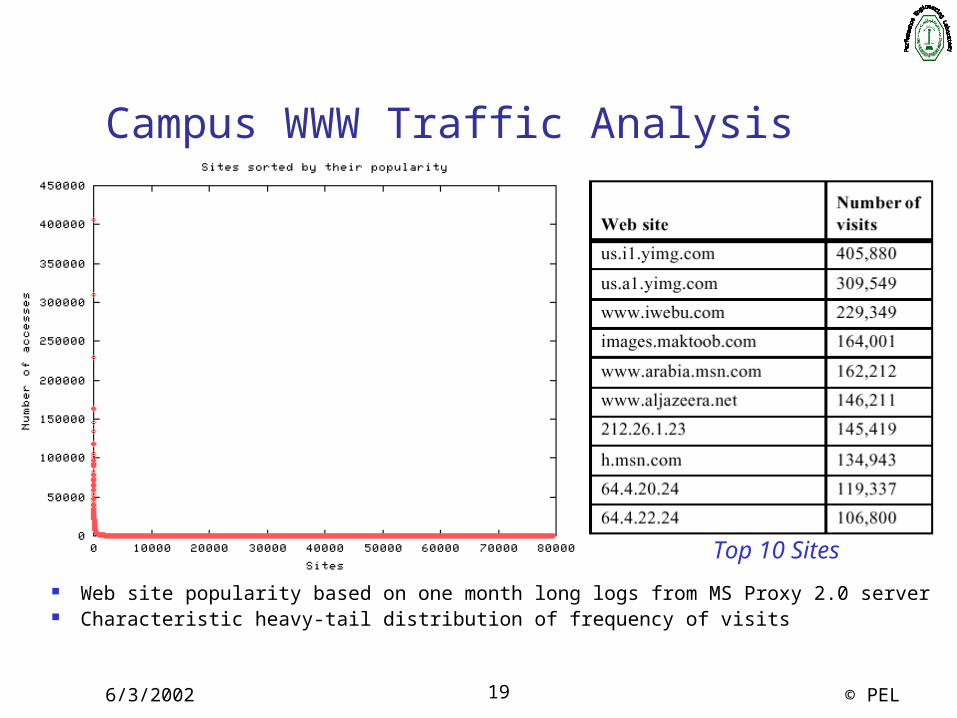
Campus WWW Traffic Analysis
Web site popularity based on one month long logs from MS Proxy 2.0 server Characteristic heavy-tail distribution of frequency of visits
Top 10 Sites
6/3/2002 20 © PEL
Campus WWW Traffic Analysis
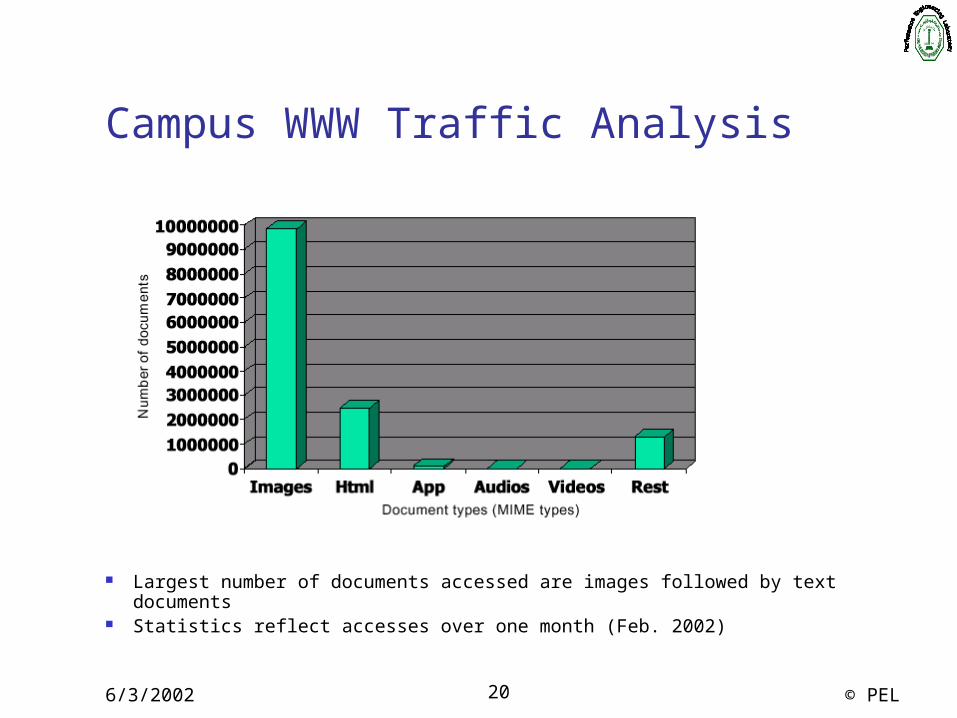
Largest number of documents accessed are images followed by text documents
Statistics reflect accesses over one month (Feb. 2002)
6/3/2002 21 © PEL
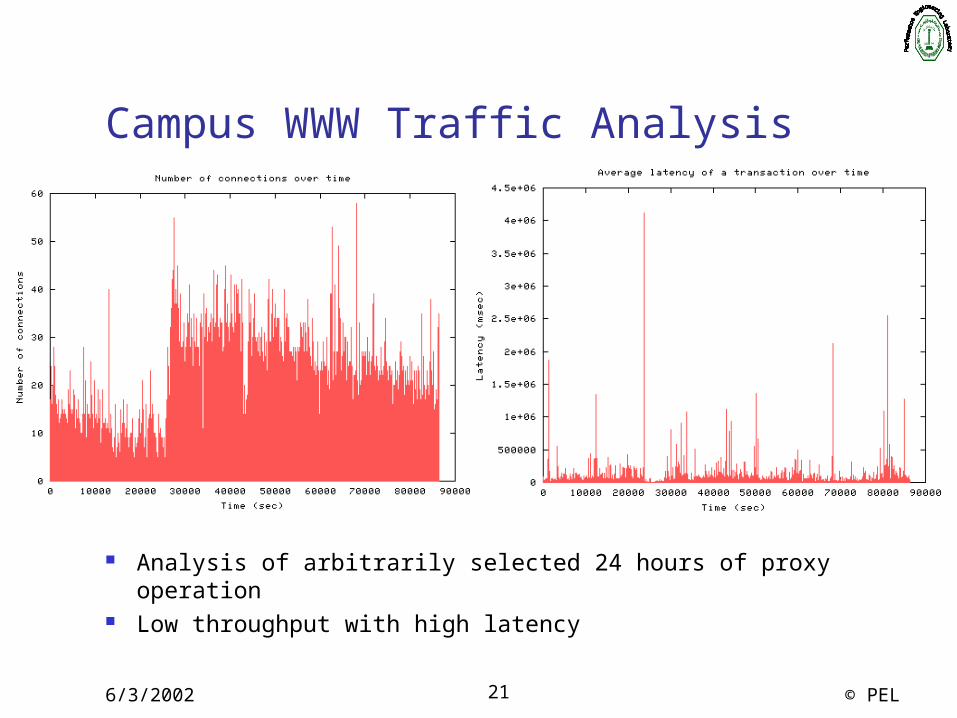
Campus WWW Traffic Analysis
Analysis of arbitrarily selected 24 hours of proxy operation Low throughput with high latency
6/3/2002 22 © PEL
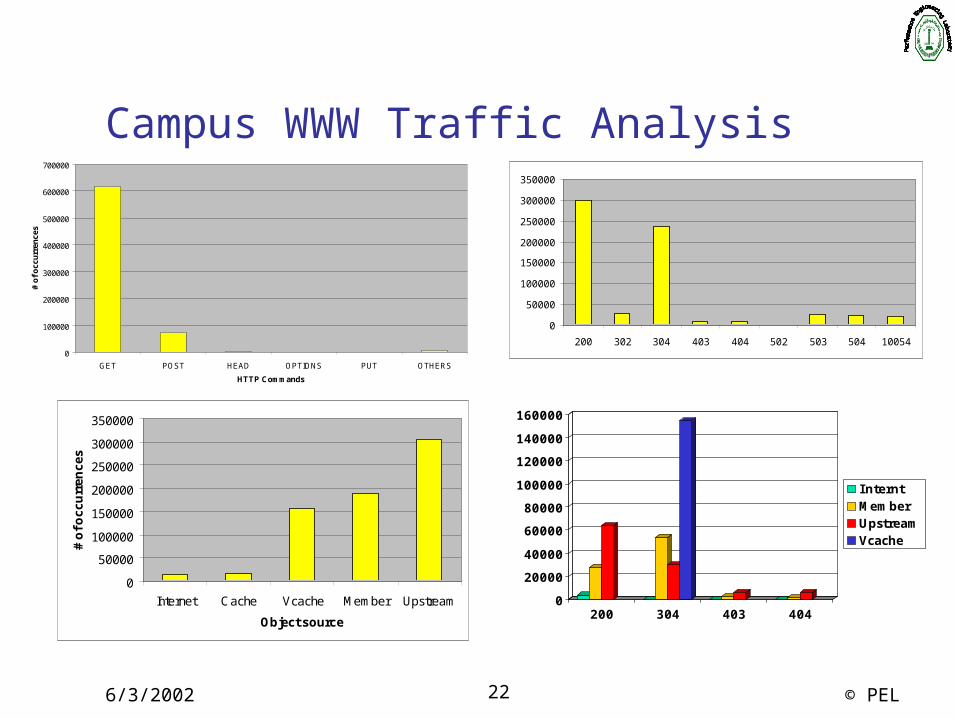
Campus WWW Traffic Analysis
0
100000
200000
300000
400000
500000
600000
700000
GET POST HEAD OPTIONS PUT OTHERS
HTTP Commands
# o
f o
ccu
rren
ces
0
50000
100000
150000
200000
250000
300000
350000
200 302 304 403 404 502 503 504 10054
0
50000
100000
150000
200000
250000
300000
350000
Internet Cache Vcache Member Upstream
Object source
# o
f o
cc
urr
en
ce
s
0
20000
40000
60000
80000
100000
120000
140000
160000
200 304 403 404
InterntMemberUpstream Vcache
6/3/2002 23 © PEL
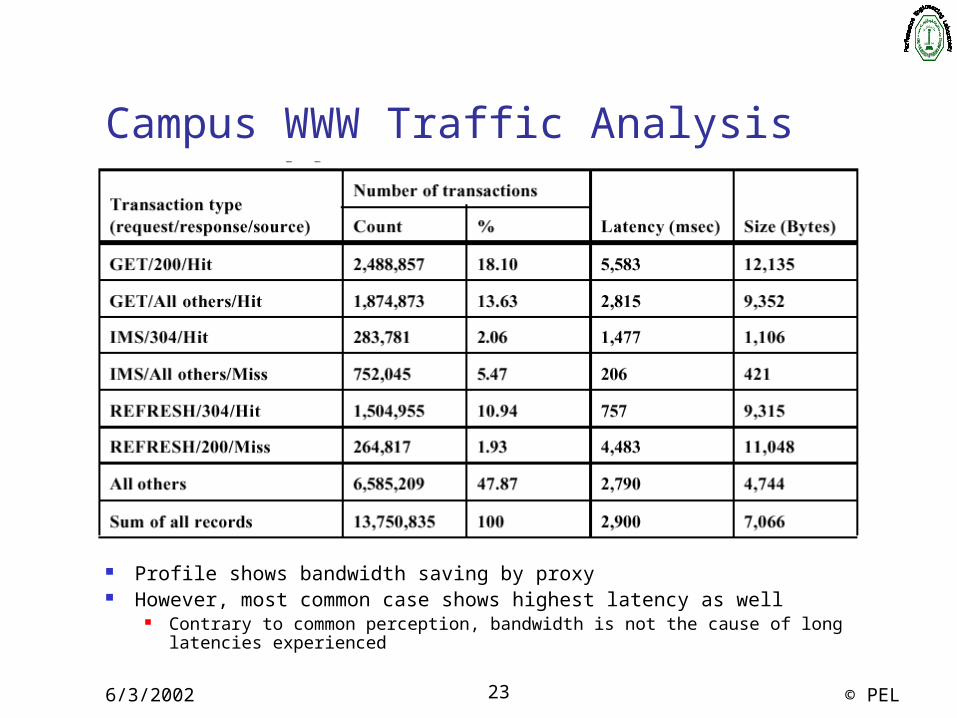
Campus WWW Traffic Analysis
Profile shows bandwidth saving by proxy However, most common case shows highest latency as well
Contrary to common perception, bandwidth is not the cause of long latencies experienced
6/3/2002 24 © PEL
Opportunities to Work With Us
Short term contracts Suitable for typically one particular product or service Turn around time of only a few weeks
Longer term contracts Suitable for multiple products and/or services Long-term relationship with one or more product
development/deployment teams
Points of contact Dr. Sadiq M. Sait ([email protected]) Dr. Abdul Waheed M.A. Sattar (

6/3/2002 25 © PEL
Recommended