Performance Comparison of
Canadian Hedge Funds and Mutual Funds
by
Amitesh Kapoor
MBA, Institute of Management Studies, Shimla, India
PROJECT SUBMITTED IN PARTIAL FULFILLMENT OF THE
REQUIREMENTS FOR THE DEGREE OF MASTER OF FINANCIAL RISK MANAGEMENT
in the Financial Risk Management Program of the
Faculty of
Business Administration
© Amitesh Kapoor 2010 SIMON FRASER UNIVERSITY
Summer, 2010
All rights reserved. However, in accordance with the Copyright Act of Canada, this work may be reproduced, without authorization, under the conditions for Fair Dealing.
Therefore, limited reproduction of this work for the purposes of private study, research, criticism, review and news reporting is likely to be in accordance with the law,
particularly if cited appropriately.

ii
APPROVAL
Name: Amitesh Kapoor
Degree: Master of Financial Risk Management
Title of Project: Performance Comparison of Canadian Hedge Funds
and Mutual Funds
Supervisory Committee:
____________________________________________
Dr. Peter Klein
Senior Supervisor
Professor of Finance
___________________________________________
Dr. Christina Atanasova
Supervisor
Assistant Professor
Date Approved: ______________________________________________________
iii
Abstract
Canadian hedge funds have outperformed the benchmark index by an average of 72
basis points monthly from January 2000 through May 2009. By comparison,
Canadian mutual funds have outperformed the benchmark index by an average of
18 basis points monthly in the same period. This contrast in performance persists
even after adjusting for risk, as measured by Sharpe Ratio, Treynor Ratio, and
Information Ratio. It also persists on market risk adjusted basis. Using CAPM, Fama
and French three Factor Model, and Carhart, the alpha is much higher for Hedge
Funds than Mutual funds. I have analysed the performance in different sub periods
and market environments. Hedge Funds more actively manage their asset allocation
and thus, the high degree of freedom that hedge funds have in their investment style
can possibly be one explanation for the differences in the performance.
Keywords: Sharpe Ratio; Treynor Ratio; and Information Ratio; CAPM; Fama and
French three Factor Model; Carhart

iv
Dedication
I dedicate this paper to my beloved wife and daughter and my lovely parents, for
their unconditional love and support. I could not have accomplished all I have in my
life so far without their inbounded love, endless support and encouragement. I am
always grateful for this.

v
Acknowledgements
I would like to express my gratitude to all those who gave me the possibility to
complete this project. I am deeply indebted to my senior supervisor Dr. Peter Klein
from Simon Fraser University, whose help, stimulating suggestions and
encouragement helped me in all the time of research for and writing of this project. I
also want to thank my supervisor Dr. Christina Atanasova from Simon Fraser
University for looking closely at the final version of the project.
Thank you to all my fellow classmates for their encouragements and suggestion.

vi
Table of Contents
Approval ii
Abstract iii
Dedication IV
Acknowledgements v
Table of Contents VI
1. Introduction 1
1.1 Hedge Funds 2
1.2 Mutual Funds 5
2. Performance Measurement models 7
2.1 Literature Review 7
2.2 Methodology 10
2.3 Risk adjusted performance measures 12
2.4 Traditional Performance measurement Factor Models 13
3. Data 15
3.1 Data 15
3.2 Data bias 16
4. Empirical results 18
4.1 Summary 18
4.2 Correlation among funds and benchmark indices 22
4.3 Results in the period Jan 2000 to May 2009 25
4.4 Results in different sub periods 27
4.5 Results in different market environments 34
5. Conclusion 36
6. Bibliography 39

1
1. Introduction
In this project, I use performance measurement literature from Eling and
Faust (2010) in addition to other risk adjusted measures to analyze, evaluate,
and compare the performance of Canadian hedge funds and mutual funds. In
my analysis I compare the performance of hedge funds not only with
traditional benchmark indices, but also with traditional mutual funds that have
an investment focus in Canadian equity market.
The dispersion in the average fund return is frequently attributed to the
management’s selectivity skill (alpha) or the exposure to the stock market
(beta). Whereas the alpha is the additional return provided by the fund
management, the return differences caused by beta are interpreted as a
compensation for bearing un-diversifiable risk instead of management skill.
While investors may benefit from active allocation towards rising and away
from declining markets, most of the empirical evidence suggests that mutual
fund managers are not able to adjust their exposures accordingly; see, e.g.,
Ferson & Schadt (1996).
The aim of this project is to provide an evaluation of the performance of
Canadian Hedge Funds and Mutual Funds. I build upon insights from both the
Hedge Fund and Mutual Fund literature and analyse risk adjusted
performance measures and factor models. For comparison purposes, I start
with the classical single-factor (1) Capital Asset Pricing Model (CAPM) and

2
then extend my analysis to more complex multifactor models, including, (2)
Fama and French (1993), (3) Carhart (1997). All these models are useful in
identifying the risks underlying hedge funds and mutual funds. And then, Risk
adjusted performance approach which allows summarizing the risk and the
return profile of an investment that can be used to compare different funds.
My main findings can be summarized as follows. (1) Hedge fund returns and
alphas are much higher than those of traditional mutual funds. (2) Hedge
funds and Mutual Funds outperform traditional benchmarks, (3) in bad or
neutral market environments, hedge funds outperform mutual funds while
generating the almost same returns in good environment.
1.1 Hedge Funds
Although there are many different classes of investment strategies that hedge
funds may engage in, most hedge funds in Canada fall into a few categories.
The most common investment strategy for Canadian hedge funds is the
equity long/short strategy, in which a hedge fund will purchase stocks it
believes will rise in price and will sell short stocks it believes will decline in
price, thus generating a profit in both rising and falling market conditions.
Another common strategy is the market neutral strategy, which is a variant of
the equity long/short strategy in which long and short positions are matched
so that the fund has limited exposure to the overall market direction. The
Canadian hedge fund market has experienced a boom in the number of funds

3
offered in the past six years. From a pool of less than 50 funds and only
C$2.5 billion in assets under management in 1999, the industry has
experienced substantial growth with over 200 funds with assets amounting to
approximately C$30 billion today (Fig.1).
Fig: 1 Hedge Fund Asset:
Source: CHW Quarterly Canadian Hedge Fund Report – December, 2008
The majority of reporting Canadian hedge funds is small with less than 2%
having $200 million or more and about 6% having $100 million or more in
assets under management. It is estimated that about 88% of the asset
reporting hedge funds have less than $50 million in assets under
management (Fig 2).

4
Fig. 2 Distribution of Canadian Hedge funds by Asset size:
Source: CHW Quarterly Canadian Hedge Fund Report – December, 2008
With more than 30 strategies that hedge funds follow, Hedge Fund Research
Inc. has divided these strategies into four major pure strategy and further sub
strategy buckets. Canadian hedge fund managers trade in most of the major
hedge fund strategies available. As Figure 3 highlights, Canadian single-
strategy funds manage significant equity hedge fund assets. Note that the
current dominance of the equity hedge strategy in Canada is higher than in
the global marketplace. This dominance is largely due to the fact that many
relative value strategies that focus primarily on Canadian securities are
capacity constrained.

5
Fig 3: Breakdown of Canadian hedge fund assets by strategies (April
2010)
Source: Author’s elaboration on distribution of Canadian hedge fund assets in four categories as defined by Hedge
Fund Research Inc.
The universe of hedge funds is characterized by a significant heterogeneity in
styles adopted by managers that can influence the performance of the funds:
empirical evidences demonstrate that mean returns of funds managed by
managers that adopt different styles are not correlated. (See Klein, Purdy,
and Schweigert 2010)
1.2 Mutual Funds
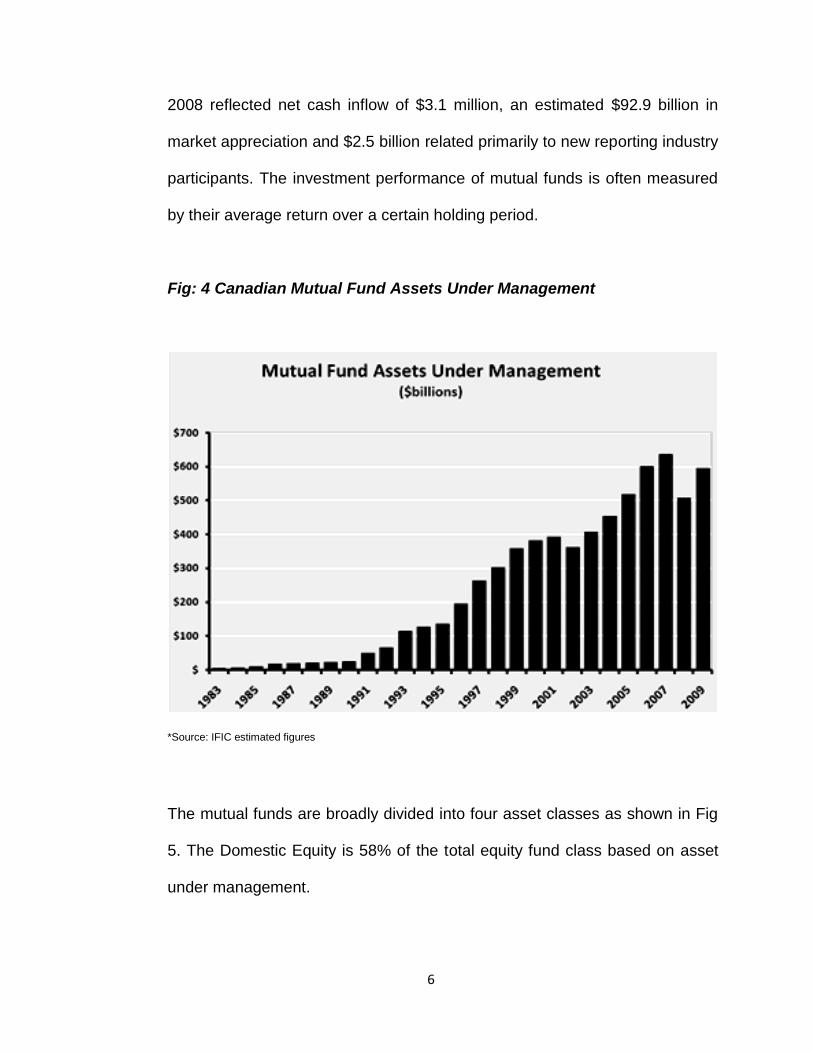
At December 31, 2009, mutual fund industry assets in Canada were
approximately $653.1 billion, an increase of 17.8% relative to December 31,
2008 (Fig.4). This $98.5 billion increase in industry assets from December 31,
Equity Hedge71%
Event-Driven8%
Macro13%
Relative Value
8%
Breakdown of Canadian hegde funds assets by strategies (Apil 2010)
6
2008 reflected net cash inflow of $3.1 million, an estimated $92.9 billion in
market appreciation and $2.5 billion related primarily to new reporting industry
participants. The investment performance of mutual funds is often measured
by their average return over a certain holding period.
Fig: 4 Canadian Mutual Fund Assets Under Management
*Source: IFIC estimated figures
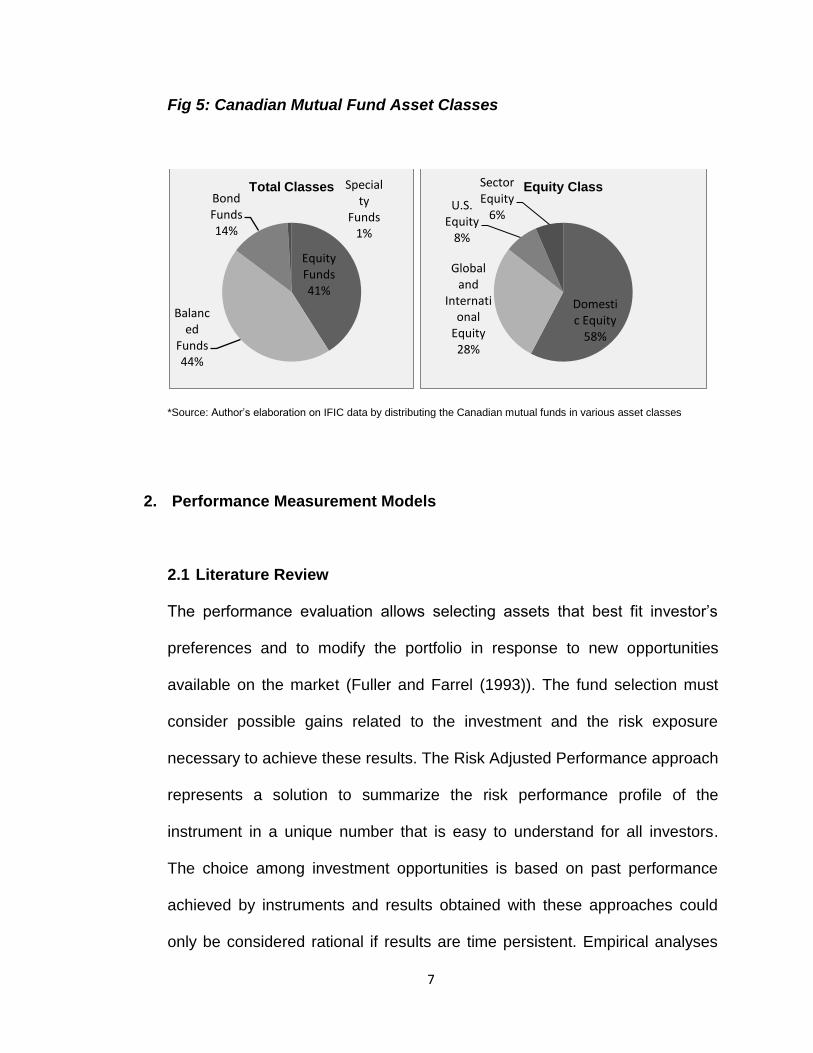
The mutual funds are broadly divided into four asset classes as shown in Fig
5. The Domestic Equity is 58% of the total equity fund class based on asset
under management.
7
Fig 5: Canadian Mutual Fund Asset Classes
*Source: Author’s elaboration on IFIC data by distributing the Canadian mutual funds in various asset classes
2. Performance Measurement Models
2.1 Literature Review
The performance evaluation allows selecting assets that best fit investor’s
preferences and to modify the portfolio in response to new opportunities
available on the market (Fuller and Farrel (1993)). The fund selection must
consider possible gains related to the investment and the risk exposure
necessary to achieve these results. The Risk Adjusted Performance approach
represents a solution to summarize the risk performance profile of the
instrument in a unique number that is easy to understand for all investors.
The choice among investment opportunities is based on past performance
achieved by instruments and results obtained with these approaches could
only be considered rational if results are time persistent. Empirical analyses
Equity Funds41%
Balanced
Funds44%
Bond Funds14%
Specialty
Funds1%
Total Classes
Domestic Equity
58%
Global and
International
Equity28%
U.S. Equity
8%
Sector Equity
6%
Equity Class

8
demonstrate that selections founded on risk adjusted performance
approaches are better than simpler funds selections founded on past gains
(Blake, Elton, and Gruber (1996)). However, results obtained with these
approaches could be correct only if the analysis is released using a large
database: in fact, long time series allow to evaluate an historical trend in the
performance of funds managers and to discriminate between good and lucky
managers (Abernathy and Weisman (2000)). The risk adjusted performance
approach allows summarizing the risk and the return profile of an investment
that could be used to compare different funds.
In Canada, most notably, Berkowitz and Kotowitz (1993), Kryzanowski et al.
(1994, 1997), Athanassakos et al. (1999) and Deaves (2002) have done the
research on Canadian mutual funds. Given the lack of unanimity on
appropriate benchmarks, several procedures are employed. First, a five-factor
model that is designed to span the various sectors that Canadian equity fund
managers invest in is used. As well as the three domestic sectors used in
Elton et al. (1993, 1996a), the use of two offshore indexes is necessitated by
the fact that most Canadian mutual funds are partly invested in non-Canadian
assets. Second, a conditional CAPM technique (similar to Ferson and Schadt
(1996)) is used. Finally, as a point of reference, a single-factor model is
estimated. Berkowitz and Qiu (2002) have used Fama French three factor
model by mimicking portfolio i.e. constructing the book to market (HML) and
size factors (SMB) into domestic Canadian factors by using the Canadian

9
equities similarly to those in the Fama French three factors model. Carhart
(1997) presents another four-factor risk adjusted performance model that
uses the three stock-market related factors as well as an additional factor to
capture Jegadeesh and Titman’s (1993) one-year momentum anomaly.
Jegadeesh and Titman (1993) document strategies which buy stocks that
have performed well in the past and sell stocks that performed poorly in the
past generate significantly positive returns over 3 to 12-month holding
periods. Using the Carhart (1997) model, an alpha similar to the alpha in
Jensen (1968) and Gruber (1996) is designed to capture the risk-adjusted net
return of the mutual fund. The Carhart (1997) four-factor model has been
cited in over 150 academic and practitioner peer-reviewed journal articles and
is the most widely used risk-adjusted performance metric for mutual fund
returns. Hereafter, I will refer to the Carhart (1997) model as the four-factor
model. Liang (1999) and Agarwal and Naik (2000b) have used single factor
and multi factor models to estimate hedge fund alphas. Eling and Faust
(2010) used CAPM, Fama French three factor model, and Carhart in their
study for European mutual funds and hedge funds.
Three widely used performance indicators based on capital market
equilibrium theory are: (a) Sharpe’s (1966) Reward-to-Volatility Ratio, (b)
Treynor’s (1965), (c) and Treynor and Black (1973) Information Ratio. Eling
and Schuhmacher (2006) have used Sharpe ratio, Treynor ratio with 11 other
performance measures for hedge funds and have found that Sharpe ratio to
10
the other performance measures results in virtually identical rank ordering
across hedge funds. A recent research shows that the choice of a particular
measure has no significant influence on the ranking of an investment.
Pfingsten et al. (2004) compared rank correlations for various risk measures
on the basis of an investment bank’s 1999 trading book. In doing so, they
found that different measures result in a largely identical ranking. Pedersen
and Rudholm-Alfvin (2003) compared risk-adjusted performance measures
for various asset classes over the period from 1998.
2.2 Methodology
Following Eling and Faust (2010) who have studied performance of European
hedge funds and mutual funds, I have used the same analysis for comparing
the performance of Canadian hedge funds and mutual funds. I have used
CAPM, Fama French three factor model, and Carhart used in Eling and Faust
(2010). Even though the factors in Fama French three factor model, and
Carhart are based on US data, they have been used as a proxy to represent
the world factors. There are some studies that explore the importance of US
Fama-French factors in a local asset pricing setting, and the available
evidence suggests that they may have a role as proxies for international
factors of this type. In the context of explaining the returns on domestic
portfolios and stocks, Griffin (2002) suggest that domestic factors are to be
preferred. In contrast Durand et al (2006), following the argument of Bekeart

11
and Harvey (1995) support the use of US factors as global factors in the
Australian market. The focus of my analysis is at the national market level as
such I make use of US factors as proxies for global factors. Eling and Faust
(2010) have used the factors for European data.
Moreover, I converted the Fama French three factors SMB, HML, and Market
proxy and Carhart’s fourth one which is Momentum Factor (MOM) into the
Canadian dollar terms and tried to find out the difference between the alphas
after and before the change. I found out that there is a change in alpha to the
extent of five basis points to seven basis points which is not that significant.
Although HEC Montreal provides Fama and French Canadian Factors but it
does not contain the MOM factor and the other data is only till 2007 which is
not in the scope of this study. And thus by considering the Fama French three
factors as the representative of global factors, in my case the Canadian
domestic factors; I have used these factors as three different indices and as
the independent variables in the regression equations as used by Eling and
Faust (2010).
In addition to CAPM, Fama French three factor model, and Carhart used by
Eling and Faust (2010), I have used three risk adjusted performance
measures Sharpe ratio, Treynor ratio, and Information ratio for comparison.
Like European hedge funds in Eling and Faust (2010), Canadian hedge fund
returns and alphas are much higher than those of traditional mutual funds.

12
Also, similar to Eling and Faust (2010), in bad or neutral market
environments, hedge funds outperform mutual funds while generating the
same returns in good environment.
2.3 Risk Adjusted Performance Measures
The Sharpe Ratio is a measure of the excess return (or Risk Premium) per
unit of risk in an investment asset or a trading strategy.
Where, R is average monthly return on asset and is Risk free rate which is
Canadian one month T-Bill rate.
To calculate the variance, I have used the standard deviation of excess return
of the asset.
The Treynor Ratio is a measurement of the returns earned in excess of
that which could have been earned on an investment that has no diversifiable
risk. However, systematic risk is used instead of total risk
Here is return of the benchmark index portfolio which is S&P/TSX
Composite Index in my case. And again variance and covariance are
calculated using the excess returns for both Mutual Funds and Hedge Funds.
13
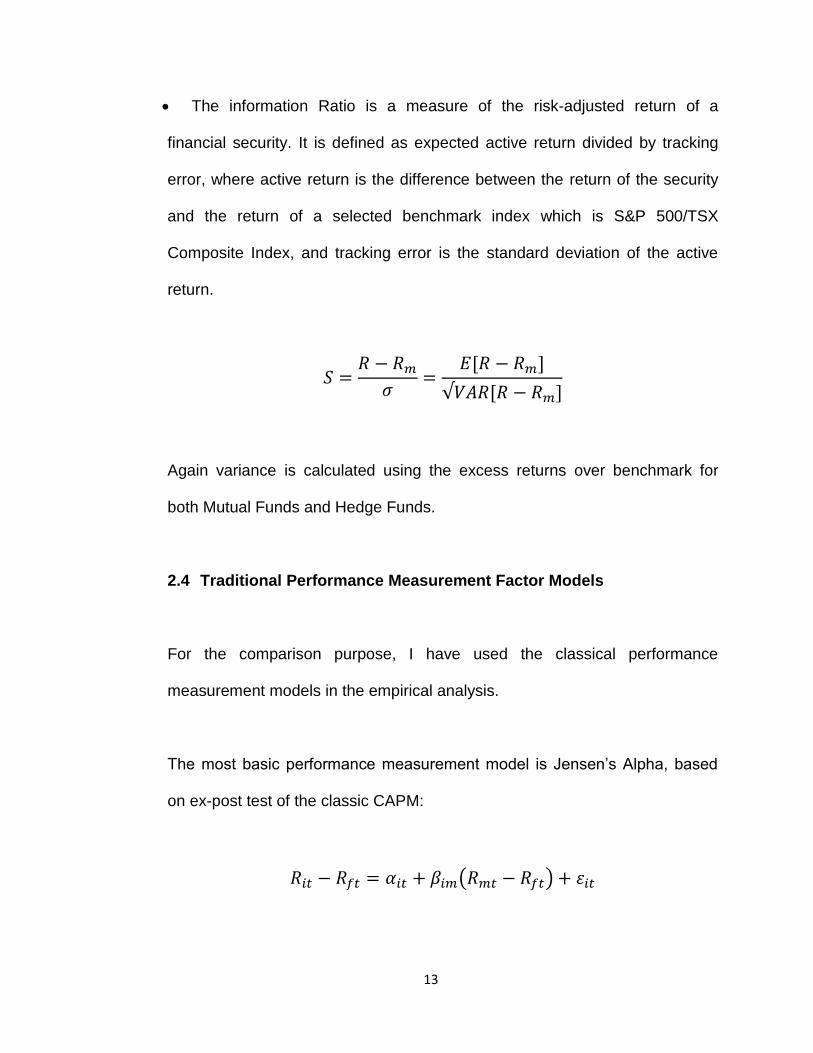
The information Ratio is a measure of the risk-adjusted return of a
financial security. It is defined as expected active return divided by tracking
error, where active return is the difference between the return of the security
and the return of a selected benchmark index which is S&P 500/TSX
Composite Index, and tracking error is the standard deviation of the active
return.
Again variance is calculated using the excess returns over benchmark for
both Mutual Funds and Hedge Funds.
2.4 Traditional Performance Measurement Factor Models
For the comparison purpose, I have used the classical performance
measurement models in the empirical analysis.
The most basic performance measurement model is Jensen’s Alpha, based
on ex-post test of the classic CAPM:

14
Where is the return of fund i in month t, is the risk free return, the
return of the market portfolio, and an error term. The stands for the
intercept of the regression and is commonly called Jensen’s (1968) alpha
and used as a performance measure relative to the market portfolio (see,
e.g., Patro (2001), for an application to mutual funds); the slope of the
regression is called the beta factor.
As the market risk premium is the only factor used as a benchmark, the
CAPM is a single-factor model. This single-factor modeling has been
extended in literature to a multifactor framework in order to improve the
portion of variance explained by the regression. I consider the Fama and
French (1993) three-factor model and the Carhart (1997) model as basic
multifactor specifications because they are generally not dominated by any
other model in the mutual funds performance literature (see Capocci and
Hubner (2004)). The Fama and French (1993) model has two additional
factors, one for size (SMB, i.e., small minus big) and one for the ratio of book-
to market value (HML, i.e., high minus low book-to-price ratio):
Carhart (1997) adds a momentum (MOM) factor to the Fama and French
(1993) model, which accounts for trend-following strategies in stock markets,
i.e., buying stocks that were past winners and selling past losers:
15
3. Data
3.1 Data
I have used data from Hedge Fund Research Inc., which is one of the most
comprehensive resources available for hedge funds. Hedge Fund Research
Inc. produces over 100 indices of hedge fund performance ranging from
industry-aggregate levels down to specific, niche areas of sub-strategy and
regional investment focus. They have developed the industry's one of most
detailed fund classification system, enabling granular and specific queries for
relative performance measurement, peer group analysis and benchmarking.
From this database I have selected those funds that are classified as
Canadian Hedge Funds and have applied no filter to the data. The initial
sample consists of 107 funds (see Exhibit 1) with returns between Jan 2000
to May 2009, but refinement of the data to minimize the biases inherent in
hedge fund data, causes the loss of 20 funds (see Data Biases below).
The mutual fund data is taken from Morningstar Database. I extracted 581
mutual funds investing in Canadian equity market. I have prepared the data

16
for mutual fund based on the same principles as applied for the hedge funds.
All following data are monthly, discrete return numbers.
Hedge Funds and Mutual Funds are compared with passive benchmark
indices. The data for passive benchmark indices are collected from
Morningstar Database. The equity market proxy, HML, SMB and MOM are
the value-weighted portfolio of all NYSE, Amex, and NASDAQ stocks used in
Fama and French (1993) and Carhart (1997). As both Hedge Fund Research
Inc. and Morning Star provide data on individual fund basis and all the
following data are monthly discrete return numbers, I have aggregated the
returns as equally weighted average across all hedge funds and mutual funds
to provide a fair basis for the comparison (as done, e.g., in Capocci and
Hubner (2004) and Eling and Faust (2010)).
3.2 Data Bias
Estimating the excess returns of hedge funds is subjected to several potential
biases associated with reported hedge fund returns. Fung and Hsteh (2000),
following previous literature discussed four biases: survivorship bias, instant
history bias, selection bias, and multi-period sampling bias. A survivorship
bias may exist if the reported return data exclude the return of non-surviving
hedge funds because non-surviving funds probably have poor performance.
Although the mutual fund industry systematically and significantly overstates
17
fund performance in a way that makes actively managed mutual funds look
much more competitive with indexes than is actually the case. Very few
investors know about survivor bias, but it should be a major concern. As per
Morningstar, the time series data calculation comes from historical data
dating back to a fund’s inception. Funds that have been liquidated or merged
are included in analysis for the periods where they met the specific criteria in
question. This presents a more accurate assessment of performance within
categories, as it includes more than just the most successful funds. However,
like Eling and Faust (2010), as I have included both surviving and defunct
funds, survivorship bias should not be a problem in this study.
An instant history bias may exist because when data vendors add a new
hedge fund to their database, they may backfill earlier returns for that fund.
Because it is reasonable to believe that only hedge funds with good
performance records choose to report their performance to data vendors, the
practice of backfilling the returns history of funds may result in upward biased
returns for newly reporting hedge funds during their early (reported) histories.
Fung and Hsieh (2000) estimated an instant history bias of as much as 1.4%
for average annual hedge fund return. But as Hedge Fund Research Inc. is
free of backfilling bias as the funds used in a particular month are simply
those that existed on that date in the database, so this does not affect the
study. Mutual funds in contrast do not have backfilling bias so that this bias is
not relevant to this group.
18
A final potential bias, which Fung and Hsieh (2000) called as a multi-period
sampling bias may exist if some hedge funds have very short return histories.
In particular, they argued that if investors typically require 36 months of
history before investing in hedge funds, estimates excess returns based on
shorter return histories may be misleading to those investors. Fung and Hsieh
(2000), however, investigated the use of different return histories and
concluded that this bias appears to be very small, if it exists at all. To identify
the mutual funds, I first select all the mutual funds that invest primarily in
Canadian equity market as an investment objective. A minimum number of
returns are necessary for a meaningful performance analysis, but requiring a
minimum return history might create a sampling bias, i.e., a group of short-
lived, unsuccessful funds might be eliminated. Following Fung and Hsieh
(1997) and Liang (2000), I chose to eliminate mutual funds with less than 24
monthly returns and same for Hedge Funds rather than 36 months minimum
as Hedge Fund Research Inc. is free of backfilling bias as the funds used in a
particular month are simply those that existed on that date in the database.
This reduces my sample to 87 hedge funds and 581 mutual funds.
4. Empirical Results
4.1 Summary
Table 1 below contains descriptive statistics on the monthly return distribution
of 87 hedge funds and 581mutual funds, and six benchmark indices.

19
Table1: Descriptive Statistics for hedge funds, mutual funds, and
passive benchmark indices from January 2000 to May 2009
It shows the first four moments (mean, standard deviation, skewness, and
kurtosis), the minimum and the maximum as well as three quantiles (25%
quantile, median, 75% quantile). The last row of Table 1 provides information
on autocorrelation in returns (with lag of one month). As the benchmark
indices represent diversified portfolios in the various investments, Hedge
funds provide returns (0.76%) much higher than those of mutual funds
(0.22%), but they also have a lower standard deviation (2.77% vs. 4.06%)
Descriptive Statistic for hedge funds, mutual funds, and passive benchmark indices
January 2000 to May 2009
MF HF TSX/SP500 Composite TSX/SP60 SMB* HML* Market Proxy* Momentum*
Mean Return 0.22% 0.76% 0.21% 0.25% 0.45% 0.69% -0.28% 0.16%
Standard Deviation 4.06% 2.77% 4.79% 4.93% 4.08% 3.84% 4.94% 6.94%
Skewness -0.97 -0.87 -0.84 -0.74 0.93 -0.02 -0.65 -1.42
Kutosis 5.19 5.88 4.52 4.40 12.08 5.75 3.92 9.47
Min(%) -15.56% -10.70% -16.82% -16.30% -16.85% -12.37% -18.55% -34.69%
25%(%) -1.83% -0.93% -2.28% -1.96% -1.58% -1.03% -2.50% -1.81%
Median(%) 0.88% 1.03% 0.99% 0.44% 0.05% 0.41% 0.74% 0.43%
75%(%) 3.09% 2.61% 3.48% 3.46% 2.61% 2.61% 2.58% 3.24%
Max(%) 8.58% 8.85% 11.45% 12.08% 21.99% 13.87% 11.05% 18.35%
AutoCorr.(lag 1) 0.29 0.34 0.28 0.28 -0.17 0.06 0.22 0.05
Note: All the Indices are analysed on the basis of excess return , unless indicated with an asterisk (*)

20
similar to what Eling and Faust (2010) found for European data. The
difference in returns also leads to much higher Sharpe ratios, Information
ratios, and Treynor ratio for the hedge funds. However, although some
investors might be more concerned with central tendencies of the return
distribution (mean value, standard deviation); others may care more about the
distributions shape and extreme values, that is, skewness and kurtosis. I find
that both hedge funds and mutual funds on average display a negative
skewness with a positive kurtosis.
To test the above results in Table 1 over time, I have considered two sub
periods. As shown in the Table 2 below, the mutual funds in the period
January 2000 to December 2006 are showing kurtosis less than 3 which
mean the distribution is much flatter for mutual fund. Thus, for investors with
high marginal utility, constant risk aversion, and strict consistency of moment
preferences prefer higher values with the odd moments (mean, skewness)
and lower values with the even moments (standard deviation, kurtosis) ( see
Scott and Horvath (1980)), this could be an attractive combination. The
negative skewness and more positive kurtosis displayed by the hedge funds
might thus be an unattractive combination for such investors. But as per
Brulhart and Klein (2005), investors should be more worried about higher
statistical moments than instead of skewness and Kurtosis which may be
misleading because they are scaled by volatility.

21
Table 2: Descriptive Statistics for hedge funds, mutual funds, and
passive benchmark indices from January 2000 to December
2006
Looking at the moments in the period January 2007 to May 2009 in Table 3
below, it can be inferred that both hedge funds and mutual funds have
negative excess return as this was the period of recession for the economy as
a whole. But the drop in mutual fund’s return was much larger than the drop in
hedge fund’s return. Only one benchmark indices (SMB) provides a higher
excess return than hedge funds.
Descriptive Statistic for hedge funds, mutual funds, and passive benchmark indices
January 2000 to December 2006
MF HF TSX/SP500 Composite TSX/SP60 SMB* HML* Market Proxy* Momentum*
Mean Return 0.60% 1.09% 0.48% 0.46% 0.59% 1.14% 0.03% 0.41%
Standard Deviation 3.32% 2.29% 4.26% 4.49% 4.55% 3.96% 4.36% 6.30%
Skewness -0.42 0.07 -0.73 -0.75 0.81 -0.03 -0.48 -0.56
Kutosis 2.79 3.56 3.73 4.20 10.53 5.93 2.9997 6.46
Min(%) -7.71% -4.03% -13.68% -15.17% -16.85% -12.37% -10.76% -25.04%
25%(%) -1.51% -0.57% -1.42% -1.49% -1.60% -0.55% -2.37% -1.72%
Median(%) 0.91% 1.33% 1.09% 1.12% 0.45% 1.12% 0.85% 0.71%
75%(%) 3.24% 2.65% 3.50% 3.46% 2.74% 2.80% 2.62% 3.13%
Max(%) 8.18% 8.85% 9.92% 10.81% 21.99% 13.87% 8.18% 18.35%
AutoCorr.(lag 1) 0.14 0.23 0.18 0.18 -0.19 -0.06 0.07 -0.15
Note: All the Indices are analysed on the basis of excess return , unless indicated with an asterisk (*)

22
Table 3: Descriptive Statistics for hedge funds, mutual funds, and
Passive benchmark indices from January 2007 to May 2009
4.2 Correlation among funds and benchmark indices
Table 4 below shows correlation between hedge funds, mutual funds, and the
passive benchmark indices. I have shown the correlation coefficients in the
full period January 2000 to May 2009 and in the selected sub periods also.
In the period January 2000 to May 2009, with regard to the full investigation
period (columns 2 and 3), the correlations between mutual funds and hedge
fund are positive and significant and correlation between mutual fund and
hedge funds with S&P 500/TSX Composite index is high and significant. This
Descriptive Statistic for hedge funds, mutual funds, and passive benchmark indices
January 2007 to May 2009
MF HF TSX/SP500 Composite TSX/SP60 SMB* HML* Market Proxy* Momentum*
Mean Return -0.87% -0.19% -0.55% -0.38% 0.05% -0.61% -1.20% -0.56%
Standard Deviation 5.64% 3.75% 6.09% 6.09% 2.23% 3.17% 6.34% 8.61%
Skewness -0.85 -1.00 -0.75 -0.59 0.62 -0.70 -0.57 -2.33
Kutosis 4.16 4.54 4.36 4.15 2.95 5.02 3.7737 11.26
Min(%) -15.56% -10.70% -16.82% -16.30% -3.59% -9.89% -18.55% -34.69%
25%(%) -3.14% -2.45% -3.02% -3.49% -1.56% -1.98% -5.27% -2.04%
Median(%) 0.37% 0.58% -0.10% -0.28% -0.12% -0.23% -0.70% 0.24%
75%(%) 2.38% 2.12% 3.18% 2.92% 0.87% 0.32% 2.26% 4.30%
Max(%) 8.58% 6.42% 11.45% 12.08% 5.13% 5.74% 11.05% 12.56%
AutoCorr.(lag 1) 0.41 0.40 0.40 0.42 -0.06 0.38 0.40 0.38
Note: All the Indices are analysed on the basis of excess return , unless indicated with an asterisk (*)

23
result is almost in line with what Klein, Purdy and Schweigert (2009) found
between KCS Composite index and S&P/TSX Composite index.
When considering the HML, SMB and MOM indices, I only find significant
and positive correlations with SMB. A major argument for investing in hedge
funds, however, is that the correlations with traditional investments such as
stocks and bonds are somewhat lower, which makes hedge funds interesting
for portfolio diversification. In fact, the correlations of the hedge fund returns
with the traditional investments are generally lower than the corresponding
correlation with the mutual funds. For example, the correlation between
mutual funds and the S&P 500/TSX Composite is 0.95, but it is only 0.86 with
the hedge funds.
Both hedge funds and mutual funds are found to be highly correlated with the
returns of traditional benchmark indices, a finding which is also quite robust
among the different sub periods analyzed in Table 2. An exception, however,
are the SMB, HML, and MOM indices in the most recent period (January
2007–May 2009), where I find a bit higher and significant correlations,
especially with hedge funds. For example, with the hedge fund HML is 0.05,
with SMB is 0.11, and with MOM is -0.31. In fact, the correlation of hedge
funds has increased to 0.93 from 0.86 with S&P/TSX Composite Index in the
most recent period (January 2007–May 2009) which witnessed the economic
recession.

24
Table 4: Correlation between mutual funds (MF) and hedge funds (HF),
and passive investment strategies (p-values are given in
parentheses)
MF HF MF HF MF HF
MF 1.00 0.90 1.00 0.87 1.00 0.94
(0.00) (0.00) (0.00) (0.00) (0.00) (0.00)
HF 0.90 1.00 0.87 1.00 0.94 1.00
(0.00) (0.00) (0.00) (0.00) (0.00) (0.00)
SP500/TSX 0.95 0.86 0.93 0.80 0.99 0.93
(0.00) (0.00) (0.00) (0.00) (0.00) (0.00)
TSX 60 0.91 0.81 0.87 0.74 0.98 0.91
(0.00) (0.00) (0.00) (0.00) (0.00) (0.00)
Market Proxy 0.85 0.70 0.82 0.63 0.90 0.78
(0.00) (0.00) (0.00) (0.00) (0.00) (0.00)
SMB 0.33 0.35 0.41 0.47 0.23 0.11
(0.0004) (0.0001) (0.0001) (0.00) (0.23) (0.57)
HML -0.12 -0.11 -0.34 -0.26 0.20 0.05
(0.21) (0.25) (0.002) (0.02) (0.30) (0.8)
Momentum -0.24 -0.09 -0.12 0.05 -0.41 -0.31
(0.01) (0.34) (0.28) (0.65) (0.03) (0.10)
Jan. 2000-May. 2009 Jan. 2000-Dec.2006 Jan.2007-May.2009

25
4.3 Results in the period Jan 2000 to May 2009
Table 5 below sets out the risk adjusted performance measurements; Sharpe
Ratio, Treynor Ratio, and Information ratio in Panel A. In panel B of Table 5
the performance measurement factor models; CAPM, Fama and French, and
Carhart are presented with alpha, T-stats, and Rsquare described in Section
2. Panel A and Panel B presents the results for the sample of 581 mutual
funds and 87 hedge funds. Results are displayed both for an equally weighted
portfolio of all funds.
As presented in Panel A, the Sharpe ratio, as expected, for hedge funds is
0.95 which is much higher than that of the mutual funds (0.19), which mean
hedge provides better risk adjusted returns than mutual funds. The Treynor
ratio, which is useful if the portfolio under consideration is part of larger fully
diversified portfolio, is 0.19 for hedge funds against 0.03 for mutual funds.
Information ratio which is often used to gauge the skill of manager’s, is again
high for hedge funds (0.67) and comparatively quite low for mutual funds
(0.02). In my case, the Information ratio measures the expected active return
of the manager’s well diversified portfolio divided by the amount of risk that
the manager takes relative to benchmark and thus hedge funds clearly stands
apart on this measure as well. So overall, the statement with regard to the
performance of hedge funds is robust among these measures.

26
Table 5: Performance Measurement Results in the period Jan 2000 to
May 2009
In panel B in Table 5 above, the Fama and French (1993) and Carhart (1997)
models explain 53.41% and 57.69% respectively for hedge funds and 75.33%
and 77.20% respectively for mutual funds. Consistently, the Rsquare for
hedge funds is about 20% to 22% lower than that of mutual funds. As
expected, for the equally weighted index the Carhart (1997) model do
increase Rsquare compared to the Fama and French (1993) model, i.e. the
increase in explanatory power delivered by the momentum factor is large
enough to outweigh the negative impact of adding another variable to the
model. The increase of approximately 4% is again in line with literature (see
Capocci and Hubner (2004)).
In Table 5, Panel B above, the alpha values for the three performance
measurement factor models is presented. In addition to the alpha values for
Performance Measurement Results in the period Jan 2000 to May 2009
Panel A: Risk Adjusted Performance Measure
Hedge Funds Mutual Funds
Sharpe Ratio 0.95 0.19
Treynor Ratio 0.19 0.03
Information Ratio 0.67 0.02
Panel B: Traditional Performance Measurement Factor Models
Alpha(%) Tstat R-Square Alpha(%) Tstat R-Square
CAPM* 0.65% 4.86 73.61% 0.05% 0.42 90.82%
Fama and French 0.74% 3.94 53.41% 0.27% 1.36 75.33%
Carhart 0.75% 4.18 57.69% 0.28% 1.47 77.20%
*Here the market risk premium is excess return of S&P/TSX Composite Index
Hedge Funds Mutual Funds

27
the equally weighted portfolio for both hedge funds and mutual funds
(Columns 2 and 5), I present the t-statistics for alpha values at 95%
confidence interval.
The mutual funds have positive alpha values in most cases, indicating that
mutual fund managers on average have performed better than the benchmark
indices. However, considering the equally weighted portfolio, none of the
alpha values are significantly different from zero.
This situation is different for hedge funds, as the few fund managers who
have beaten passive strategies tend to move to alternative investments and
start their own hedge fund (see Agarwal and Naik (2000)). In contrast to the
mutual funds, hedge funds have positive alpha values and all of them are
statistically significant on a 5% level, indicating that hedge fund managers on
average perform better than mutual fund managers.
4.4 Results in different sub periods:
In Table 6 and Table 7 below, I present the results for two different sub-
periods in an effort to test the robustness of my results over time. The
selection of sub-periods is motivated by the time after the peak of the
technology bubble (January 2000–December 2006). The selection of the last
period is motivated by the most recent financial crisis from January 2007 to
May 2009.

28
Both Table 6 and Table 7 confirm the above finding that hedge funds on
average have better performance than mutual funds. For equally weighted
portfolio hedge funds perform better in nearly all sub-periods and for all
models.
As in Panel A in Table 6, the Sharpe ratio is much higher for hedge funds as
well as for mutual funds in the period after the technology bubble i.e. January
2000 to December 2006 than in the whole period i.e. from January 2000 to
May 2009. Hedge funds have a Sharpe ratio of 1.65 much higher than mutual
funds (0.63) and also higher than for the whole period (Panel A, Table 5
above).
Table 6: Performance measurement results in the period January 2000
to December 2006
Performance Measurement Results in different sub periods
From January 2000 to December 2006
Panel A: Risk Adjusted Performance Measure
Hedge Funds Mutual Funds
Sharpe Ratio 1.65 0.63
Treynor Ratio 0.31 0.10
Information Ratio 0.76 0.26
Panel B: Traditional Performance Measurement Factor Models
Alpha(%) Tstat R-Square Alpha(%) Tstat R-Square
CAPM* 0.88% 5.95 65.26% 0.25% 1.94 87.09%
Fama and French 0.69% 3.75 57.36% 0.17% 0.81 75.12%
Carhart 0.70% 3.92 60.36% 0.18% 0.87 76.20%
*Here the market risk premium is excess return of S&P/TSX Composite Index
Hedge Funds Mutual Funds

29
Similarly, the same results hold for Treynor ratio which is 0.31 for hedge funds
and 0.10 for mutual funds (Table 6, Panel A) which means hedge funds on an
average provide higher yield for each unit of market risk. Also, hedge funds in
this period have Information ratio of 0.76 against 0.26 for mutual funds for the
same period. Interestingly, where Sharpe ratio, Treynor ratio, and Information
ratio are much higher in the period January 2000 to December 2006 than in the
period January 2000 to May 2009. It can be inferred that during this period both
hedge fund and mutual fund manager’s ability to generate excess return over
benchmark is relatively more than it is for the full period. Also, as hedge funds
have very large information ratio than mutual funds means that hedge funds have
much more consistency which is an ideal trait.
In Table 6 Panel B, hedge funds have much significantly higher alpha values
than mutual funds which have low and insignificant alphas. Results which are
similar to the results Eling and Faust (2010) found for European data. The alpha
values decreased a bit for both hedge funds and mutual funds in comparison to
the full period investigation except for the CAPM. In the period from 2000 to 2006
where Canadian market equities had on average low positive returns, hedge
funds reduced their exposure to equities, an observation which I cannot confirm
for mutual funds. In general the mutual funds were holding a nearly constant
exposure to equities which was only slightly reduced over time. A possible
explanation might be that they are ether obliged by investment policies to do so
or that they do not try to time the markets by asset allocation. An explanation for

30
the hedge funds could be illiquid positions which are infrequently priced or not
adequately market priced. Another reason might be return smoothing.
Table 7: Performance measurement results in the period January 2007
to May 2009
As presented in Table 7 above, during the period of economic recession, both
hedge funds (-0.18) and mutual funds (-0.54) have negative Sharpe ratio but
hedge funds on an average were able to keep their losses low. The same results
hold for Treynor ratio as well where it is -0.04 for hedge funds, mutual funds have
Treynor ratio of -0.12. In contrast to above findings, the Information ratio for
hedge fund (0.42) is positive whereas for mutual funds (-1.13) on an average is
negative. Thus, during the economic downturn, hedge fund manager’s ability to
generate excess return over benchmark is much better than the mutual fund
manager.
Performance Measurement Results in different sub periods
From January 2007 to May 2009
Panel A: Risk Adjusted Performance Measure
Hedge Funds Mutual Funds
Sharpe Ratio -0.18 -0.54
Treynor Ratio -0.04 -0.12
Information Ratio 0.42 -1.13
Panel B: Traditional Performance Measurement Factor Models
Alpha(%) Tstat R-Square Alpha(%) Tstat R-Square
CAPM* 0.12% 0.48 86.84% -0.37% -2.28 97.66%
Fama and French 0.23% 0.57 70.95% -0.06% -0.15 86.00%
Carhart 0.26% 0.60 71.03% 0.003% 0.01 86.23%
*Here the market risk premium is excess return of S&P/TSX Composite Index
Hedge Funds Mutual Funds

31
In Table 7 Panel B, the alphas are small and insignificant in all the models.
During this period alpha for both hedge funds and mutual funds has decreased
substantially. One possible explanation could be large capital inflows followed by
negative movements in alpha.
Hedge funds were able to keep their exposure low during this period (Fig 6a)
which suggests good timing abilities of hedge fund managers. Unfortunately my
data does not allow me to investigate whether the reduced exposure was due to
the negative returns or whether the hedge fund managers reduced their
exposure before the losses occurred. But during all these periods, hedge funds
have an exposure which changes more over time than does the exposure of
mutual funds (Fig 6b, 6c). This indicates that Canadian hedge funds are more
active with respect to asset allocation, perhaps in an effort to time the market.
Fig: 6a
0.000.100.200.300.400.500.600.700.800.901.00
20
00
-20
02
20
00
-20
04
20
04
-20
06
20
06
-20
08
Esti
mat
ed
Co
ffic
ien
t
S&P500/TSX Composite Hedge Fund Exposure

32
Fig: 6b
Fig: 6c
*Fig 6a and 6b: Rolling regression over 24 months of S&P/TSX Composite factor exposure for hedge funds (top),
and mutual funds (bottom), Fig 6c, rolling regression over 24 months of average index return of S&P 500/TSX
Composite Index.
00.10.20.30.40.50.60.70.80.9
1
20
00
-20
02
20
00
-20
04
20
04
-20
06
20
06
-20
08
Exp
ect
ed
Co
ffic
ien
t
S&P500/TSX Composite Mutual Fund Exposure
-3%
-2%
-1%
0%
1%
2%
3%
20
00
-20
02
20
00
-20
04
20
04
-20
06
20
06
-20
08
Mo
nth
ly a
vera
ge R
etu
rn
S&P 500/TSX Composite monthly average return
33
Fig 7a
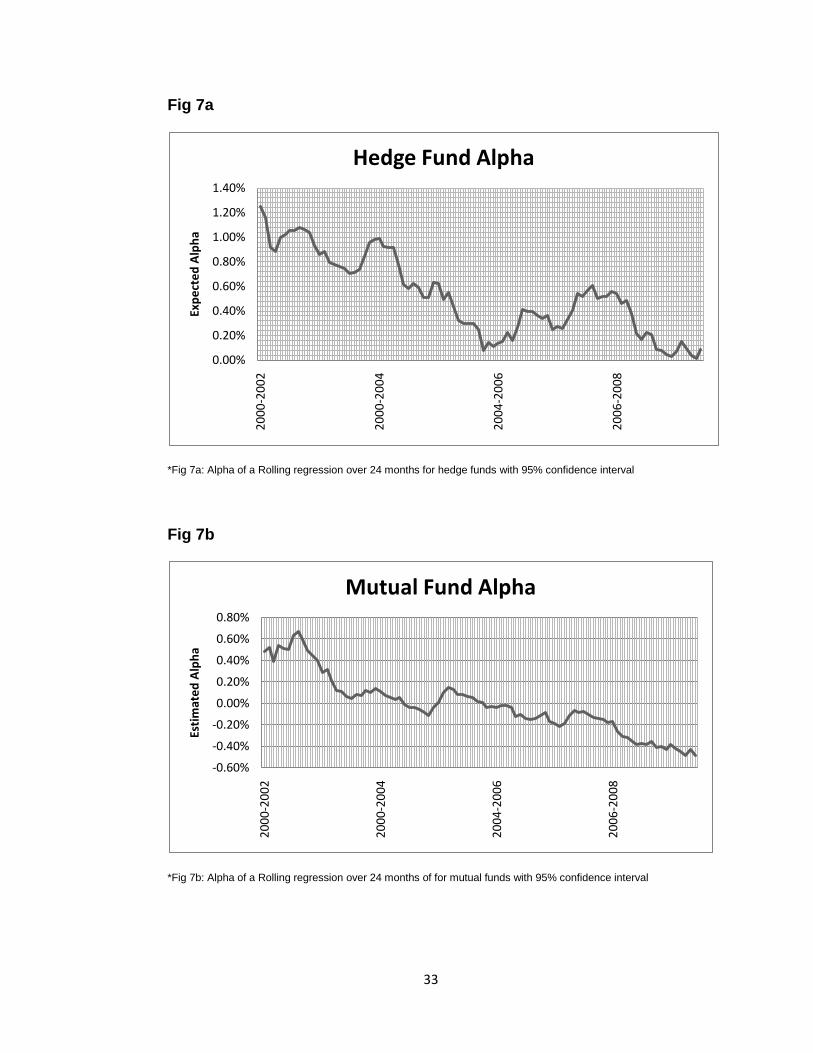
*Fig 7a: Alpha of a Rolling regression over 24 months for hedge funds with 95% confidence interval
Fig 7b
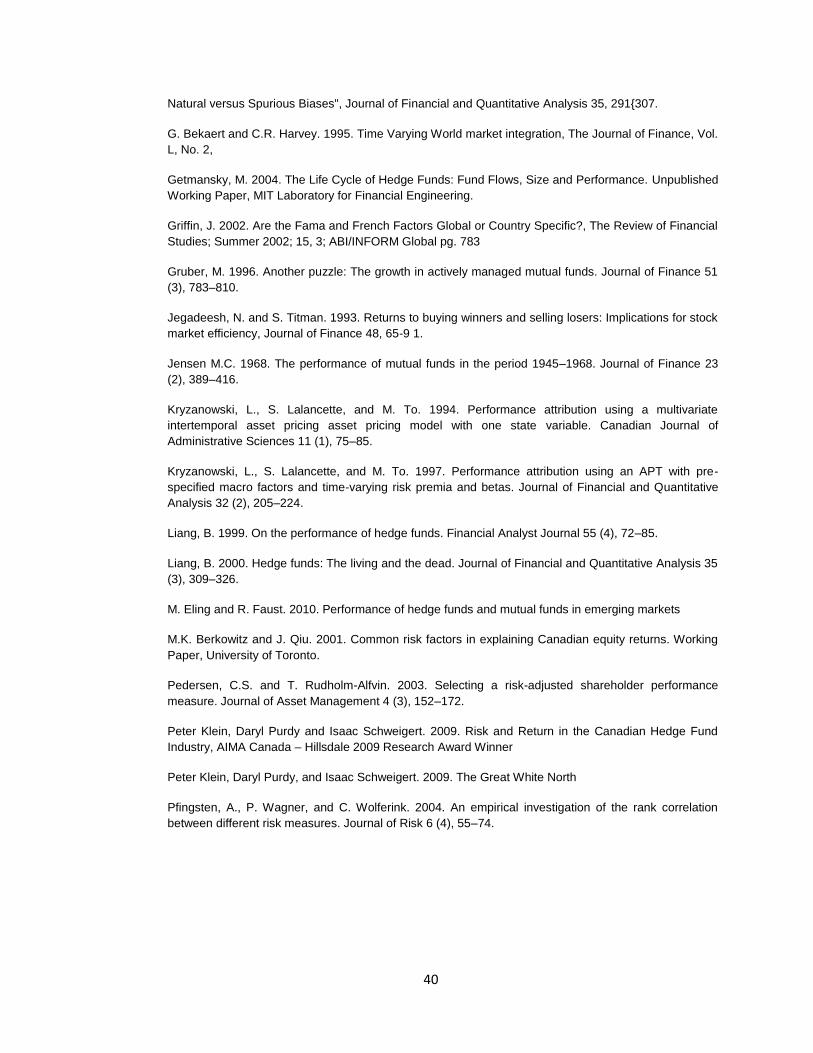
*Fig 7b: Alpha of a Rolling regression over 24 months of for mutual funds with 95% confidence interval
0.00%
0.20%
0.40%
0.60%
0.80%
1.00%
1.20%
1.40%
20
00
-20
02
20
00
-20
04
20
04
-20
06
20
06
-20
08
Exp
ect
ed
Alp
ha
Hedge Fund Alpha
-0.60%
-0.40%
-0.20%
0.00%
0.20%
0.40%
0.60%
0.80%
20
00
-20
02
20
00
-20
04
20
04
-20
06
20
06
-20
08
Esti
mat
ed
Alp
ha
Mutual Fund Alpha

34
4.5 Results in different market environments
The results so far suggest that hedge funds and mutual funds have different
abilities in generating returns during bear and bull markets. To analyze this in
more detail, I have followed procedure adopted by Eling and Faust (2010). I
consider fund performance in different market environments. I therefore,
subdivide the returns of the S&P 500/TSX Composite index into four different
market environments, ranging from severe declines to sharp rallies, by sorting
the monthly returns into four quartiles (see Fung and Hsieh, (1997)). Market
environment 1 contains the worst 30 months of the S&P 500/TSX Composite
index; market environment 4 the best 30 months. The average returns are
then calculated for the S&P 500/TSX Composite index as well as for mutual
fund and hedge fund returns in these months. The results are presented in
Fig. 8 below.
Fig. 8:
Fig 8: Returns in different market environments (1: worst months for S&P 500/TSX Composite Index, 4: best months
for S&P 500/TSX Composite Index).
-5.72%
-0.16%
2.45%
5.52%
-2.14%
0.94%1.92%
3.47%
-4.58%
-0.15%
2.23%
4.60%
-8.00%
-6.00%
-4.00%
-2.00%
0.00%
2.00%
4.00%
6.00%
8.00%
1 2 3 4
TSX/SP500 Monthly Return Hedge Fund Monthly Return
Mutual Fund Monthly Return

35
Fig 9a
Fig 9a
*Fig 9a and 9b: Average monthly return for the period January 2000 to May 2009 for hedge funds (top), and mutual
funds (bottom)
-15.00%
-10.00%
-5.00%
0.00%
5.00%
10.00%
15.00%
Jan
-00
Jul-
00
Jan
-01
Jul-
01
Jan
-02
Jul-
02
Jan
-03
Jul-
03
Jan
-04
Jul-
04
Jan
-05
Jul-
05
Jan
-06
Jul-
06
Jan
-07
Jul-
07
Jan
-08
Jul-
08
Jan
-09
Mo
nth
ly A
vera
ge R
etu
rn
Hedge Funds Return
-20.00%
-15.00%
-10.00%
-5.00%
0.00%
5.00%
10.00%
Jan
-00
Jul-
00
Jan
-01
Jul-
01
Jan
-02
Jul-
02
Jan
-03
Jul-
03
Jan
-04
Jul-
04
Jan
-05
Jul-
05
Jan
-06
Jul-
06
Jan
-07
Jul-
07
Jan
-08
Jul-
08
Jan
-09
Mo
nth
ly A
vera
ge R
etu
rn
Mutual Fund Return

36
Not surprisingly, given the correlation of 0.95, the mutual fund portfolio tends
to be less extreme, i.e., in the worst months (market environment 1) mutual
funds are slightly better than the index and in the best months (market
environment 4), mutual funds underperform the market. Hedge fund returns
are almost identical to the mutual fund returns in good market environments
(market environments 3 and 4). Interestingly, however, in bad market
environments (market environments 1 and 2) hedge funds outperform both
the market as well as their mutual fund competitors. The average return of
mutual funds is more extreme than the hedge fund returns in most recent
period as shown in Fig.9a and Fig.9b. It thus appears that mutual funds have
a relative constant exposure with regard to different market environments,
whereas hedge funds might be able to profit from non-directional strategies,
providing, at least to some extent, downside protection in an unfavourable
market environment (market environments 1 and 2).
5. Conclusion
The contribution of this project is to employ various risk adjusted performance
measures and factor models to compare returns of hedge funds and mutual
funds active in Canadian markets. I find that hedge funds provide both higher
returns and alphas than do traditional mutual funds, similar to findings of Eling
and Faust (2010) for European data. In general, both hedge funds and mutual
funds tend to outperform the benchmarks but hedge funds outperform the

37
benchmark with much higher magnitude. One possible reason could be more
active management of hedge funds than of mutual funds. I find support for
this hypothesis from the tests for structural breaks, the factor exposure, and
from the analysis of the performance in different market environments.
Regarding structural breaks, I only find significant breakpoints for hedge
funds but not for mutual funds. This indicates that hedge funds are adjusting
their risk taking while mutual funds are not. The factor exposure of hedge
funds, which I reveal using a rolling regression, shows that hedge funds have
a more volatile exposure, supporting the idea of a more active management.
The analysis of different market environments shows that hedge funds
provide to some extent downside protection in contrast to mutual funds that
have a rather constant exposure to market movements.
In conclusion, it seems that Canadian market hedge funds are more active in
shifting their asset allocation, probably since they are less restricted by their
investors in investment style and policy. Also, the correlations among different
hedge fund strategies are low which make hedge funds better investment
vehicles in terms of diversification (see Liang (1999)). However, investors
need to be aware that aside from the differences in their flexibility regarding
asset allocation there are numerous reasons which might be responsible for
the performance difference between mutual funds and hedge funds, including
the use of leverage, lock-up periods, and incentive fees for hedge fund
managers. Lock-up periods are also a good example to emphasize the higher

38
degree of freedom hedge fund managers enjoy in making investment
decisions. For example, hedge funds might invest in illiquid positions and
capture liquidity risk premiums, actions not allowed to traditional mutual funds
(see Ding et al., 2009, for an analysis of liquidity in the hedge fund context). In
case of illiquid investments, investors need to be aware that hedge fund
managers might smooth their returns (see Getmansky et al. (2004)), which
might bias performance measurement results. Most of the hedge funds report
their return net of all fees including management fees, incentive fees,
commission fees, and other fees. Morningstar data for mutual funds deduct
management expense ratio. Hedge funds have a special fee structure
designed for managers. Along with management fees, an incentive fee is
established separately to align the manager’s interest with the fund’s
performance. In addition, a majority of hedge funds have a high watermark
provision. Under such a provision, the manager is required to make up any
previous losses before an incentive fee is paid. All these features, together
with the fact that the hedge fund manager is a partner himself and that his
personal wealth is closely tied to his performance, give him better incentive
schemes compared to the mutual funds which have flat fee structure.

39
6. Bibliography
Abernathy, J.D. and Weisman, A.B. 2000. The danger of historical hedge fund data, working paper
Agarwal, V. and N.Y. Naik. 2000. Multi-Period performance persistence analysis of hedge funds.
Journal of Financial and Quantitative Analysis 35 (3), 327–342.
Agarwal, V. and N.Y. Naik. 2000b. On Taking the ‘Alternative’ Route: The Risks, Rewards, and
Performance Persistence of Hedge Funds. Journal of Alternative Investments 2, 6–23.
Athanassakos, G., P. Carayannopoulos, and M. Racine. 1999. Mutual fund performance: The Canadian
experience between 1985 and 1996. Wilfred Laurier University, working paper.
Berkowitz, M. and Y. Kotowitz. 1993. Incentives and efficiency in the market for management services:
A study of Canadian mutual funds. Canadian Journal of Economics 26 (4), 850–866.
Blake, C.R., Elton, E.J., and Gruber M.J. 1996. Survivorship bias and mutual fund performance, The
review of Financial Studies, Vol. 9, No. 4, pp. 1097-1120
Brulhart, Todd, and Peter Klein. 2005. Are extreme hedge fund returns problematic? Working paper,
Simon Fraser University; 2005 AIMA Canada research award winner.
Capocci, D. and G. Hübner. 2004. Analysis of hedge fund performance. Journal of Empirical Finance 11
(1), 55–89.
Carhart, M. 1997. On persistence in mutual fund performance. Journal of Finance 52 (1), 57–82.
Deaves, R. 2002. Data-conditioning biases, performance, persistence and flows: The case of Canadian
equity funds, Journal of Banking & Finance, Vol 28, Issue 3, pp. 673-694
D.K. Patro. 2001. Measuring performance of international closed-end funds. Journal of Banking &
Finance 25 (9), 1741–1767.
Eling, M. and F. Schuhmacher. 2006. Does the choice of performance measure influence the evaluation
of hedge funds?, Journal of Banking & Finance 31 (2007) 2632–2647
Elton, E., M. Gruber, and C. Blake. 1996a. Survivorship bias and mutual fund performance. Review of
Financial Studies 9 (4), 1097–1120.
Elton, E., M. Gruber, S. Das, and M. Hlavka. 1993. Efficiency with costly information: Are interpretation
of evidence from managed portfolios. Review of Financial Studies 6 (1), 1–22.
Fama, E.F. and French, K.R. 1993. Common risk factors in the returns on stocks and bonds. Journal of
Financial Economics 33 (1), 3–56.
Fama, E.F. and French, K.R. 1998. Value versus growth: the international evidence, Journal of Finance
53, 1975–1999.
Fuller, R. J. and Farrel J.L. Jr. 1993. Analisi degli investimenti finanziari, McGraw Hill, Milano, pp. 67-90
Fung, W. and D.A. Hsieh. 1997. Empirical characteristics of dynamic trading strategies: The case of
hedge funds. Review of Financial Studies 10 (2), 275–302.
Fung, W. and D.A. Hsieh. 2000. Performance Characteristics of Hedge Funds a Commodity Funds:
40
Natural versus Spurious Biases", Journal of Financial and Quantitative Analysis 35, 291{307.
G. Bekaert and C.R. Harvey. 1995. Time Varying World market integration, The Journal of Finance, Vol.
L, No. 2,
Getmansky, M. 2004. The Life Cycle of Hedge Funds: Fund Flows, Size and Performance. Unpublished
Working Paper, MIT Laboratory for Financial Engineering.
Griffin, J. 2002. Are the Fama and French Factors Global or Country Specific?, The Review of Financial
Studies; Summer 2002; 15, 3; ABI/INFORM Global pg. 783
Gruber, M. 1996. Another puzzle: The growth in actively managed mutual funds. Journal of Finance 51
(3), 783–810.
Jegadeesh, N. and S. Titman. 1993. Returns to buying winners and selling losers: Implications for stock
market efficiency, Journal of Finance 48, 65-9 1.
Jensen M.C. 1968. The performance of mutual funds in the period 1945–1968. Journal of Finance 23
(2), 389–416.
Kryzanowski, L., S. Lalancette, and M. To. 1994. Performance attribution using a multivariate
intertemporal asset pricing asset pricing model with one state variable. Canadian Journal of
Administrative Sciences 11 (1), 75–85.
Kryzanowski, L., S. Lalancette, and M. To. 1997. Performance attribution using an APT with pre-
specified macro factors and time-varying risk premia and betas. Journal of Financial and Quantitative
Analysis 32 (2), 205–224.
Liang, B. 1999. On the performance of hedge funds. Financial Analyst Journal 55 (4), 72–85.
Liang, B. 2000. Hedge funds: The living and the dead. Journal of Financial and Quantitative Analysis 35
(3), 309–326.
M. Eling and R. Faust. 2010. Performance of hedge funds and mutual funds in emerging markets
M.K. Berkowitz and J. Qiu. 2001. Common risk factors in explaining Canadian equity returns. Working
Paper, University of Toronto.
Pedersen, C.S. and T. Rudholm-Alfvin. 2003. Selecting a risk-adjusted shareholder performance
measure. Journal of Asset Management 4 (3), 152–172.
Peter Klein, Daryl Purdy and Isaac Schweigert. 2009. Risk and Return in the Canadian Hedge Fund
Industry, AIMA Canada – Hillsdale 2009 Research Award Winner
Peter Klein, Daryl Purdy, and Isaac Schweigert. 2009. The Great White North
Pfingsten, A., P. Wagner, and C. Wolferink. 2004. An empirical investigation of the rank correlation
between different risk measures. Journal of Risk 6 (4), 55–74.
Recommended