Performance Budgeting
United Kingdom Experience
11th Annual OECD Asian Senior Budget Officials Meeting
Bangkok, 17 December 2015
Julian Kelly
Director-General, Public Spending and Finance
Contents
1. Spending Review
2. Performance frameworks
3. Costing
2
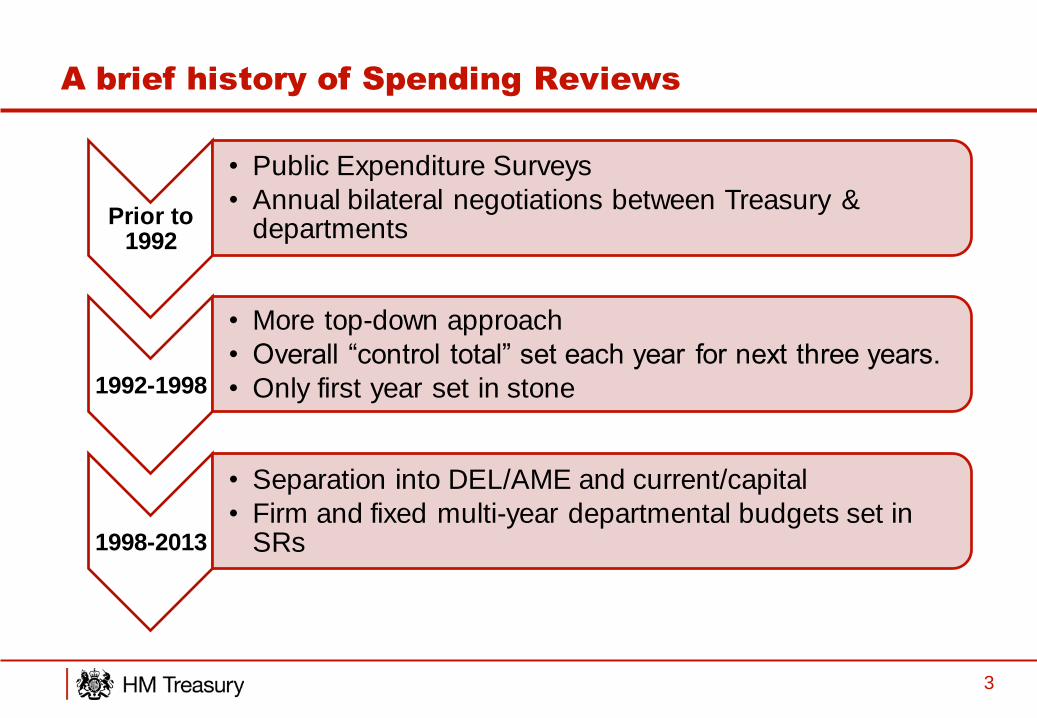
A brief history of Spending Reviews
Prior to 1992
• Public Expenditure Surveys
• Annual bilateral negotiations between Treasury & departments
1992-1998
• More top-down approach
• Overall “control total” set each year for next three years.
• Only first year set in stone
1998-2013
• Separation into DEL/AME and current/capital
• Firm and fixed multi-year departmental budgets set in SRs
3
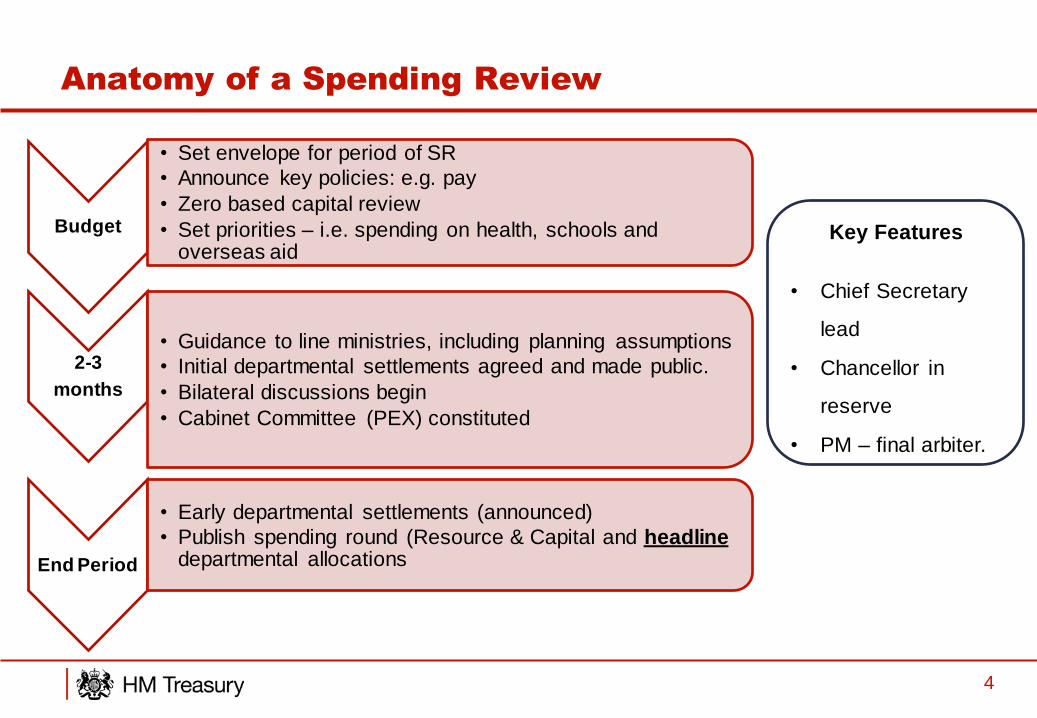
Anatomy of a Spending Review
4
Budget
• Set envelope for period of SR
• Announce key policies: e.g. pay
• Zero based capital review
• Set priorities – i.e. spending on health, schools and overseas aid
2-3
months
• Guidance to line ministries, including planning assumptions
• Initial departmental settlements agreed and made public.
• Bilateral discussions begin
• Cabinet Committee (PEX) constituted
End Period
• Early departmental settlements (announced)
• Publish spending round (Resource & Capital and headline departmental allocations
Key Features
• Chief Secretary
lead
• Chancellor in
reserve
• PM – final arbiter.
Key Reflections
• In the UK, the Finance Ministry runs the timetable/process and provides
guidance on the spending review framework
• Setting the key parameters and providing clear guidance at the start
manages expectations and provides certainty for departments and markets
• Success of zero based review for allocating capital investment
• Engagement with a broad range of stakeholders
• Planning ahead: start work early on the next review
5
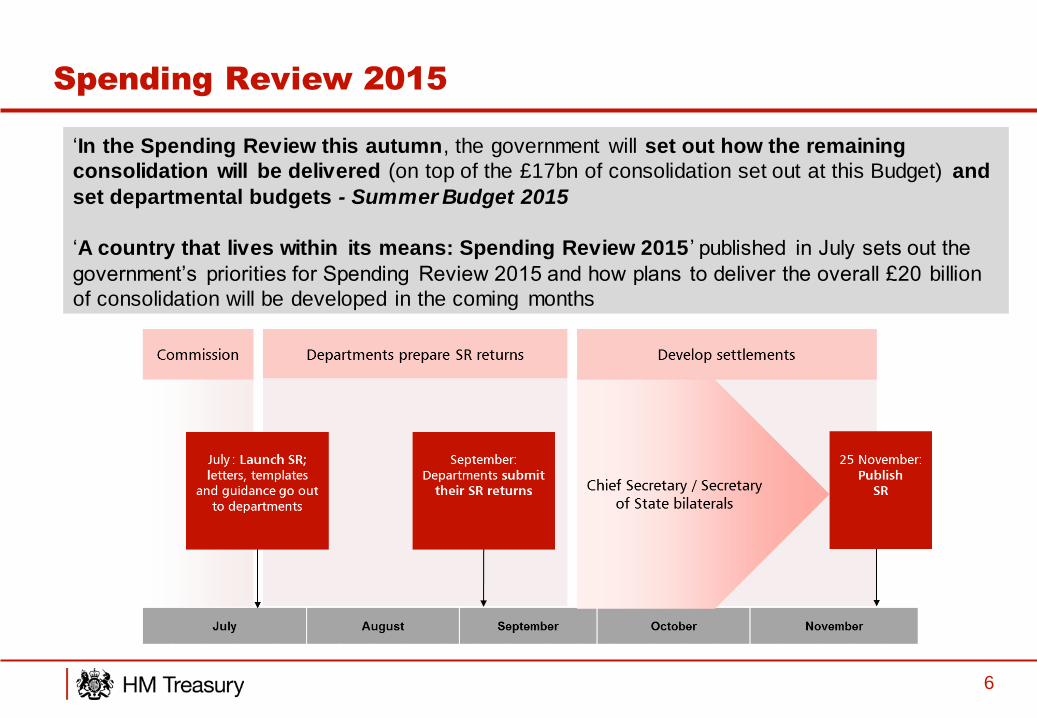
Spending Review 2015
6
‘In the Spending Review this autumn, the government will set out how the remaining
consolidation will be delivered (on top of the £17bn of consolidation set out at this Budget) and
set departmental budgets - Summer Budget 2015
‘A country that lives within its means: Spending Review 2015 ’ published in July sets out the
government’s priorities for Spending Review 2015 and how plans to deliver the overall £20 billion
of consolidation will be developed in the coming months
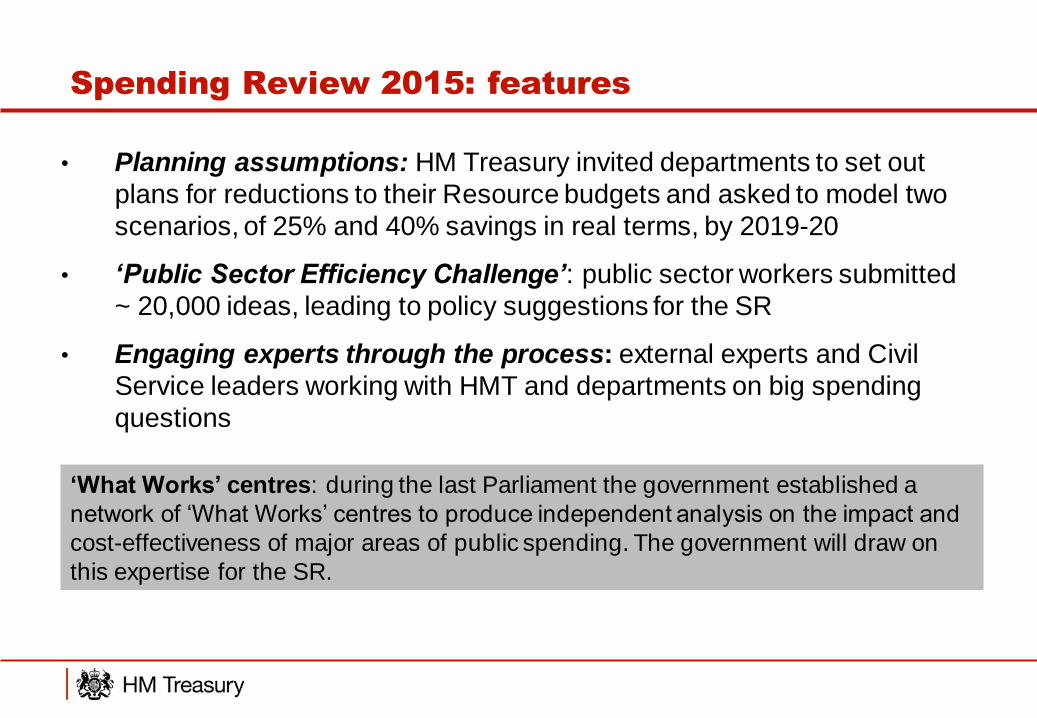
• Planning assumptions: HM Treasury invited departments to set out
plans for reductions to their Resource budgets and asked to model two
scenarios, of 25% and 40% savings in real terms, by 2019-20
• ‘Public Sector Efficiency Challenge’: public sector workers submitted
~ 20,000 ideas, leading to policy suggestions for the SR
• Engaging experts through the process: external experts and Civil
Service leaders working with HMT and departments on big spending
questions
Spending Review 2015: features
‘What Works’ centres: during the last Parliament the government established a
network of ‘What Works’ centres to produce independent analysis on the impact and
cost-effectiveness of major areas of public spending. The government will draw on
this expertise for the SR.
Contents
1. Spending Review
2. Performance frameworks
3. Costing
2
Context: our current performance framework is facing
a number of challenges
• In 2010, the government reformed performance management
o Abolished PSAs, replacing them with Departmental Business Plans
• The context/ environment has changed significantly in the last 5-10 years. The
financial environment is more constrained, the ‘low fruit’ been picked, and performance frameworks need to be adapted accordingly to ensure that money is spent in the most
effective way
• A number of challenges have arisen since 2010:
o BPs are not an effective performance management tool o Not linked to spend, and do not track VfM
• The current environment is a good opportunity to reassess & reform performance
management
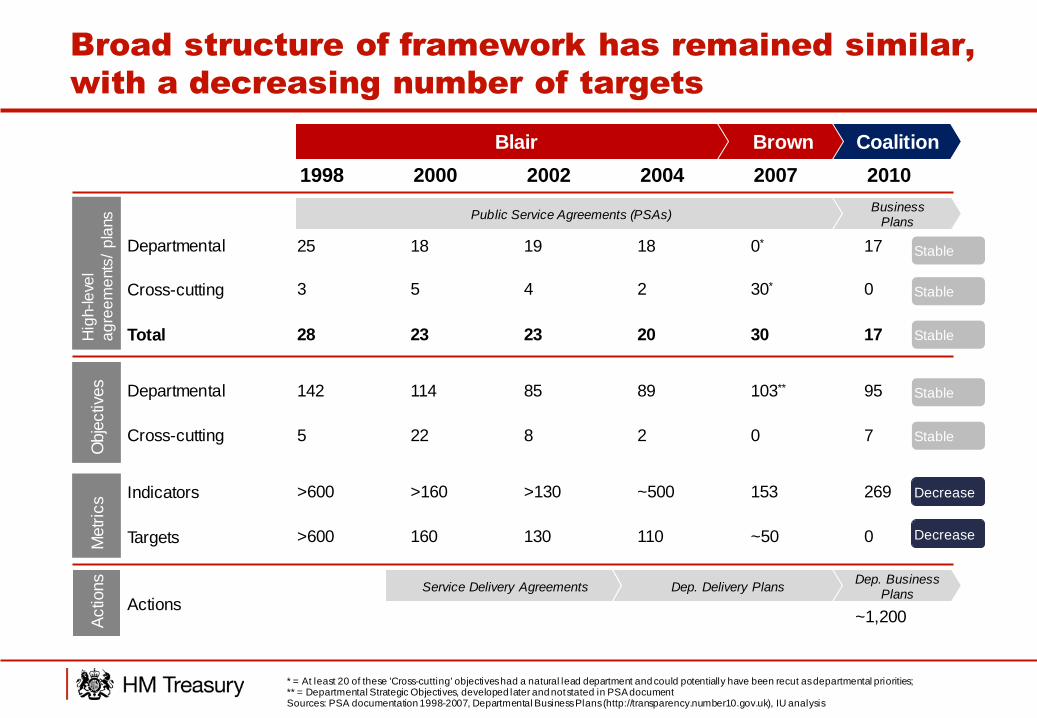
Broad structure of framework has remained similar,
with a decreasing number of targets
1998 2000 2002 2004 2007 2010
Blair Brown Coalition
Public Service Agreements (PSAs) Business
Plans
Departmental
Cross-cutting
Total Hig
h-le
vel
ag
ree
me
nts
/ p
lans
Service Delivery Agreements Dep. Delivery Plans Dep. Business
Plans
25 18 19 18 0* 17
3 5 4 2 30* 0
28 23 23 20 30 17
Obje
ctiv
es
Departmental 89 103** 95
Cross-cutting 2 0 7
85
8
114
22
142
5
Indicators
Targets
>600 >160 >130 ~500 153 269
>600 160 130 110 ~50 0 Metr
ics
Actions ~1,200 A
ctio
ns
* = At least 20 of these 'Cross-cutting' objectives had a natural lead department and could potentially have been recut as departmental priorities; ** = Departmental Strategic Objectives, developed later and not stated in PSA document Sources: PSA documentation 1998-2007, Departmental Business Plans (http://transparency.number10.gov.uk), IU analysis
Decrease
Stable
Stable
Stable
Stable
Stable
Decrease
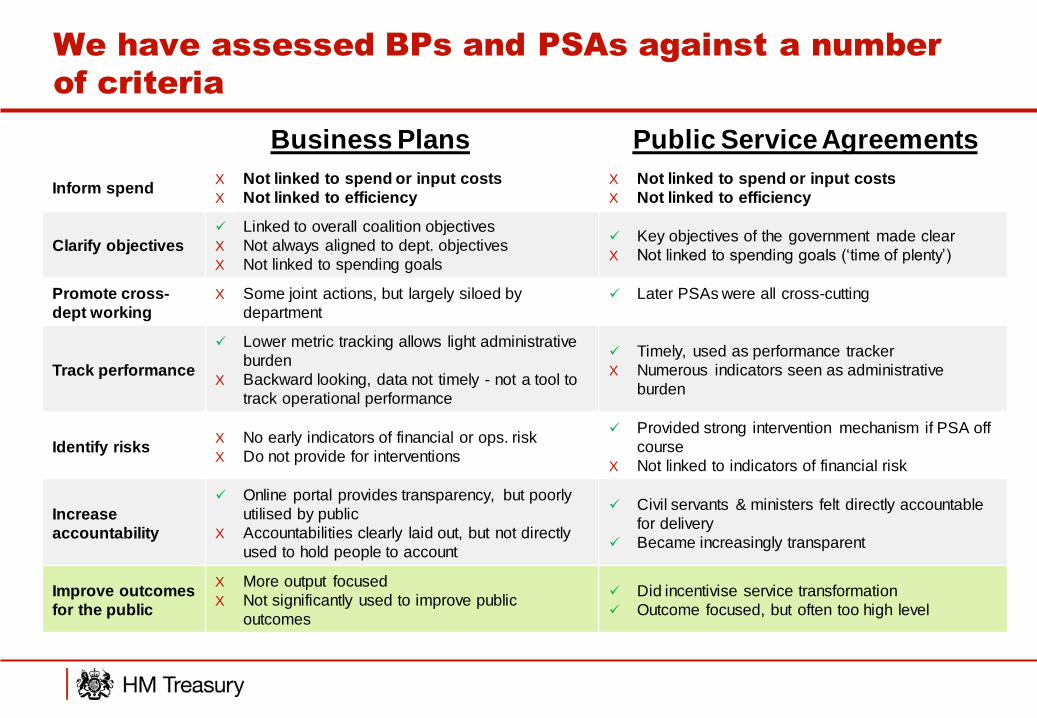
We have assessed BPs and PSAs against a number
of criteria
Inform spend X Not linked to spend or input costs
X Not linked to efficiency
X Not linked to spend or input costs
X Not linked to efficiency
Clarify objectives
Linked to overall coalition objectives
X Not always aligned to dept. objectives
X Not linked to spending goals
Key objectives of the government made clear
X Not linked to spending goals (‘time of plenty’)
Promote cross-
dept working
X Some joint actions, but largely siloed by
department
Later PSAs were all cross-cutting
Track performance
Lower metric tracking allows light administrative
burden
X Backward looking, data not timely - not a tool to
track operational performance
Timely, used as performance tracker
X Numerous indicators seen as administrative
burden
Identify risks X No early indicators of financial or ops. risk
X Do not provide for interventions
Provided strong intervention mechanism if PSA off
course
X Not linked to indicators of financial risk
Increase
accountability
Online portal provides transparency, but poorly
utilised by public
X Accountabilities clearly laid out, but not directly
used to hold people to account
Civil servants & ministers felt directly accountable
for delivery
Became increasingly transparent
Improve outcomes
for the public
X More output focused
X Not significantly used to improve public
outcomes
Did incentivise service transformation
Outcome focused, but often too high level
Business Plans Public Service Agreements
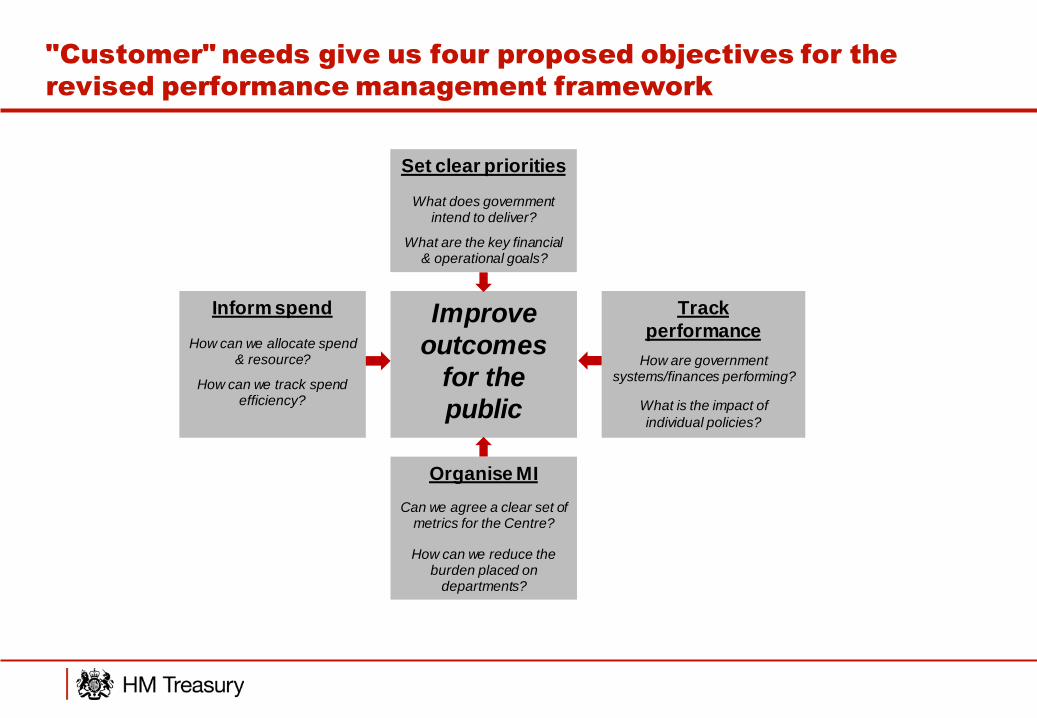
"Customer" needs give us four proposed objectives for the
revised performance management framework
Improve
outcomes
for the
public
Organise MI
Can we agree a clear set of metrics for the Centre?
How can we reduce the burden placed on
departments?
Track
performance
How are government systems/finances performing?
What is the impact of
individual policies?
Inform spend
How can we allocate spend & resource?
How can we track spend efficiency?
Set clear priorities
What does government intend to deliver?
What are the key financial & operational goals?
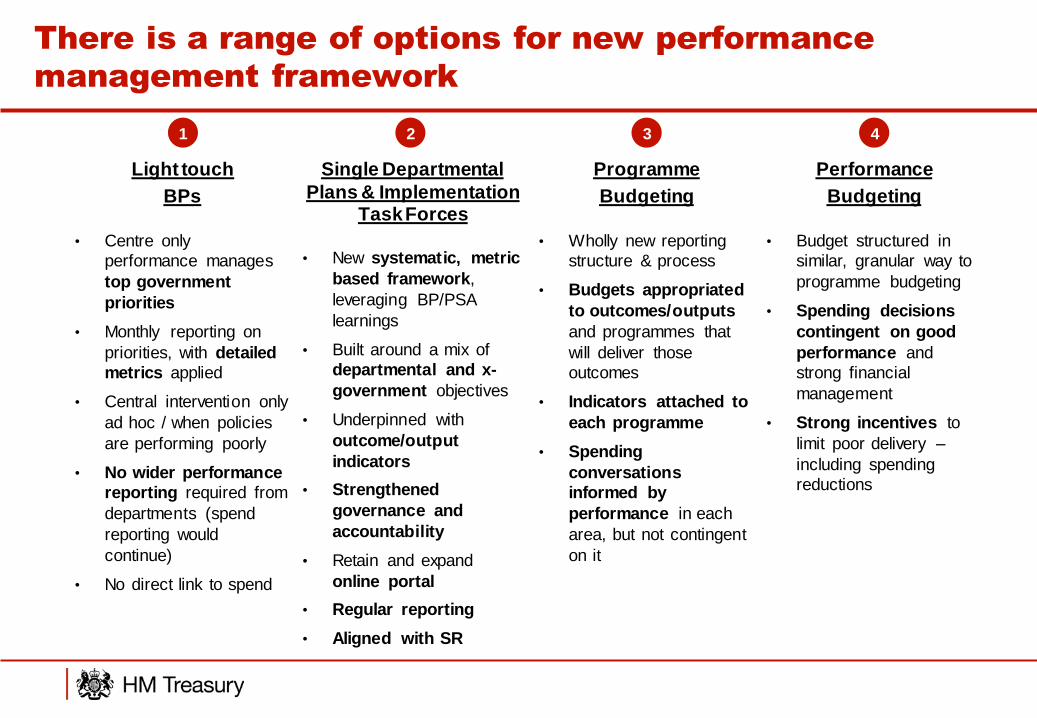
There is a range of options for new performance
management framework
Light touch
BPs
• Centre only
performance manages
top government
priorities
• Monthly reporting on
priorities, with detailed
metrics applied
• Central intervention only
ad hoc / when policies
are performing poorly
• No wider performance
reporting required from
departments (spend
reporting would
continue)
• No direct link to spend
Single Departmental
Plans & Implementation Task Forces
• New systematic, metric
based framework,
leveraging BP/PSA
learnings
• Built around a mix of
departmental and x-
government objectives
• Underpinned with
outcome/output
indicators
• Strengthened
governance and
accountability
• Retain and expand
online portal
• Regular reporting
• Aligned with SR
Programme
Budgeting
• Wholly new reporting
structure & process
• Budgets appropriated
to outcomes/outputs
and programmes that
will deliver those
outcomes
• Indicators attached to
each programme
• Spending
conversations
informed by
performance in each
area, but not contingent
on it
1 2 3
Performance
Budgeting
• Budget structured in
similar, granular way to
programme budgeting
• Spending decisions
contingent on good
performance and
strong financial
management
• Strong incentives to
limit poor delivery –
including spending
reductions
4
Contents
1. Spending Review
2. Performance frameworks
3. Costing
2
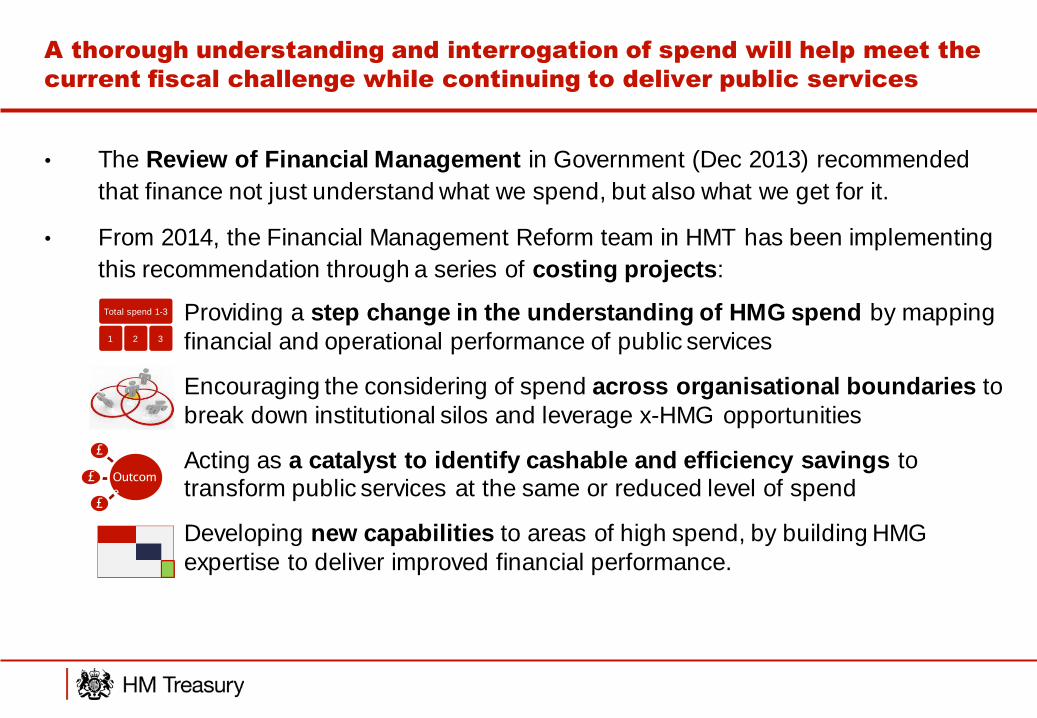
A thorough understanding and interrogation of spend will help meet the
current fiscal challenge while continuing to deliver public services
• Providing a step change in the understanding of HMG spend by mapping
financial and operational performance of public services
• Encouraging the considering of spend across organisational boundaries to
break down institutional silos and leverage x-HMG opportunities
• Acting as a catalyst to identify cashable and efficiency savings to transform public services at the same or reduced level of spend
• Developing new capabilities to areas of high spend, by building HMG
expertise to deliver improved financial performance.
Total spend 1-3
1 2 3
£
£
£
Outcom
e
• The Review of Financial Management in Government (Dec 2013) recommended
that finance not just understand what we spend, but also what we get for it.
• From 2014, the Financial Management Reform team in HMT has been implementing
this recommendation through a series of costing projects:
Questions?
Recommended