Perceptual Audio Coding
&<+��(,(�'HSW��+.3RO\8 2
■ Preface
■ Physiology of thehuman ear� Critical bands
� Threshold of hearing
� Amplitude masking
� Temporal masking
■ Rationale forperceptual coding
■ Coding techniques� Subband coding
� Transform coding
■ MPEG Audio standards� MP1
� MP2
� MP3
&<+��(,(�'HSW��+.3RO\8 3
Preface
■ Traditionally, audio recording systems haveused objective parameters as their designgoals - flat response, minimal noise, and soon.
■ Perceptual coders recognize that the finalreceiver is the human auditory system andmake use it to code audio signals.
Physiology of the human ear
&<+��(,(�'HSW��+.3RO\8 5
Critical bands
■ The ear contains roughly 30,000 hair cellsarranged in multiple rows along the basilarmembrane.
■ Hair cells respond to the strongeststimulation in their local regions calledcritical bands.
■ Critical bands are not fixed and any audibletone will create a critical band centered onit.
&<+��(,(�'HSW��+.3RO\8 6
■ Critical bands are much narrower at lowfrequencies than at high frequencies.
■ Critical bandwidth (Hz) =24.7(4.37fc+1),where fc is the center frequency in kHz.
■ The critical band concept is an empiricalphenomenon.
&<+��(,(�'HSW��+.3RO\8 7
■ The bark is a unit to measure the criticalband rate.
■ A critical band has a width of 1 bark.
■ Critical bands are important in perceptualcoding because they show that the eardiscriminates between energy in the band,and the energy outside the band; inparticular, this promotes masking.
&<+��(,(�'HSW��+.3RO\8 8
Threshold of hearing
■ Two fundamental phenomena that governhuman hearing are the minimum hearingthreshold and masking.
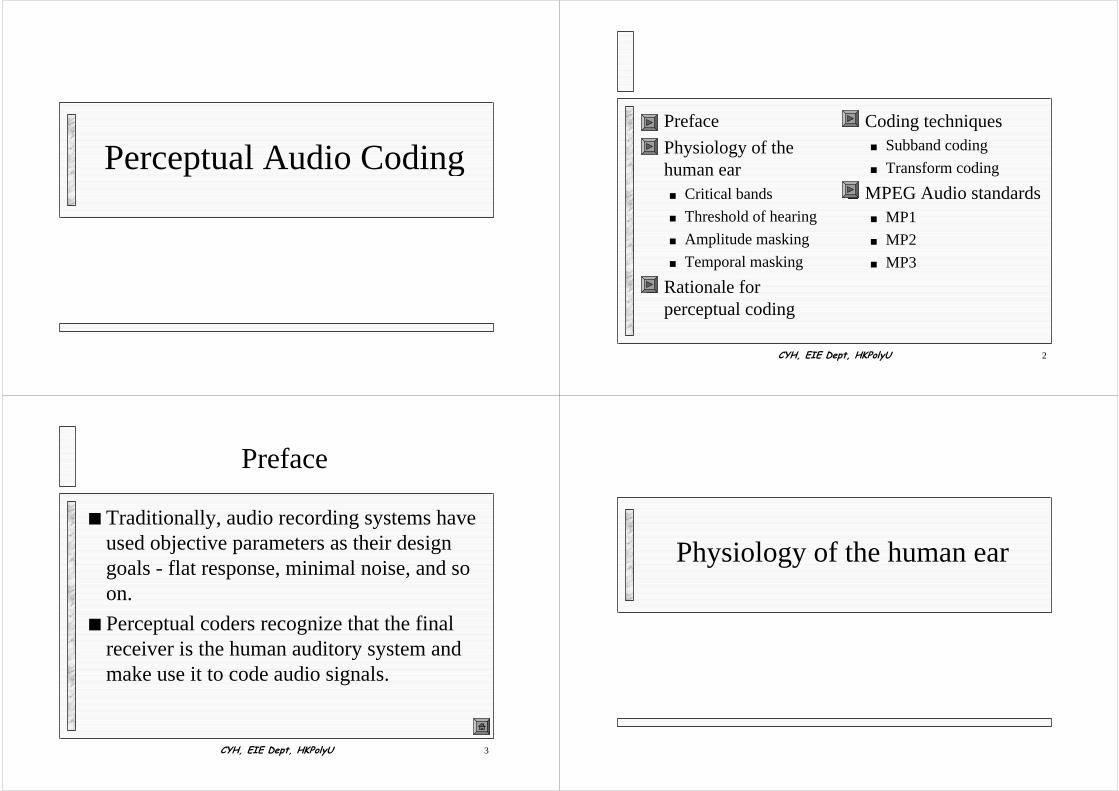
■ The threshold of hearing curve describes theminimum level at which the ear can detect atone at a given frequency.
■ The ear is most sensitive around 1 to 5 kHz.
&<+��(,(�'HSW��+.3RO\8 9 &<+��(,(�'HSW��+.3RO\8 10
Amplitude masking
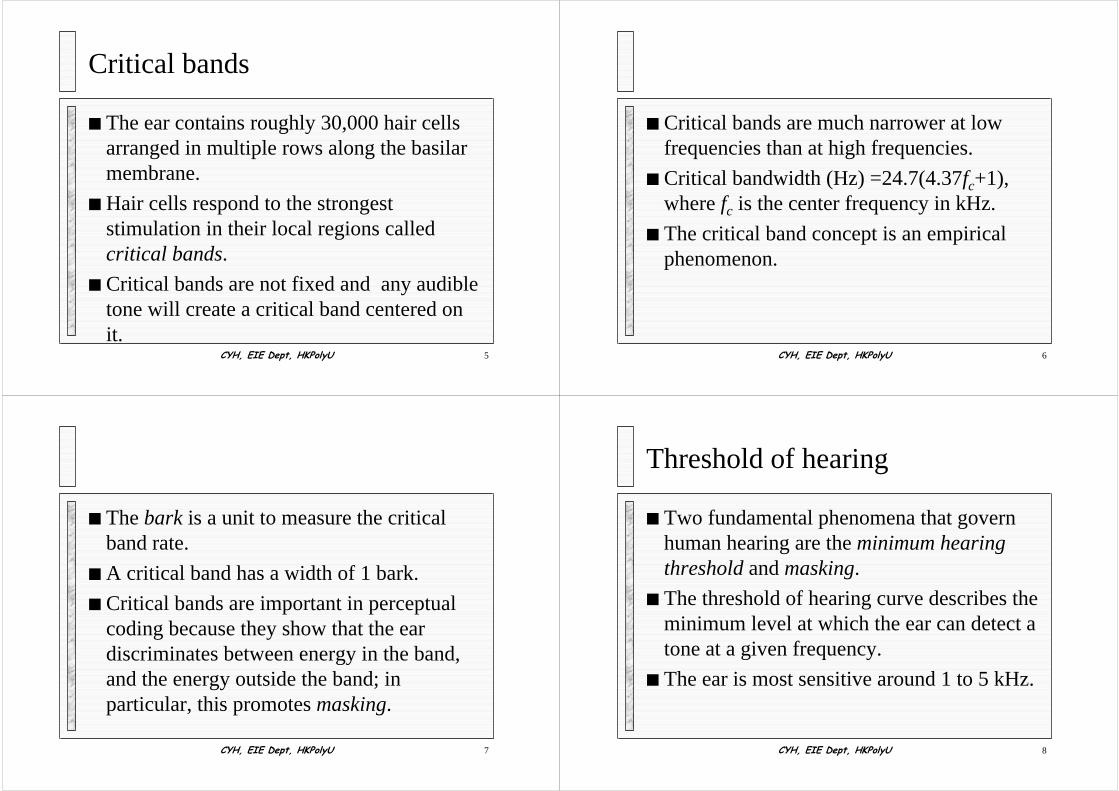
■ Amplitude masking occurs when a toneshifts the threshold curve upward in afrequency region surrounding the tone.
■ The masking threshold describes the levelwhere a tone is barely audible.
■ The strong sound is called the masker andthe softer sound is called the maskee.
&<+��(,(�'HSW��+.3RO\8 11 &<+��(,(�'HSW��+.3RO\8 12
■ Masking theory argues that the softer tone isjust detectable when its energy equals theenergy of the part of the louder maskingsignal in the critical band.
■ Masking can overlap adjacent critical bandswhen a signal is loud or contains harmonics.

&<+��(,(�'HSW��+.3RO\8 13 &<+��(,(�'HSW��+.3RO\8 14
■ Louder or more complex tones providegreater masking with masking curves thatare broadened and with greater high-frequency extension.
&<+��(,(�'HSW��+.3RO\8 15 &<+��(,(�'HSW��+.3RO\8 16
■ Simultaneous masking curves areasymmetrical in a way that the slope of theshifted curve is less steep on the high-frequency side.
■ As sound level of the masker increases, thethreshold curve broadens, and in particularits upper slope decreases while lower sloperemains relatively unaffected.
&<+��(,(�'HSW��+.3RO\8 17 &<+��(,(�'HSW��+.3RO\8 18
Temporal masking
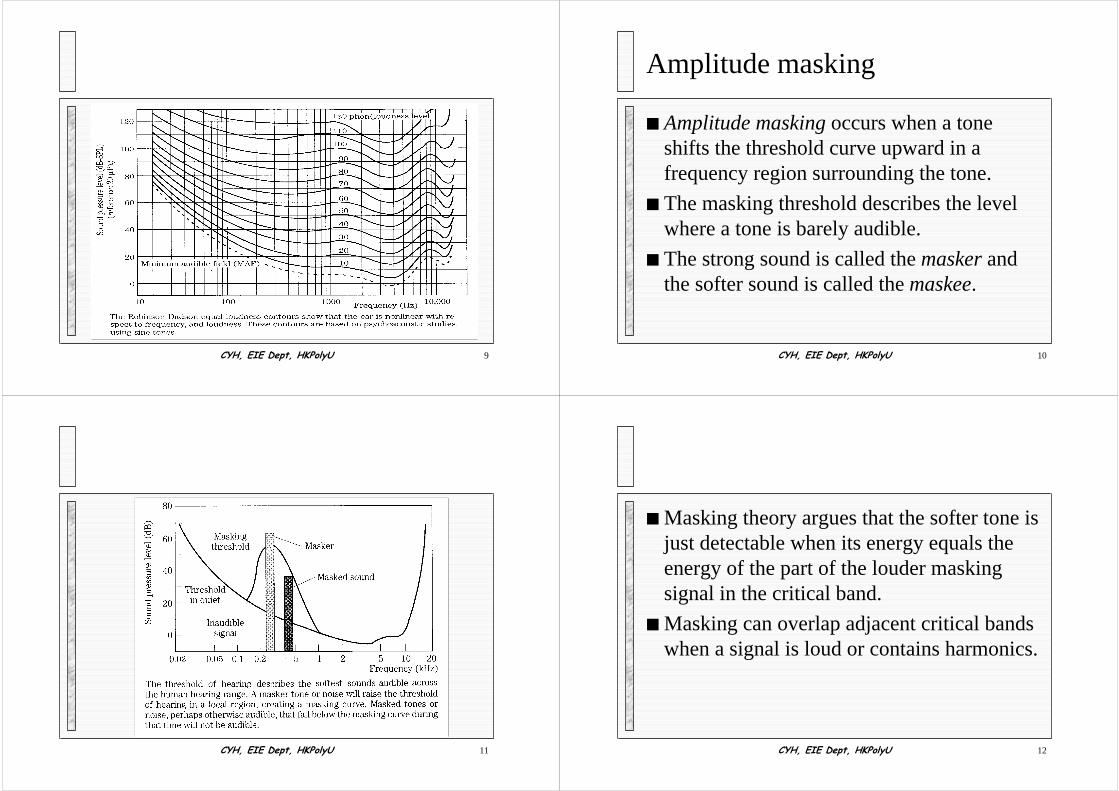
■ Temporal masking occurs when tones aresounded close in time, but notsimultaneously.
■ A louder tone appearing just after(premasking), or before (postmasking) asofter tone overcomes the softer tone.
&<+��(,(�'HSW��+.3RO\8 19
Before maskerexists
After maskerexists
Maskerexists
&<+��(,(�'HSW��+.3RO\8 20
&<+��(,(�'HSW��+.3RO\8 21
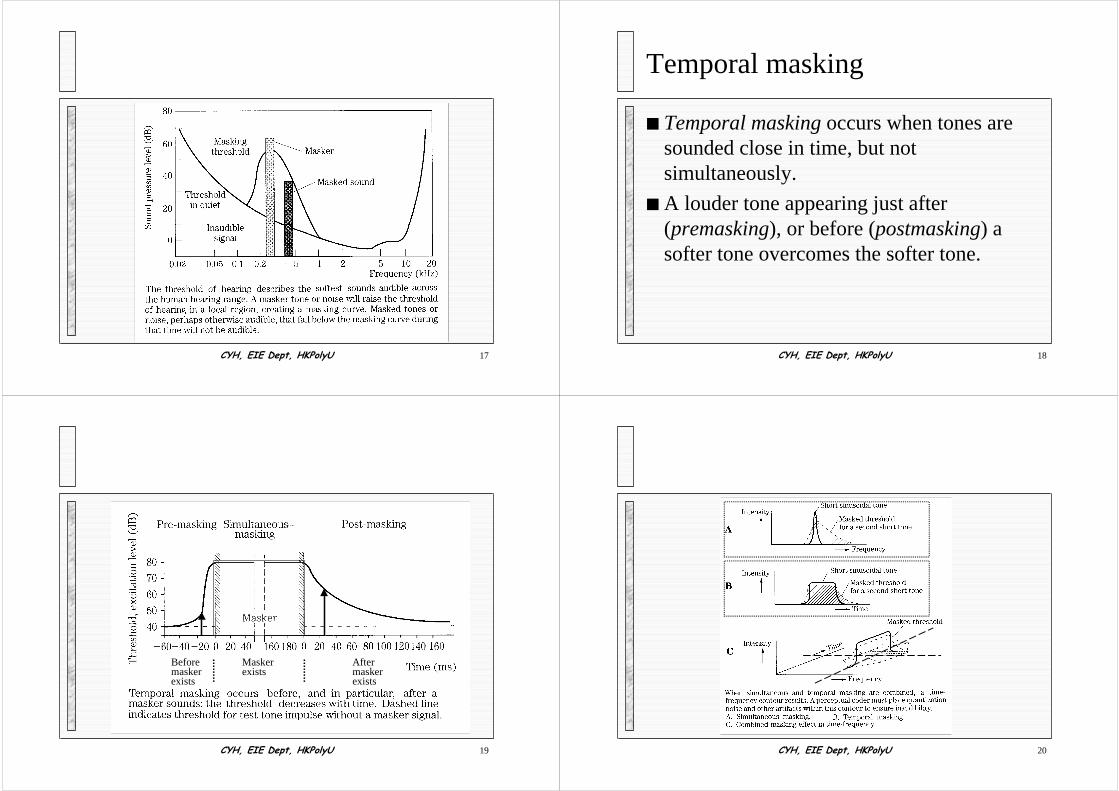
■ Amplitude and temporal masking form acontour that can be mapped in the time-frequency domain.
■ Perceptual coders identify this contour forchanging signal conditions, and code thesignal appropriately.
&<+��(,(�'HSW��+.3RO\8 22
■ Using diverse and dynamically changingpsychoacoustical cues and signal analysis,inaudible components can be removed withacceptable degradation.
Rational for Perceptual Coding
&<+��(,(�'HSW��+.3RO\8 24
■ Perceptual coding systems analyze thefrequency and amplitude content of theinput signal, compare it to a model ofhuman auditory perception, and code itaccordingly.
■ Tests show that ratios of 4:1 or 6:1 can betransparent.

&<+��(,(�'HSW��+.3RO\8 25
■ The coding performance of perceptualcoding relies on the following factors:� Only audible information is coded.
� Bits are assigned according to audibility.
� Quantization error is confined in a critical band.
&<+��(,(�'HSW��+.3RO\8 26
■ Perceptual coding is tolerant of errors.� With PCM, an error introduces a broadband
noise.
� With most perceptual coders, the error islimited to a narrow band corresponding to thebandwidth of the coded critical band, thuslimiting its loudness.
Coding Techniques
&<+��(,(�'HSW��+.3RO\8 28
■ There are two types of frequency domaincoders: subband and transform coders.
■ Both coders operate over a block ofsamples.
■ This block must be kept short to stay withinthe temporal resolution of the ear.
&<+��(,(�'HSW��+.3RO\8 29
■ In practical applications, many coders arehybrid coders which combine techniquesfrom both subband and transform coding.
&<+��(,(�'HSW��+.3RO\8 30
Subband coding:
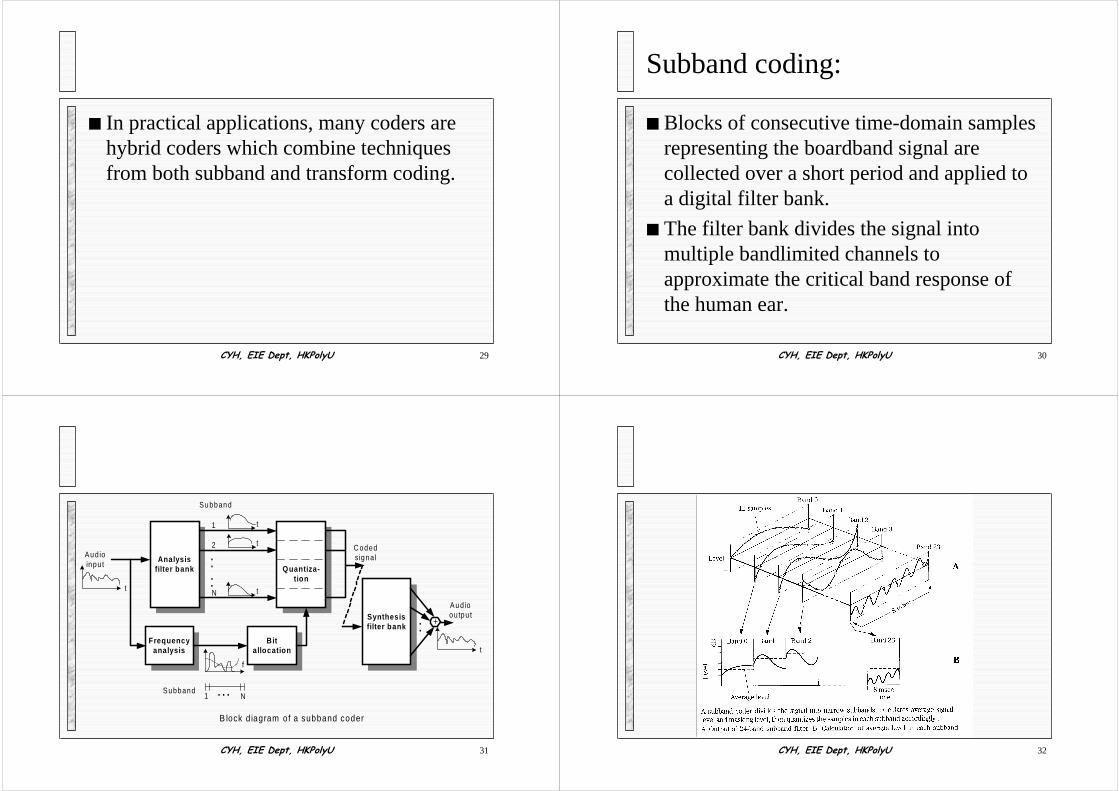
■ Blocks of consecutive time-domain samplesrepresenting the boardband signal arecollected over a short period and applied toa digital filter bank.
■ The filter bank divides the signal intomultiple bandlimited channels toapproximate the critical band response ofthe human ear.
&<+��(,(�'HSW��+.3RO\8 31
Analysisfilter bank
Frequencyanalysis
Subband
::
Audioinpu t
f
Bitallocation
Quantiza-tion
t
t
t
1
2
N
1 ... NSubband
t
C odedsigna l
B lock d iagram of a subband coder
Synthesisfilter bank +:
Audiooutpu t
t
&<+��(,(�'HSW��+.3RO\8 32

&<+��(,(�'HSW��+.3RO\8 33
■ The samples in each subband are analyzedand compared to a psychoacoustic model.
■ The coder adaptively quantizes the samplesin each subband based on the maskingthreshold in that subband.
■ Each subband is coded independently withmore or fewer bits allocated to the samplesin the subband.
&<+��(,(�'HSW��+.3RO\8 34
Average level
&<+��(,(�'HSW��+.3RO\8 35
■ Bit allocation is determined by apsychoacoustic model and analysis of thesignal itself.
■ Samples are dynamically quantizedaccording to audibility of signals.
&<+��(,(�'HSW��+.3RO\8 36
Average energy
&<+��(,(�'HSW��+.3RO\8 37
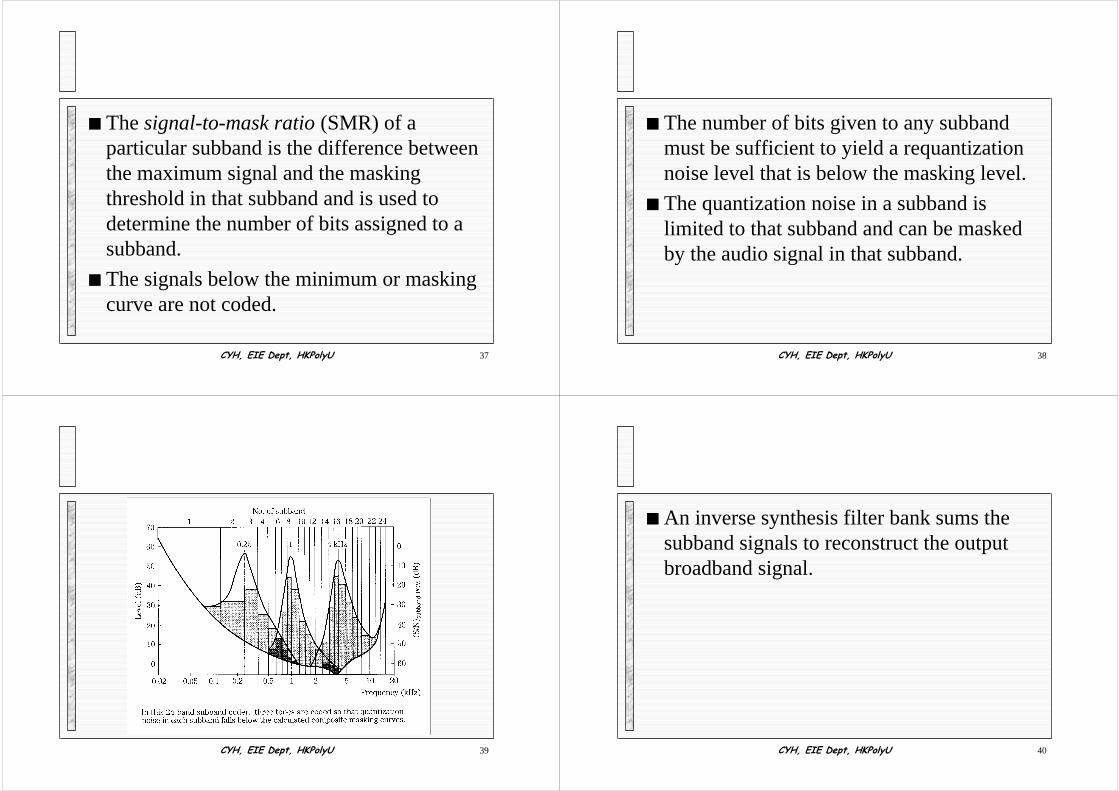
■ The signal-to-mask ratio (SMR) of aparticular subband is the difference betweenthe maximum signal and the maskingthreshold in that subband and is used todetermine the number of bits assigned to asubband.
■ The signals below the minimum or maskingcurve are not coded.
&<+��(,(�'HSW��+.3RO\8 38
■ The number of bits given to any subbandmust be sufficient to yield a requantizationnoise level that is below the masking level.
■ The quantization noise in a subband islimited to that subband and can be maskedby the audio signal in that subband.
&<+��(,(�'HSW��+.3RO\8 39 &<+��(,(�'HSW��+.3RO\8 40
■ An inverse synthesis filter bank sums thesubband signals to reconstruct the outputbroadband signal.

&<+��(,(�'HSW��+.3RO\8 41
Transform coding:
Frequencyanalysis
A ud ioinpu t
f
Bita llocation
Quantiza-tion
t
C odedsigna l
B lock diagram of a transform coder
Inversetransformdecoder
A ud ioou tpu t
t
Ncritica lband ...1
&<+��(,(�'HSW��+.3RO\8 42
7KH�ELW�DOORFDWLRQ�LV�FRHI�EDVHG�ZKLOHLW�LV�VXEEDQG�EDVHG�LQ�VXEEDQG�FRGLQJ�
MPEG-1 Audio standard
&<+��(,(�'HSW��+.3RO\8 44
■ The audio portion of MPEG1 standard(11172-3) has found many applications suchas VCD, CD-ROM, and digital audiobroadcasting.
■ It supports coding of 32, 44.1 and 48 kHzPCM data at bit rates of 32 to 192kbps/channel.
&<+��(,(�'HSW��+.3RO\8 45
■ The standard describes three layers ofcoding.� Layer I describes the least sophisticated method
and operates at 192 kbps/channel.
� Layer II is based on layer I and operates at 96-128 kbps/channel.
� Layer III is conceptually different from I and II,and operates at 64 kbps/channel.
&<+��(,(�'HSW��+.3RO\8 46
■ Layers I and II are based on MUSICAM(Masking-pattern Universal SubbandIntegrated Coding And Multiplexing)coding algorithm.
■ Layer III is based on both MUSICAM andASPEC (Adaptive Spectral PerceptualEntropy Coding).
&<+��(,(�'HSW��+.3RO\8 47
F ilte r Bank
PsychoacousticM ode l
B it o r N o iseA lloca tion
B its treamF orm atting
encodedb its tream
signa l tom ask ra tio
d ig ita laud ioinpu t
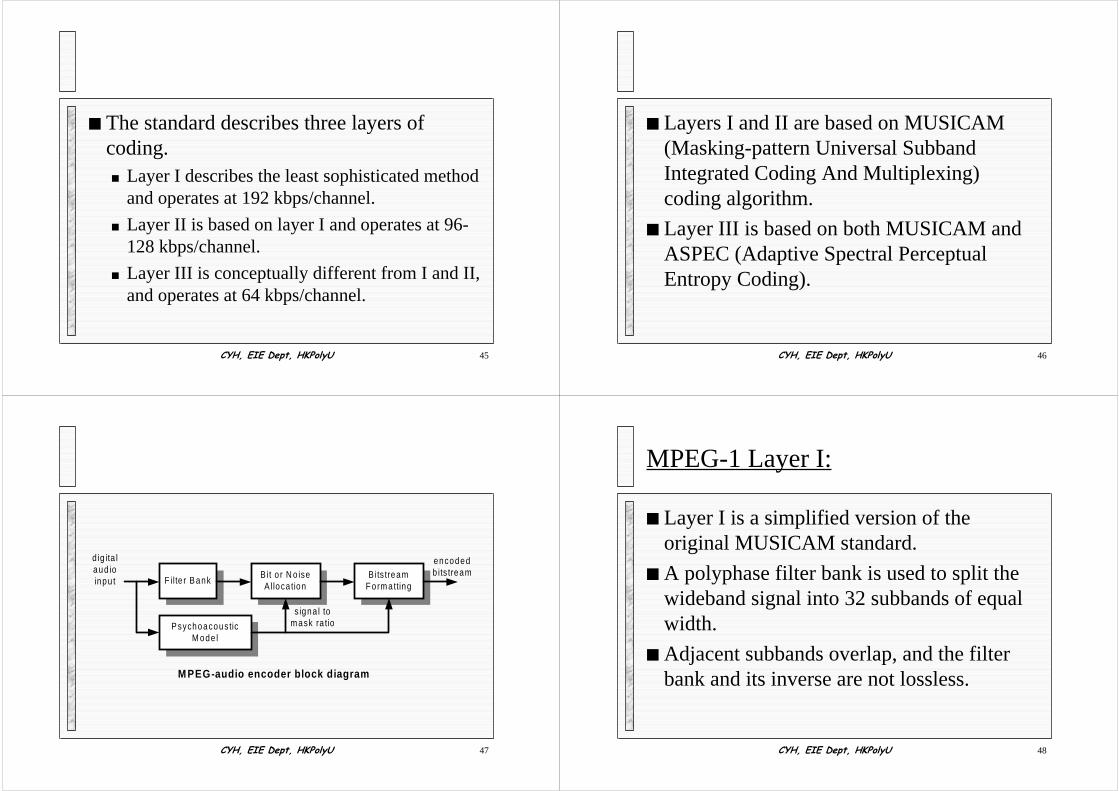
M PEG-audio encoder block dia g ram
&<+��(,(�'HSW��+.3RO\8 48
MPEG-1 Layer I:
■ Layer I is a simplified version of theoriginal MUSICAM standard.
■ A polyphase filter bank is used to split thewideband signal into 32 subbands of equalwidth.
■ Adjacent subbands overlap, and the filterbank and its inverse are not lossless.
&<+��(,(�'HSW��+.3RO\8 49
32data
block0
block10
block11
...
...
blk0
SB 31
SB 1SB 0
... :
blk11
...
&<+��(,(�'HSW��+.3RO\8 50
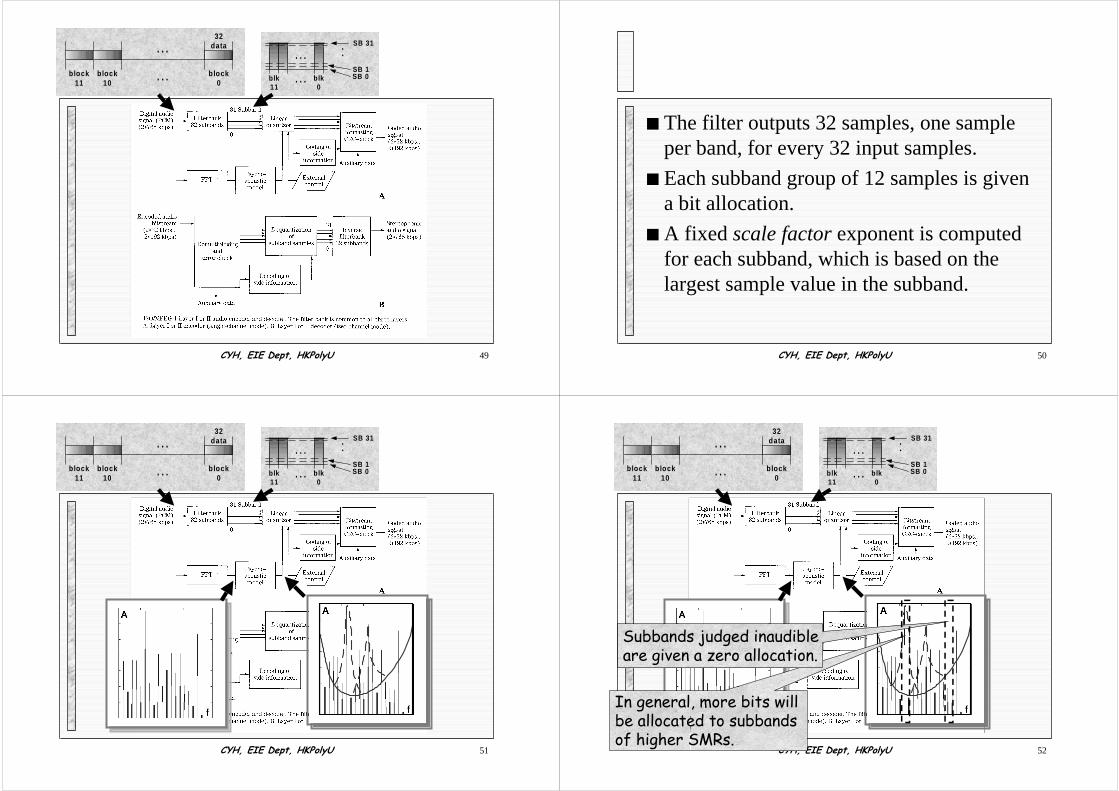
■ The filter outputs 32 samples, one sampleper band, for every 32 input samples.
■ Each subband group of 12 samples is givena bit allocation.
■ A fixed scale factor exponent is computedfor each subband, which is based on thelargest sample value in the subband.
&<+��(,(�'HSW��+.3RO\8 51
32data
block0
block10
block11
...
...
blk0
SB 31
SB 1SB 0
... :
blk11
...
&<+��(,(�'HSW��+.3RO\8 52
32data
block0
block10
block11
...
...
blk0
SB 31
SB 1SB 0
... :
blk11
...
,Q�JHQHUDO��PRUH�ELWV�ZLOO�EH�DOORFDWHG�WR�VXEEDQGV�RI�KLJKHU�605V�
6XEEDQGV�MXGJHG�LQDXGLEOH�DUH�JLYHQ�D�]HUR�DOORFDWLRQ�
&<+��(,(�'HSW��+.3RO\8 53
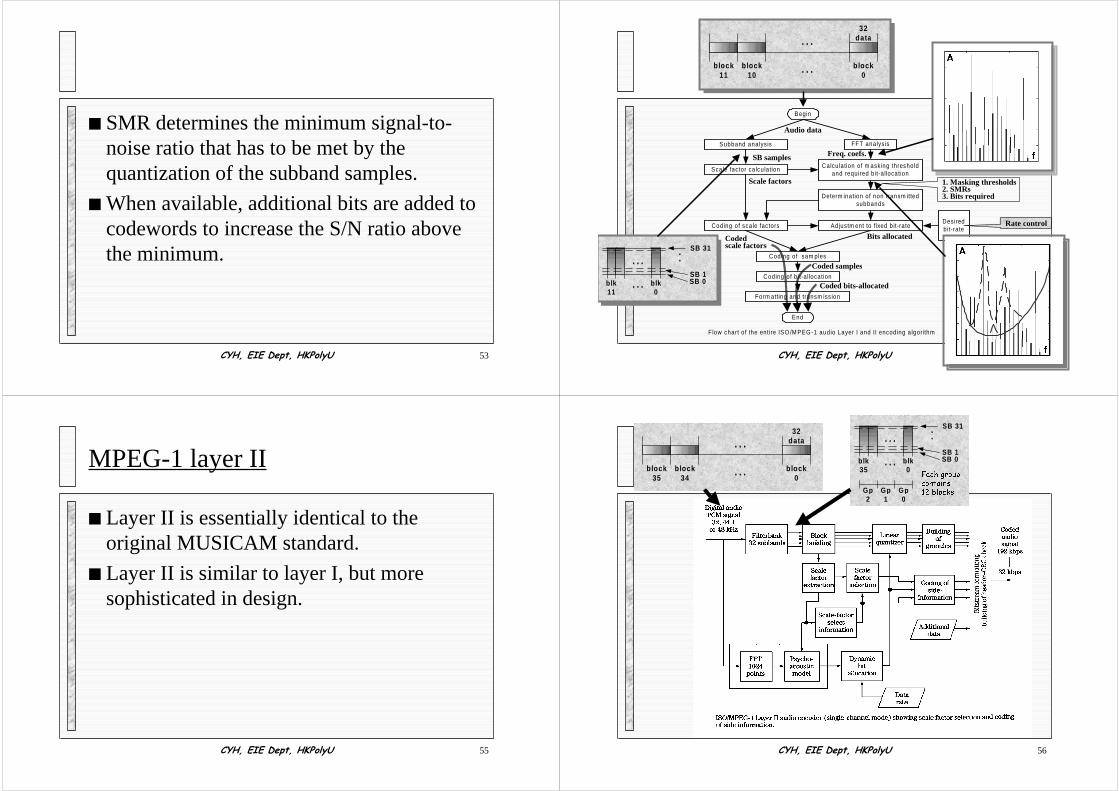
■ SMR determines the minimum signal-to-noise ratio that has to be met by thequantization of the subband samples.
■ When available, additional bits are added tocodewords to increase the S/N ratio abovethe minimum.
&<+��(,(�'HSW��+.3RO\8 54
Calculation of m asking thresholdand required b it-a llocation
Form atting and transm ission
Coding of b it-a llocation
Coding of sam ples
Coding of scale factors
Scale factor calculation
Determ ination of non transm ittedsubbands
Adjustm ent to fixed b it-rate
FFT analys isSubband analys is
Begin
End
Desiredbit-rate
Flow chart of the entire ISO /M PEG -1 audio Layer I and II encoding a lgorithm
32data
block0
block10
block11
...
...
blk0
SB 31
SB 1SB 0
... :
blk11
...
Scale factors
Freq. coefs.
Bits allocated
SB samples
Audio data
1. Masking thresholds2. SMRs3. Bits required
Rate control
Coded scale factors
Coded samples
Coded bits-allocated
&<+��(,(�'HSW��+.3RO\8 55
MPEG-1 layer II
■ Layer II is essentially identical to theoriginal MUSICAM standard.
■ Layer II is similar to layer I, but moresophisticated in design.
&<+��(,(�'HSW��+.3RO\8 56
32data
block0
block34
block35
...
...blk0
SB 31
SB 1SB 0
... :
blk35
...
Gp2
Gp1
Gp0
(DFK JURXSFRQWDLQV�� EORFNV
&<+��(,(�'HSW��+.3RO\8 57
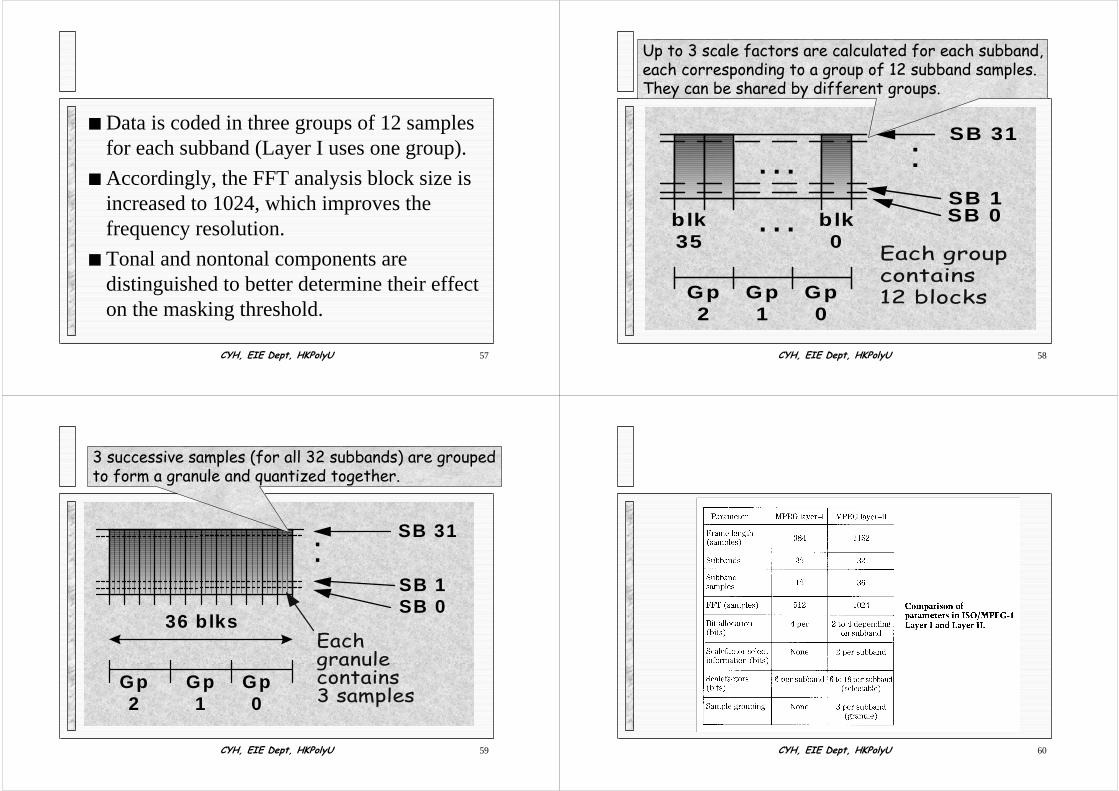
■ Data is coded in three groups of 12 samplesfor each subband (Layer I uses one group).
■ Accordingly, the FFT analysis block size isincreased to 1024, which improves thefrequency resolution.
■ Tonal and nontonal components aredistinguished to better determine their effecton the masking threshold.
&<+��(,(�'HSW��+.3RO\8 58
blk0
SB 31
SB 1SB 0
... :
blk35
...
Gp2
Gp1
Gp0
(DFK�JURXSFRQWDLQV���EORFNV
8S�WR���VFDOH�IDFWRUV�DUH�FDOFXODWHG�IRU�HDFK�VXEEDQG��HDFK�FRUUHVSRQGLQJ�WR�D�JURXS�RI����VXEEDQG�VDPSOHV�7KH\�FDQ�EH�VKDUHG�E\�GLIIHUHQW�JURXSV�
&<+��(,(�'HSW��+.3RO\8 59
SB 31
SB 1SB 0
:
36 blks
Gp2
Gp1
Gp0
(DFKJUDQXOHFRQWDLQV��VDPSOHV
��VXFFHVVLYH�VDPSOHV��IRU�DOO����VXEEDQGV��DUH�JURXSHG�WR�IRUP�D�JUDQXOH�DQG�TXDQWL]HG�WRJHWKHU�
&<+��(,(�'HSW��+.3RO\8 60
&<+��(,(�'HSW��+.3RO\8 61
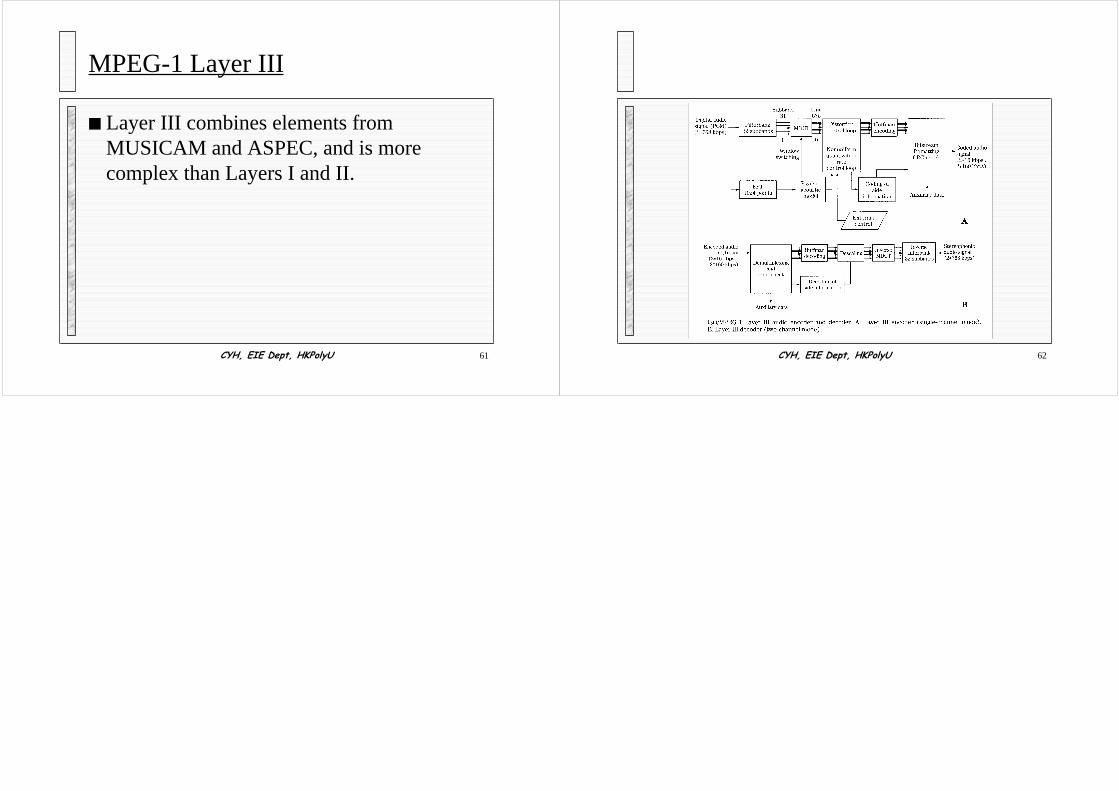
MPEG-1 Layer III
■ Layer III combines elements fromMUSICAM and ASPEC, and is morecomplex than Layers I and II.
&<+��(,(�'HSW��+.3RO\8 62
Recommended