PepsiCo Sustainable Food Production
Mark Pettigrew Food Matters November 2015
1
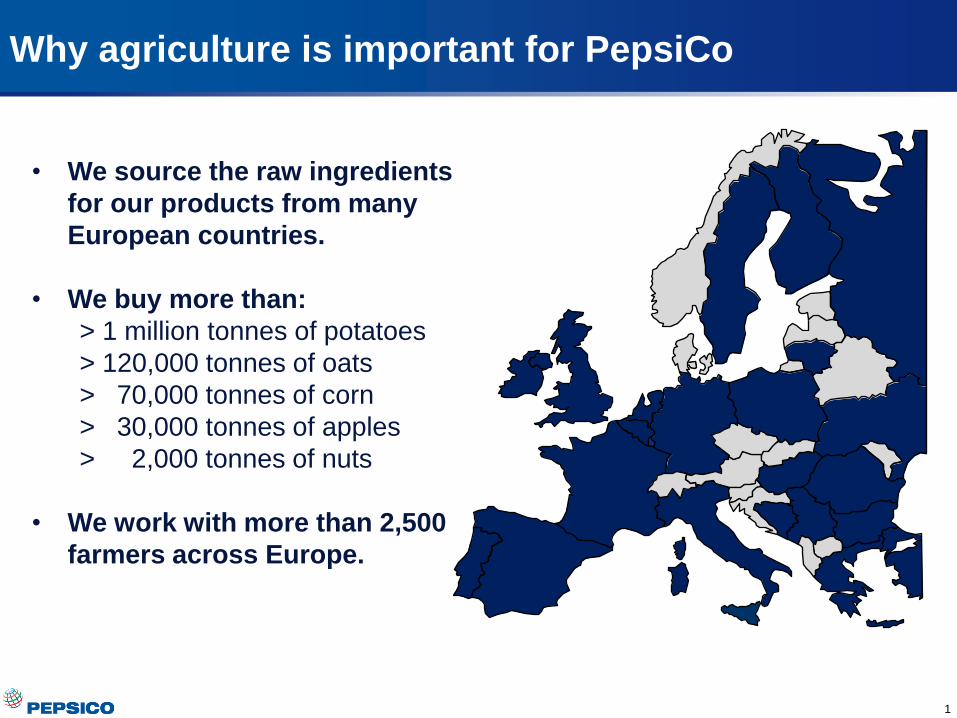
Why agriculture is important for PepsiCo
• We source the raw ingredients
for our products from many
European countries.
• We buy more than:
> 1 million tonnes of potatoes
> 120,000 tonnes of oats
> 70,000 tonnes of corn
> 30,000 tonnes of apples
> 2,000 tonnes of nuts
• We work with more than 2,500
farmers across Europe.
2
But the agricultural sector is facing strong headwinds
Farming is becoming an increasingly challenging business
More More mouths to feed with less: 9 billion by 2050 globally
Changing climate: severe weather events more frequent
Challenging economic outlook: volatile commodity prices
3
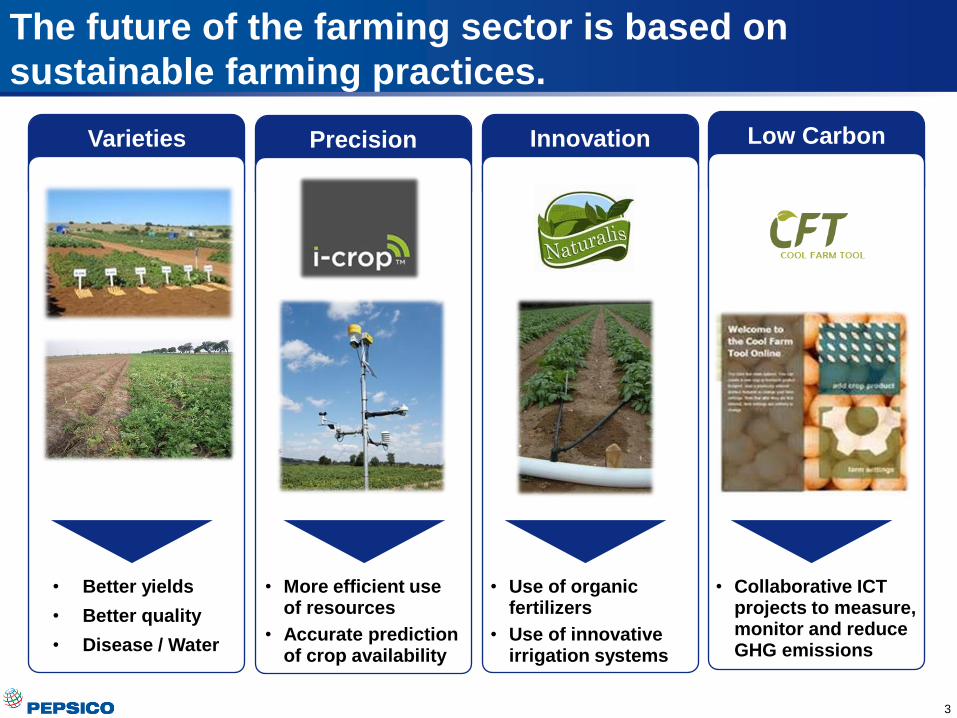
The future of the farming sector is based on
sustainable farming practices.
Varieties
• Better yields
• Better quality
• Disease / Water
Precision
Innovation
Low Carbon
• More efficient use of resources
• Accurate prediction of crop availability
• Use of organic fertilizers
• Use of innovative irrigation systems
• Collaborative ICT projects to measure, monitor and reduce GHG emissions
4
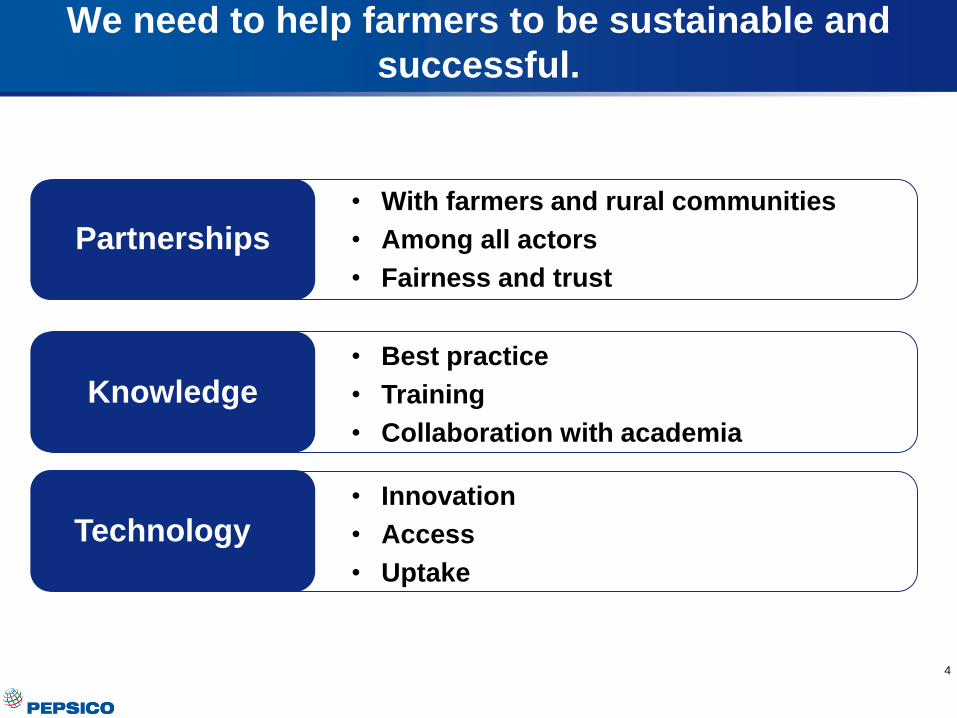
We need to help farmers to be sustainable and
successful.
Knowledge
Technology
Partnerships
• With farmers and rural communities
• Among all actors
• Fairness and trust
• Best practice
• Training
• Collaboration with academia
• Innovation
• Access
• Uptake

CFT – Cool Farm Tool
• The tool is designed to be simple to use, but scientifically robust. The CFT has been tested by
PepsiCo and we are using it to work with our suppliers to measure, manage, and reduce
greenhouse gas emissions in the effort to mitigate global climate change
• ADAS in UK commissioned to work with growers to complete CFT and create a Carbon
Management Plan
0
0.005
0.01
0.015
0.02
0.025
0.03
0.035
Pesticide
production
Fertiliser
production
Mechanical
operations
Field
emissions
Washing Storage Distribution
kg
CO
2e
/kg
po
tato
es

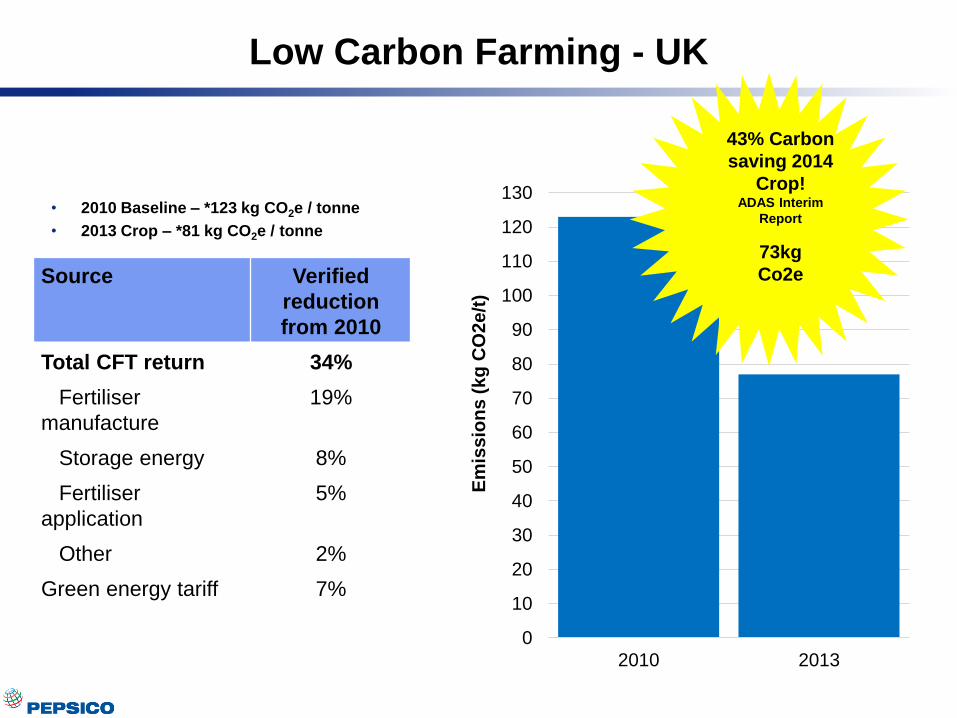
• 2010 Baseline – *123 kg CO2e / tonne
• 2013 Crop – *81 kg CO2e / tonne
0
10
20
30
40
50
60
70
80
90
100
110
120
130
2010 2013
Em
iss
ion
s (
kg
CO
2e
/t)
Source Verified
reduction
from 2010
Total CFT return 34%
Fertiliser
manufacture
19%
Storage energy 8%
Fertiliser
application
5%
Other 2%
Green energy tariff 7%
Low Carbon Farming - UK
43% Carbon
saving 2014
Crop! ADAS Interim
Report
73kg
Co2e
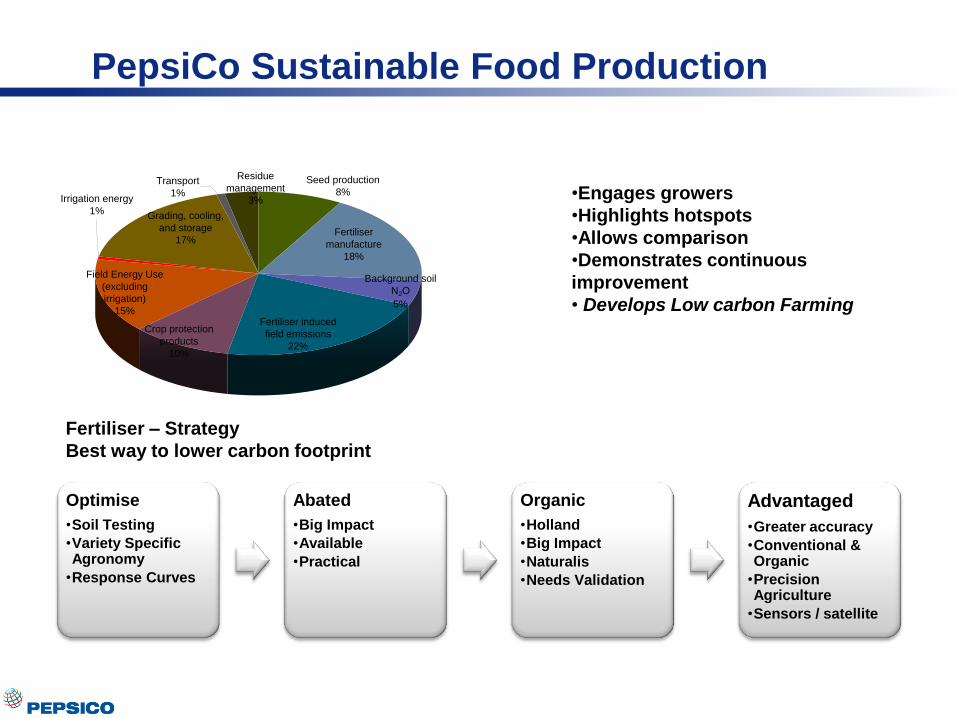
PepsiCo Sustainable Food Production
Transport
1%
Grading, cooling,
and storage
17%
Residue
management
3%
Background soil
N2O
5%
Fertiliser induced
field emissions
22%
Irrigation energy
1%
Field Energy Use
(excluding
irrigation)
15%
Crop protection
products
10%
Fertiliser
manufacture
18%
Seed production
8%
Optimise
•Soil Testing
•Variety Specific Agronomy
•Response Curves
Abated
•Big Impact
•Available
•Practical
Organic
•Holland
•Big Impact
•Naturalis
•Needs Validation
Advantaged
•Greater accuracy
•Conventional & Organic
•Precision Agriculture
•Sensors / satellite
•Engages growers
•Highlights hotspots
•Allows comparison
•Demonstrates continuous
improvement
• Develops Low carbon Farming
Fertiliser – Strategy
Best way to lower carbon footprint
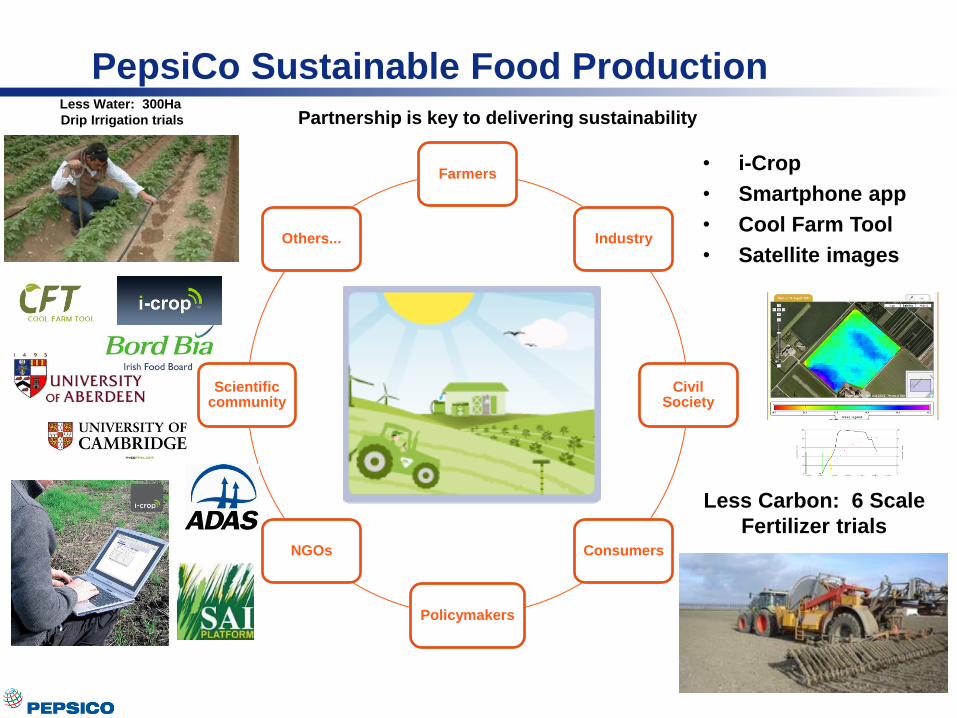
PepsiCo Sustainable Food Production
• i-Crop
• Smartphone app
• Cool Farm Tool
• Satellite images
Farmers
Industry
Civil Society
Consumers
Policymakers
NGOs
Scientific community
Others...
Less Water: 300Ha
Drip Irrigation trials
Less Carbon: 6 Scale
Fertilizer trials
Partnership is key to delivering sustainability
Recommended