PEMBINA HILLS REGIONAL DIVISION NO. 7
2005-06 Operating BudgetJune 8, 2005

Themes of the Past
• 1995/96 Our New Beginning/Adjusting to the New Funding
Framework• 1996/97 Stretching the Dollar• 1997/98 Dead Cow Budget• 1998/99 Smoky the Bear• 1999/2000 Mother of all Opportunities• 2000/01 Y2K – Say Yes 2 Kids!• 2001/02 KATS – Kids Achieve Through
Successes• 2002/03 Class Size Matters• 2003/04 Stay the Course for the Kids• 2004/05 Explore the Learning Journey

Looking back
We’ve had challenges…We’ve had opportunities…We’ve had hope…We’ve built capacity…
And after a decade of exploring and learning we were looking for something that captured the many challenges & opportunities that lay ahead…

Looking ahead
We continue to have challenges…We continue to have opportunities…We continue to have hope…We continue to build capacity for our
future…

In 2005/06 our message is….
• Let’s focus on our journey for kids!
Outcome
Outcome
PriorityPriority
Goal
PublicSupport
PublicAccountability
Target
Target
Our Environment
The strategies we use to move us toward the goal.
Teachers and Admin measure these against the outcomes.
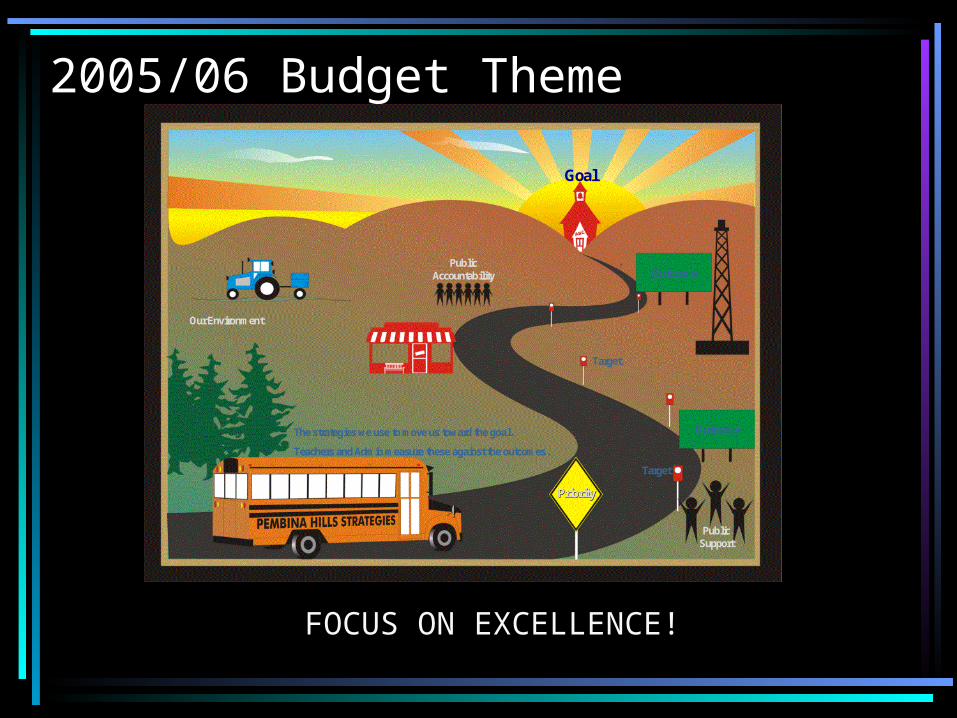
2005/06 Budget Theme
FOCUS ON EXCELLENCE!
Outcome
Outcome
PriorityPriority
Goal
PublicSupport
PublicAccountability
Target
Target
Our Environment
The strategies we use to move us toward the goal.
Teachers and Admin measure these against the outcomes.
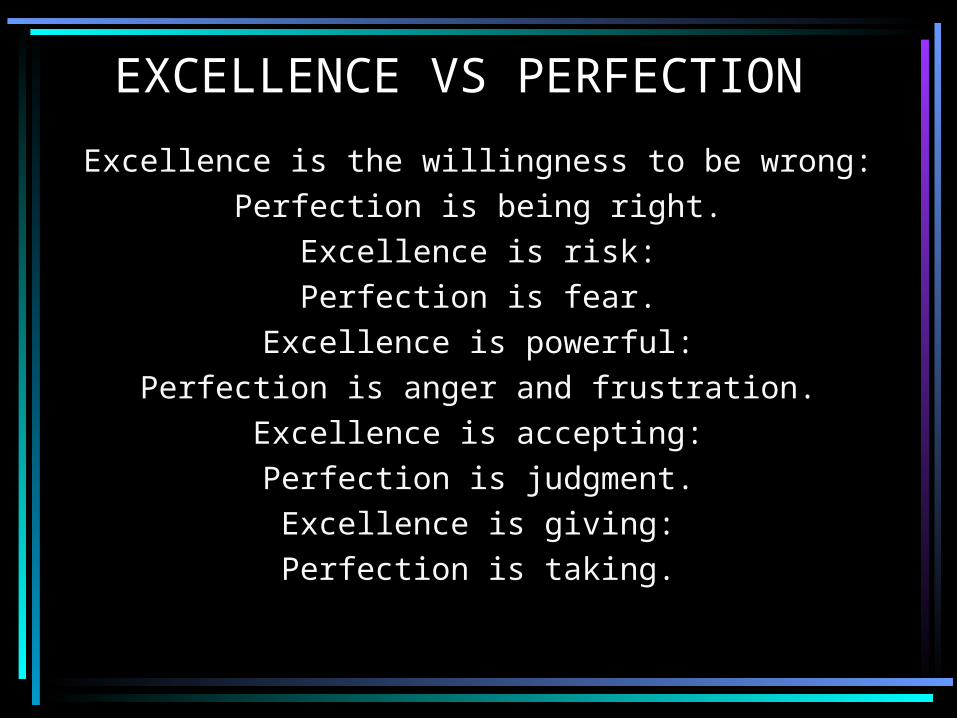
EXCELLENCE VS PERFECTION
Excellence is the willingness to be wrong:Perfection is being right.
Excellence is risk:Perfection is fear.
Excellence is powerful:Perfection is anger and frustration.
Excellence is accepting:Perfection is judgment.
Excellence is giving:Perfection is taking.

EXCELLENCE VS PERFECTIONExcellence is confidence:
Perfection is doubt.Excellence is flowing:Perfection is pressure.Excellence is journey:
Perfection is destination.Excellence is surrender:Perfection is consuming.
Excellence is trust:Perfection is selfishness.
Are you striving for excellence, or do you think you have to be perfect?
Our Mission
Our mission, together with our community, is to provide students with the means and opportunity to gain the
necessary skills, knowledge and attitudes to become life long learners and responsible citizens in a changing
society.
Our Motto
Together We Learn

Our Goals
Excellence in Student Learning
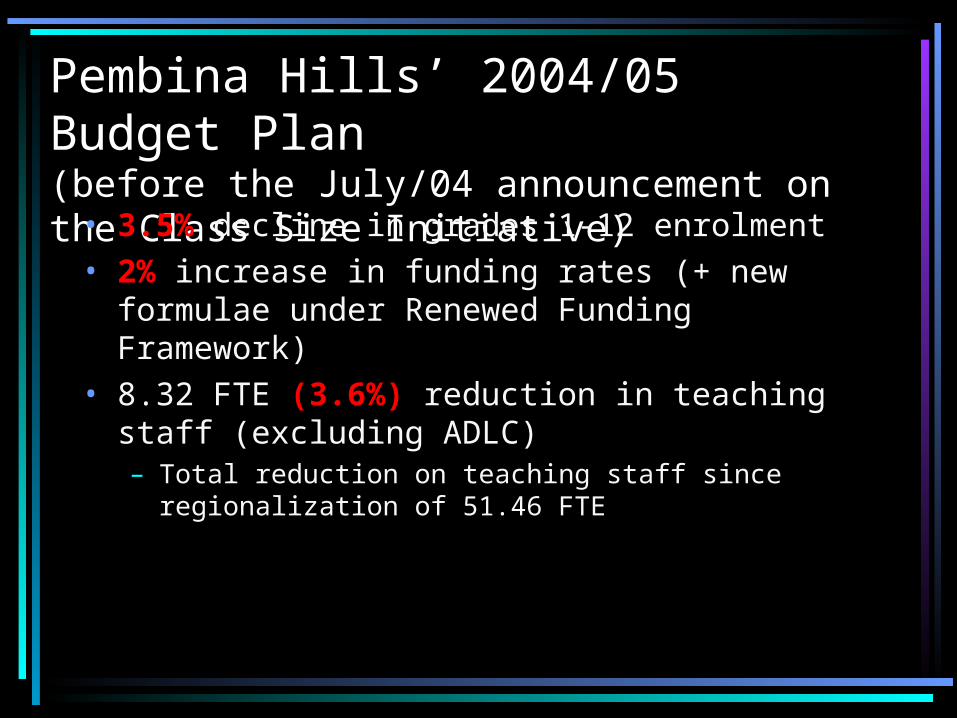
Pembina Hills’ 2004/05 Budget Plan(before the July/04 announcement on the Class Size Initiative)• 3.5% decline in grades 1-12 enrolment
• 2% increase in funding rates (+ new formulae under Renewed Funding Framework)
• 8.32 FTE (3.6%) reduction in teaching staff (excluding ADLC)– Total reduction on teaching staff since
regionalization of 51.46 FTE
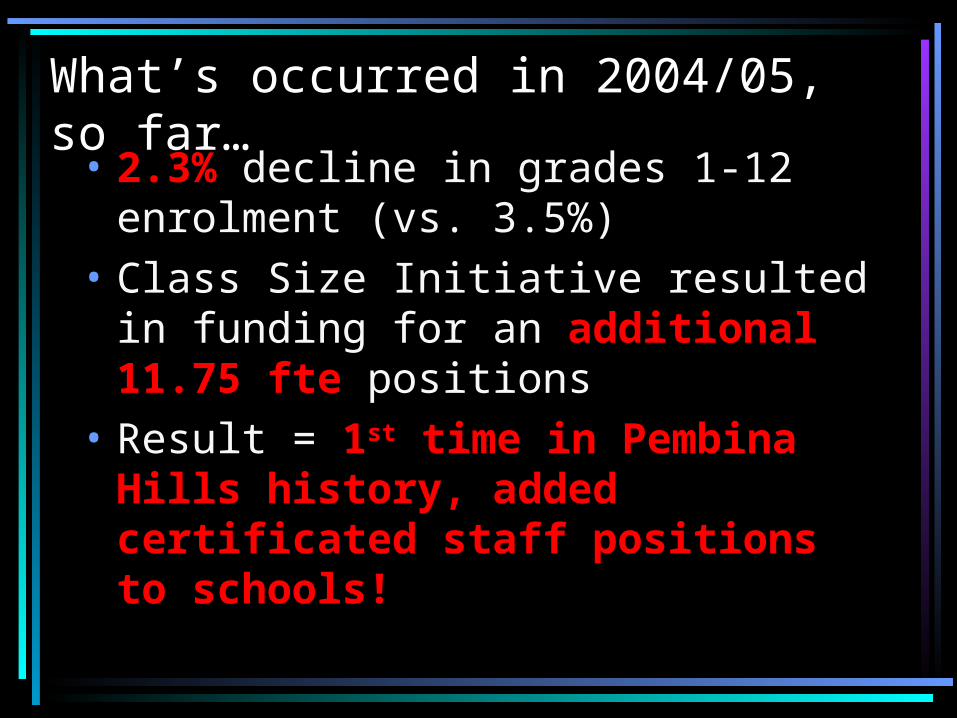
What’s occurred in 2004/05, so far…
• 2.3% decline in grades 1-12 enrolment (vs. 3.5%)
• Class Size Initiative resulted in funding for an additional 11.75 fte positions
• Result = 1st time in Pembina Hills history, added certificated staff positions to schools!

2004/05 Average Class Sizes
Pembina Hills
Alta. Ed. Targets
Learning Commission Guideline
K-3 19.6 20 17
4-6 21.2 25 23
7-9 21 27 25
10-12 21.1 29 27
NOTE: Based on 04/05 enrolments, an additional 8.2 FTE classroom teachers for K-Grade 3 will be required to meet the Learning Commission Guideline of 17.
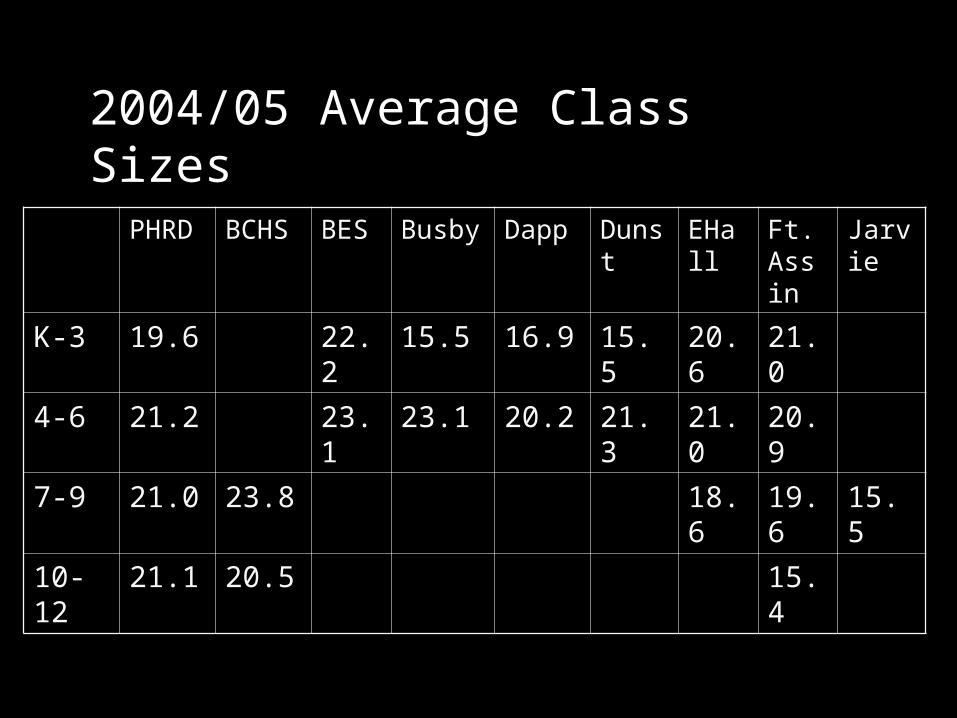
2004/05 Average Class Sizes
PHRD BCHS BES Busby Dapp Dunst
EHall
Ft. Assin
Jarvie
K-3 19.6 22.2
15.5 16.9 15.5 20.6
21.0
4-6 21.2 23.1
23.1 20.2 21.3 21.0
20.9
7-9 21.0 23.8 18.6
19.6
15.5
10-12
21.1 20.5 15.4
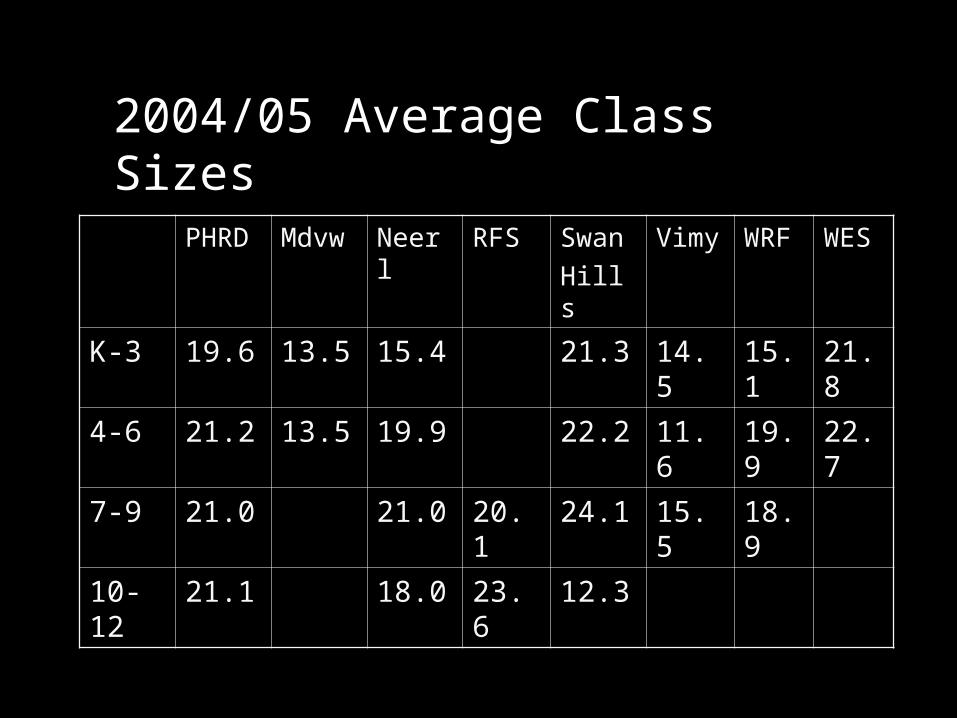
2004/05 Average Class Sizes
PHRD Mdvw
Neerl RFS SwanHills
Vimy WRF WES
K-3 19.6 13.5 15.4 21.3 14.5 15.1
21.8
4-6 21.2 13.5 19.9 22.2 11.6 19.9
22.7
7-9 21.0 21.0 20.1 24.1 15.5 18.9
10-12
21.1 18.0 23.6 12.3
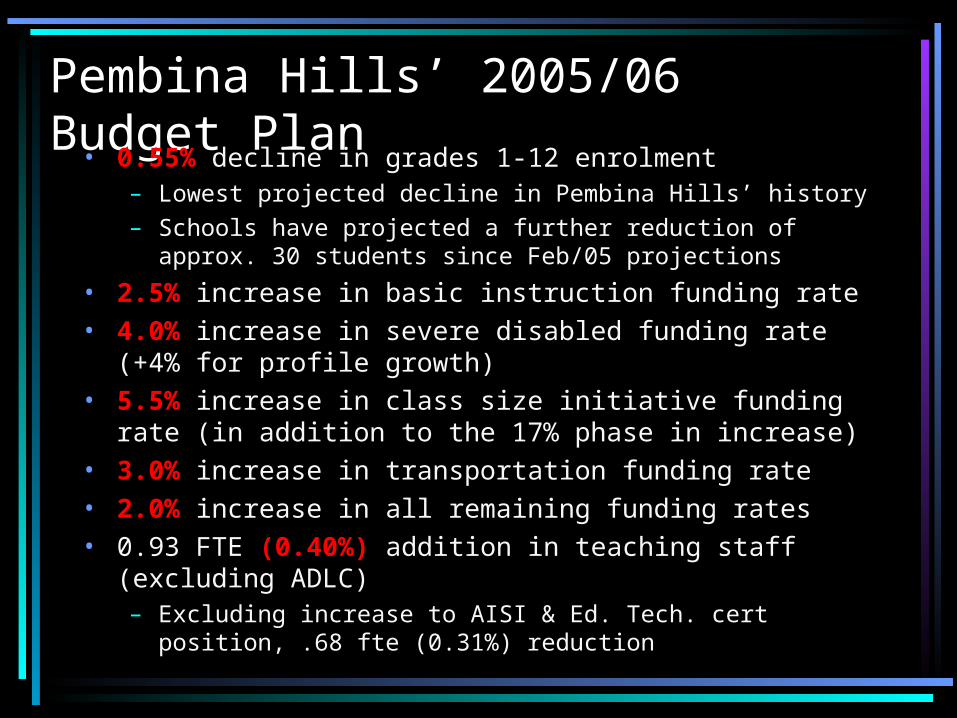
Pembina Hills’ 2005/06 Budget Plan
• 0.55% decline in grades 1-12 enrolment– Lowest projected decline in Pembina Hills’ history– Schools have projected a further reduction of approx. 30
students since Feb/05 projections
• 2.5% increase in basic instruction funding rate• 4.0% increase in severe disabled funding rate (+4% for
profile growth)• 5.5% increase in class size initiative funding rate (in
addition to the 17% phase in increase)• 3.0% increase in transportation funding rate• 2.0% increase in all remaining funding rates• 0.93 FTE (0.40%) addition in teaching staff (excluding
ADLC)– Excluding increase to AISI & Ed. Tech. cert position, .68 fte
(0.31%) reduction
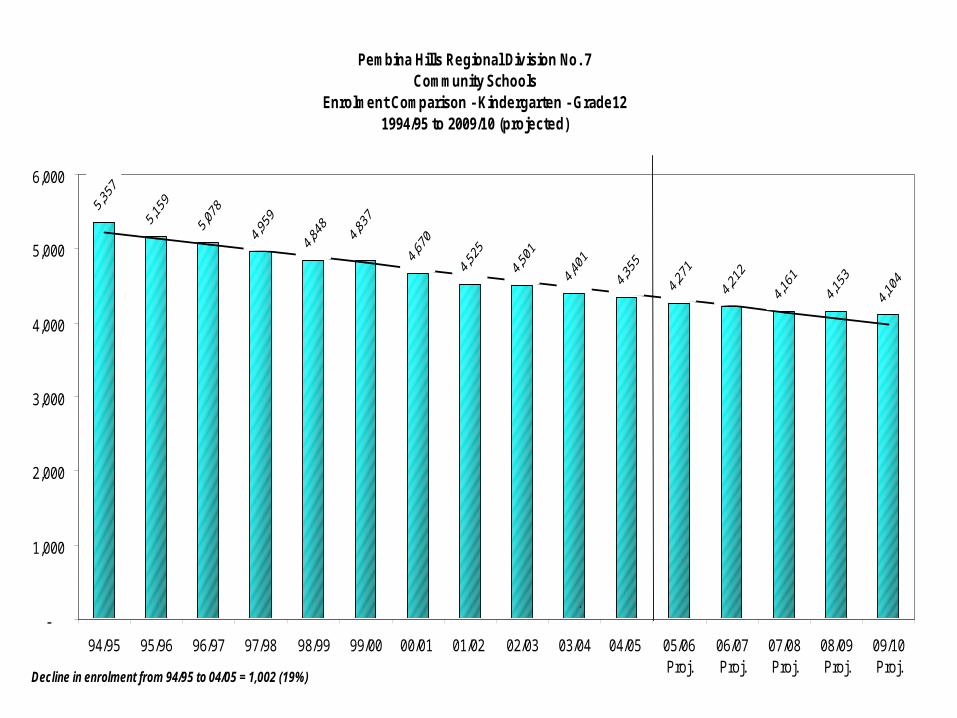
Pembina Hills Regional Division No. 7 Community Schools
Enrolment Comparison - Kindergarten - Grade12 1994/95 to 2009/10 (projected)
-
1,000
2,000
3,000
4,000
5,000
6,000
94/95 95/96 96/97 97/98 98/99 99/00 00/01 01/02 02/03 03/04 04/05 05/06Proj.
06/07Proj.
07/08Proj.
08/09Proj.
09/10Proj.
Decline in enrolment from 94/95 to 04/05 = 1,002 (19%)
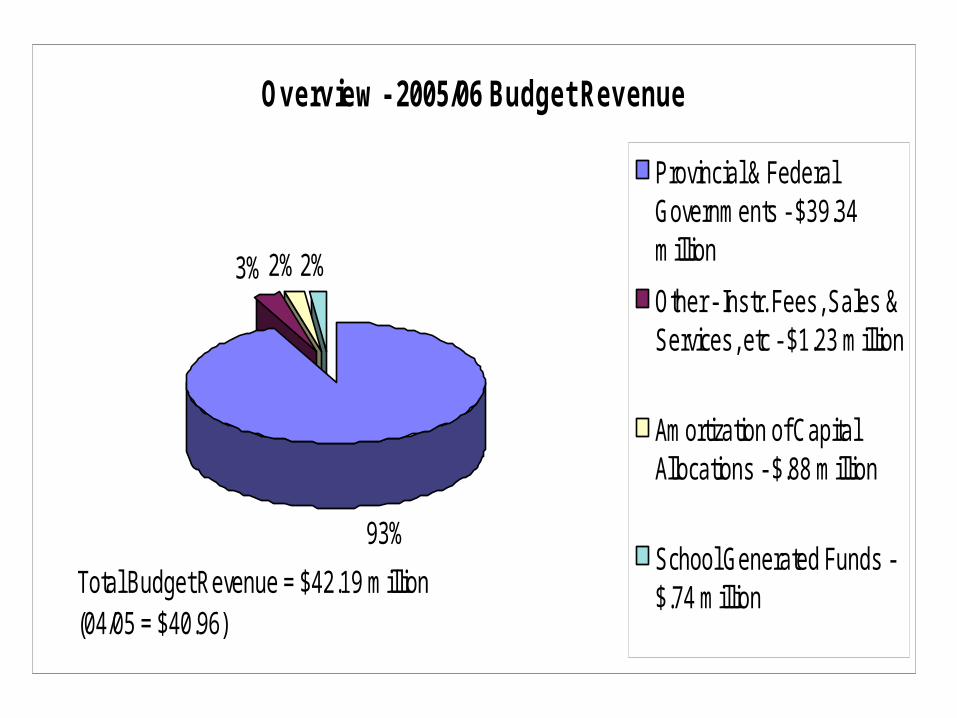
Overview - 2005/06 Budget Revenue
93%
3% 2%2%
Provincial & FederalGovernments - $39.34million
Other - Instr. Fees, Sales &Services, etc - $1.23 million
Amortization of CapitalAllocations - $.88 million
School Generated Funds -$.74 millionTotal Budget Revenue = $42.19 million
(04/05 = $40.96)
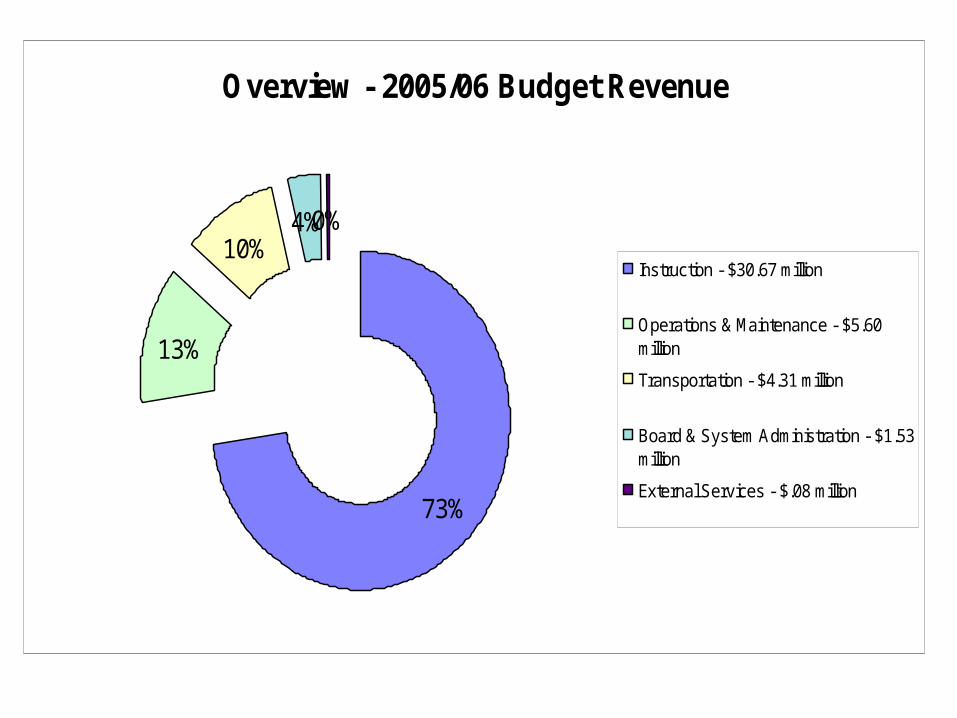
Overview - 2005/06 Budget Revenue
73%
13%
10%4%0%
Instruction - $30.67 million
Operations & Maintenance - $5.60million
Transportation - $4.31 million
Board & System Administration - $1.53million
External Services - $.08 million
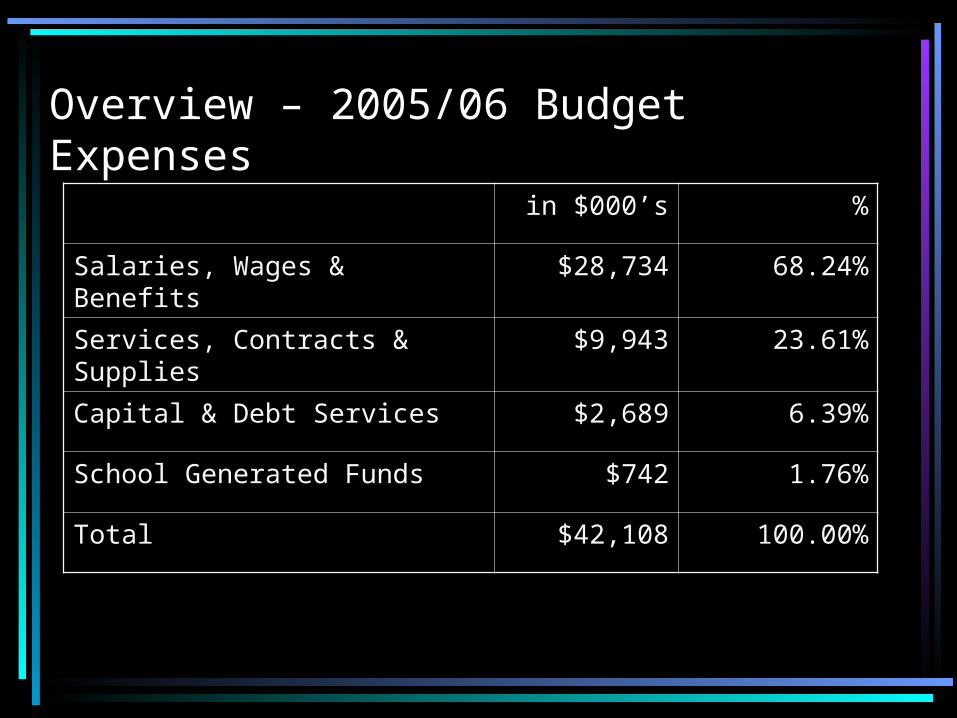
Overview – 2005/06 Budget Expenses
in $000’s %
Salaries, Wages & Benefits $28,734 68.24%
Services, Contracts & Supplies $9,943 23.61%
Capital & Debt Services $2,689 6.39%
School Generated Funds $742 1.76%
Total $42,108 100.00%
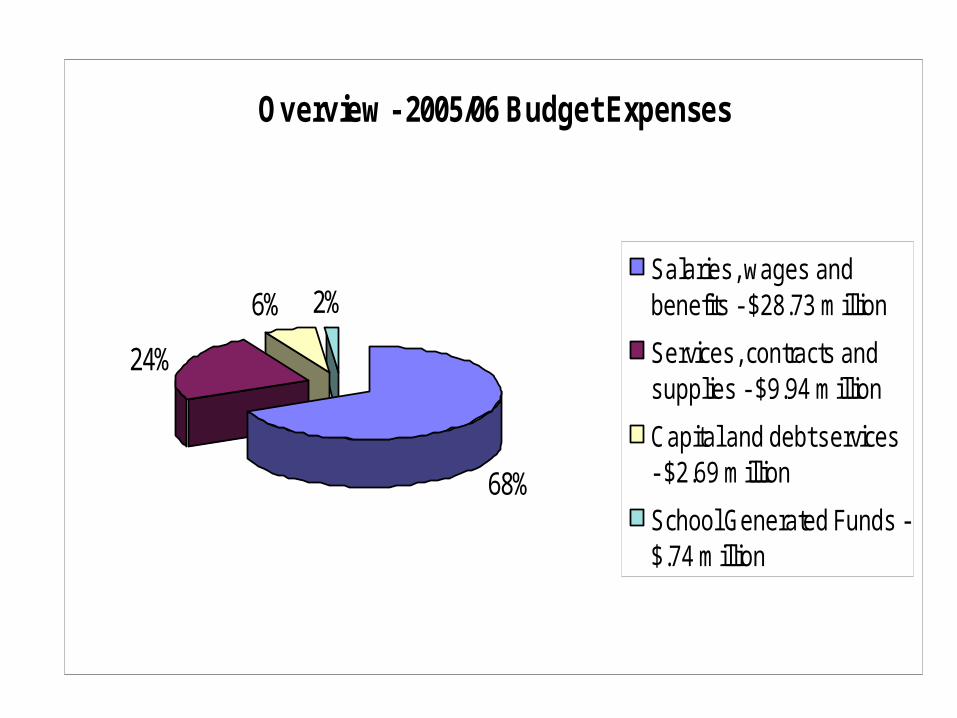
Overview - 2005/06 Budget Expenses
68%
24%
6% 2%Salaries, wages andbenefits - $28.73 million
Services, contracts andsupplies - $9.94 million
Capital and debt services- $2.69 million
School Generated Funds -$.74 million
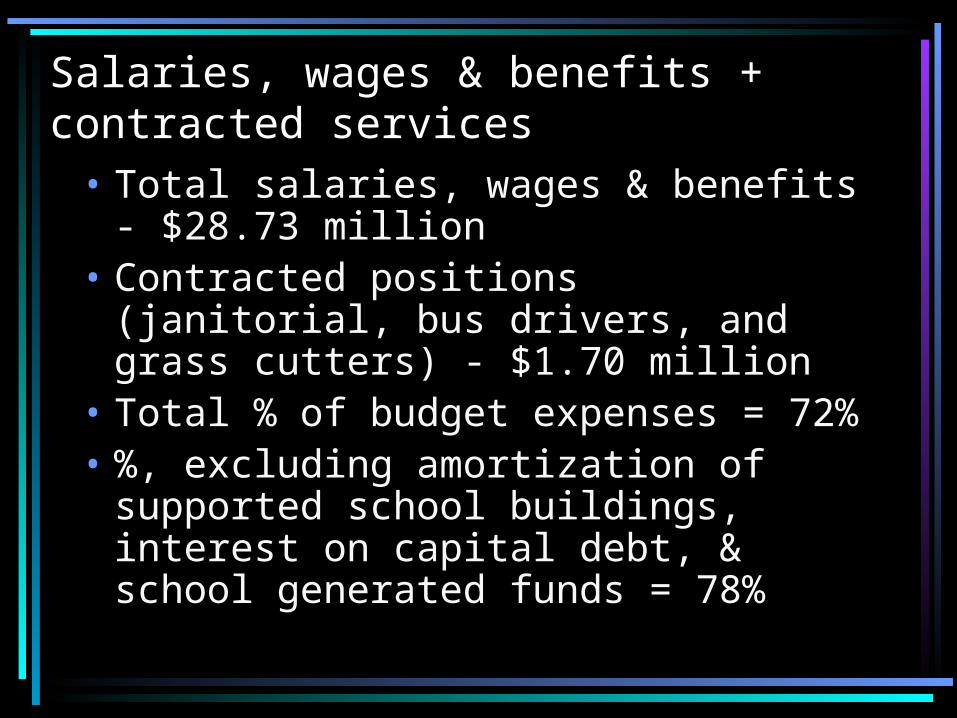
Salaries, wages & benefits + contracted services
• Total salaries, wages & benefits - $28.73 million
• Contracted positions (janitorial, bus drivers, and grass cutters) - $1.70 million
• Total % of budget expenses = 72%• %, excluding amortization of
supported school buildings, interest on capital debt, & school generated funds = 78%
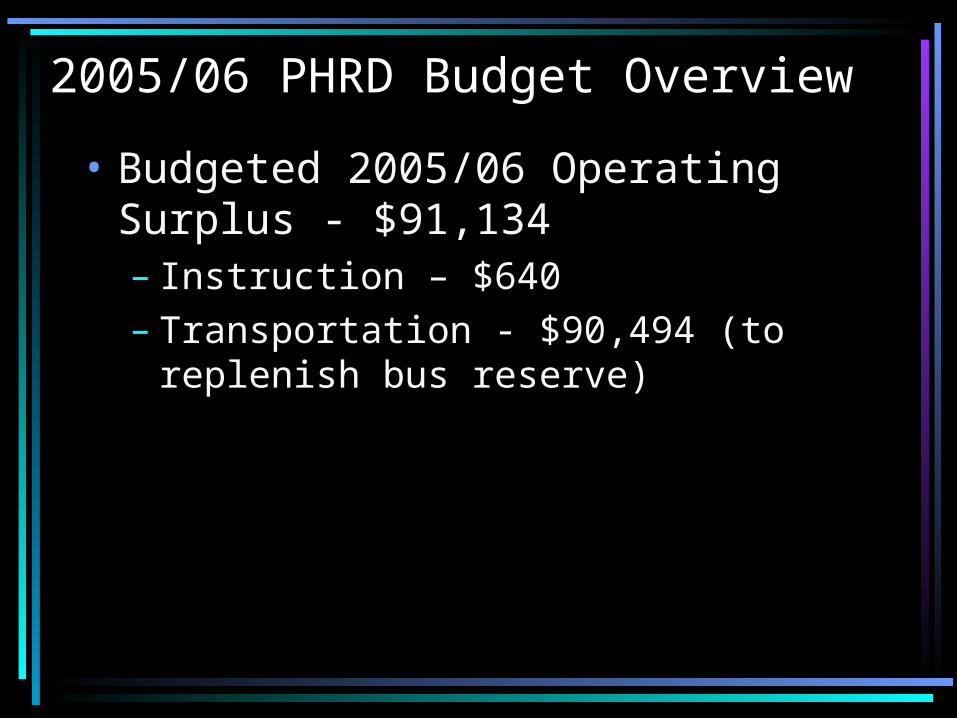
2005/06 PHRD Budget Overview
• Budgeted 2005/06 Operating Surplus - $91,134– Instruction – $640– Transportation - $90,494 (to replenish
bus reserve)
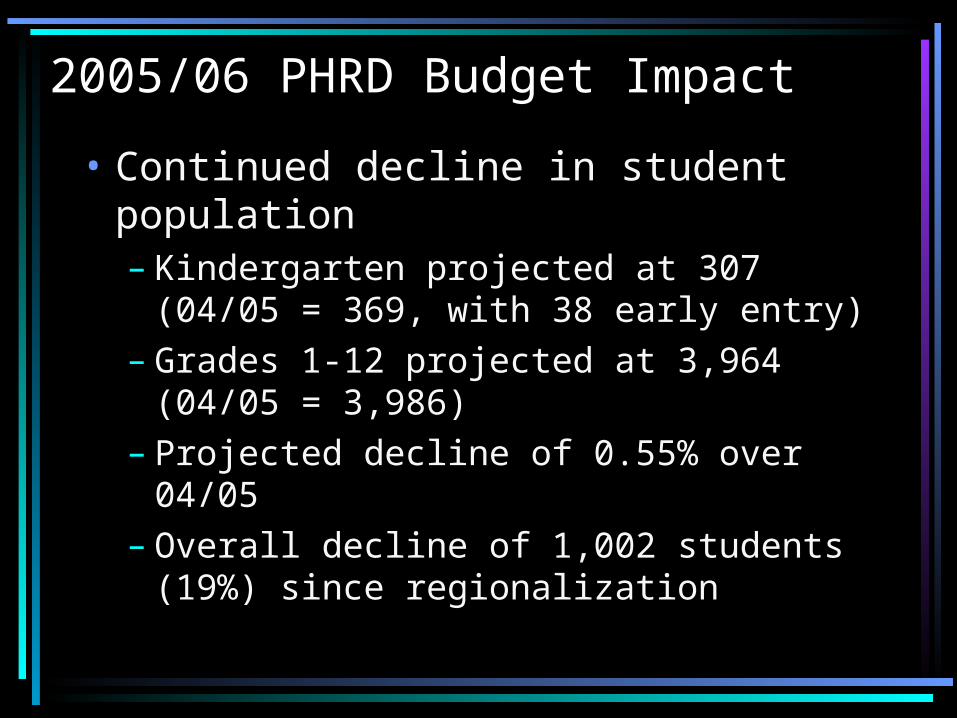
2005/06 PHRD Budget Impact
• Continued decline in student population– Kindergarten projected at 307 (04/05
= 369, with 38 early entry)– Grades 1-12 projected at 3,964
(04/05 = 3,986)– Projected decline of 0.55% over 04/05– Overall decline of 1,002 students
(19%) since regionalization
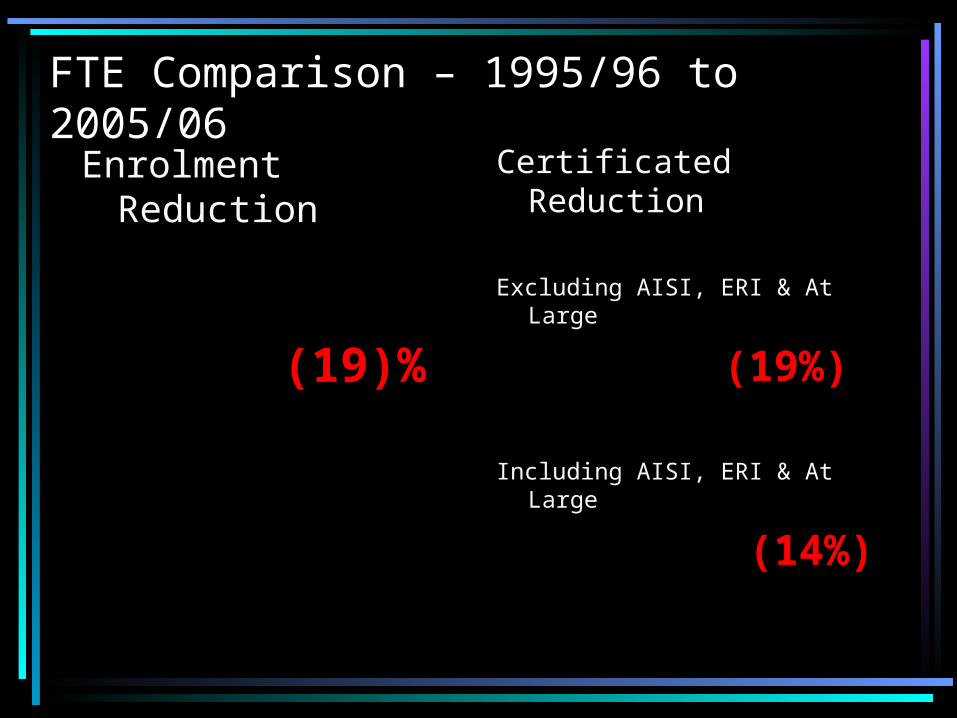
FTE Comparison – 1995/96 to 2005/06
Enrolment Reduction
(19)%
Certificated Reduction
Excluding AISI, ERI & At Large
(19%)
Including AISI, ERI & At Large
(14%)
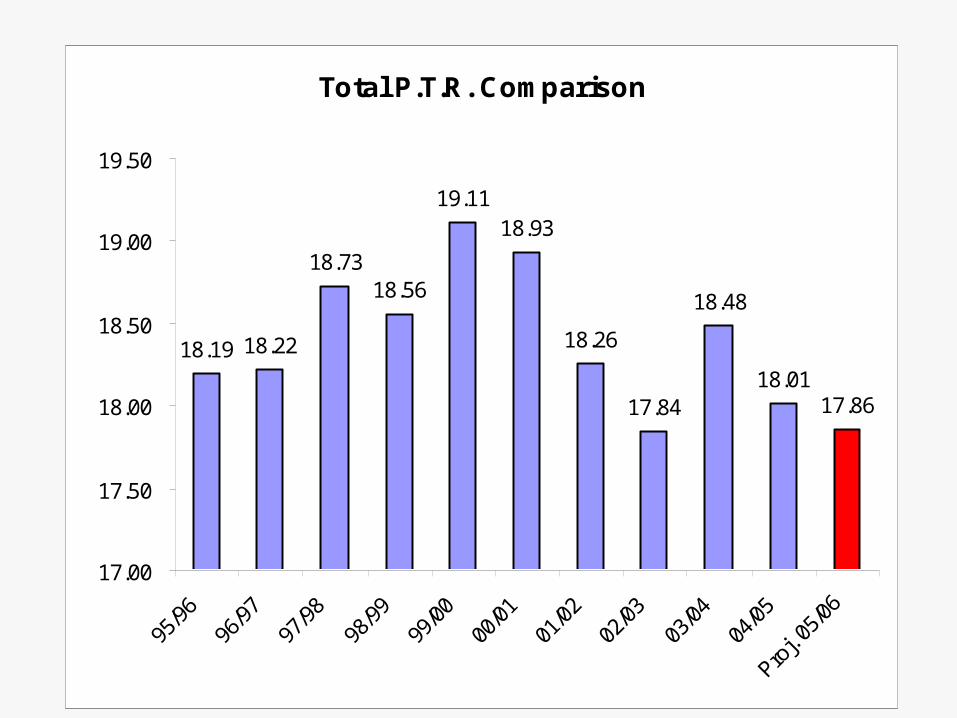
Total P.T.R. Comparison
18.19 18.22
18.7318.56
19.1118.93
18.26
17.84
18.48
18.0117.86
17.00
17.50
18.00
18.50
19.00
19.50
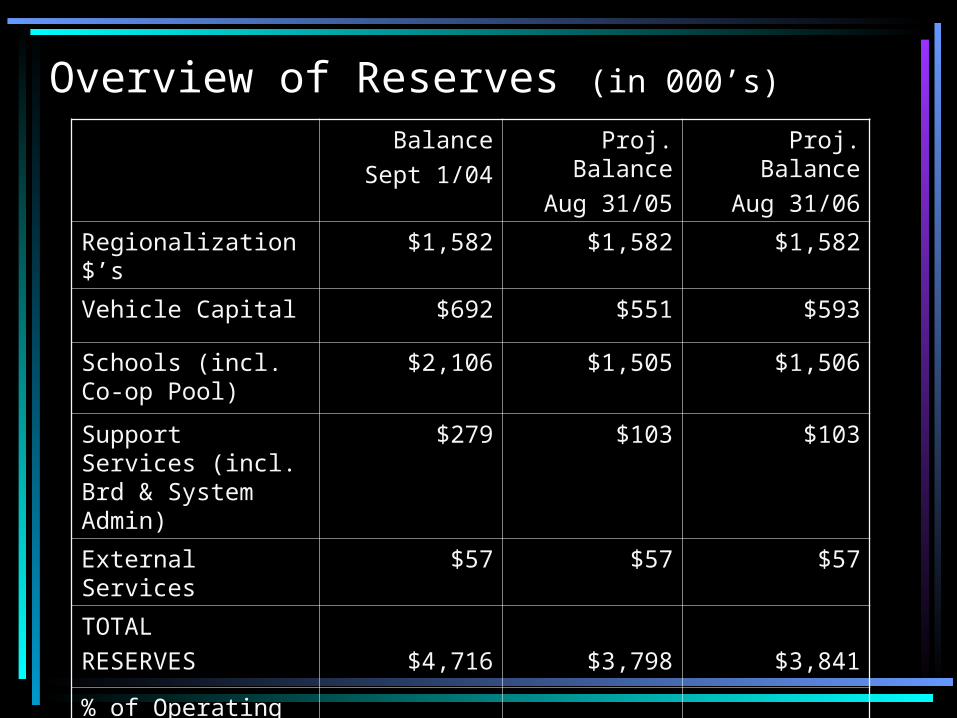
Overview of Reserves (in 000’s)
BalanceSept 1/04
Proj. BalanceAug 31/05
Proj. BalanceAug 31/06
Regionalization $’s $1,582 $1,582 $1,582
Vehicle Capital $692 $551 $593
Schools (incl. Co-op Pool)
$2,106 $1,505 $1,506
Support Services (incl. Brd & System Admin)
$279 $103 $103
External Services $57 $57 $57
TOTAL RESERVES $4,716 $3,798 $3,841
% of Operating Expenses 11.39% 9.28% 9.12%
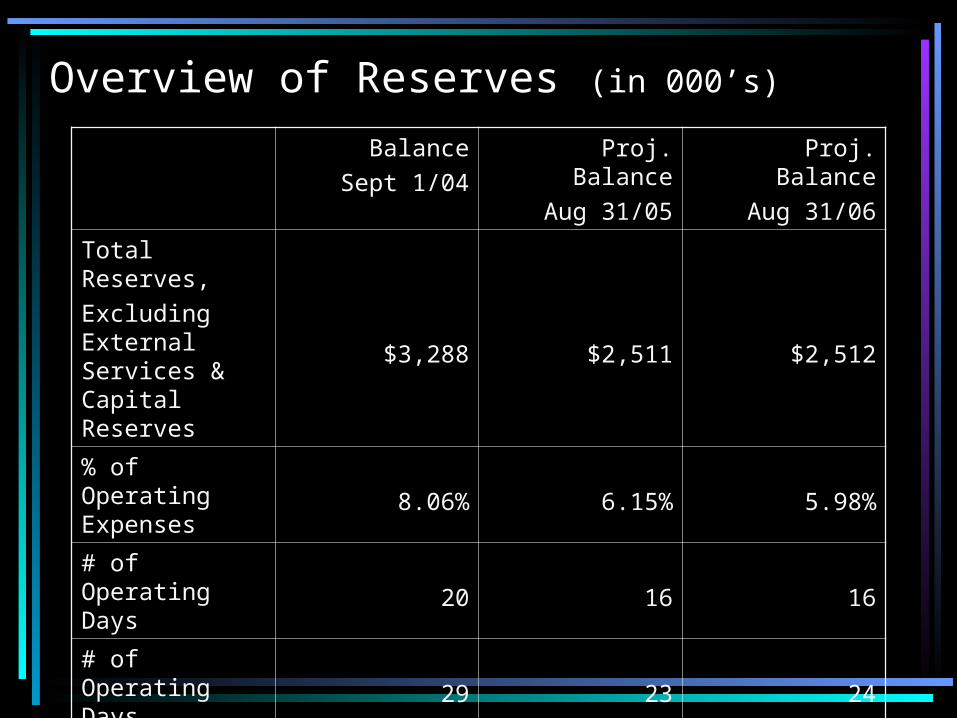
Overview of Reserves (in 000’s)
BalanceSept 1/04
Proj. BalanceAug 31/05
Proj. BalanceAug 31/06
Total Reserves,Excluding External Services & Capital Reserves
$3,288 $2,511 $2,512
% of Operating Expenses 8.06% 6.15% 5.98%
# of Operating Days 20 16 16
# of Operating Days, Including All Reserves
29 23 24
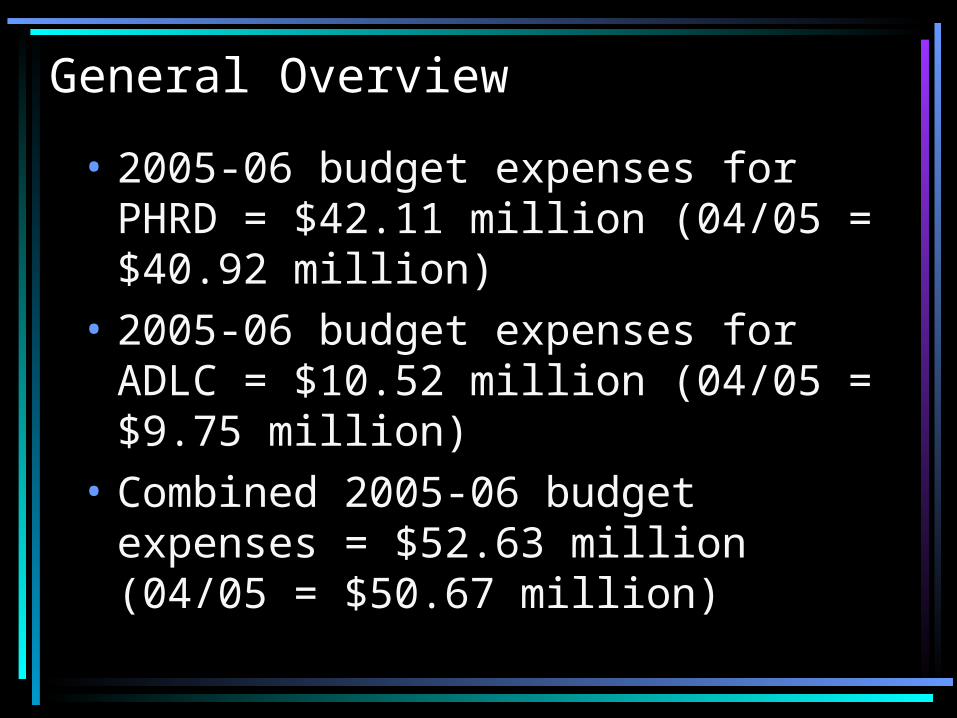
General Overview
• 2005-06 budget expenses for PHRD = $42.11 million (04/05 = $40.92 million)
• 2005-06 budget expenses for ADLC = $10.52 million (04/05 = $9.75 million)
• Combined 2005-06 budget expenses = $52.63 million (04/05 = $50.67 million)
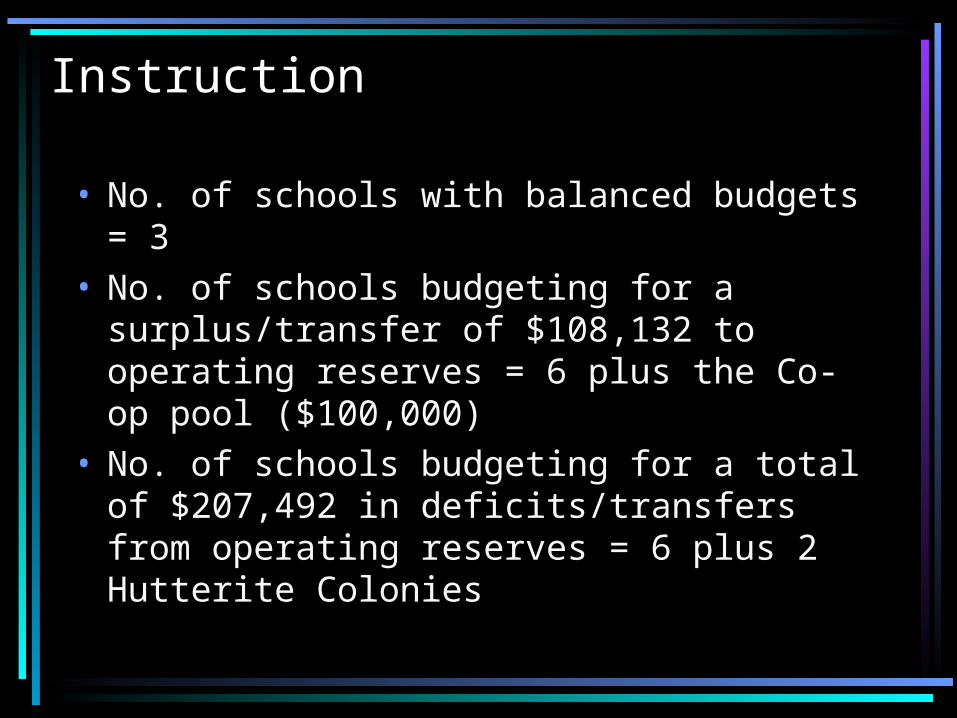
Instruction
• No. of schools with balanced budgets = 3
• No. of schools budgeting for a surplus/transfer of $108,132 to operating reserves = 6 plus the Co-op pool ($100,000)
• No. of schools budgeting for a total of $207,492 in deficits/transfers from operating reserves = 6 plus 2 Hutterite Colonies
Instruction
• Total net surplus for the instructional component = $640– school deficits will be funded through
individual school operating reserves
Instruction – Projection Adjustments
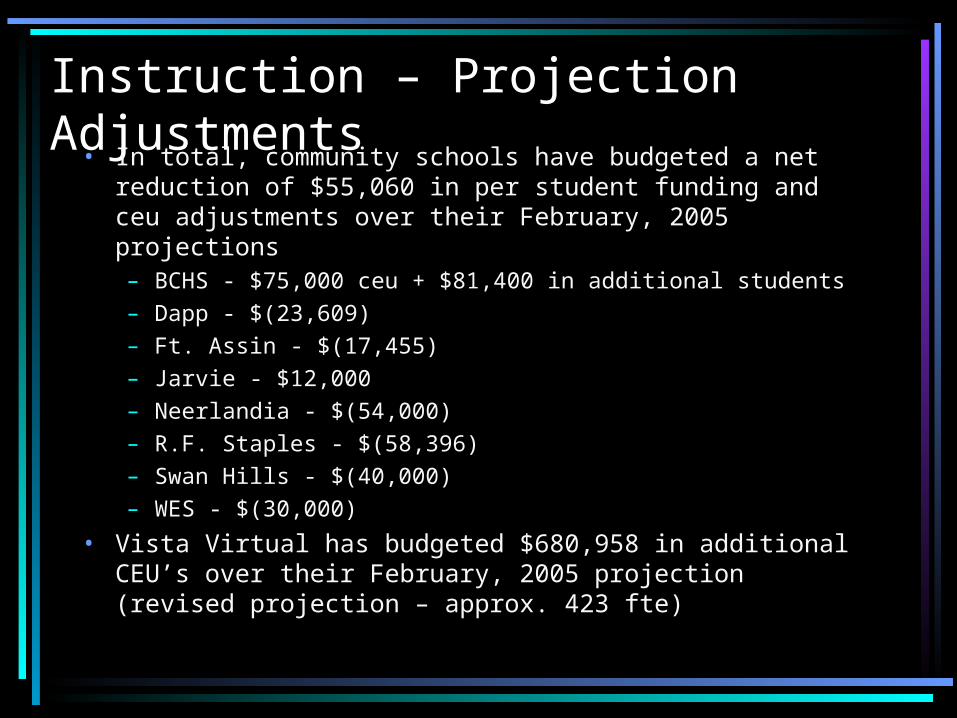
• In total, community schools have budgeted a net reduction of $55,060 in per student funding and ceu adjustments over their February, 2005 projections– BCHS - $75,000 ceu + $81,400 in additional students– Dapp - $(23,609)– Ft. Assin - $(17,455)– Jarvie - $12,000– Neerlandia - $(54,000)– R.F. Staples - $(58,396)– Swan Hills - $(40,000)– WES - $(30,000)
• Vista Virtual has budgeted $680,958 in additional CEU’s over their February, 2005 projection (revised projection – approx. 423 fte)
Instruction
• Projected 2005-06 certificated staff in schools = 219.38 FTE (reduction of 0.68, or 0.31% over 2004-05)– In addition there are 14.65 FTE in
support positions thru AISI, ERI, PUF, ASHIP, Directors, Student Services Consultant & Ed. Tech
• Net projected addition – 0.93 FTE (0.40%)
Instruction
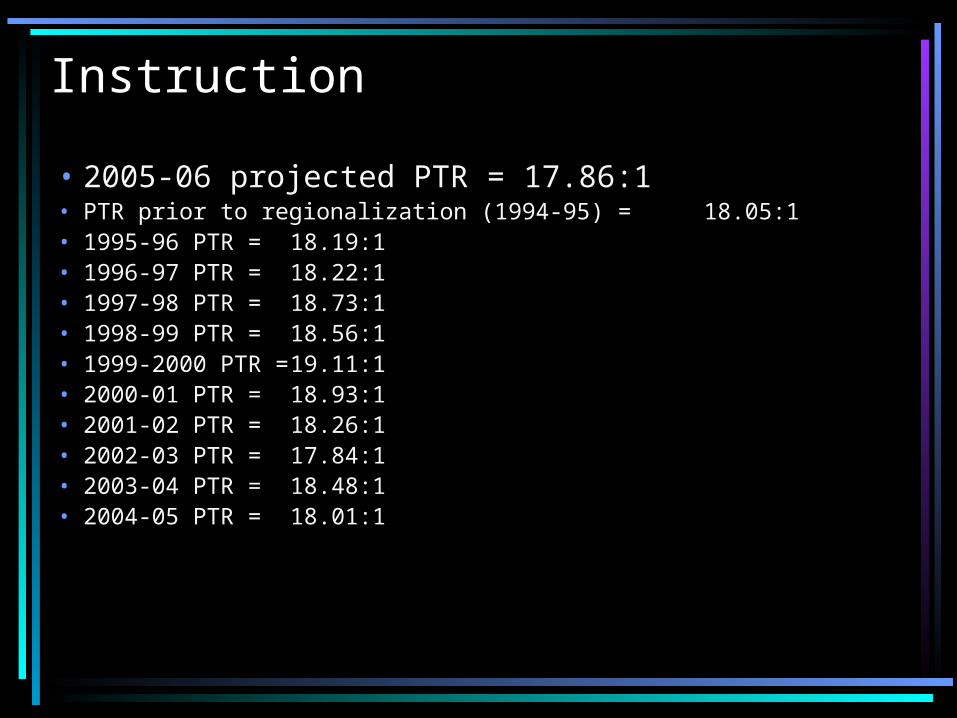
• 2005-06 projected PTR = 17.86:1• PTR prior to regionalization (1994-95) = 18.05:1• 1995-96 PTR = 18.19:1• 1996-97 PTR = 18.22:1• 1997-98 PTR = 18.73:1• 1998-99 PTR = 18.56:1• 1999-2000 PTR = 19.11:1• 2000-01 PTR = 18.93:1• 2001-02 PTR = 18.26:1• 2002-03 PTR = 17.84:1• 2003-04 PTR = 18.48:1• 2004-05 PTR = 18.01:1
Instruction
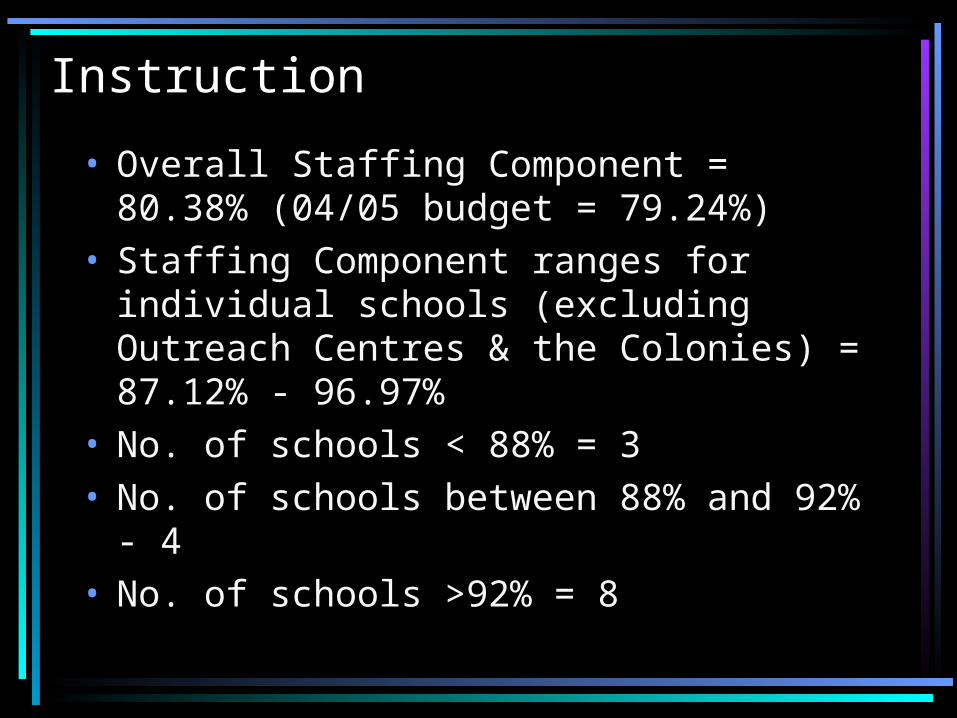
• Overall Staffing Component = 80.38% (04/05 budget = 79.24%)
• Staffing Component ranges for individual schools (excluding Outreach Centres & the Colonies) = 87.12% - 96.97%
• No. of schools < 88% = 3• No. of schools between 88% and 92% -
4• No. of schools >92% = 8
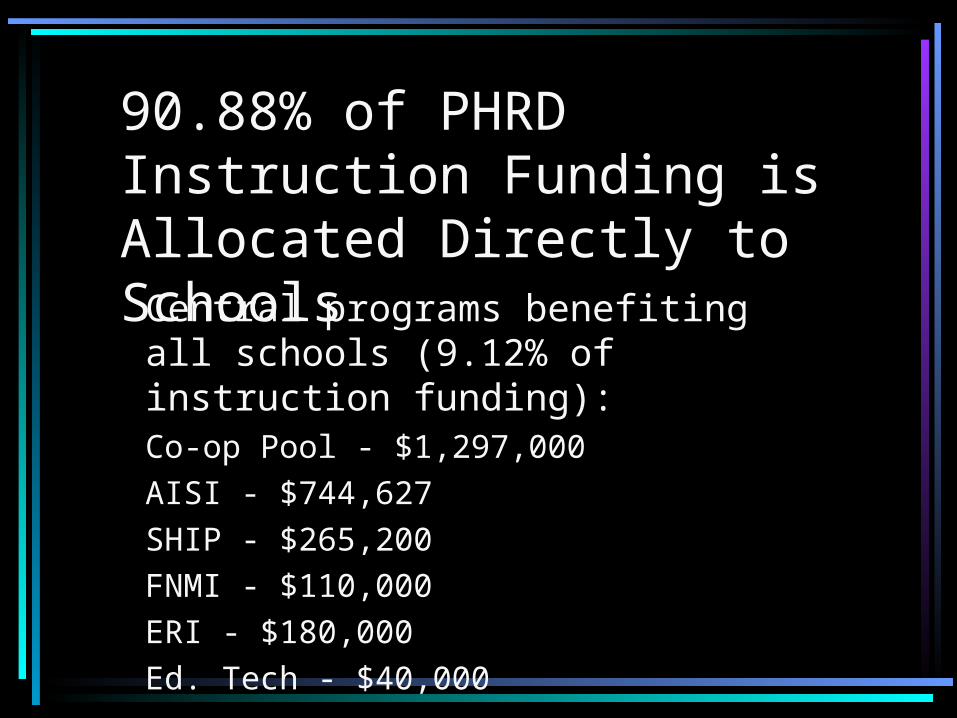
90.88% of PHRD Instruction Funding is Allocated Directly to Schools
Central programs benefiting all schools (9.12% of instruction funding):Co-op Pool - $1,297,000AISI - $744,627SHIP - $265,200FNMI - $110,000ERI - $180,000Ed. Tech - $40,000
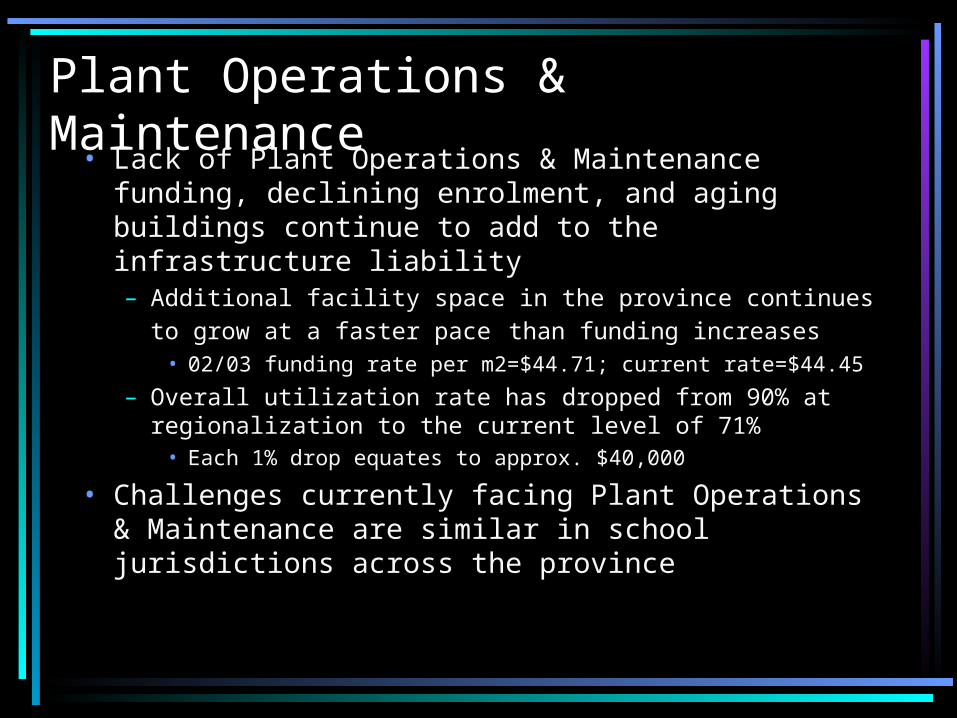
Plant Operations & Maintenance
• Lack of Plant Operations & Maintenance funding, declining enrolment, and aging buildings continue to add to the infrastructure liability– Additional facility space in the province continues to
grow at a faster pace than funding increases• 02/03 funding rate per m2=$44.71; current rate=$44.45
– Overall utilization rate has dropped from 90% at regionalization to the current level of 71%
• Each 1% drop equates to approx. $40,000
• Challenges currently facing Plant Operations & Maintenance are similar in school jurisdictions across the province
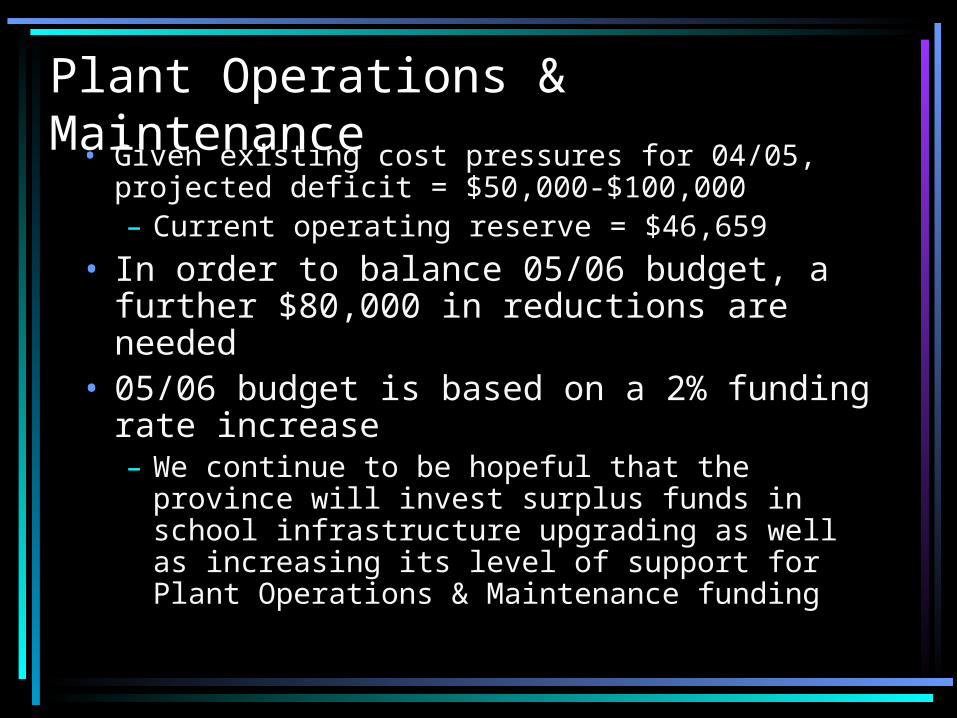
Plant Operations & Maintenance
• Given existing cost pressures for 04/05, projected deficit = $50,000-$100,000– Current operating reserve = $46,659
• In order to balance 05/06 budget, a further $80,000 in reductions are needed
• 05/06 budget is based on a 2% funding rate increase– We continue to be hopeful that the province
will invest surplus funds in school infrastructure upgrading as well as increasing its level of support for Plant Operations & Maintenance funding
Student Transportation Services
• Funding based on 3% rate increase, countered by a projected 3% decline in transported students (04/05 decline – 4%)
• Trends for declines in transported students appear to be later than those experienced in community schools
• Increase in diesel fuel pricing is among the major cost pressures
• Budget includes a 1% transfer to System Instruction Support
Student Transportation Services
• Budget is balanced with a provision to transfer $90,494 to the capital vehicle reserve to help offset the difference between the actual cost of bus replacements and the amortization expense
• In order to balance the budget - – 3 routes may be eliminated– Need to re-examine internal rates charged
to schools for extra-curricular trips• Look at 2-tiered rate – 1 for within school hours;
higher rate for past 3:30 p.m.
Board and System Administration
• It’s balanced• ADLC Management Services Fee
charged out at same rate as community schools (4.82%)– 2001/02 (5%) - $427,273– 2002/03 (4%) - $340,665– 2003/04 (4%) - $312,312– 2004/05 (4.82%) - $385,282– 2005/06 (4.82%) - $410,996
Board and System Administration
• System Administration to fund 17.07 FTE positions (2.5 FTE certificated; 14.57 FTE uncertificated)– A further 2.50 FTE positions are funded thru
System Instruction Support (1.5 FTE Directors & 1 FTE Technology Coordinator)
– Increase for 05/06 – 0.5 FTE for additional computer technician position (Co-op Pool to fund remaining 0.5 FTE)
• Projected Operating Reserve – Aug 31/05 = $0
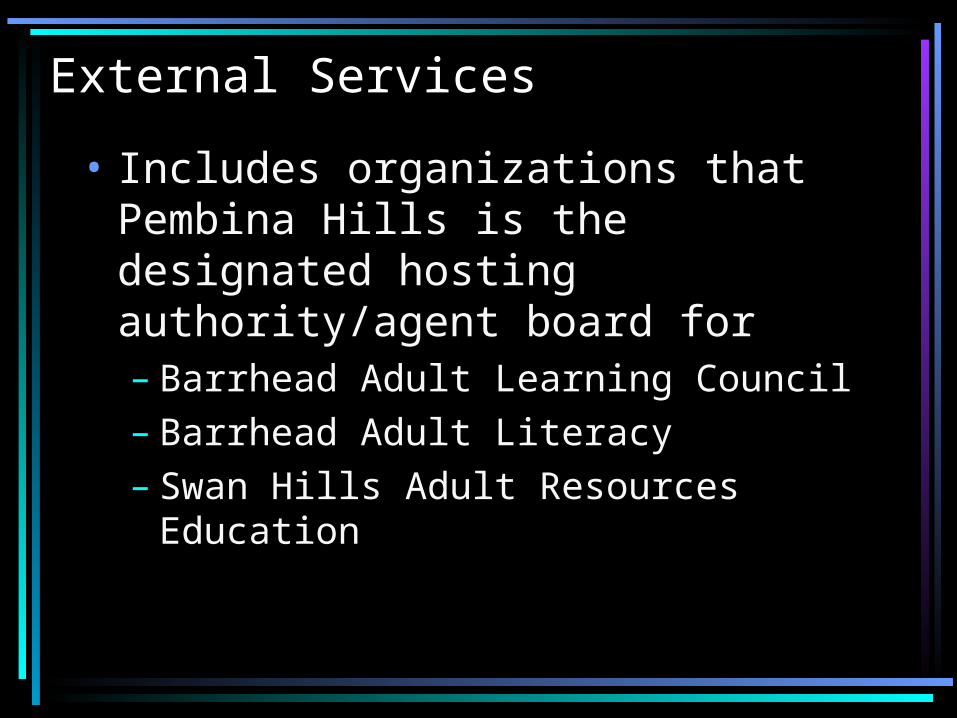
External Services
• Includes organizations that Pembina Hills is the designated hosting authority/agent board for– Barrhead Adult Learning Council– Barrhead Adult Literacy– Swan Hills Adult Resources Education
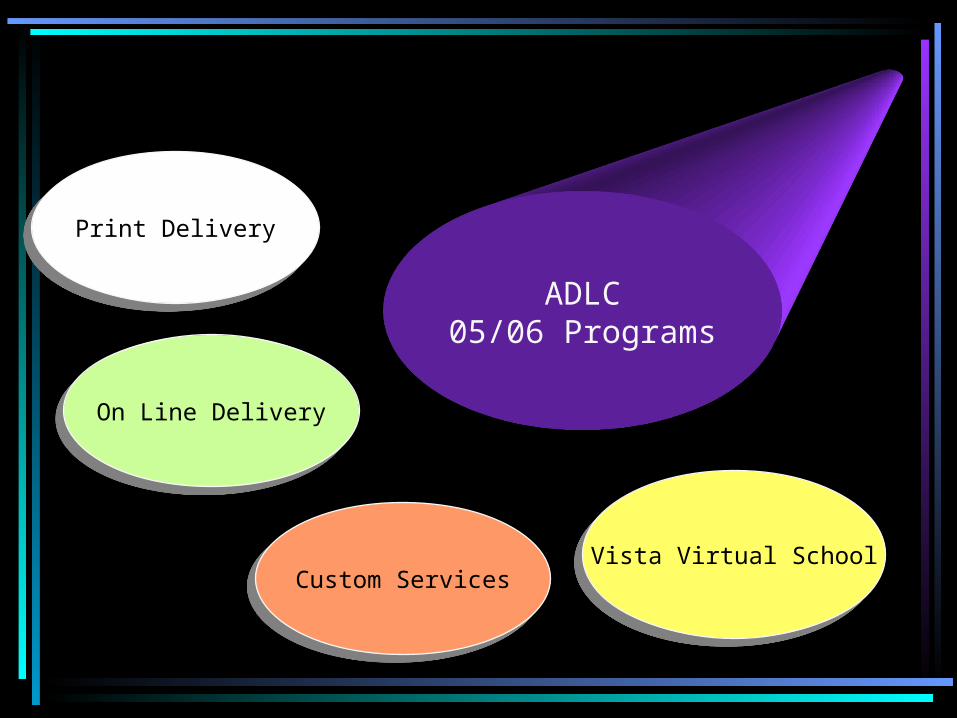
ADLC05/06 Programs
Print DeliveryPrint Delivery
On Line DeliveryOn Line Delivery
Vista Virtual SchoolVista Virtual SchoolCustom ServicesCustom Services
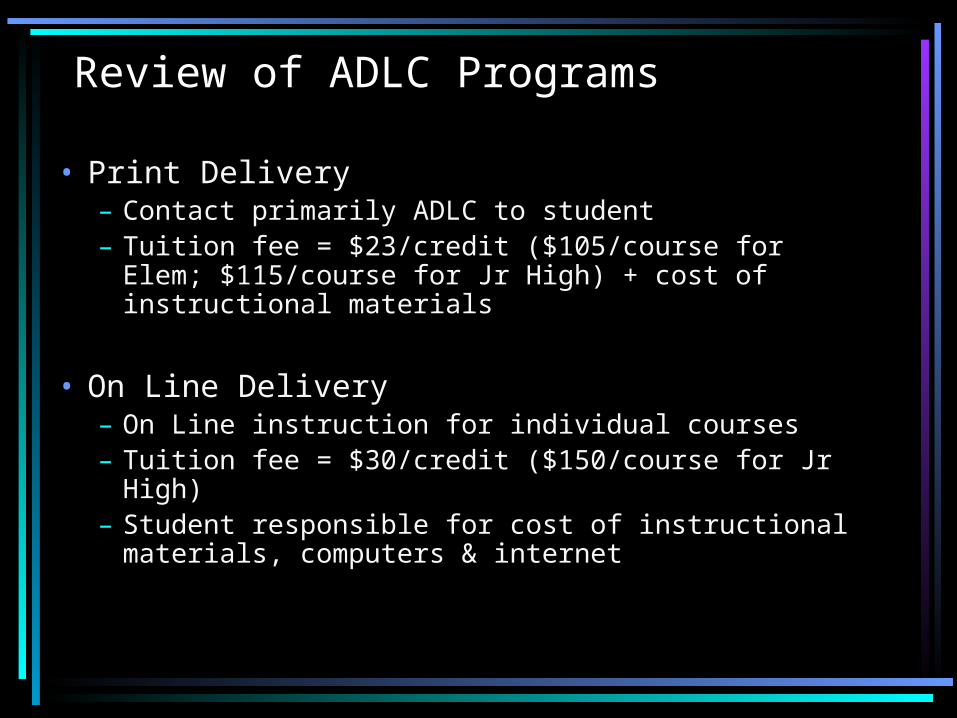
Review of ADLC Programs
• Print Delivery– Contact primarily ADLC to student– Tuition fee = $23/credit ($105/course for Elem;
$115/course for Jr High) + cost of instructional materials
• On Line Delivery – On Line instruction for individual courses– Tuition fee = $30/credit ($150/course for Jr High)– Student responsible for cost of instructional
materials, computers & internet
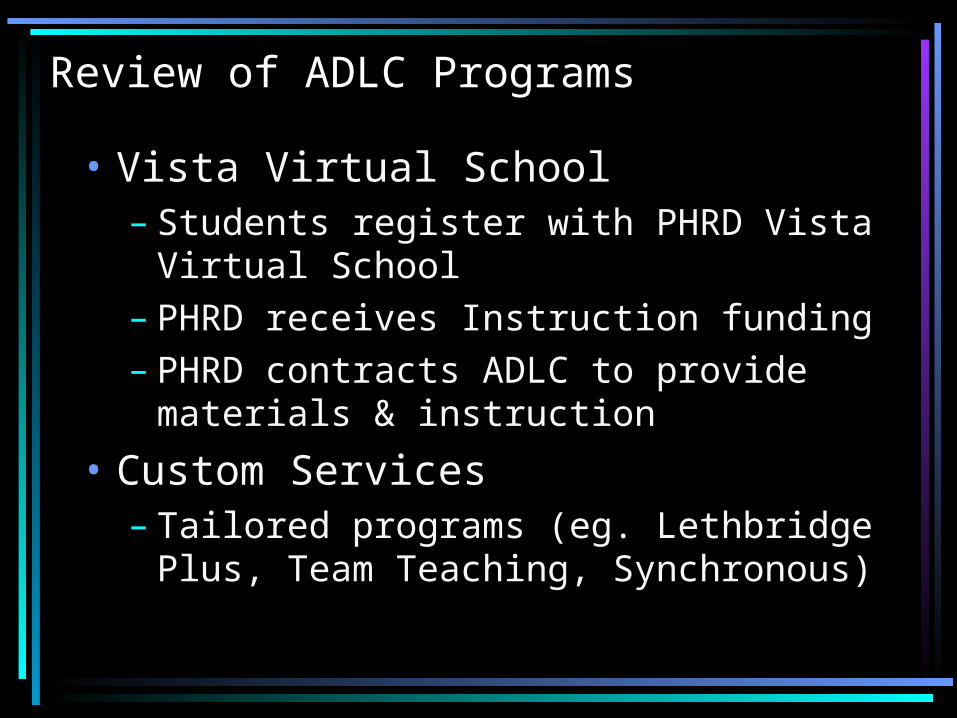
Review of ADLC Programs
• Vista Virtual School– Students register with PHRD Vista
Virtual School– PHRD receives Instruction funding– PHRD contracts ADLC to provide
materials & instruction
• Custom Services– Tailored programs (eg. Lethbridge
Plus, Team Teaching, Synchronous)
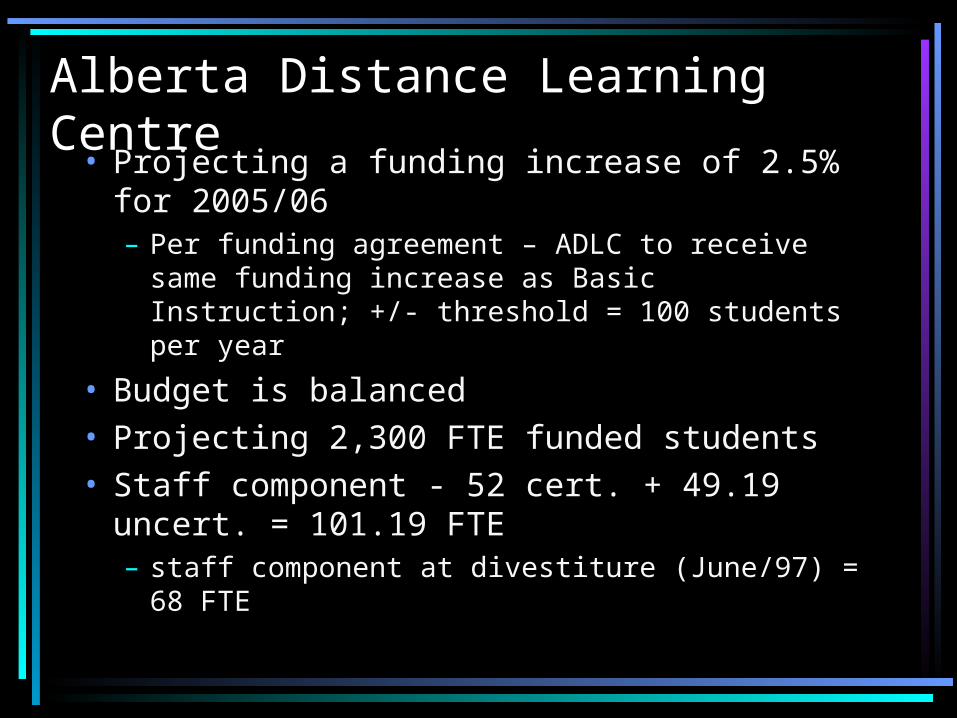
Alberta Distance Learning Centre
• Projecting a funding increase of 2.5% for 2005/06– Per funding agreement – ADLC to receive
same funding increase as Basic Instruction; +/- threshold = 100 students per year
• Budget is balanced• Projecting 2,300 FTE funded students• Staff component - 52 cert. + 49.19
uncert. = 101.19 FTE– staff component at divestiture (June/97) = 68
FTE

Alberta Distance Learning Centre
• Operating & Capital Reserves, Sept/04 - $971,737– Equity in Fixed Assets, Sept/04 -
$831,912
• Projected Reserves, Aug 31/06 (excluding Vista Virtual) - $753,269
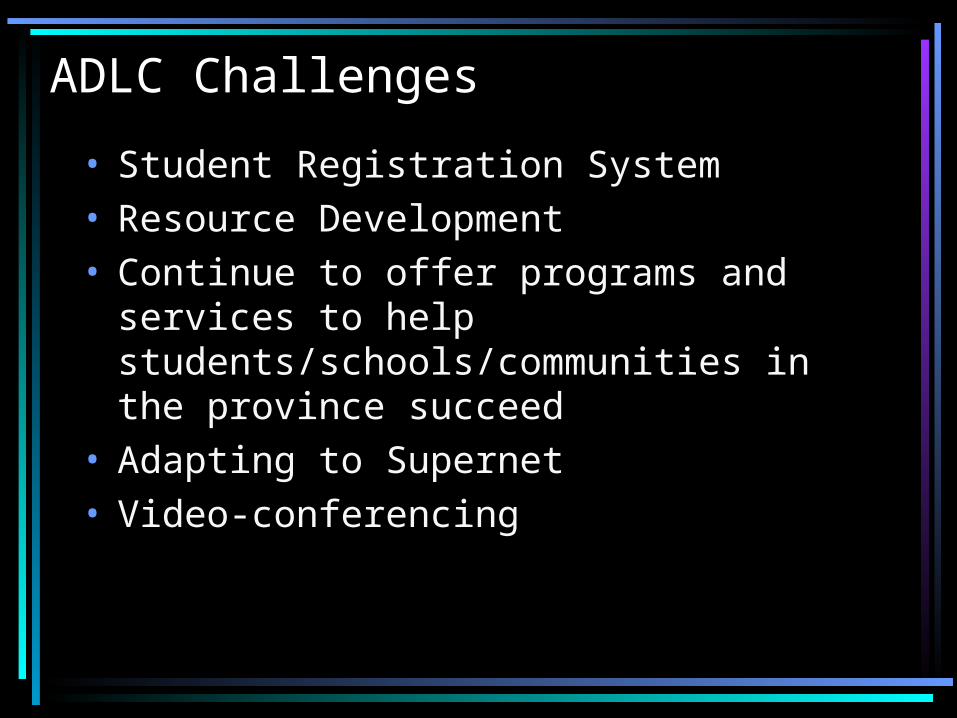
ADLC Challenges
• Student Registration System• Resource Development• Continue to offer programs and services
to help students/schools/communities in the province succeed
• Adapting to Supernet• Video-conferencing
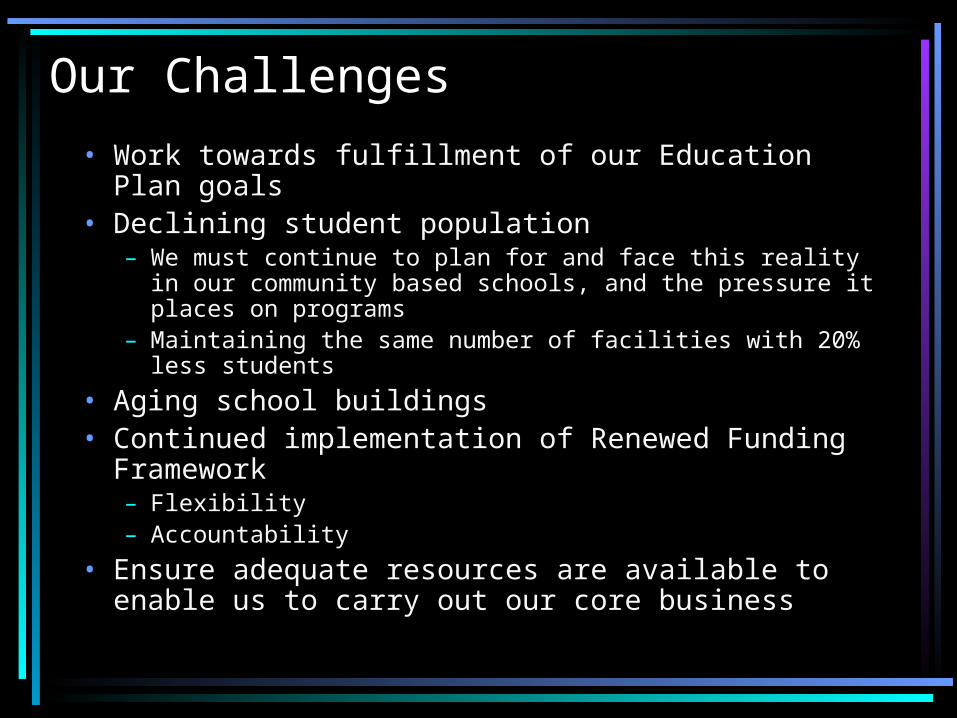
Our Challenges
• Work towards fulfillment of our Education Plan goals
• Declining student population – We must continue to plan for and face this reality in our
community based schools, and the pressure it places on programs
– Maintaining the same number of facilities with 20% less students
• Aging school buildings• Continued implementation of Renewed Funding
Framework– Flexibility– Accountability
• Ensure adequate resources are available to enable us to carry out our core business
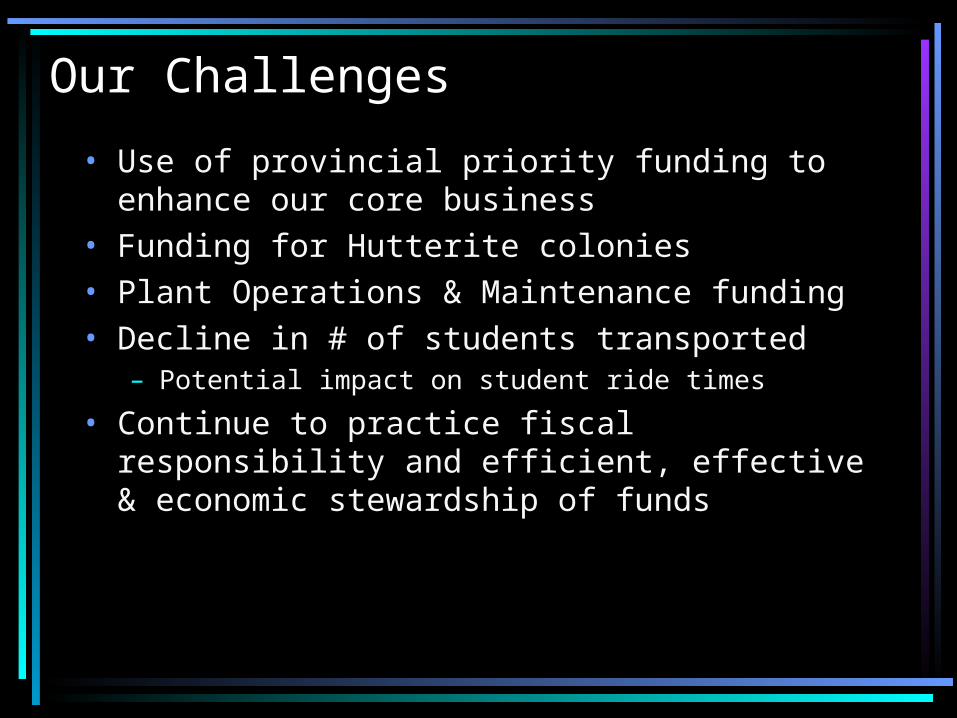
Our Challenges
• Use of provincial priority funding to enhance our core business
• Funding for Hutterite colonies• Plant Operations & Maintenance funding• Decline in # of students transported
– Potential impact on student ride times
• Continue to practice fiscal responsibility and efficient, effective & economic stewardship of funds

Our Opportunity….
Focus on Excellence!!!
2005-06 Budget Review
…review of budget binder

Questions…..
Recommended