Peak Oil, Peak EnergyMother Nature Bats Last
Martin Sereno1 Feb 2011 (orig. talk: Nov 2004)
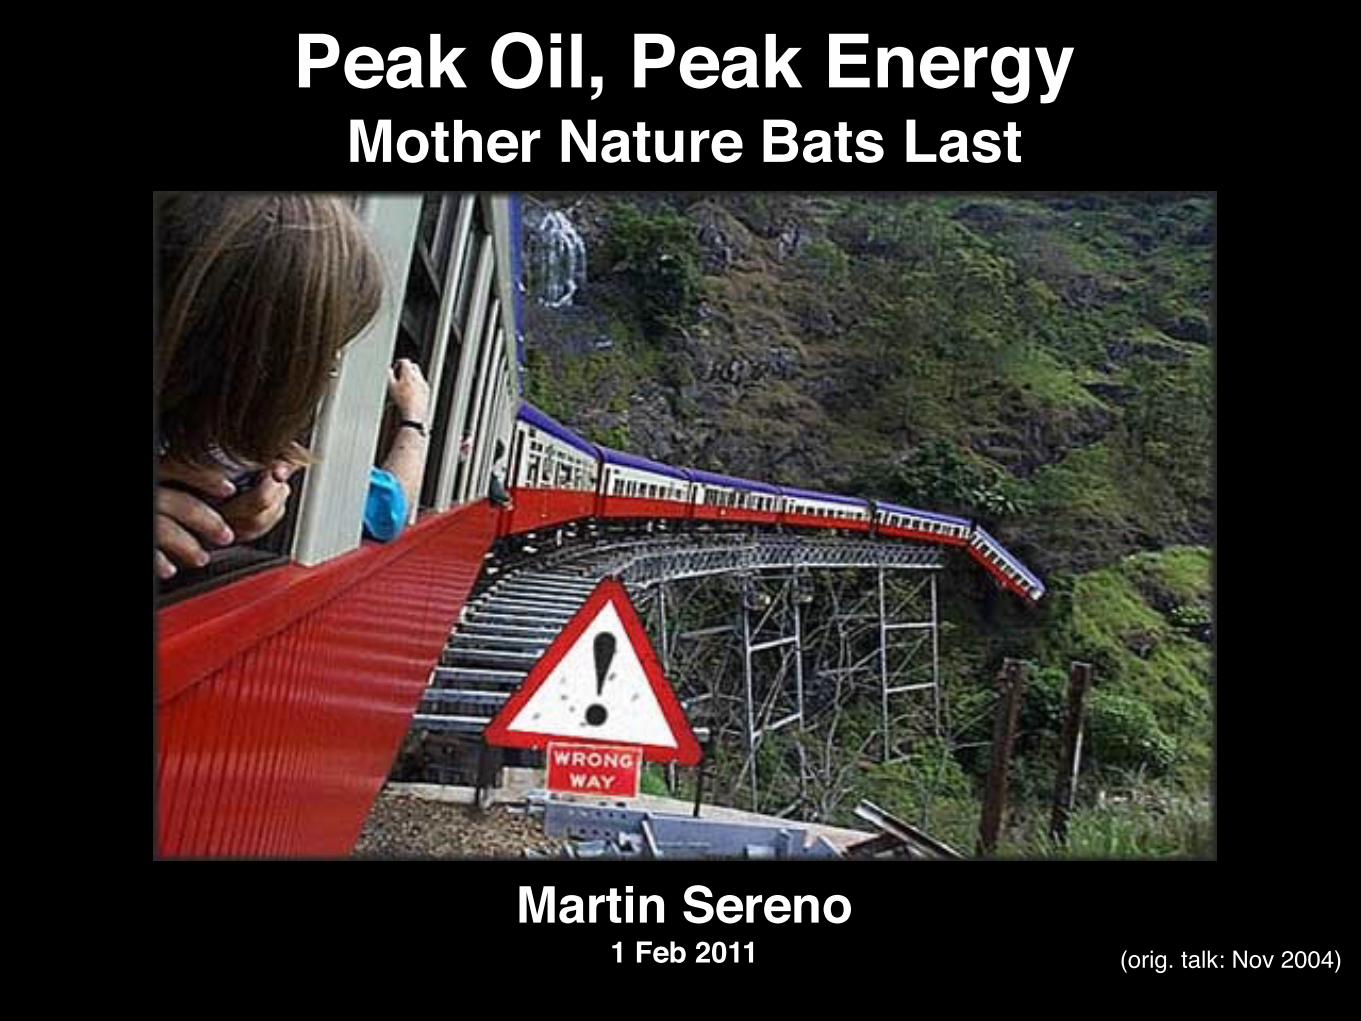
Oil is the Lifeblood of Industrial Civilization
• 80 million barrels/day, 1000 barrels/sec, 1 cubic mile/year
• highly energy-dense
• easy to transport, store
• moves goods and people
• allows us to fly (there will never be a battery-operated jet plane)
• digs huge holes and puts up huge buildings
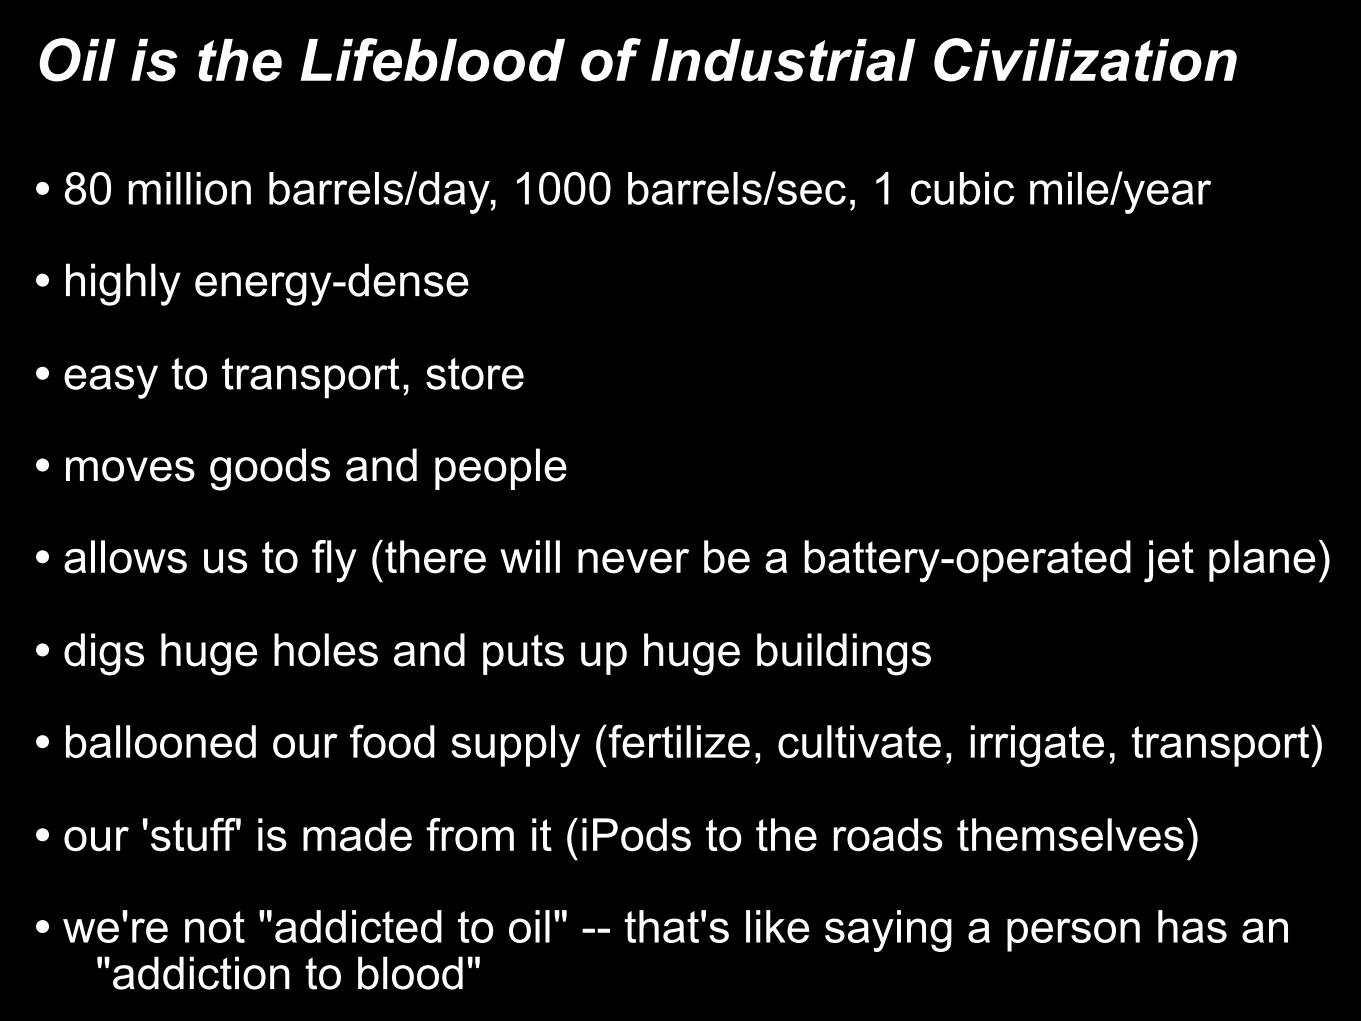
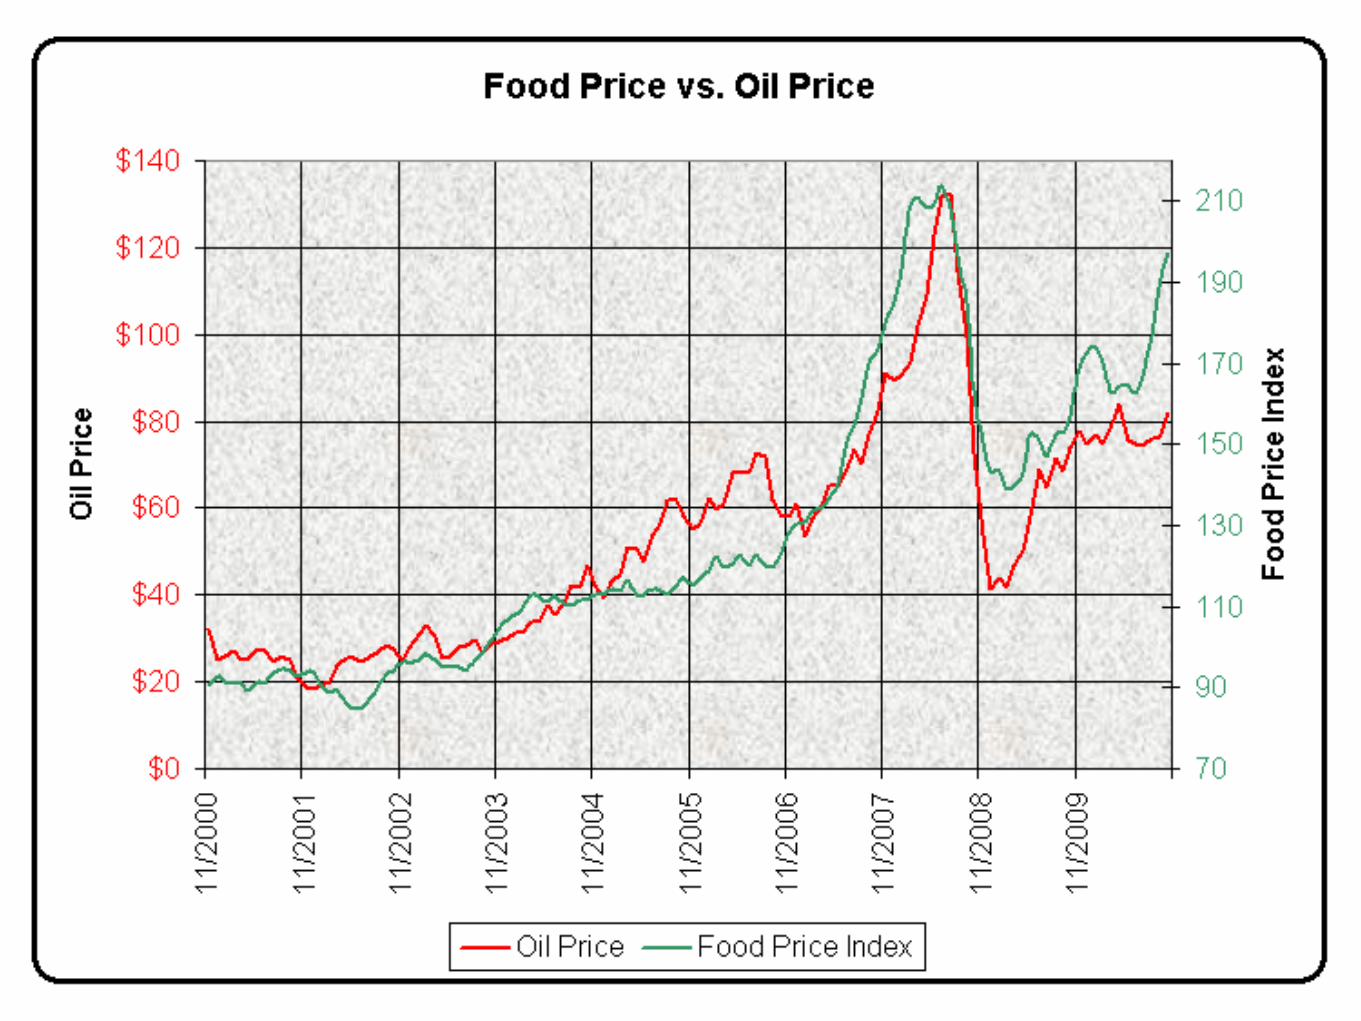
• ballooned our food supply (fertilize, cultivate, irrigate, transport)
• our 'stuff' is made from it (iPods to the roads themselves)
• we're not "addicted to oil" -- that's like saying a person has an "addiction to blood"
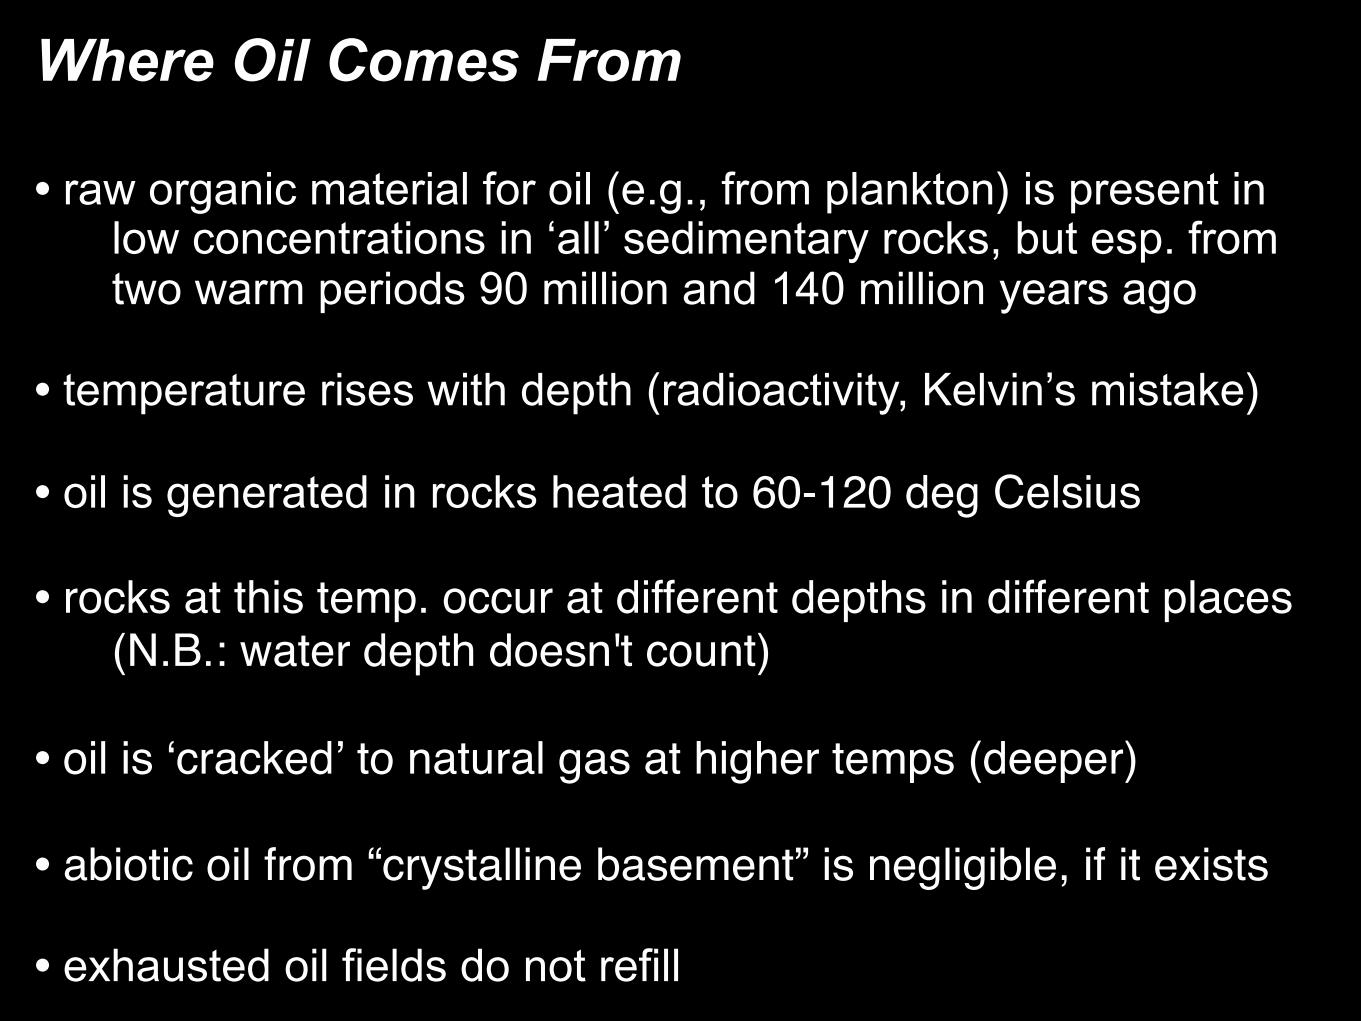
Where Oil Comes From
• raw organic material for oil (e.g., from plankton) is present in low concentrations in ‘all’ sedimentary rocks, but esp. from two warm periods 90 million and 140 million years ago
• temperature rises with depth (radioactivity, Kelvin’s mistake)
• oil is generated in rocks heated to 60-120 deg Celsius
• rocks at this temp. occur at different depths in different places (N.B.: water depth doesn't count)
• oil is ‘cracked’ to natural gas at higher temps (deeper)
• abiotic oil from “crystalline basement” is negligible, if it exists
• exhausted oil fields do not refill
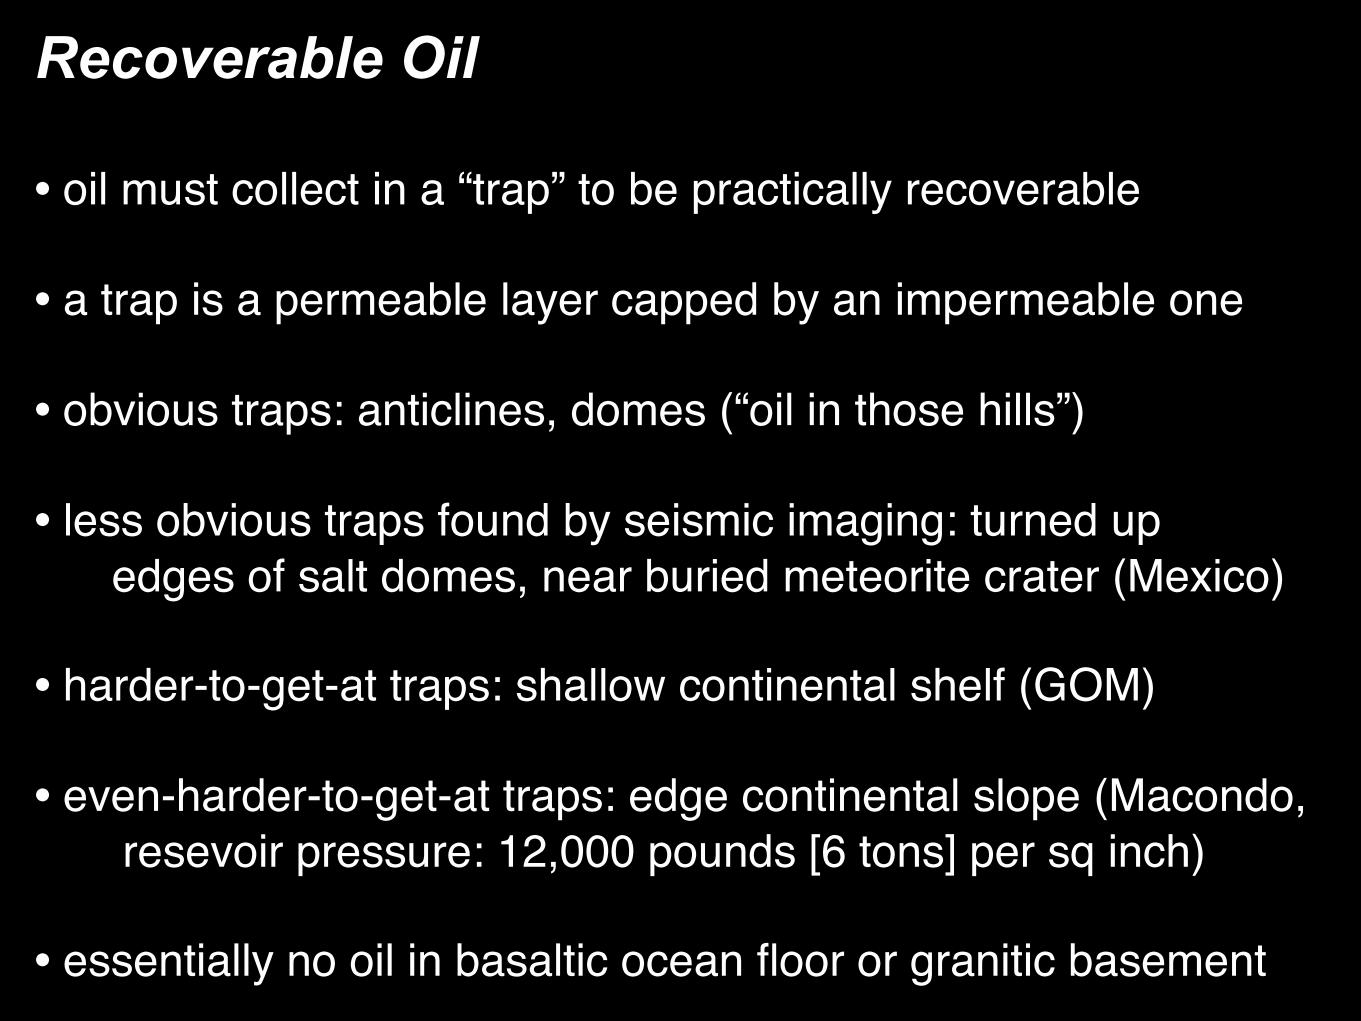
Recoverable Oil
• oil must collect in a “trap” to be practically recoverable
• a trap is a permeable layer capped by an impermeable one
• obvious traps: anticlines, domes (“oil in those hills”)
• less obvious traps found by seismic imaging: turned up edges of salt domes, near buried meteorite crater (Mexico)
• harder-to-get-at traps: shallow continental shelf (GOM)
• even-harder-to-get-at traps: edge continental slope (Macondo, resevoir pressure: 12,000 pounds [6 tons] per sq inch)
• essentially no oil in basaltic ocean floor or granitic basement
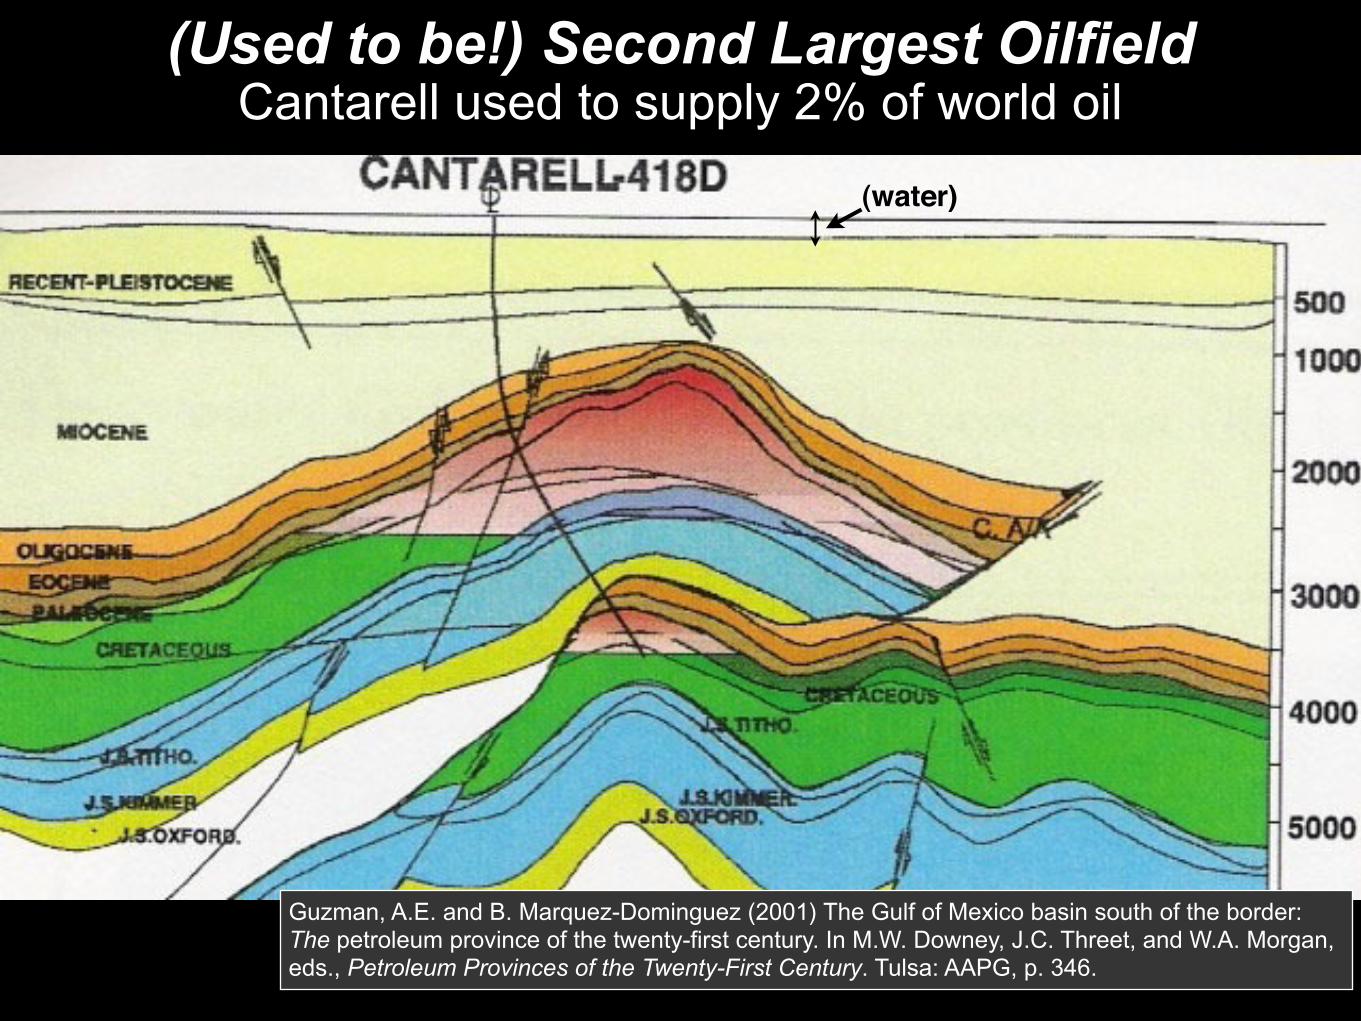
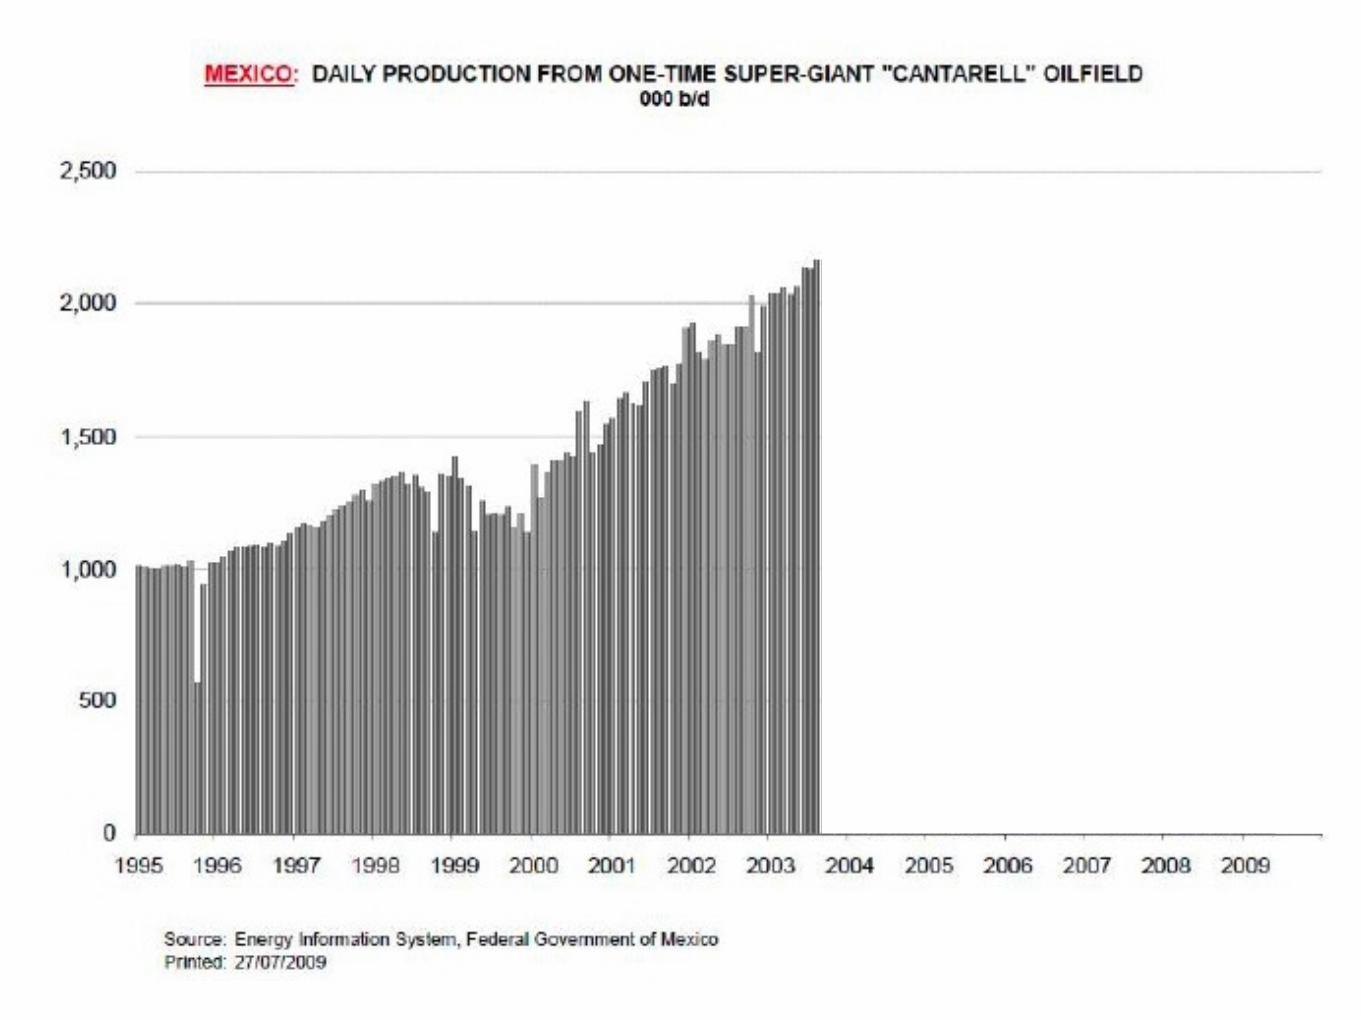
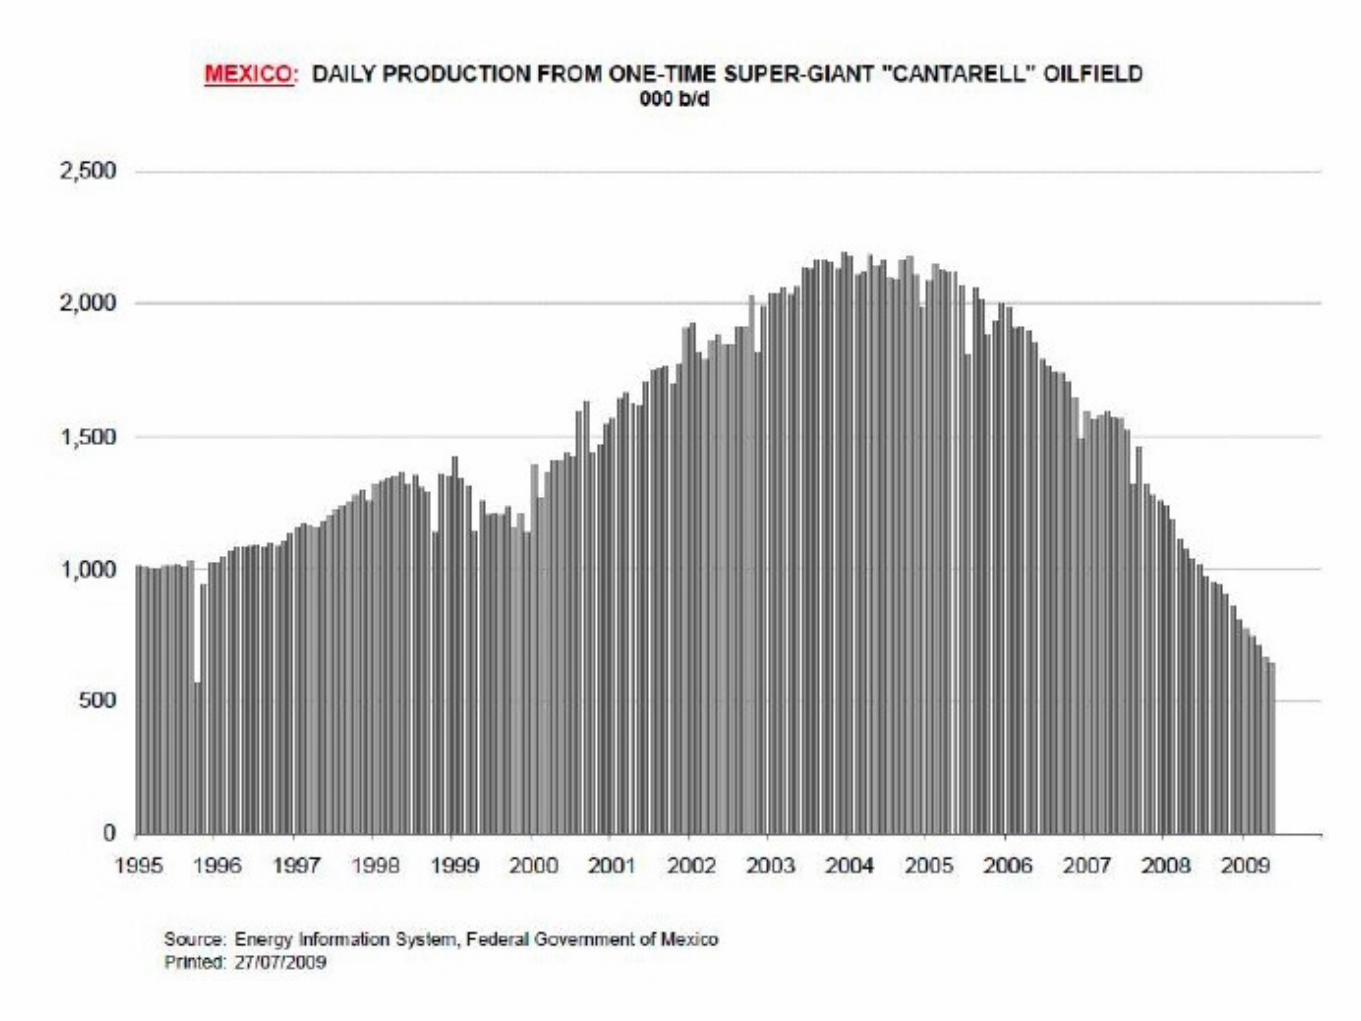
(Used to be!) Second Largest OilfieldCantarell used to supply 2% of world oil
Guzman, A.E. and B. Marquez-Dominguez (2001) The Gulf of Mexico basin south of the border: The petroleum province of the twenty-first century. In M.W. Downey, J.C. Threet, and W.A. Morgan, eds., Petroleum Provinces of the Twenty-First Century. Tulsa: AAPG, p. 346.
(water)
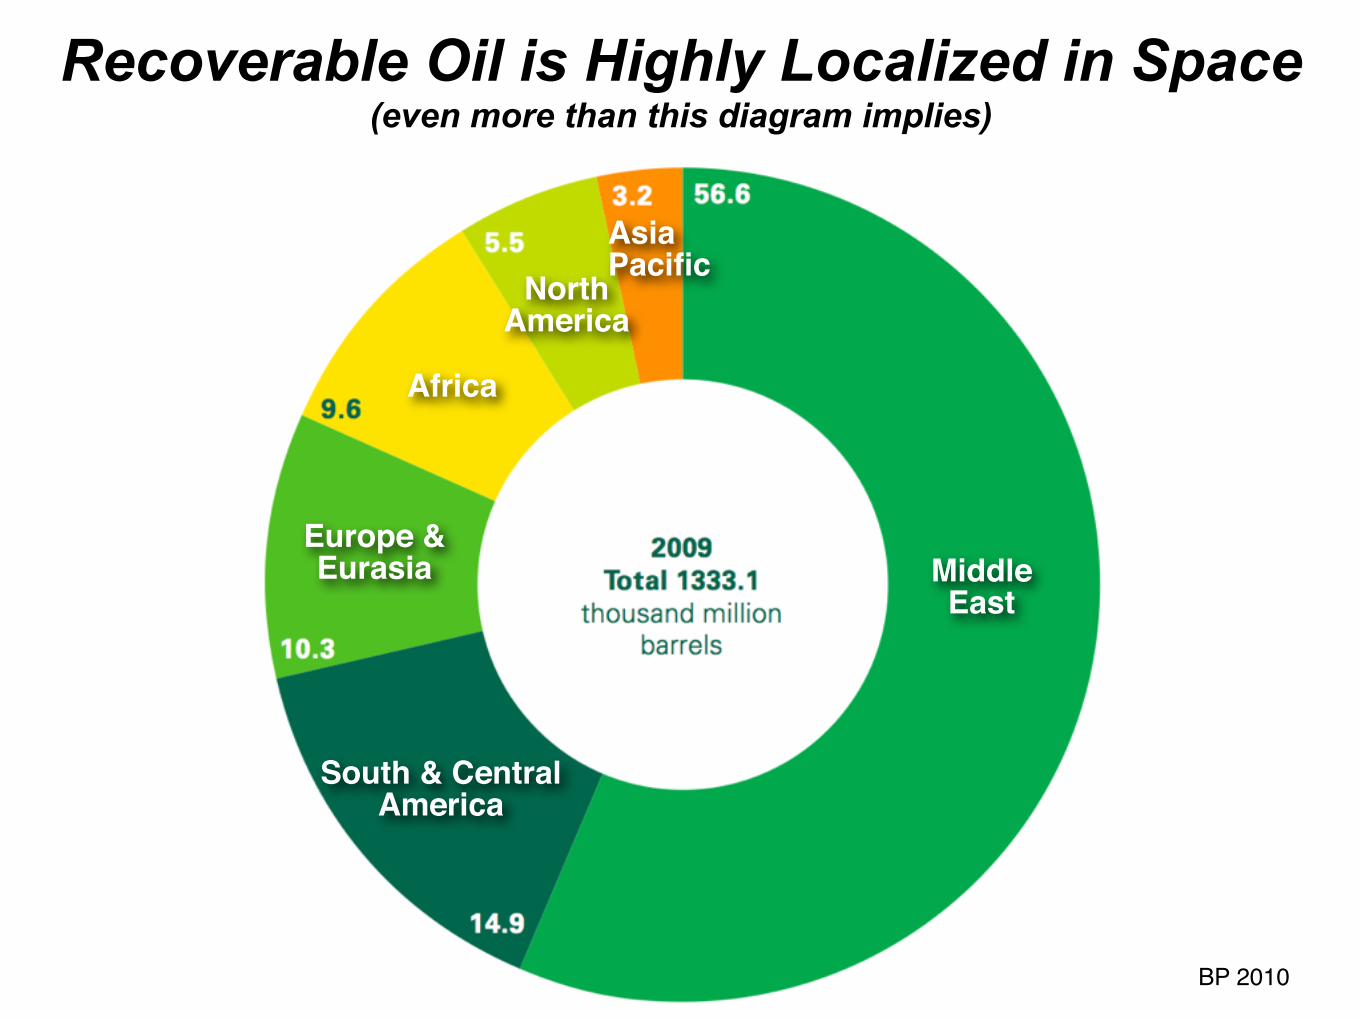
Recoverable Oil is Highly Localized in Space(even more than this diagram implies)
MiddleEast
Europe &Eurasia
South & CentralAmerica
Africa
NorthAmerica
AsiaPacific
BP 2010
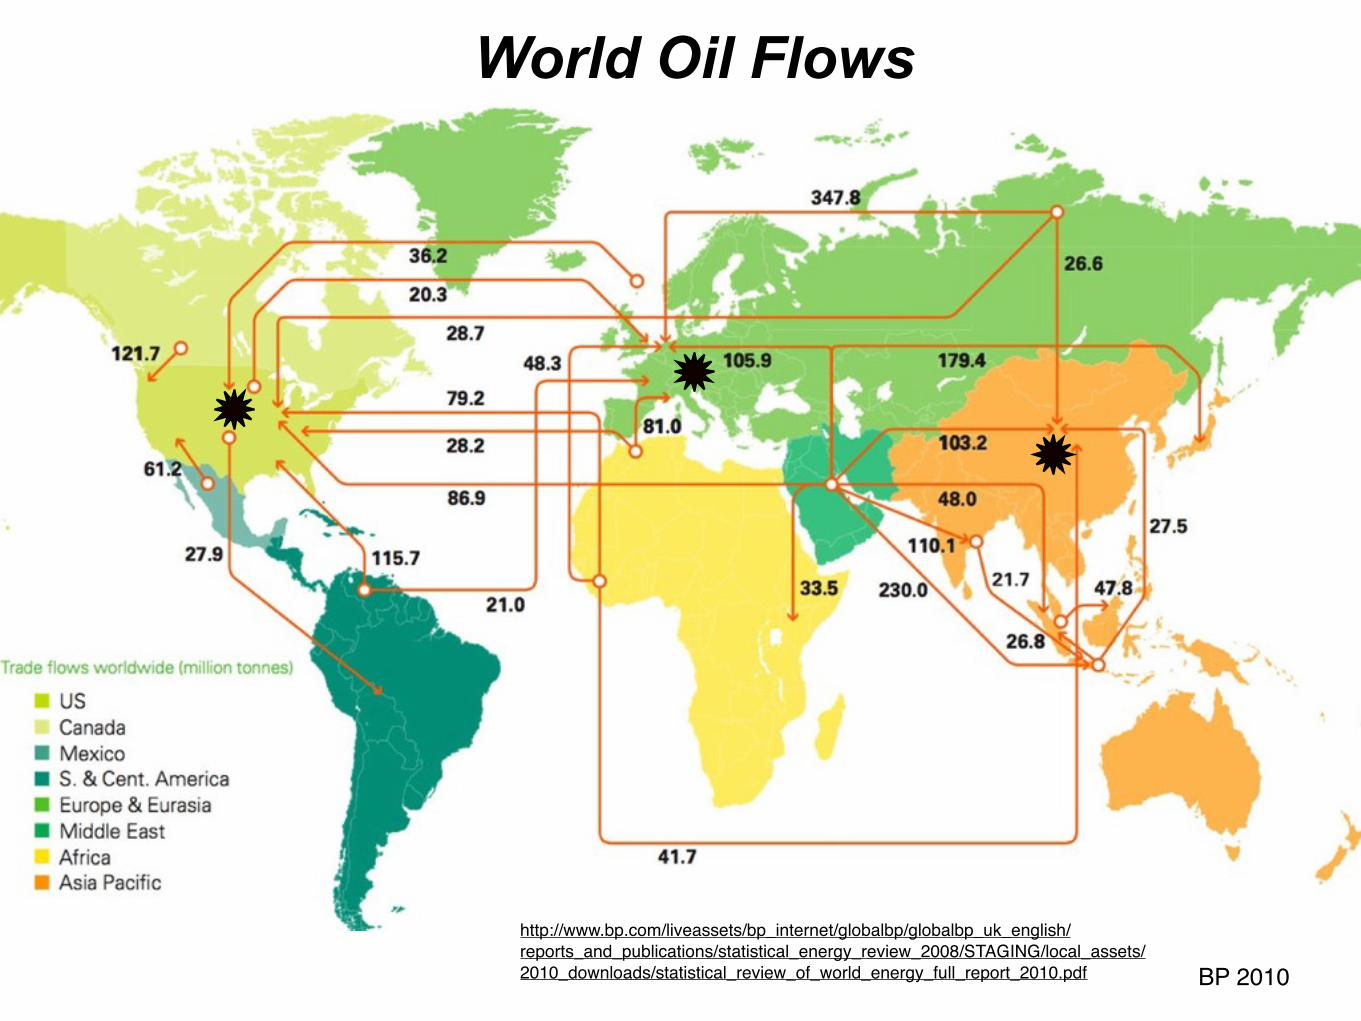
http://www.bp.com/liveassets/bp_internet/globalbp/globalbp_uk_english/reports_and_publications/statistical_energy_review_2008/STAGING/local_assets/2010_downloads/statistical_review_of_world_energy_full_report_2010.pdf
World Oil Flows
BP 2010
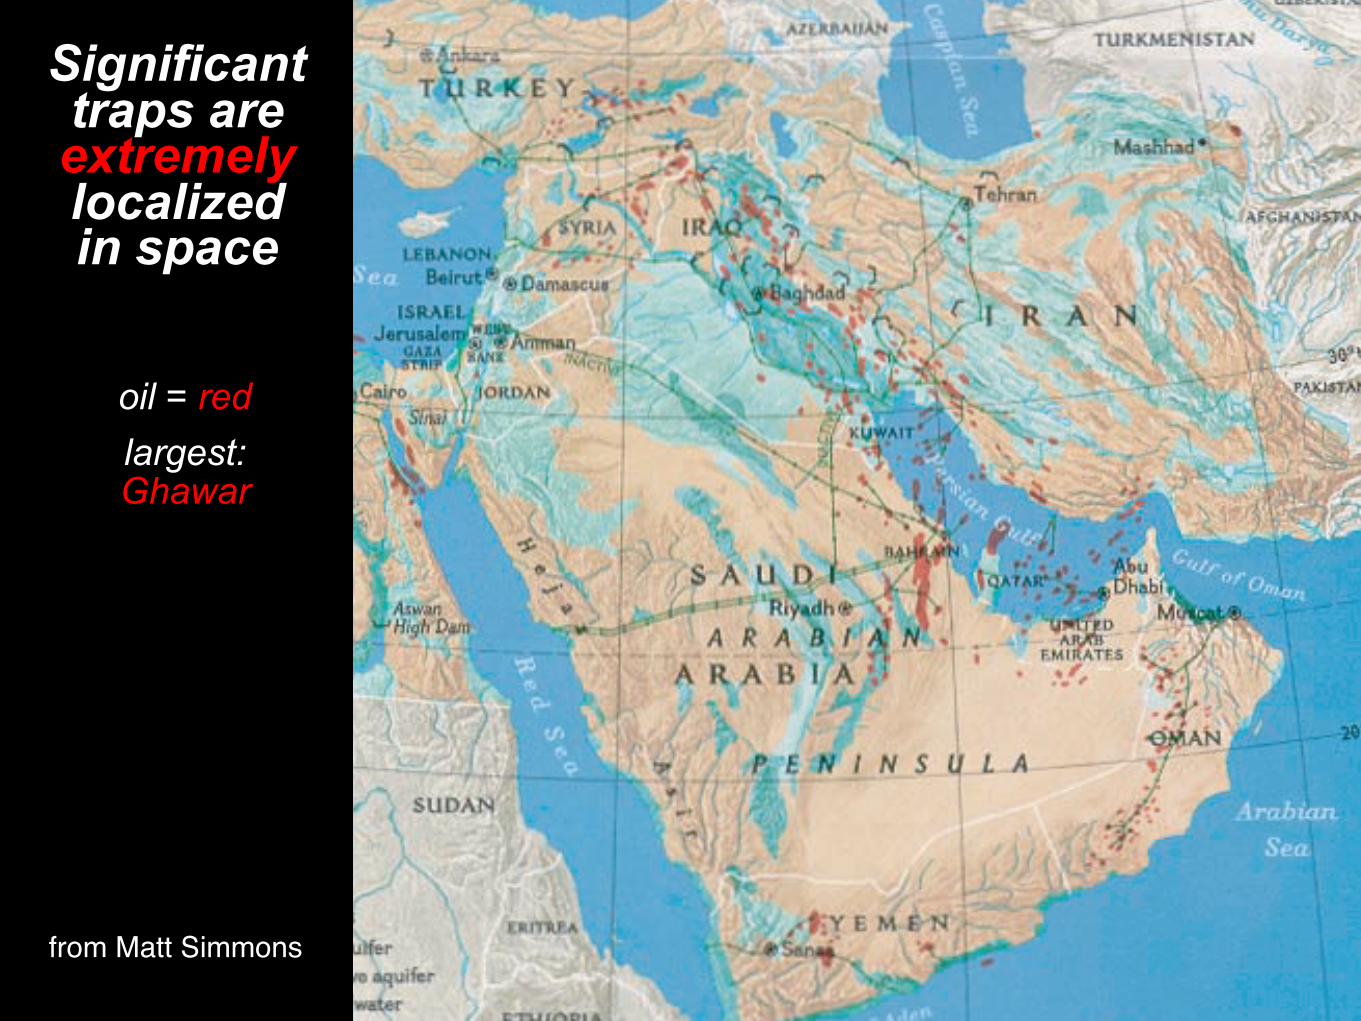
oil = red
largest: Ghawar
from Matt Simmons
Significant traps are extremely localized in space
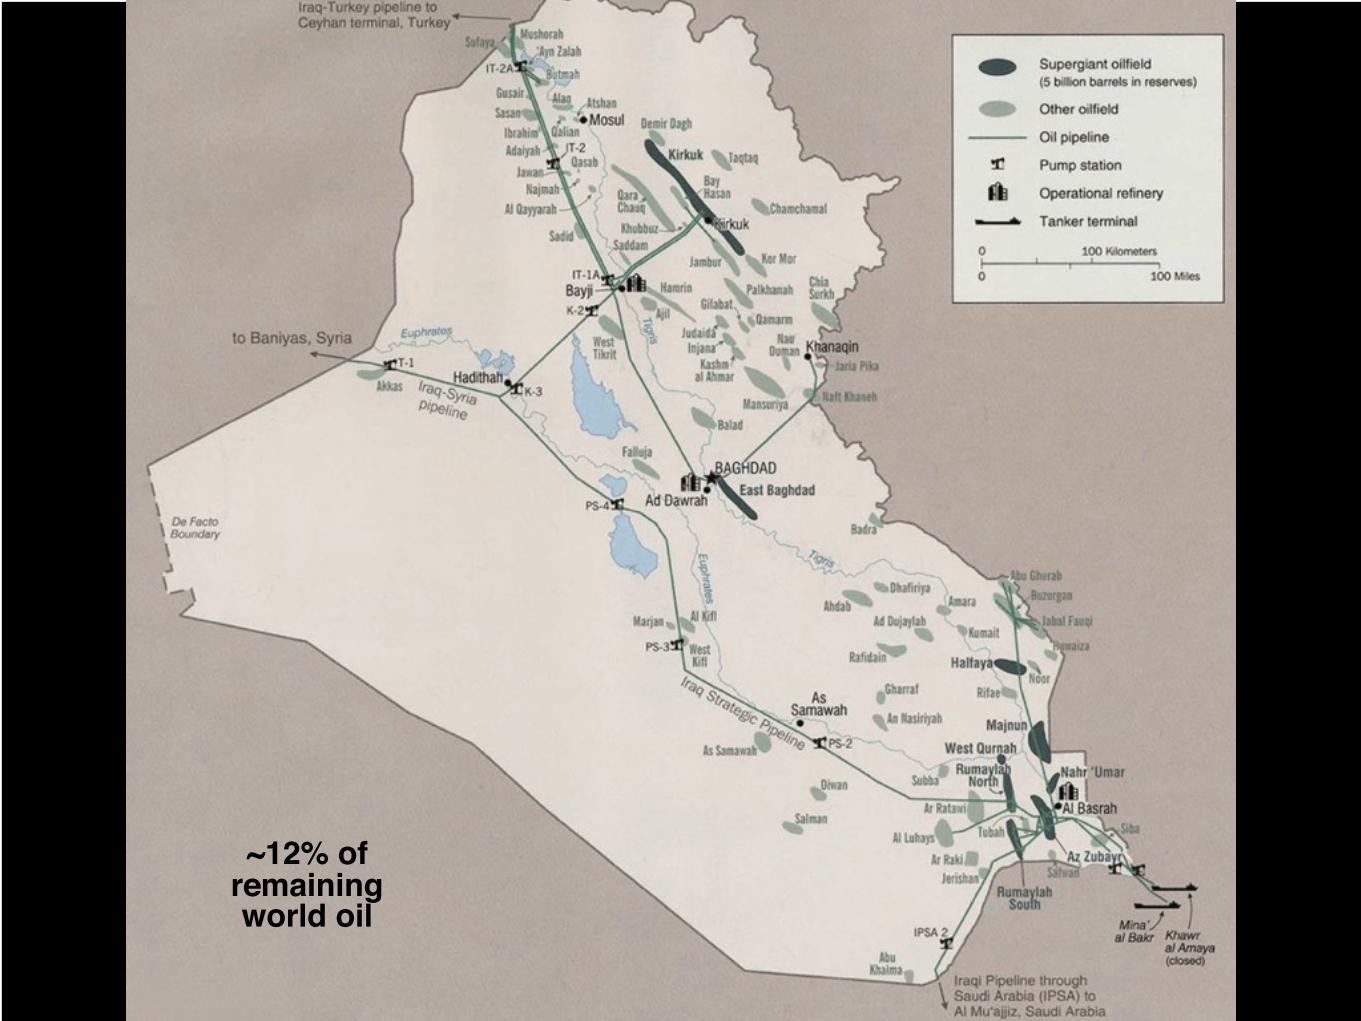
~12% of remaining world oil
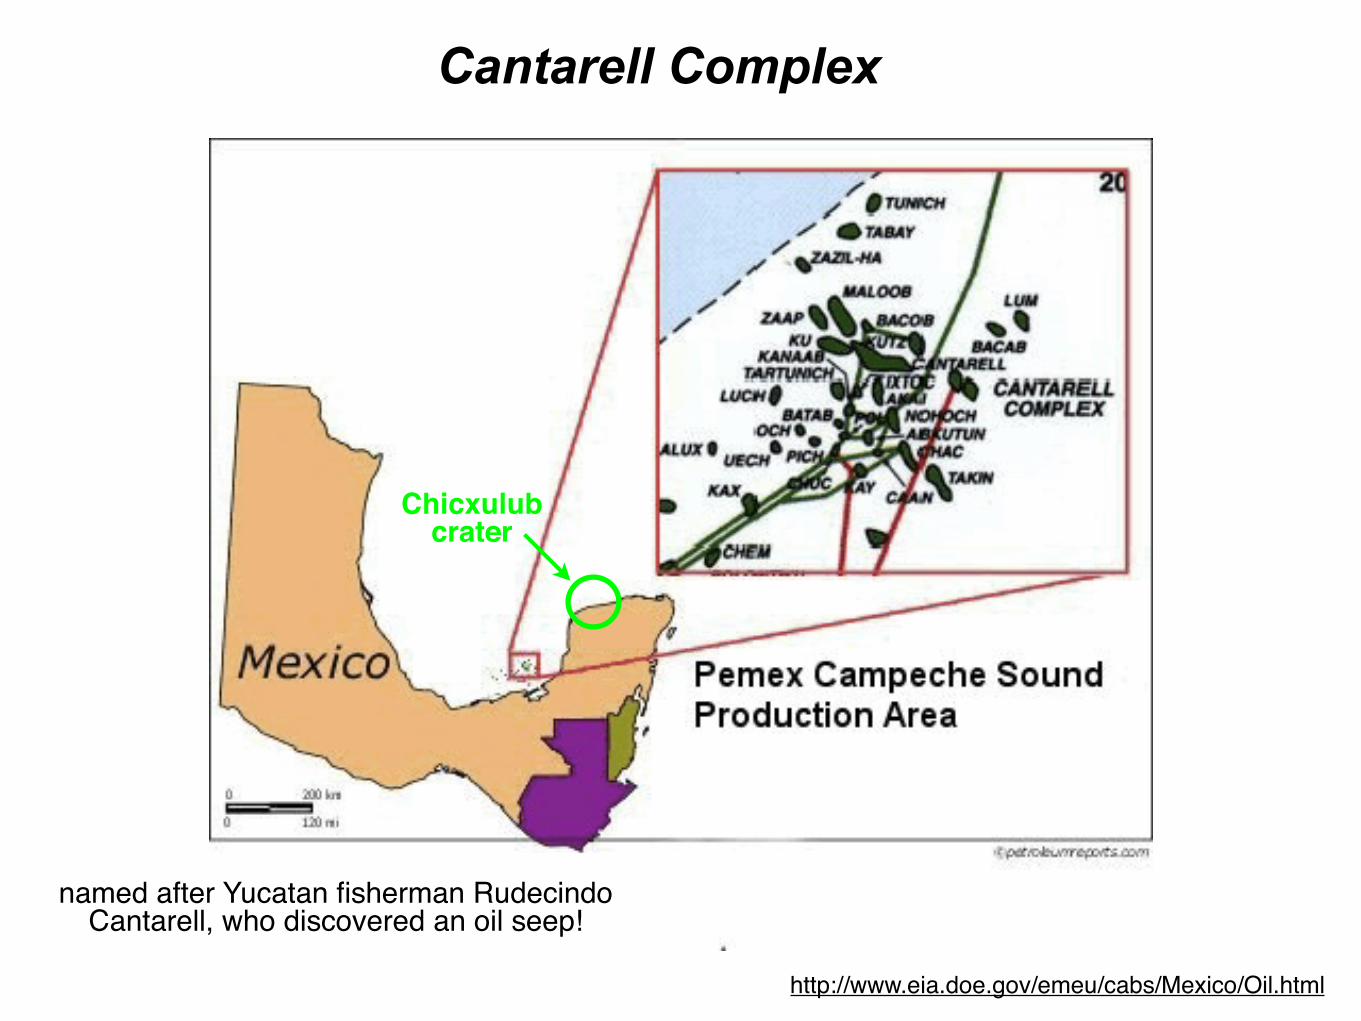
http://www.eia.doe.gov/emeu/cabs/Mexico/Oil.html
named after Yucatan fisherman Rudecindo Cantarell, who discovered an oil seep!
Chicxulubcrater
Cantarell Complex
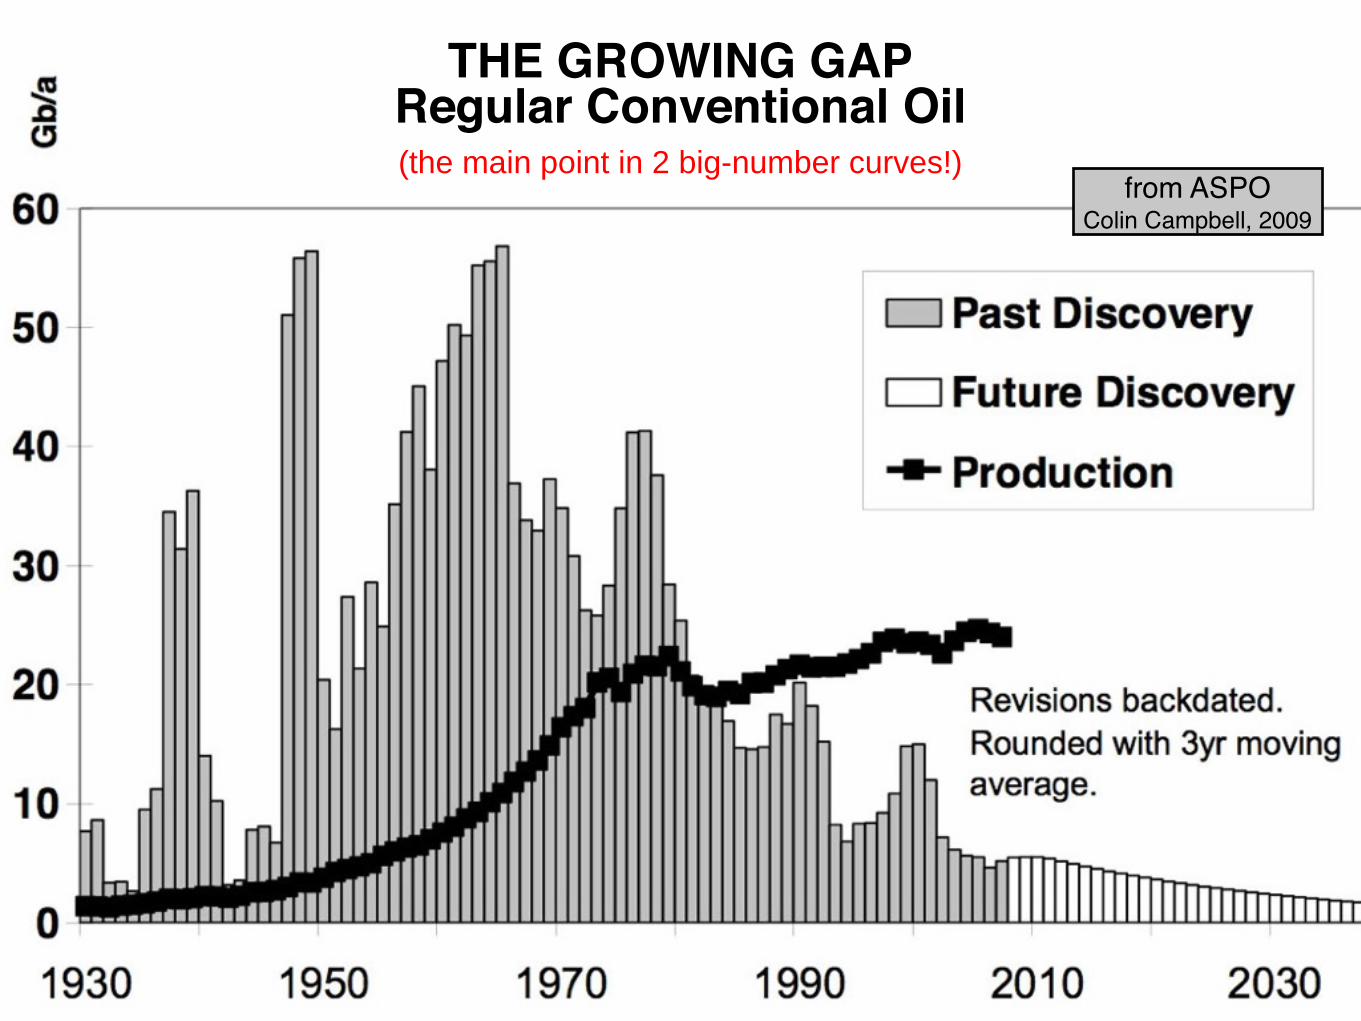
from ASPOColin Campbell, 2009
THE GROWING GAPRegular Conventional Oil(the main point in 2 big-number curves!)
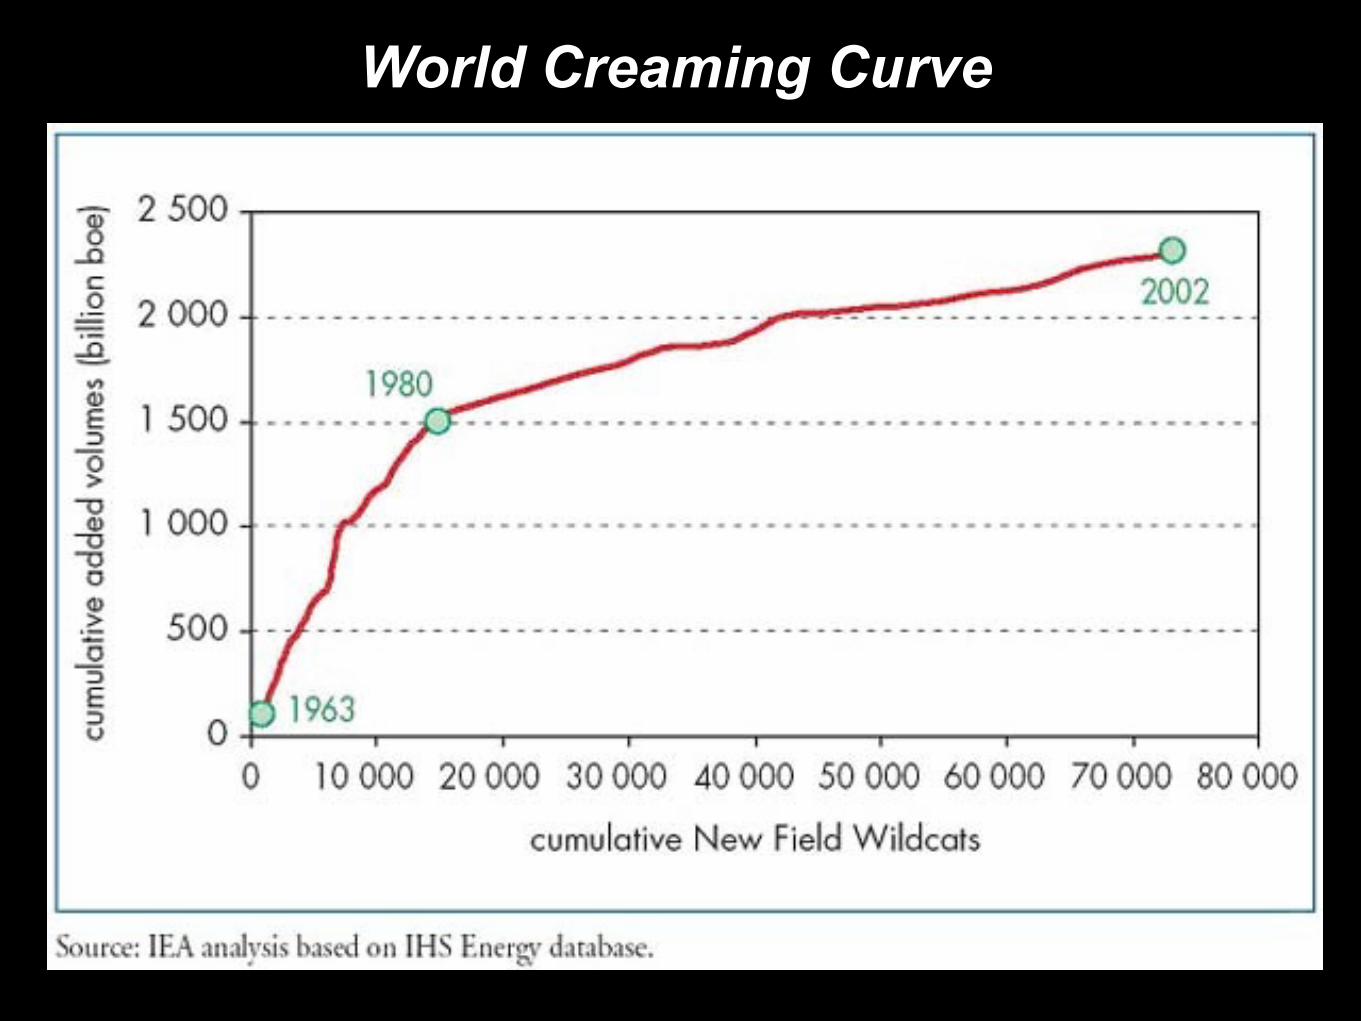
World Creaming Curve
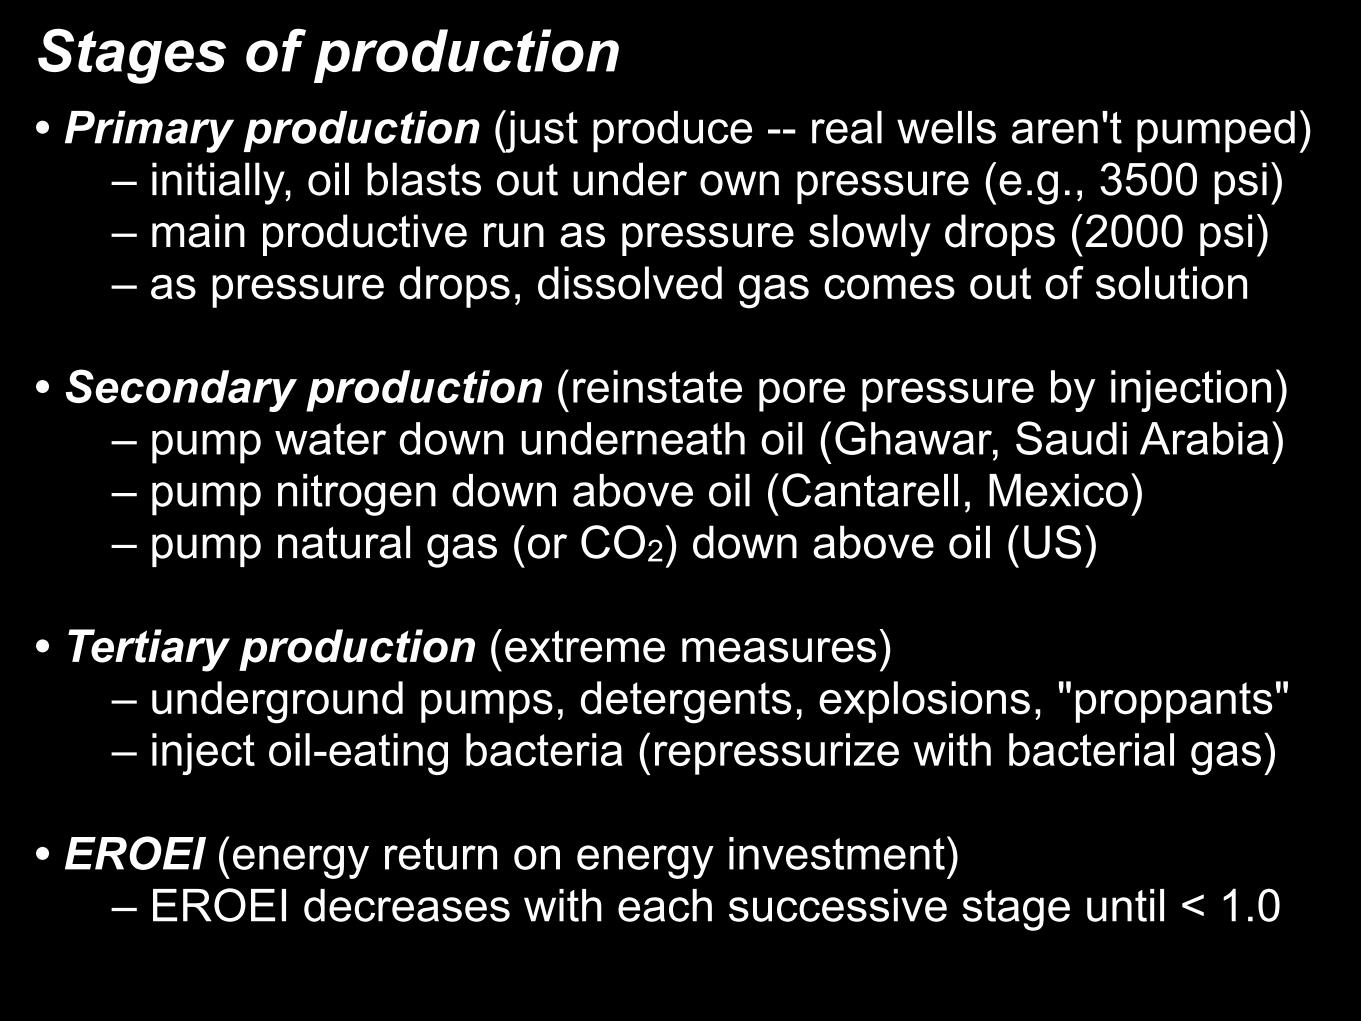
Stages of production• Primary production (just produce -- real wells aren't pumped) – initially, oil blasts out under own pressure (e.g., 3500 psi) – main productive run as pressure slowly drops (2000 psi) – as pressure drops, dissolved gas comes out of solution
• Secondary production (reinstate pore pressure by injection) – pump water down underneath oil (Ghawar, Saudi Arabia) – pump nitrogen down above oil (Cantarell, Mexico) – pump natural gas (or CO2) down above oil (US)
• Tertiary production (extreme measures) – underground pumps, detergents, explosions, "proppants" – inject oil-eating bacteria (repressurize with bacterial gas)
• EROEI (energy return on energy investment) – EROEI decreases with each successive stage until < 1.0
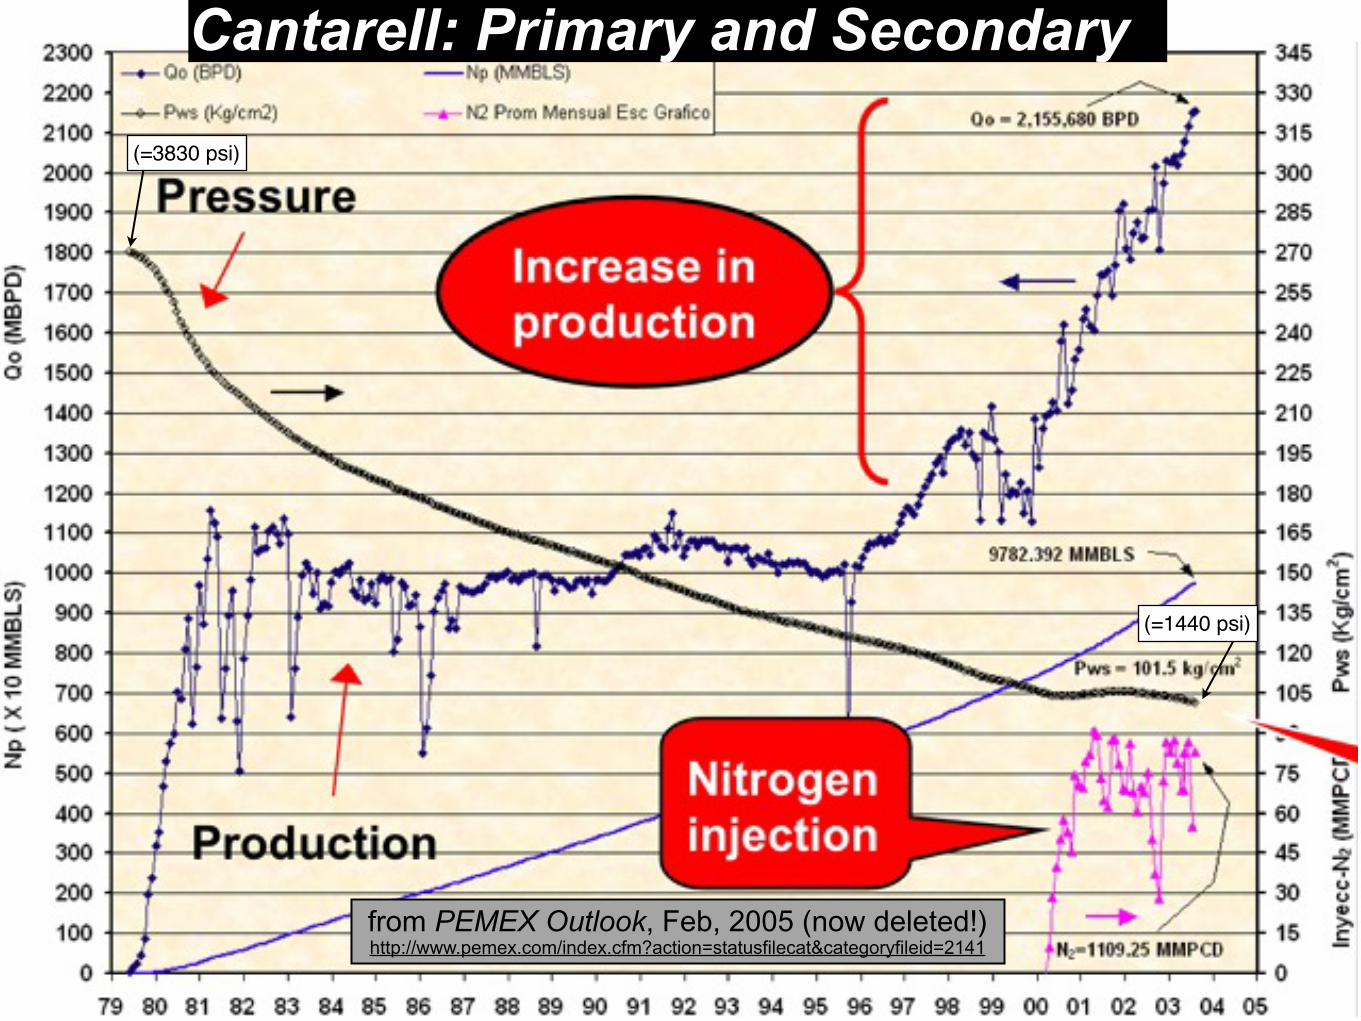
from PEMEX Outlook, Feb, 2005 (now deleted!)http://www.pemex.com/index.cfm?action=statusfilecat&categoryfileid=2141
(=3830 psi)
(=1440 psi)
Cantarell: Primary and Secondary
SIMMONS & COMPANY
INTERNATIONALSource: “Fifty Year Crude Oil Supply Scenarios: Saudi Arabia’s Perspective”, Saudi Aramco, February 2004.
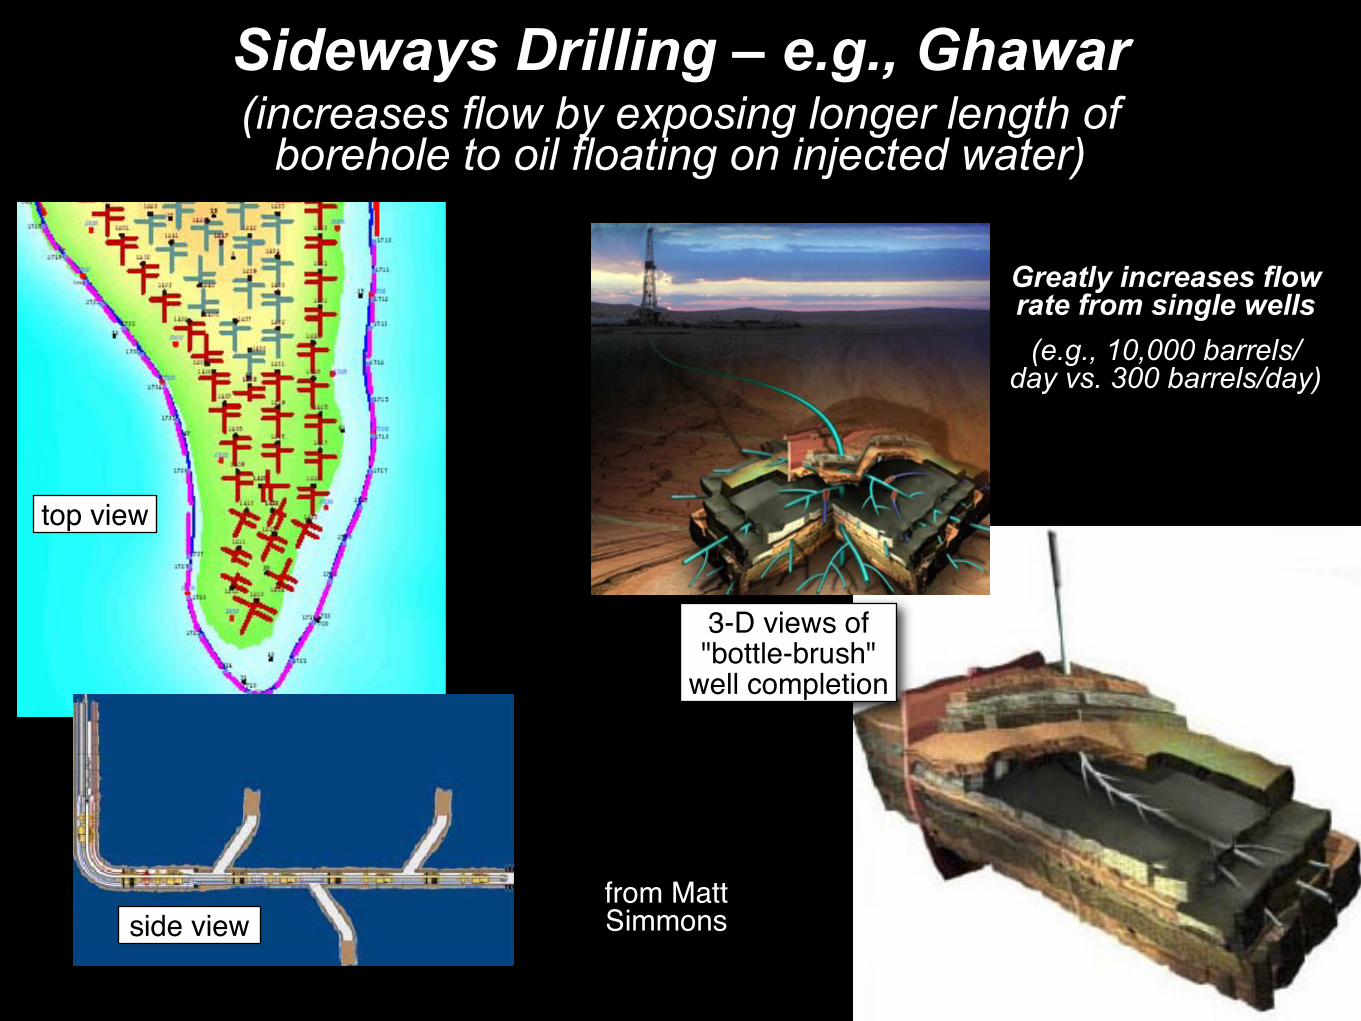
Sideways Drilling – e.g., Ghawar(increases flow by exposing longer length of
borehole to oil floating on injected water)
top view
Greatly increases flow rate from single wells
(e.g., 10,000 barrels/day vs. 300 barrels/day)
3-D views of "bottle-brush"
well completion
SIMMONS & COMPANY
INTERNATIONALSource: “Fifty Year Crude Oil Supply Scenarios: Saudi Arabia’s Perspective”, Saudi Aramco, February 2004.
side viewfrom Matt Simmons
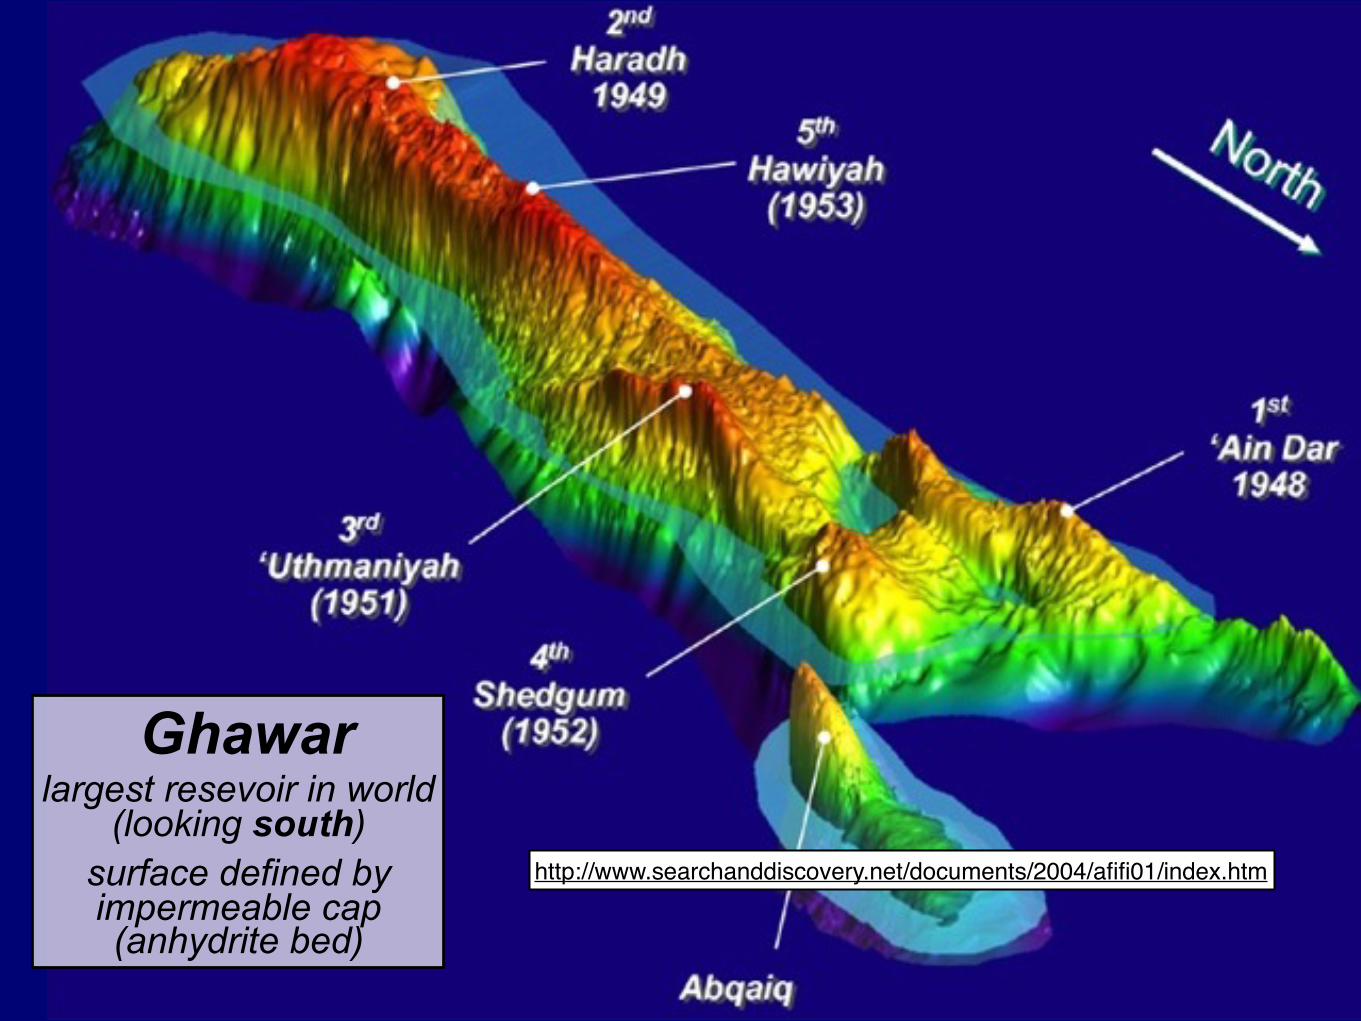
Ghawarlargest resevoir in world
(looking south)surface defined by impermeable cap (anhydrite bed)
http://www.searchanddiscovery.net/documents/2004/afifi01/index.htm
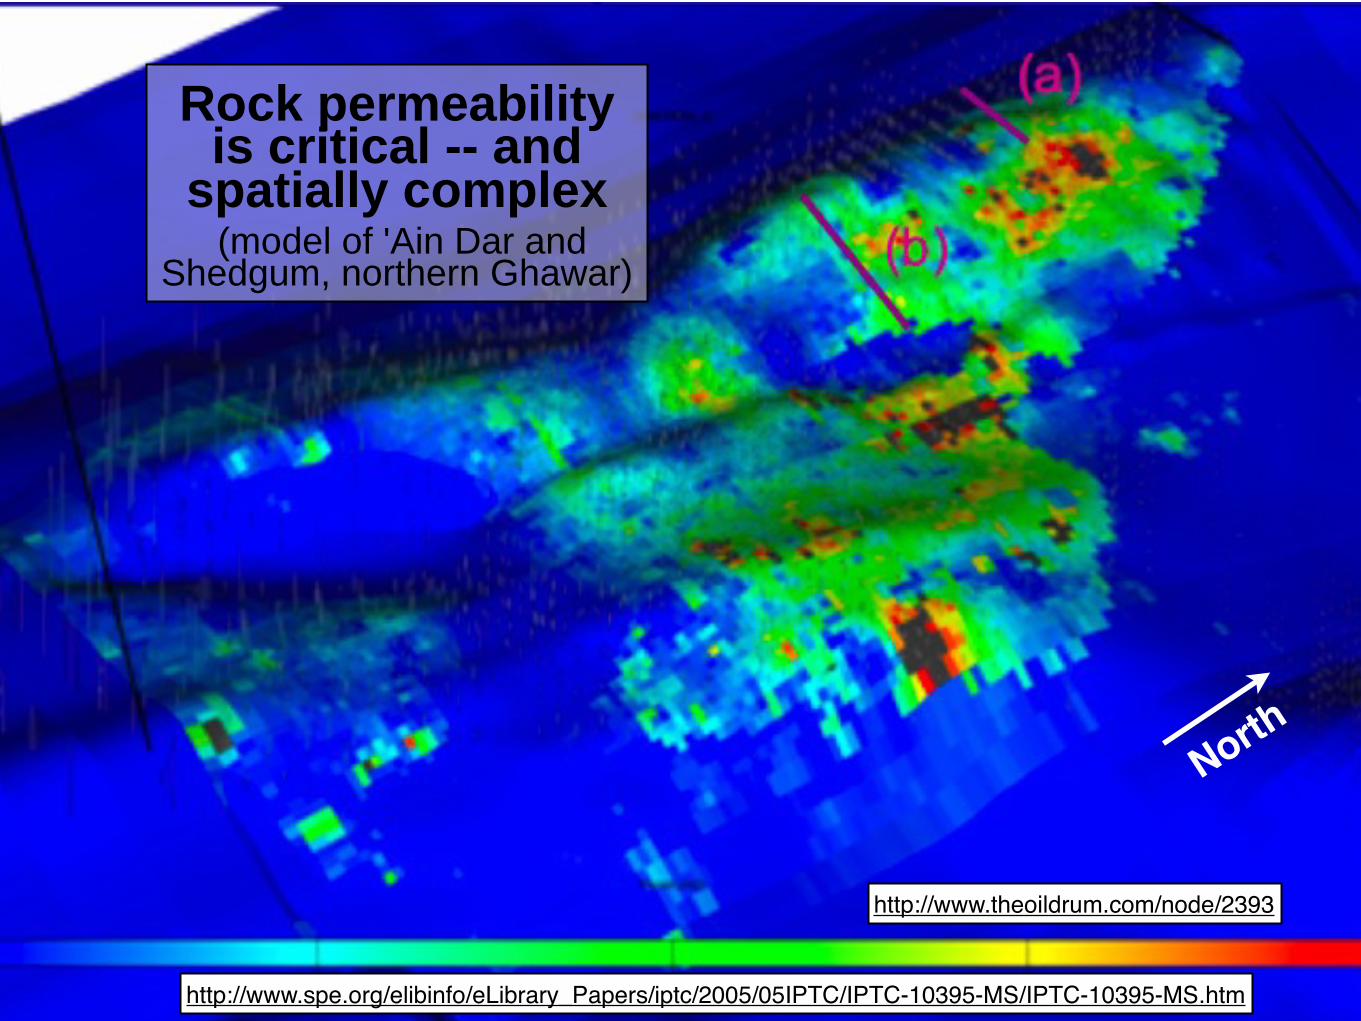
http://www.theoildrum.com/node/2393
http://www.spe.org/elibinfo/eLibrary_Papers/iptc/2005/05IPTC/IPTC-10395-MS/IPTC-10395-MS.htm
Rock permeability is critical -- and
spatially complex (model of 'Ain Dar and
Shedgum, northern Ghawar)
North
Natural Gas Liquids (NGL's)
• Don't confuse these with "liquified natural gas" (LNG), which is cooled, compressed methane
• "Natural gas liquids" (NGL's) are short chain hydrocarbons (e.g., pentane) extracted from deep, hot (e.g., 180 deg C) natural gas wells with (N.B.: 75% energy density of crude)
• NGL's are gases in situ but some condense to liquids when brought to the surface and cooled
• NGL's and "condensates" are divided into immediately separated "lease condensates" (e.g., pentane) and later stage "natural gas plant liquids" (e.g., propane, butane)
• 75% of US 'oil' production is now "natural gas liquids"!
• finally, "all liquids" adds together crude oil, NGL's, and "other liquids" (mainly ethanol, a little biodiesel)
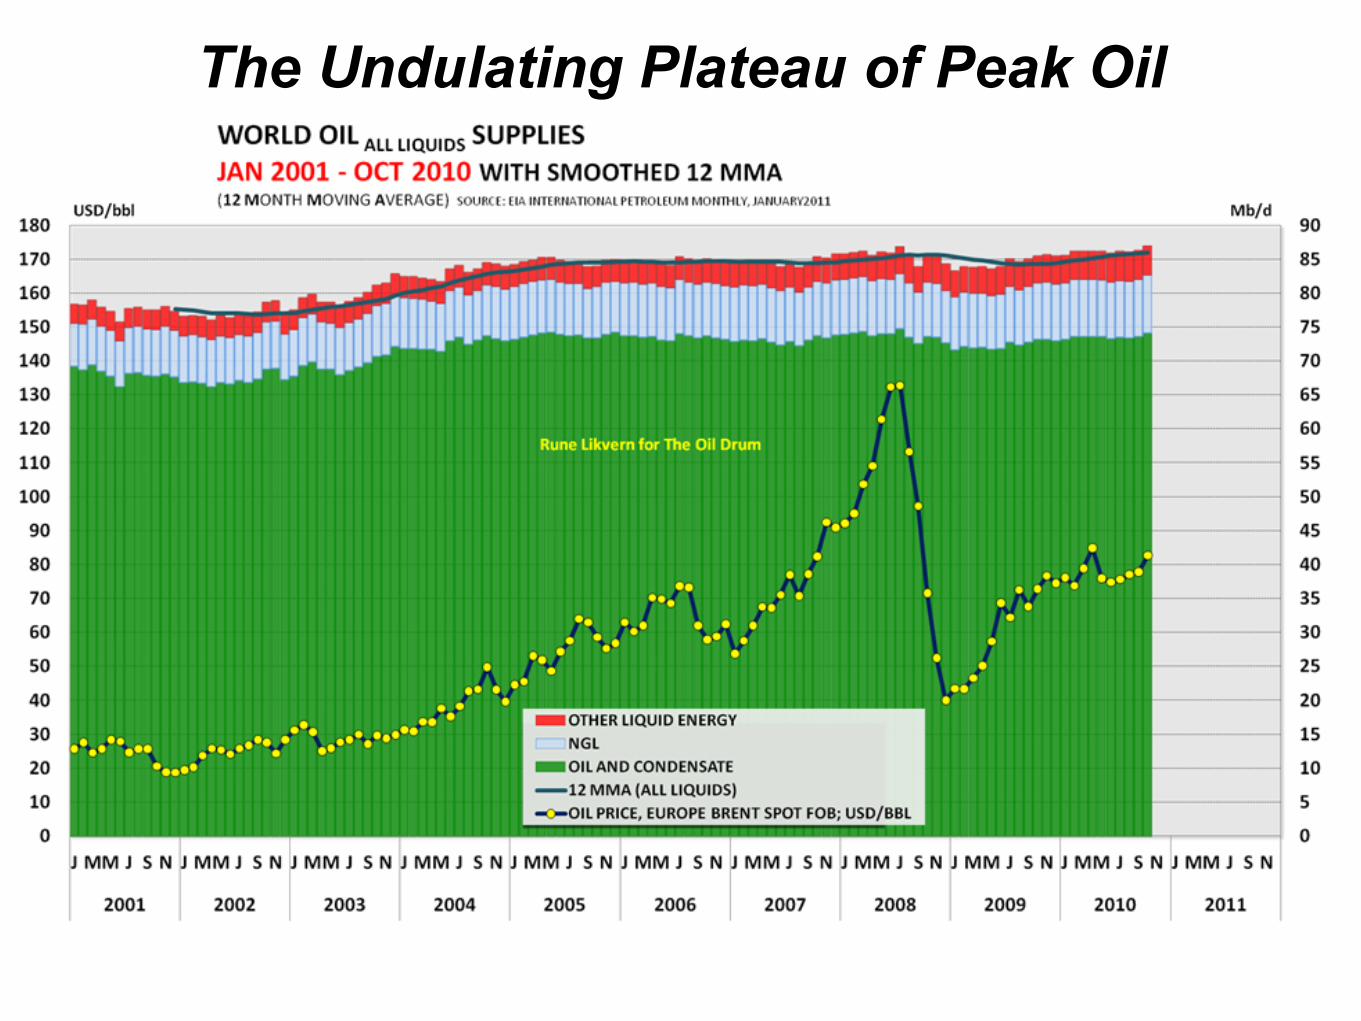
The Undulating Plateau of Peak Oil
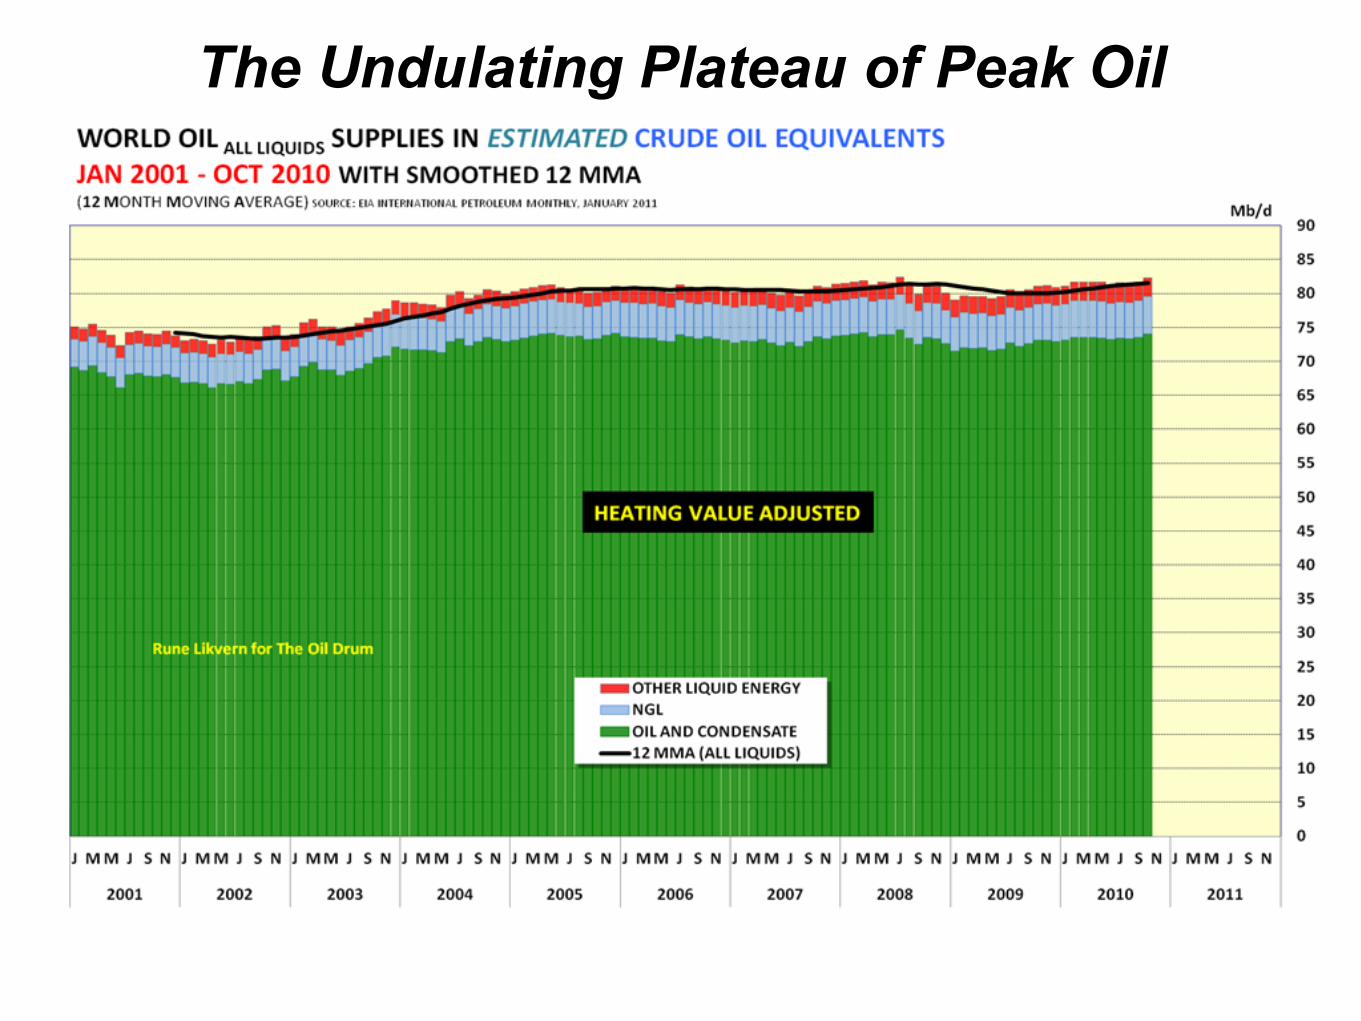
The Undulating Plateau of Peak Oil
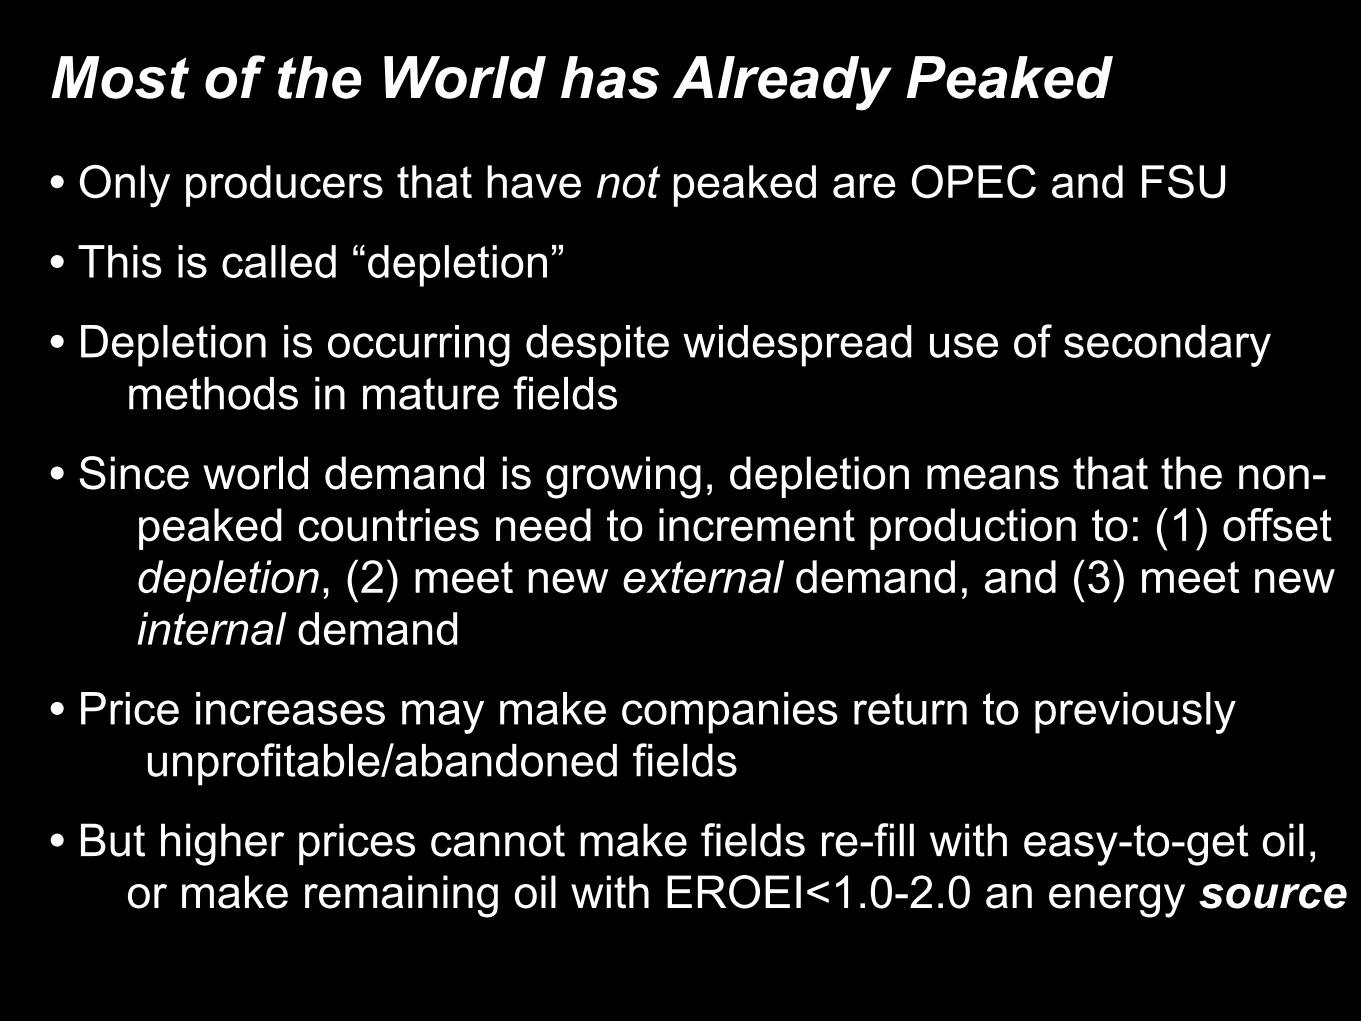
Most of the World has Already Peaked
• Only producers that have not peaked are OPEC and FSU
• This is called “depletion”
• Depletion is occurring despite widespread use of secondary methods in mature fields
• Since world demand is growing, depletion means that the non-peaked countries need to increment production to: (1) offset depletion, (2) meet new external demand, and (3) meet new internal demand
• Price increases may make companies return to previously unprofitable/abandoned fields
• But higher prices cannot make fields re-fill with easy-to-get oil, or make remaining oil with EROEI<1.0-2.0 an energy source
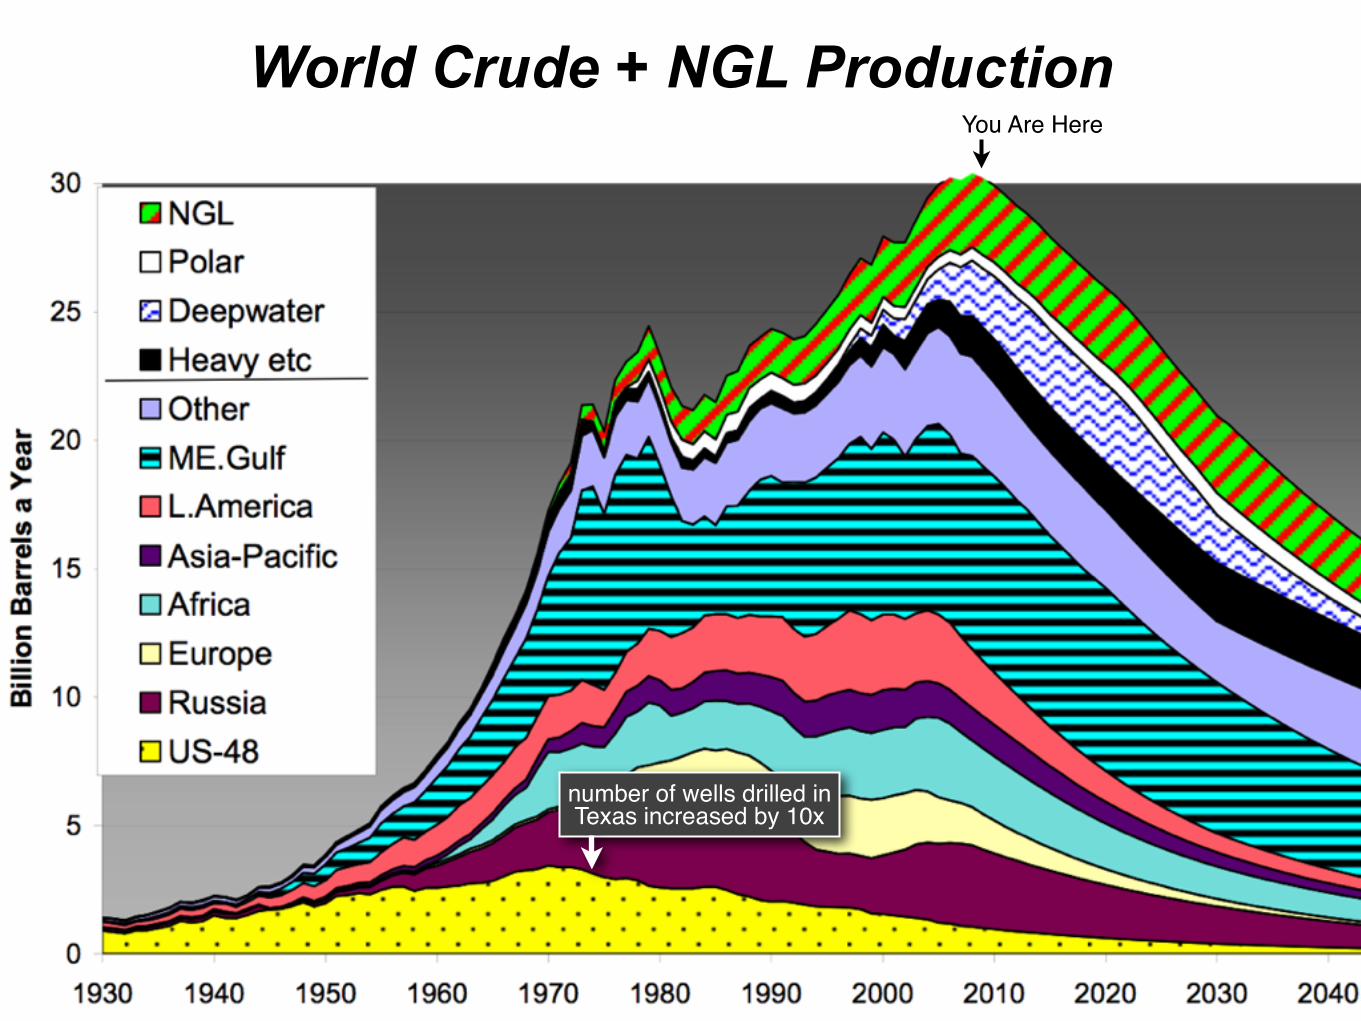
World Crude + NGL ProductionYou Are Here
number of wells drilled in Texas increased by 10x
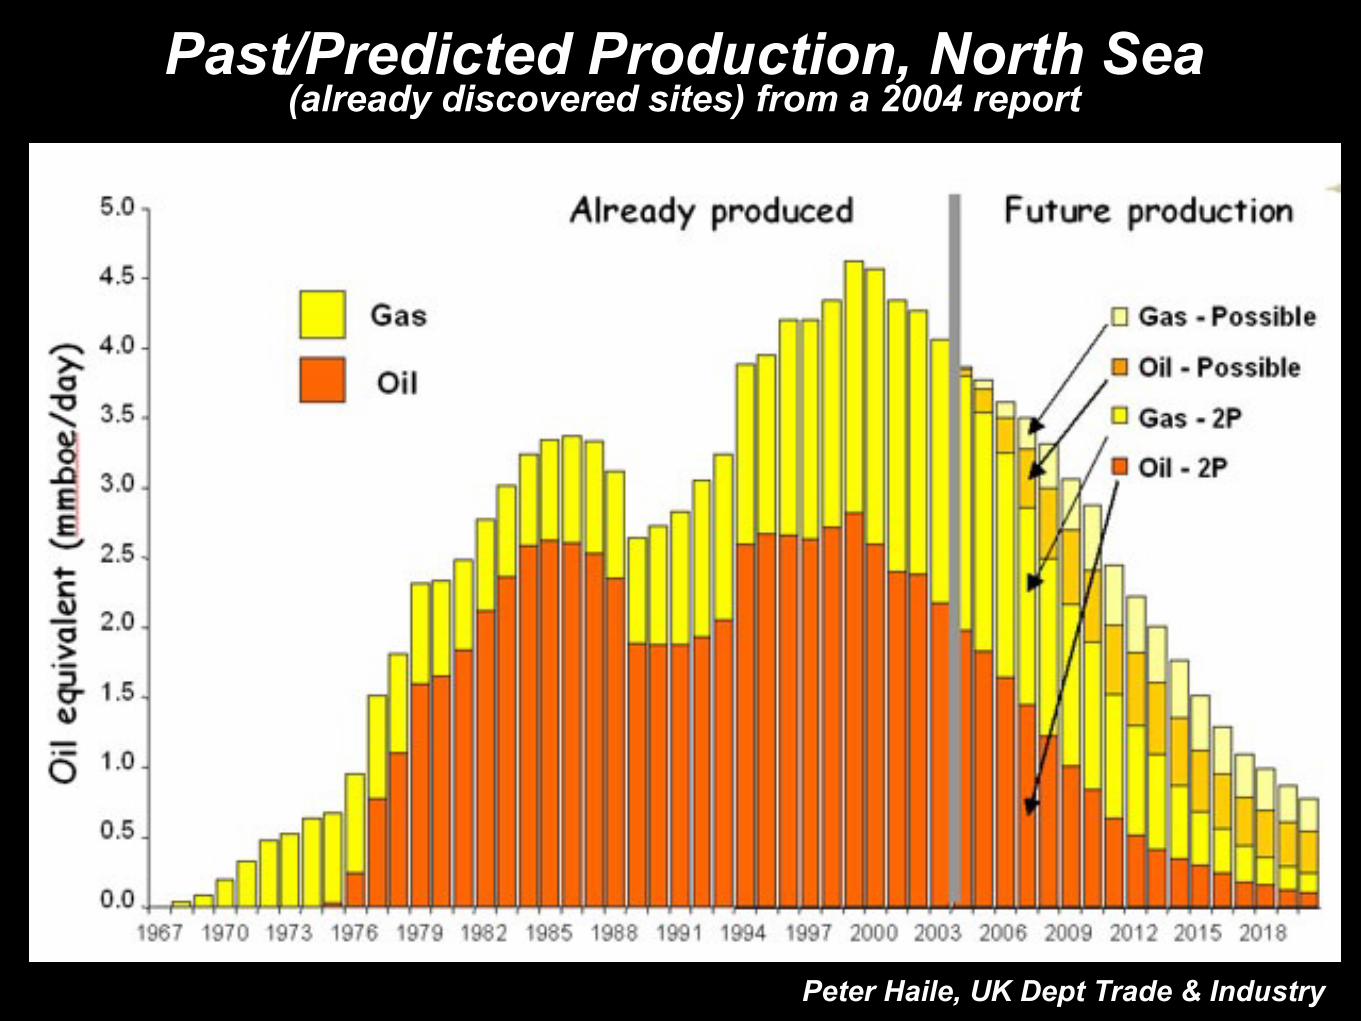
Past/Predicted Production, North Sea(already discovered sites) from a 2004 report
Peter Haile, UK Dept Trade & Industry
1960 1970 1980 1990 2000 2010
−3−2
−10
12
3
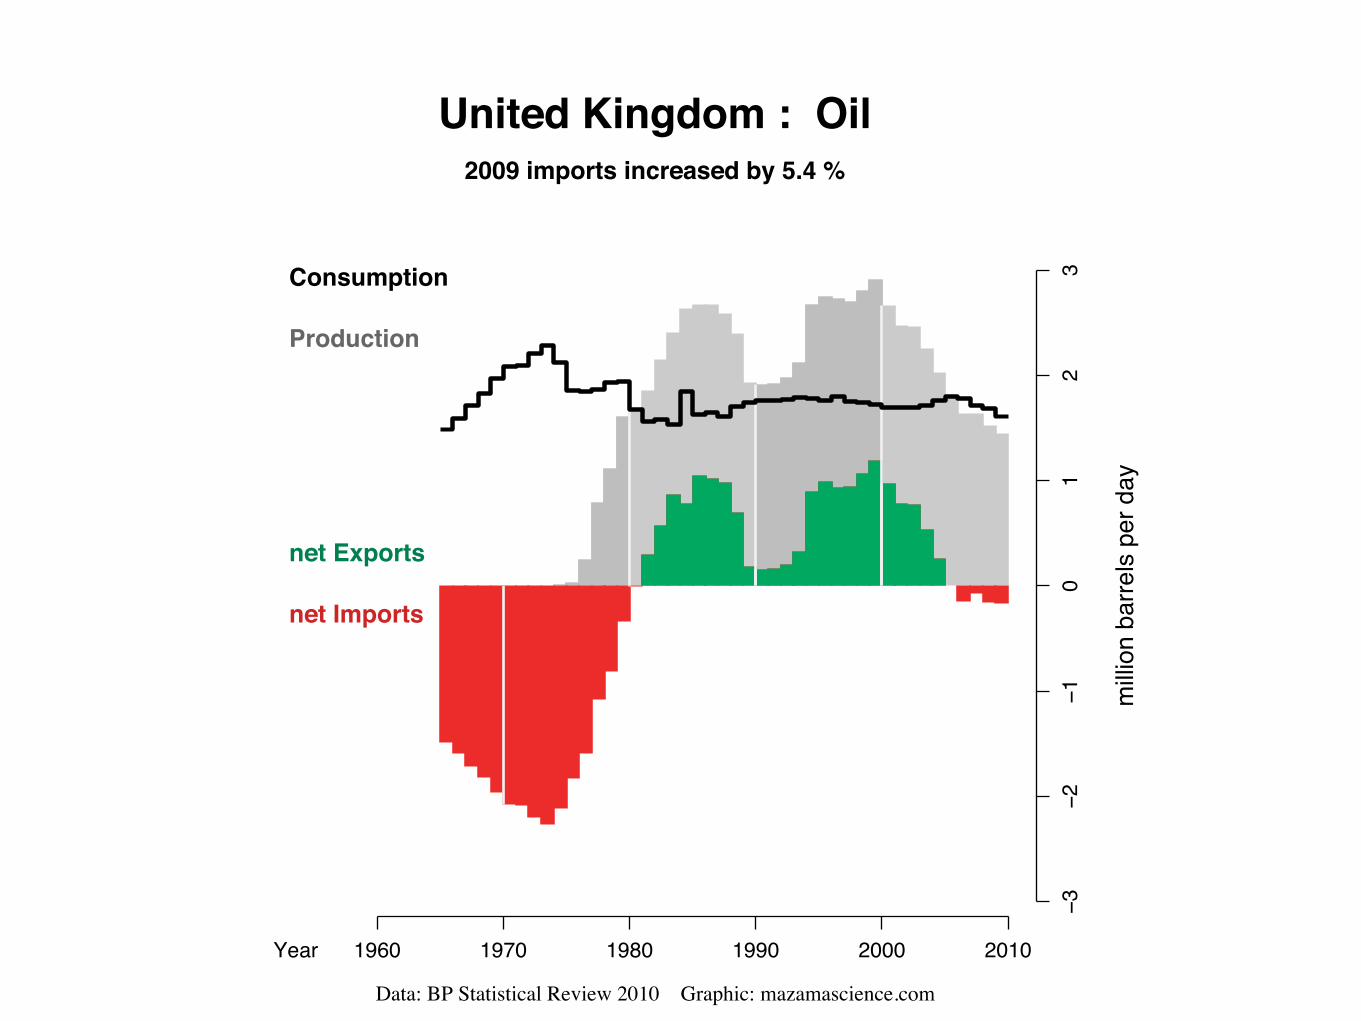
United Kingdom : Oil2009 imports increased by 5.4 %
Data: BP Statistical Review 2010 Graphic: mazamascience.com
Year
milli
on b
arre
ls pe
r day
Consumption
Production
net Exports
net Imports
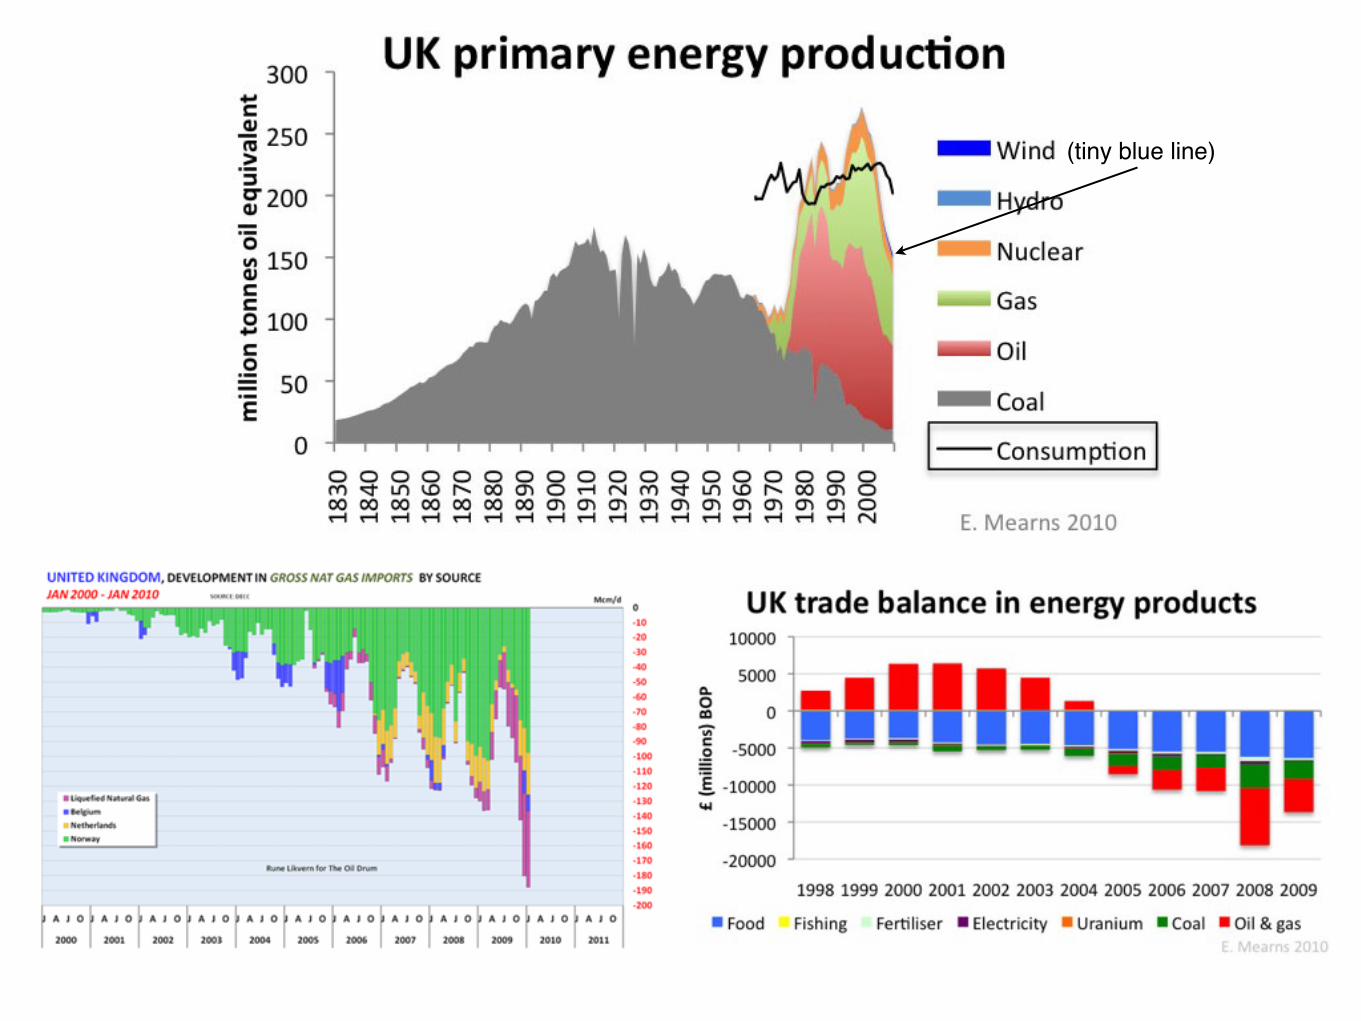
(tiny blue line)
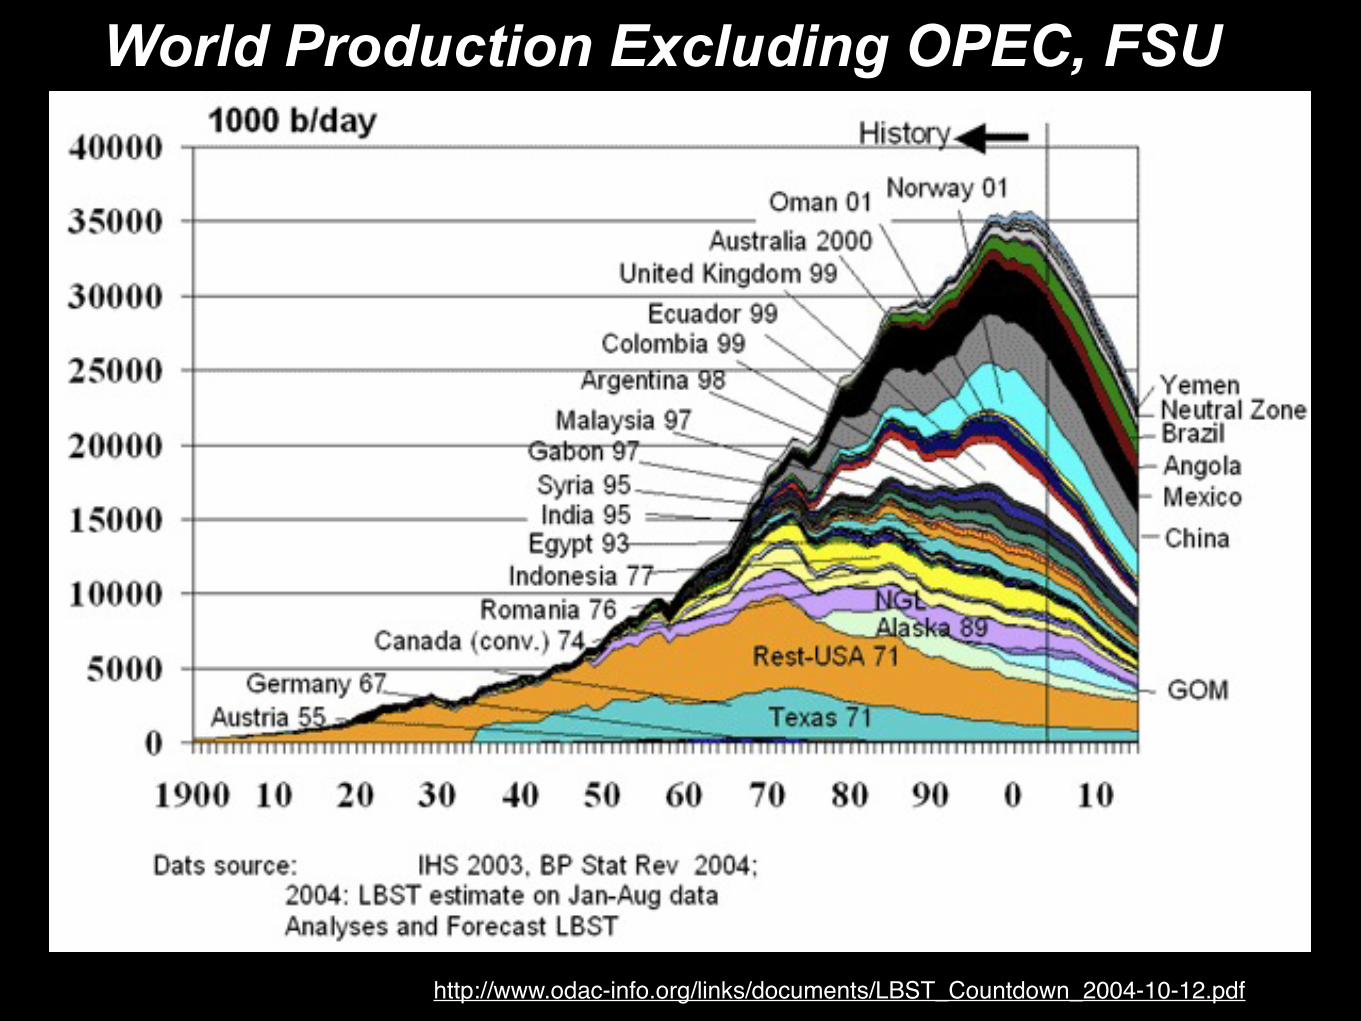
World Production Excluding OPEC, FSU
http://www.odac-info.org/links/documents/LBST_Countdown_2004-10-12.pdf
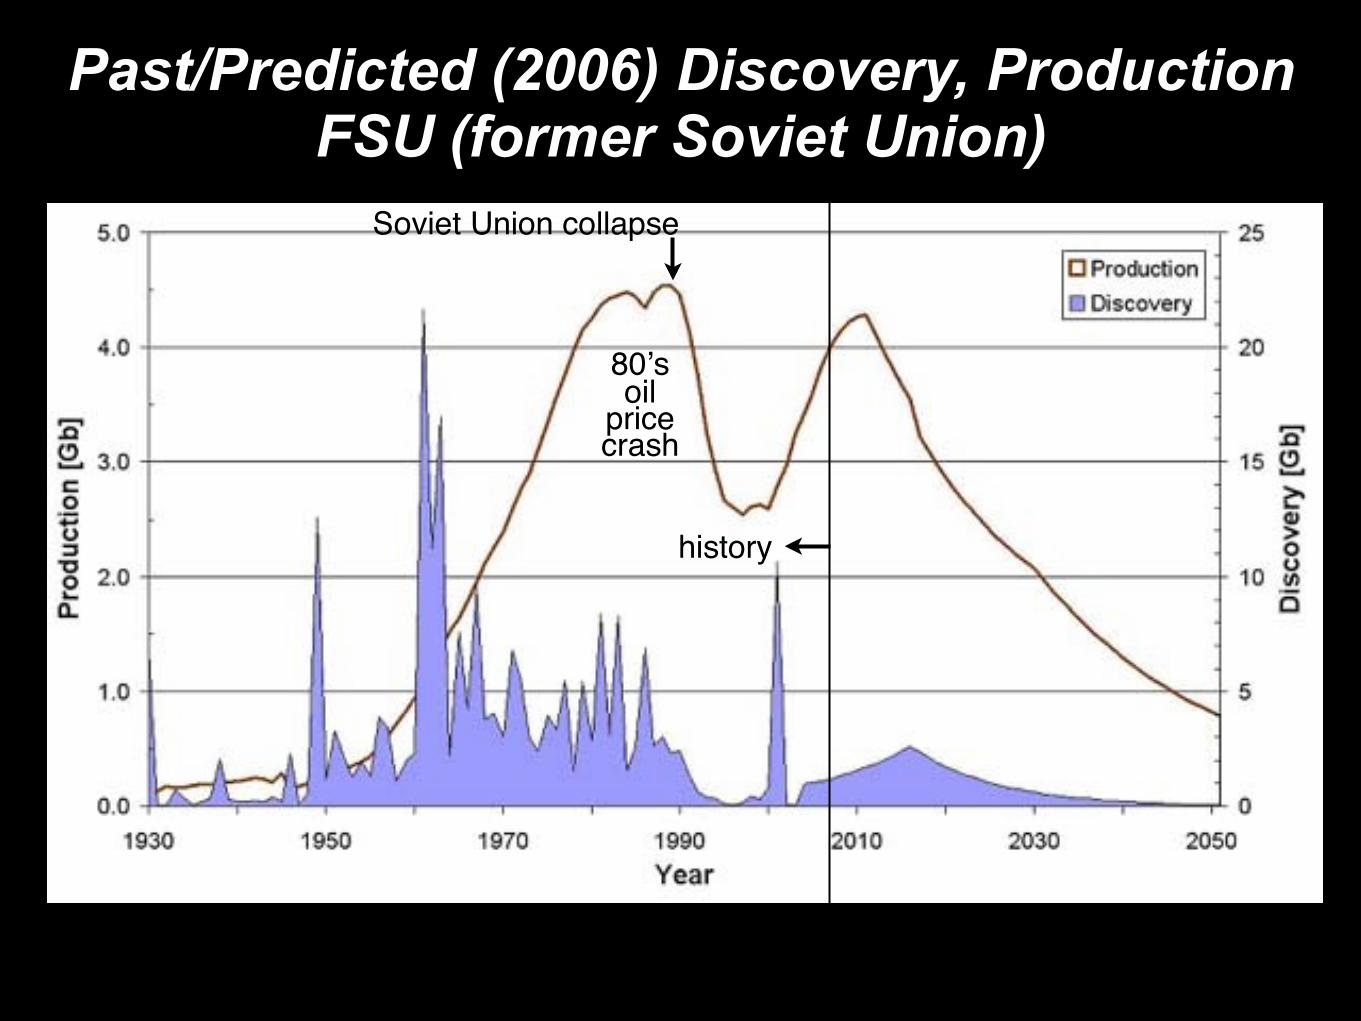
Past/Predicted (2006) Discovery, ProductionFSU (former Soviet Union)
history
Soviet Union collapse
80’soil
pricecrash
1960 1970 1980 1990 2000 2010
−1.5
−1.0
−0.5
0.0
0.5
1.0
1.5
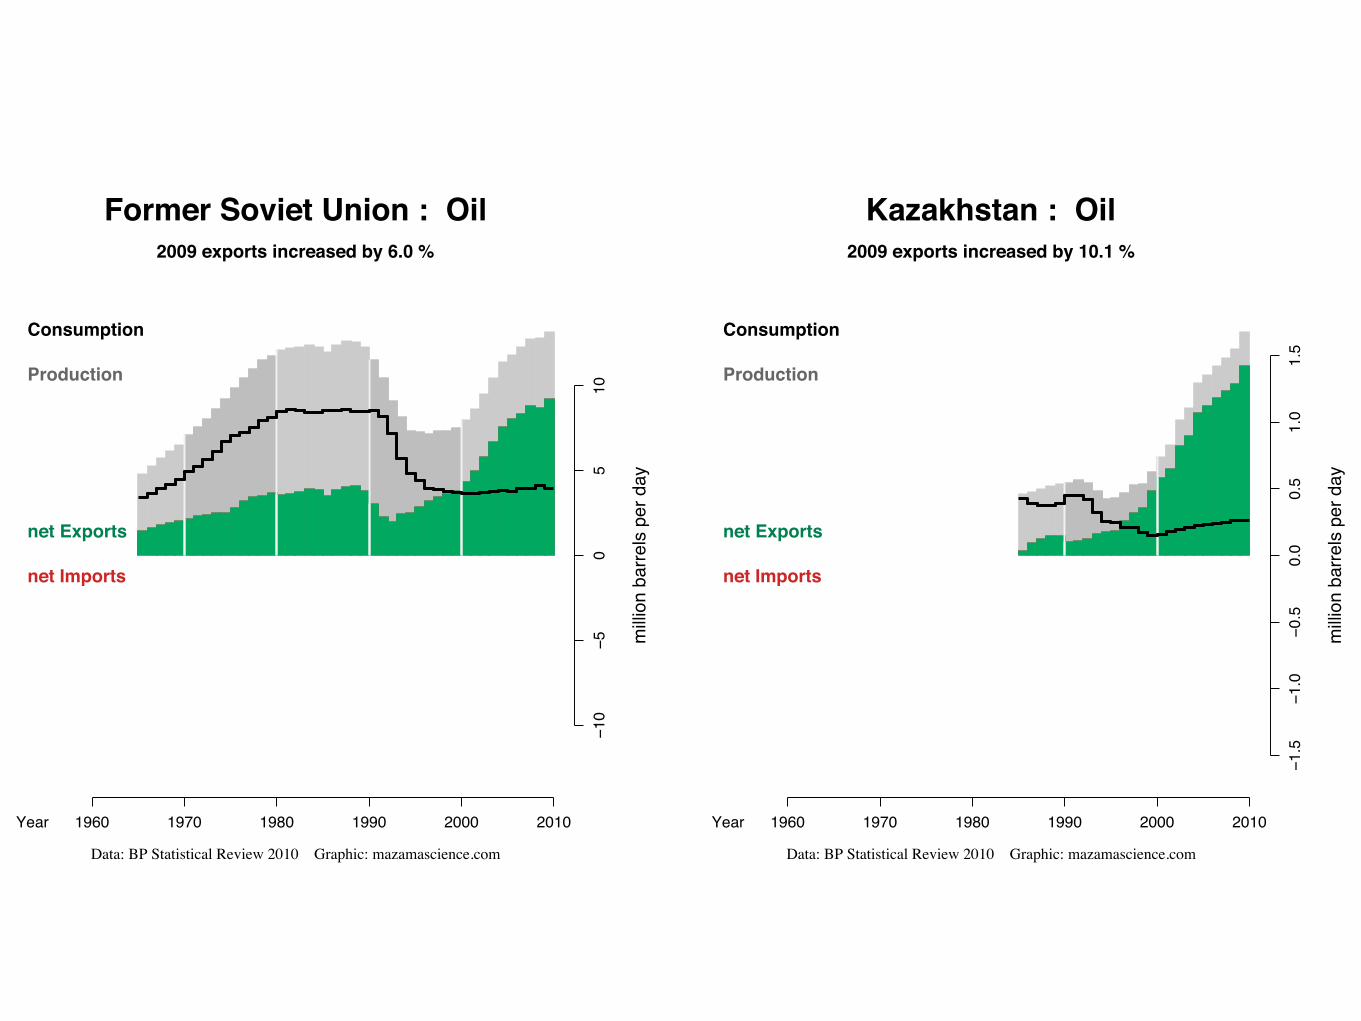
Kazakhstan : Oil2009 exports increased by 10.1 %
Data: BP Statistical Review 2010 Graphic: mazamascience.com
Year
milli
on b
arre
ls pe
r day
Consumption
Production
net Exports
net Imports
1960 1970 1980 1990 2000 2010
−10
−50
510
Former Soviet Union : Oil2009 exports increased by 6.0 %
Data: BP Statistical Review 2010 Graphic: mazamascience.com
Year
milli
on b
arre
ls pe
r day
Consumption
Production
net Exports
net Imports
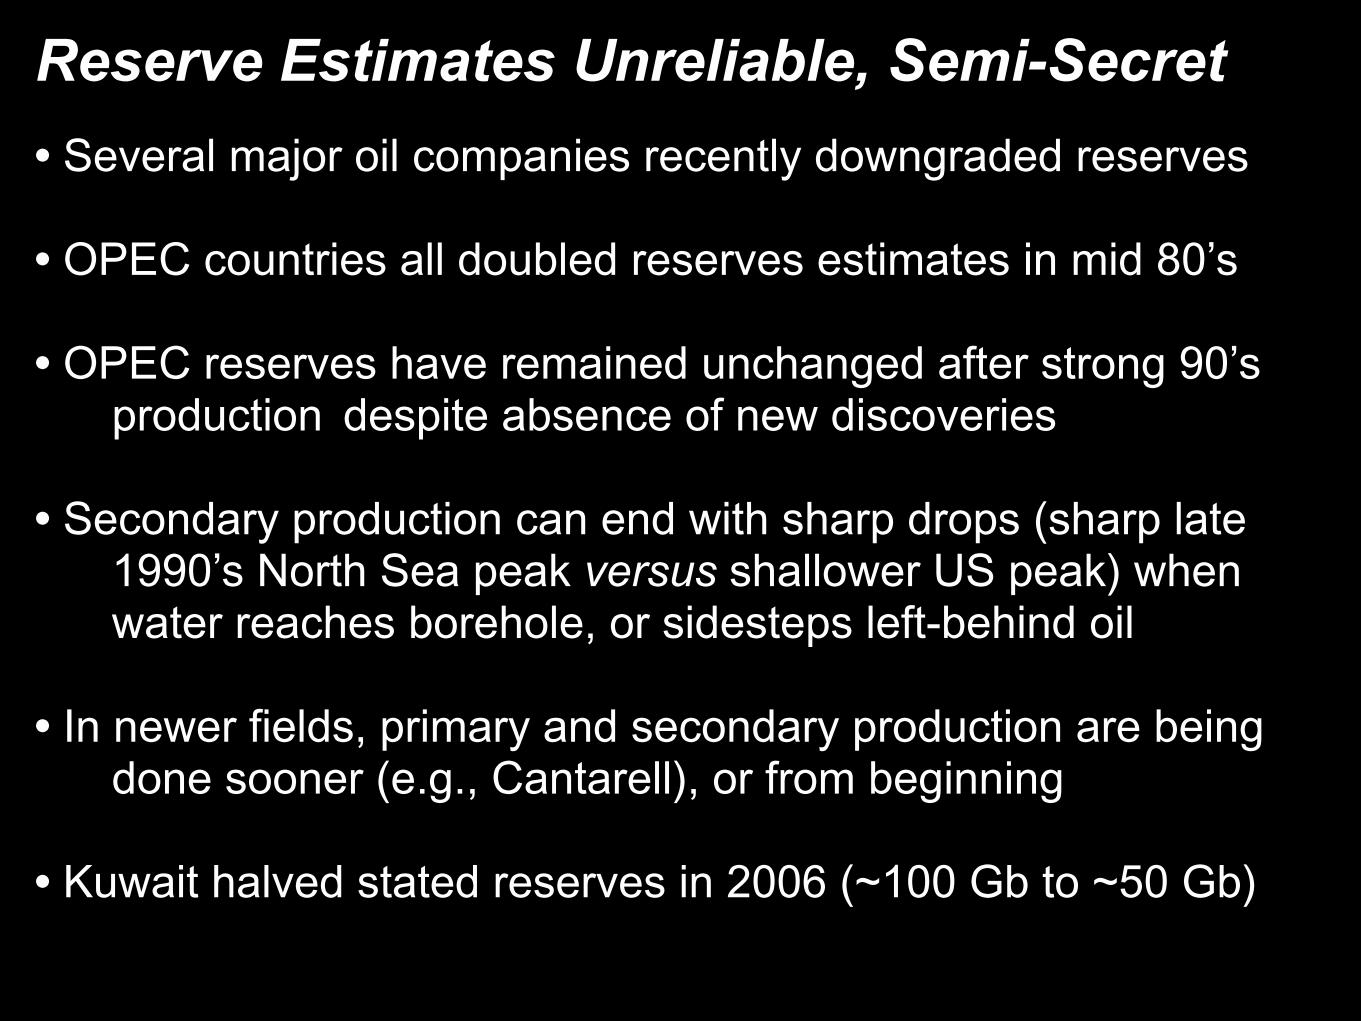
Reserve Estimates Unreliable, Semi-Secret
• Several major oil companies recently downgraded reserves
• OPEC countries all doubled reserves estimates in mid 80’s
• OPEC reserves have remained unchanged after strong 90’s production despite absence of new discoveries
• Secondary production can end with sharp drops (sharp late 1990’s North Sea peak versus shallower US peak) when water reaches borehole, or sidesteps left-behind oil
• In newer fields, primary and secondary production are being done sooner (e.g., Cantarell), or from beginning
• Kuwait halved stated reserves in 2006 (~100 Gb to ~50 Gb)
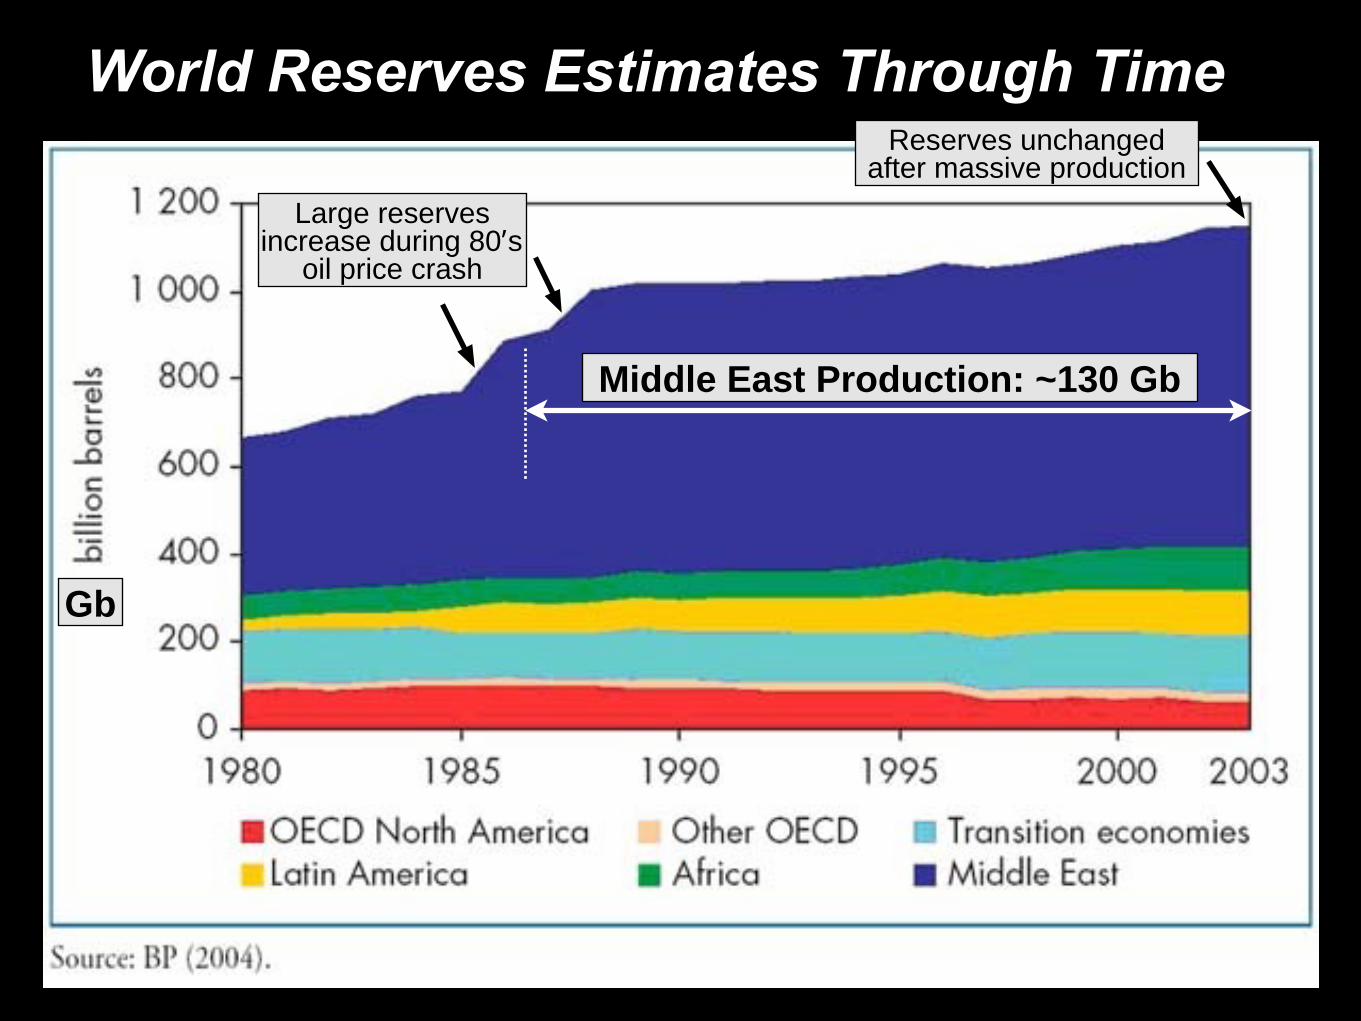
World Reserves Estimates Through Time
Middle East Production: ~130 Gb
Large reserves increase during 80’s
oil price crash
Reserves unchanged after massive production
Gb
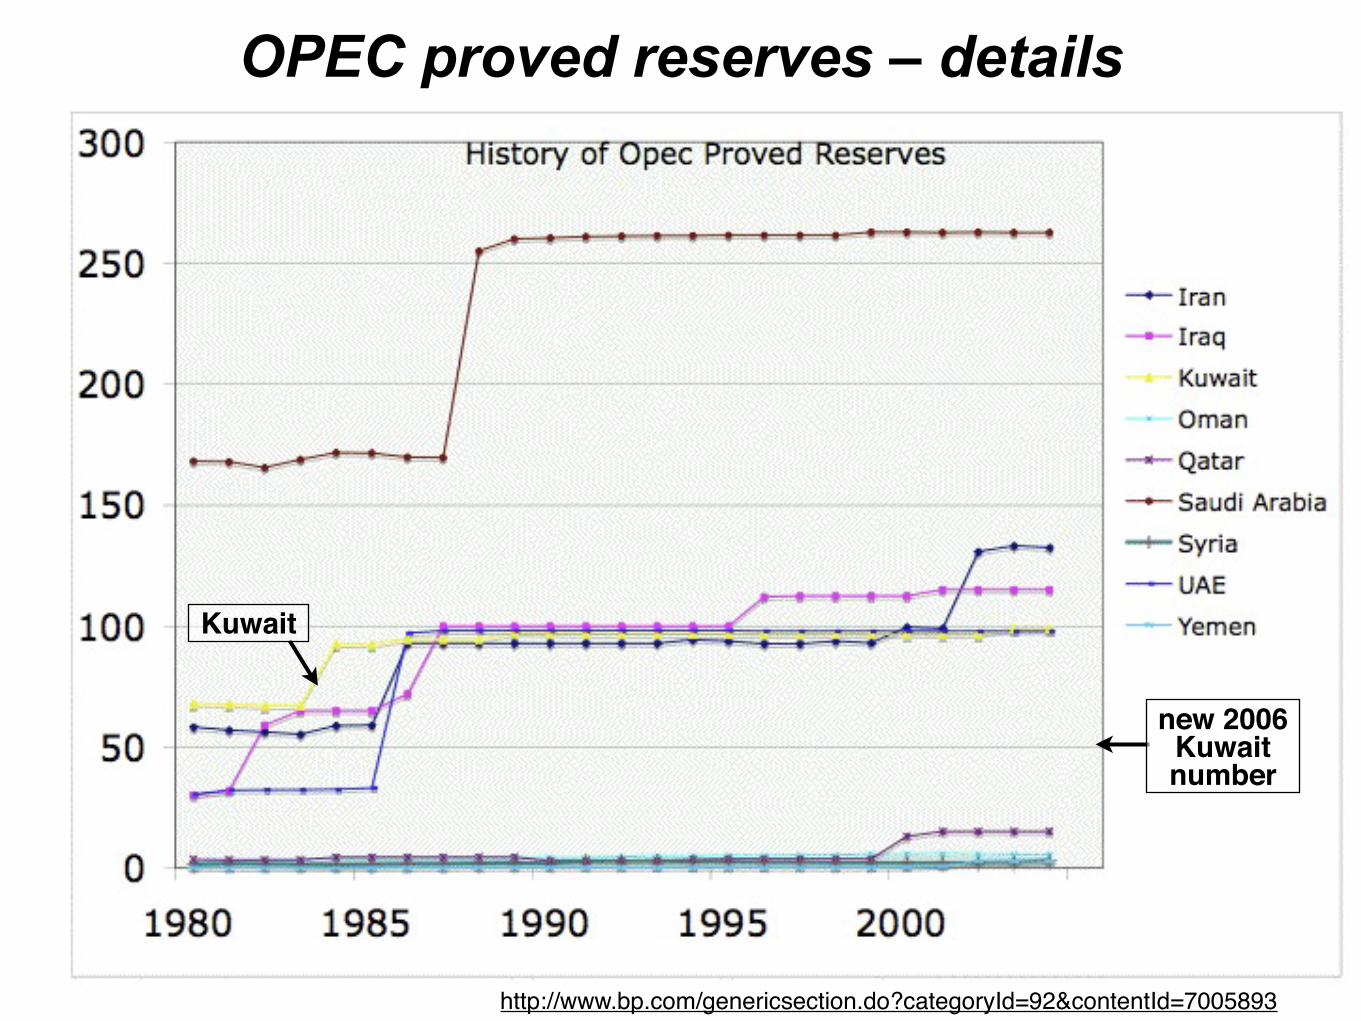
OPEC proved reserves – details
http://www.bp.com/genericsection.do?categoryId=92&contentId=7005893
new 2006 Kuwait number
Kuwait
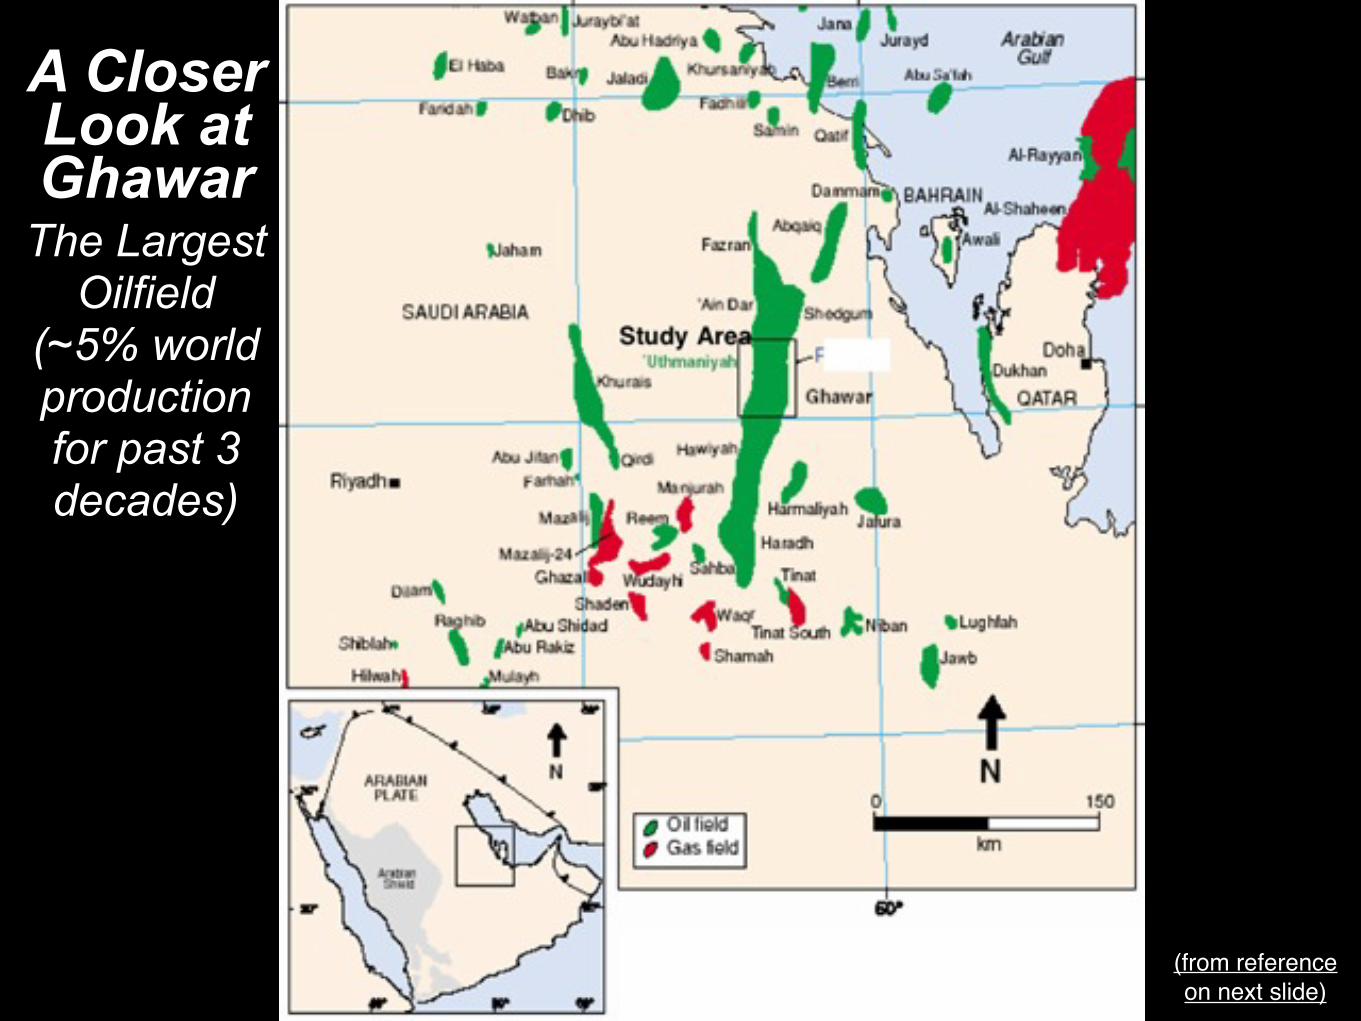
A Closer Look at Ghawar
The Largest Oilfield
(~5% world production for past 3 decades)
(from reference on next slide)
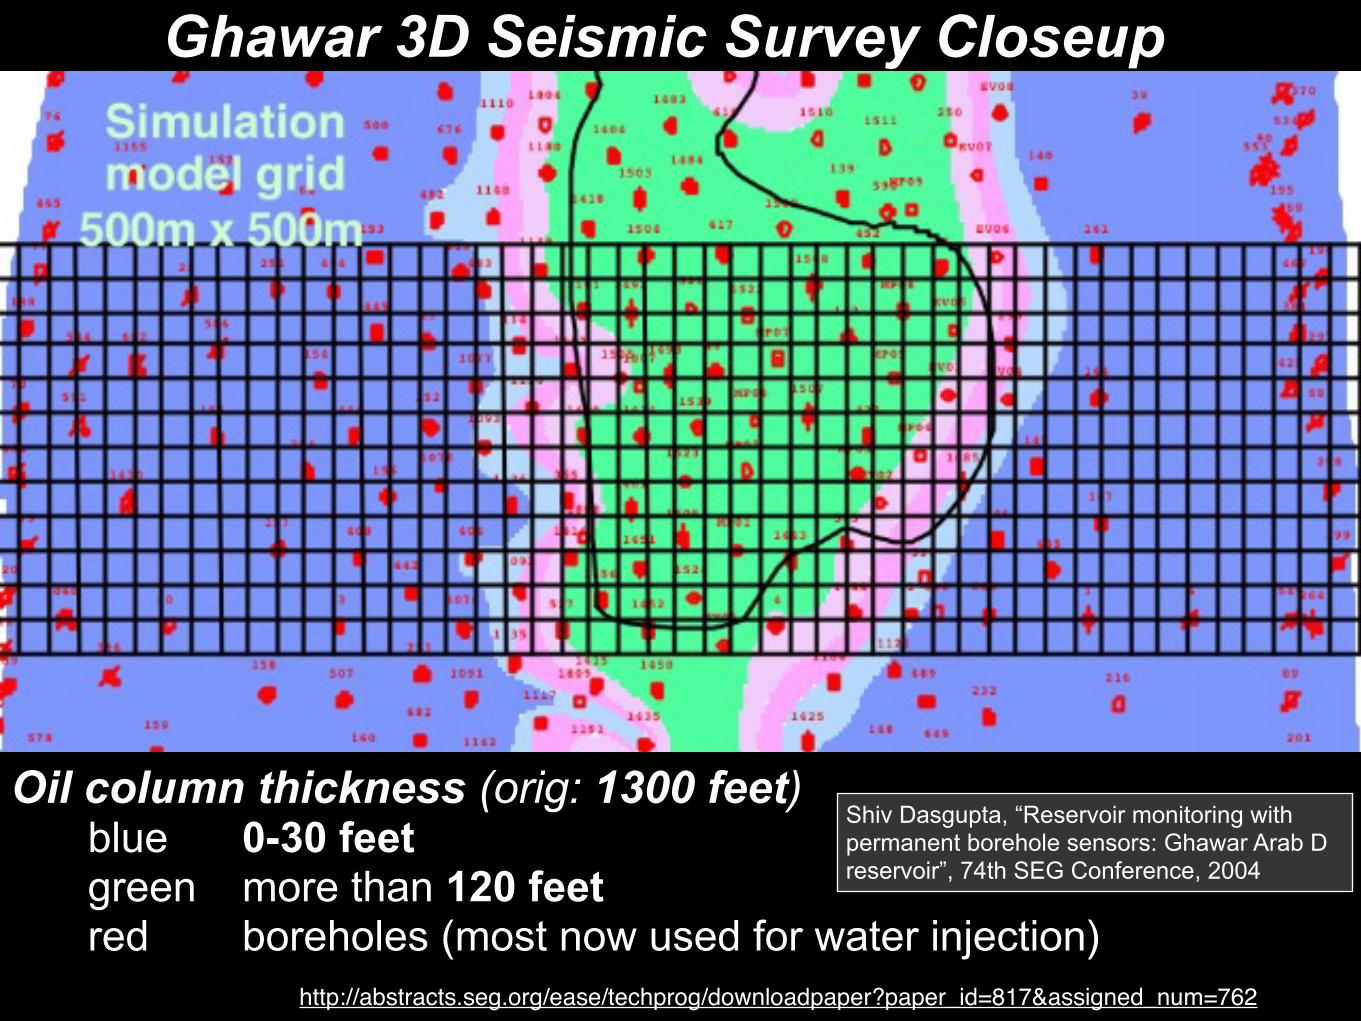
Oil column thickness (orig: 1300 feet) blue 0-30 feet green more than 120 feet red boreholes (most now used for water injection)
Ghawar 3D Seismic Survey Closeup
Shiv Dasgupta, “Reservoir monitoring with permanent borehole sensors: Ghawar Arab D reservoir”, 74th SEG Conference, 2004
http://abstracts.seg.org/ease/techprog/downloadpaper?paper_id=817&assigned_num=762
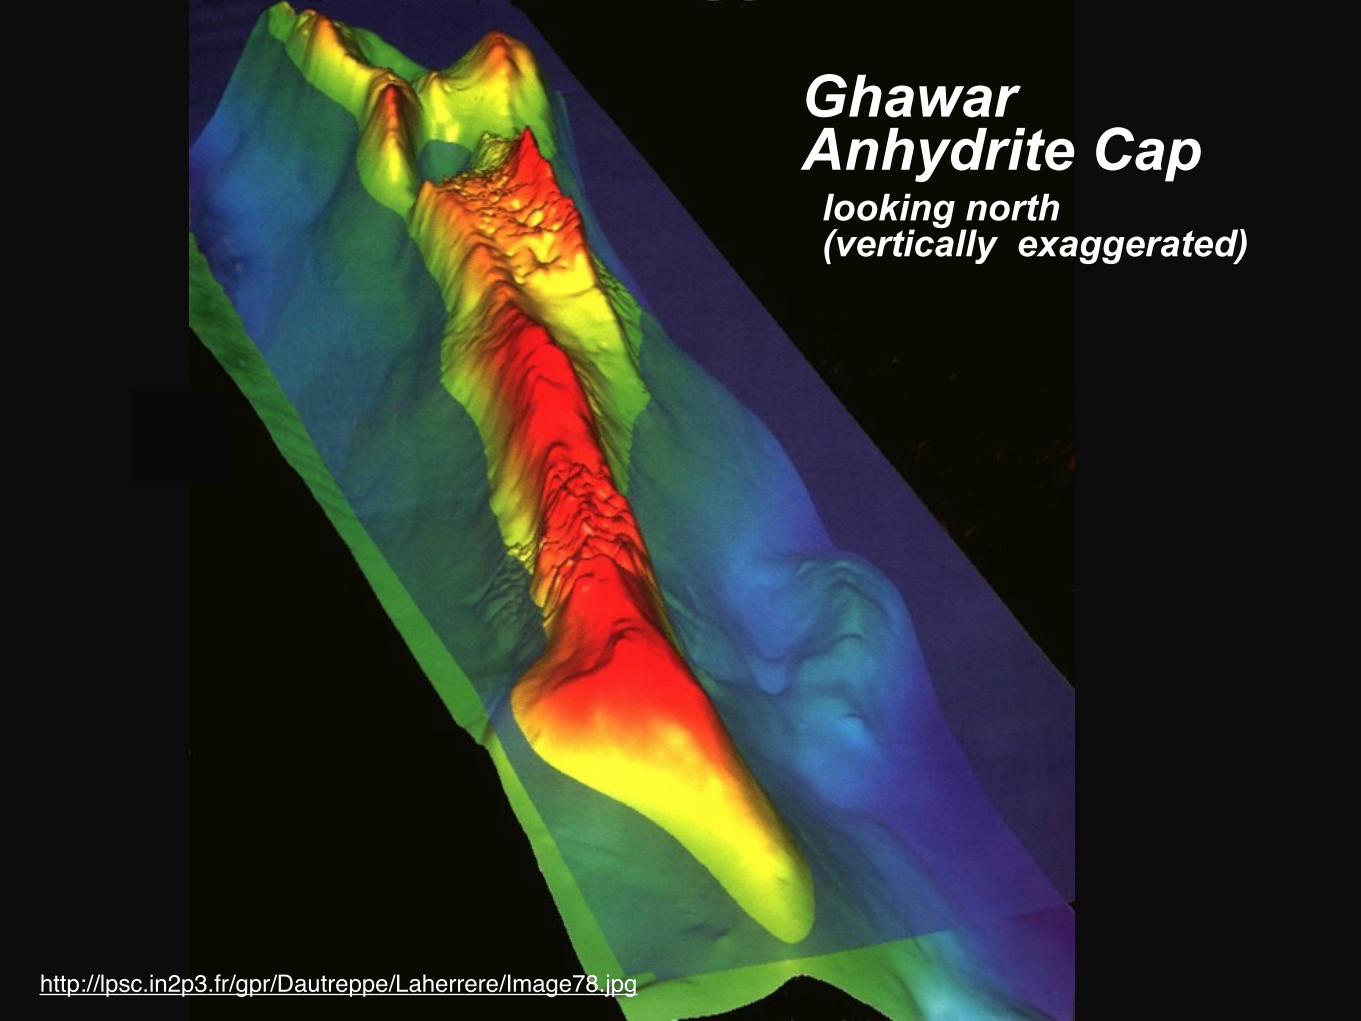
Ghawar Anhydrite Cap looking north (vertically exaggerated)
http://lpsc.in2p3.fr/gpr/Dautreppe/Laherrere/Image78.jpg
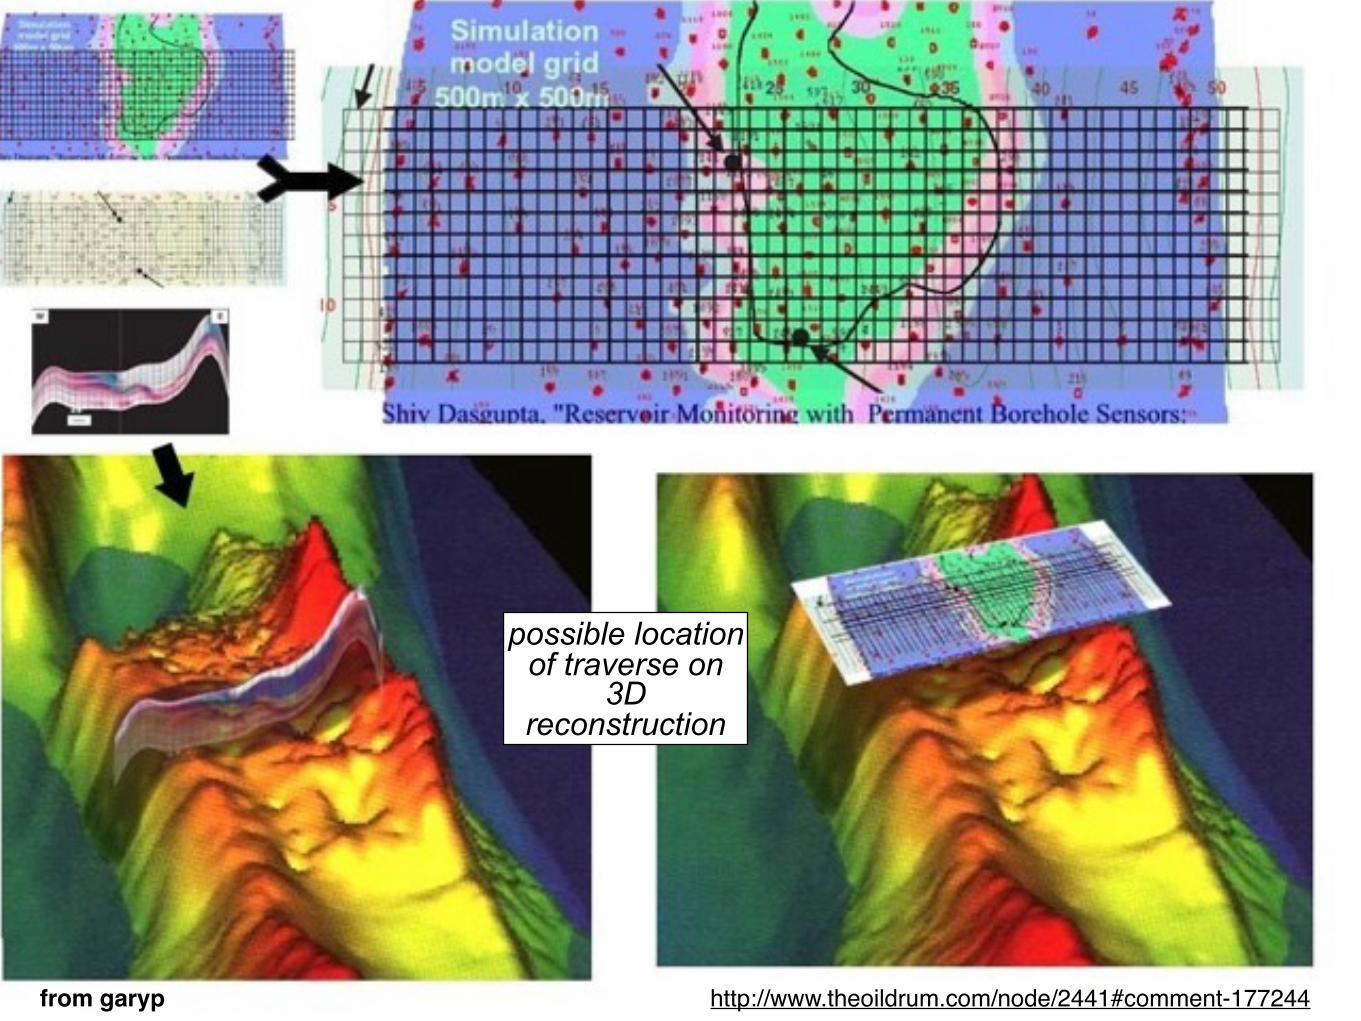
http://www.theoildrum.com/node/2441#comment-177244from garyp
possible location of traverse on
3D reconstruction
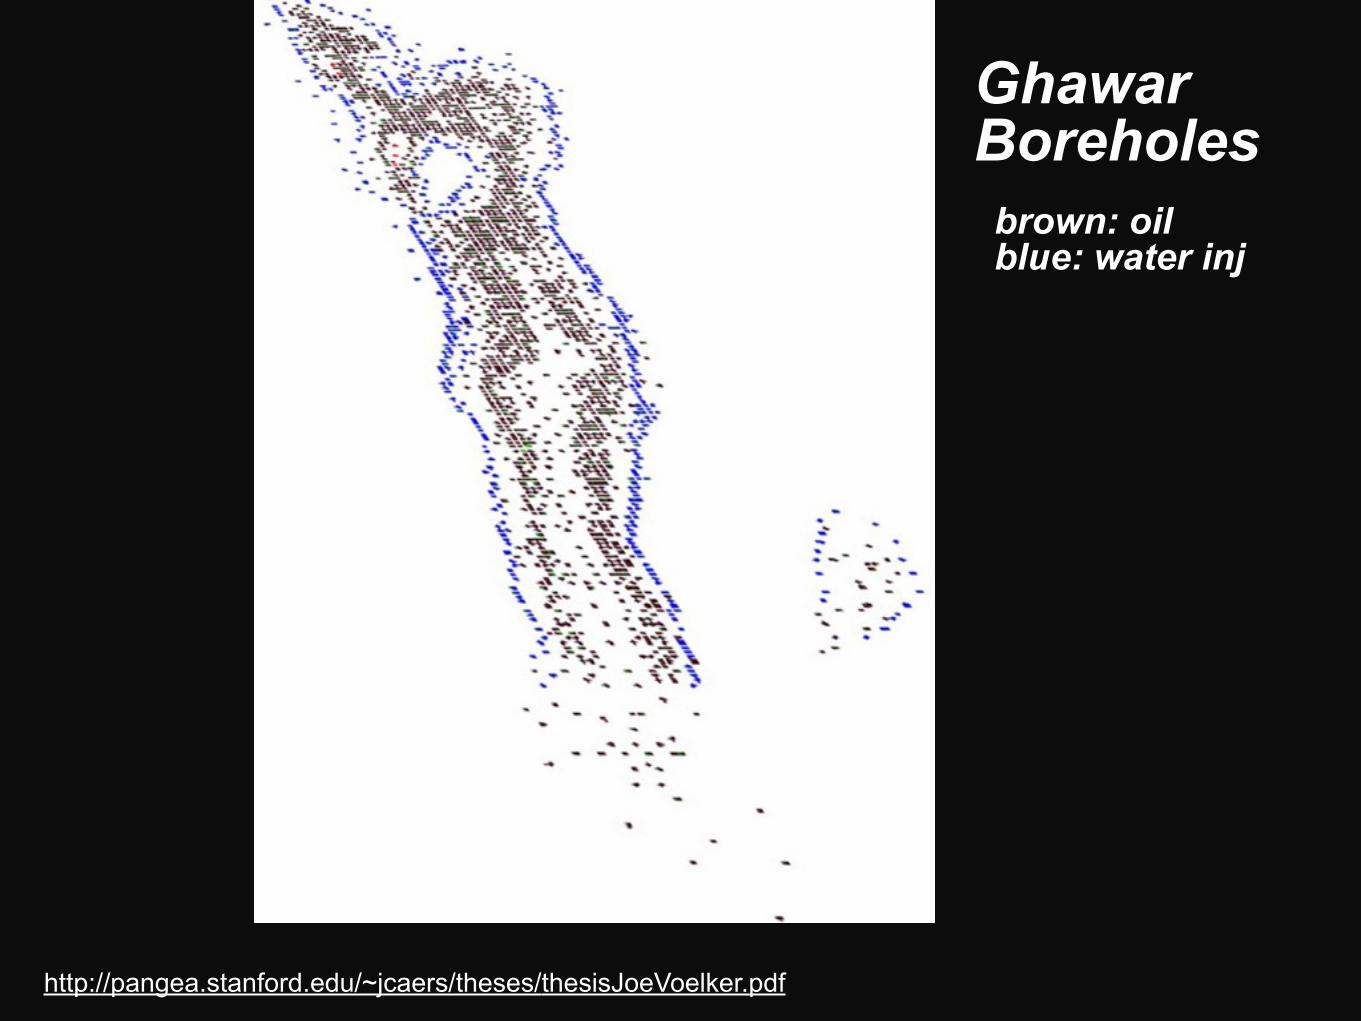
GhawarBoreholes brown: oil blue: water inj
http://pangea.stanford.edu/~jcaers/theses/thesisJoeVoelker.pdf

(approx. overlay)
http://lpsc.in2p3.fr/gpr/Dautreppe/Laherrere/Image78.jpg
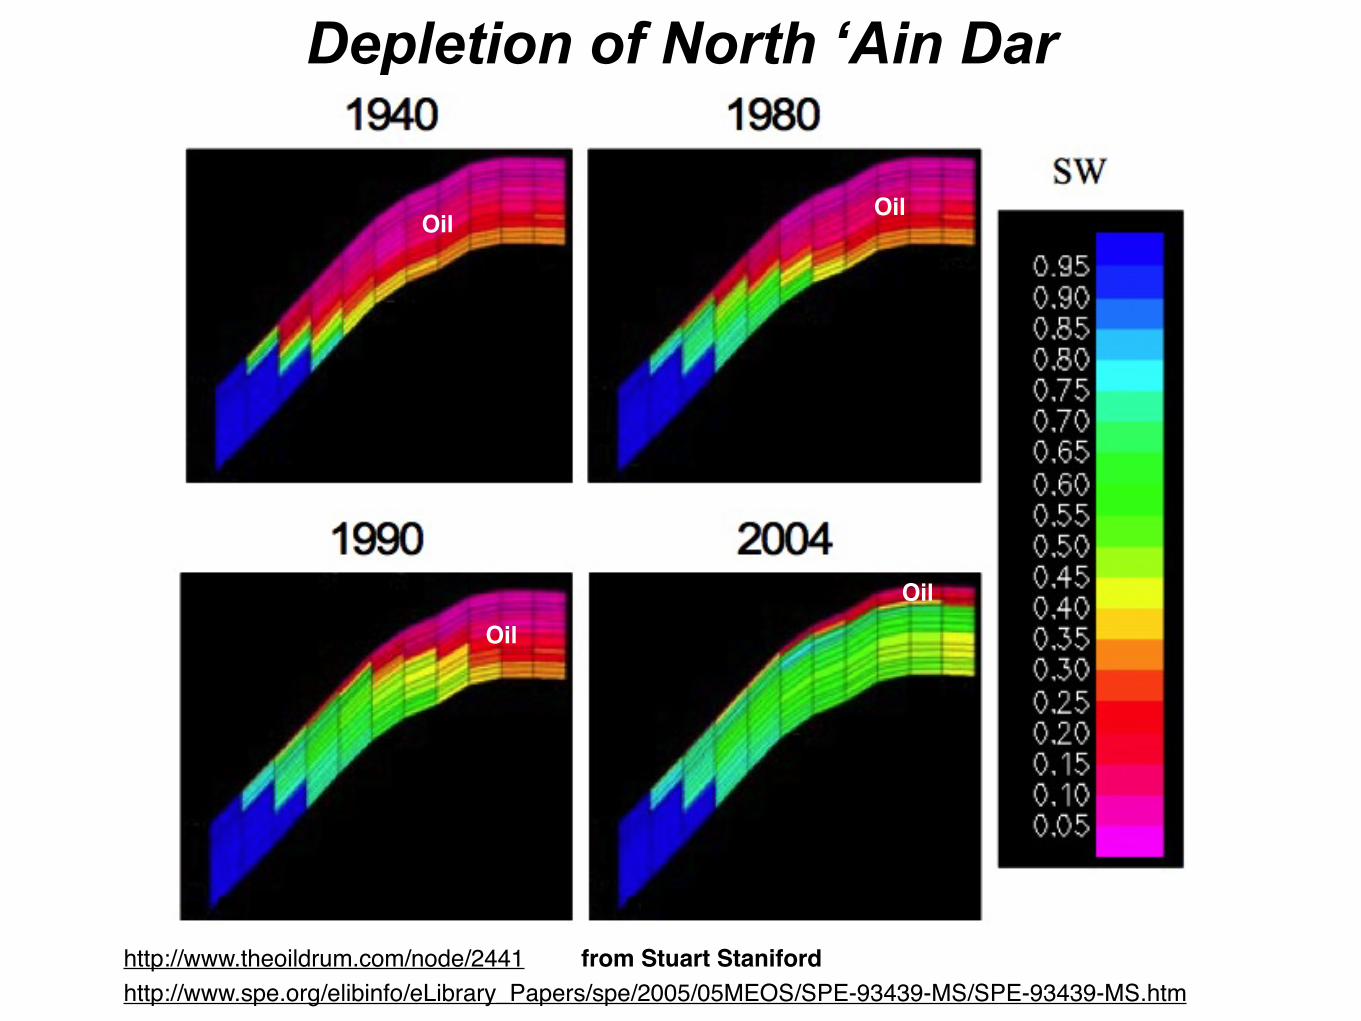
Depletion of North ‘Ain Dar
http://www.spe.org/elibinfo/eLibrary_Papers/spe/2005/05MEOS/SPE-93439-MS/SPE-93439-MS.htm
Oil
Oil Oil
Oil
http://www.theoildrum.com/node/2441 from Stuart Staniford
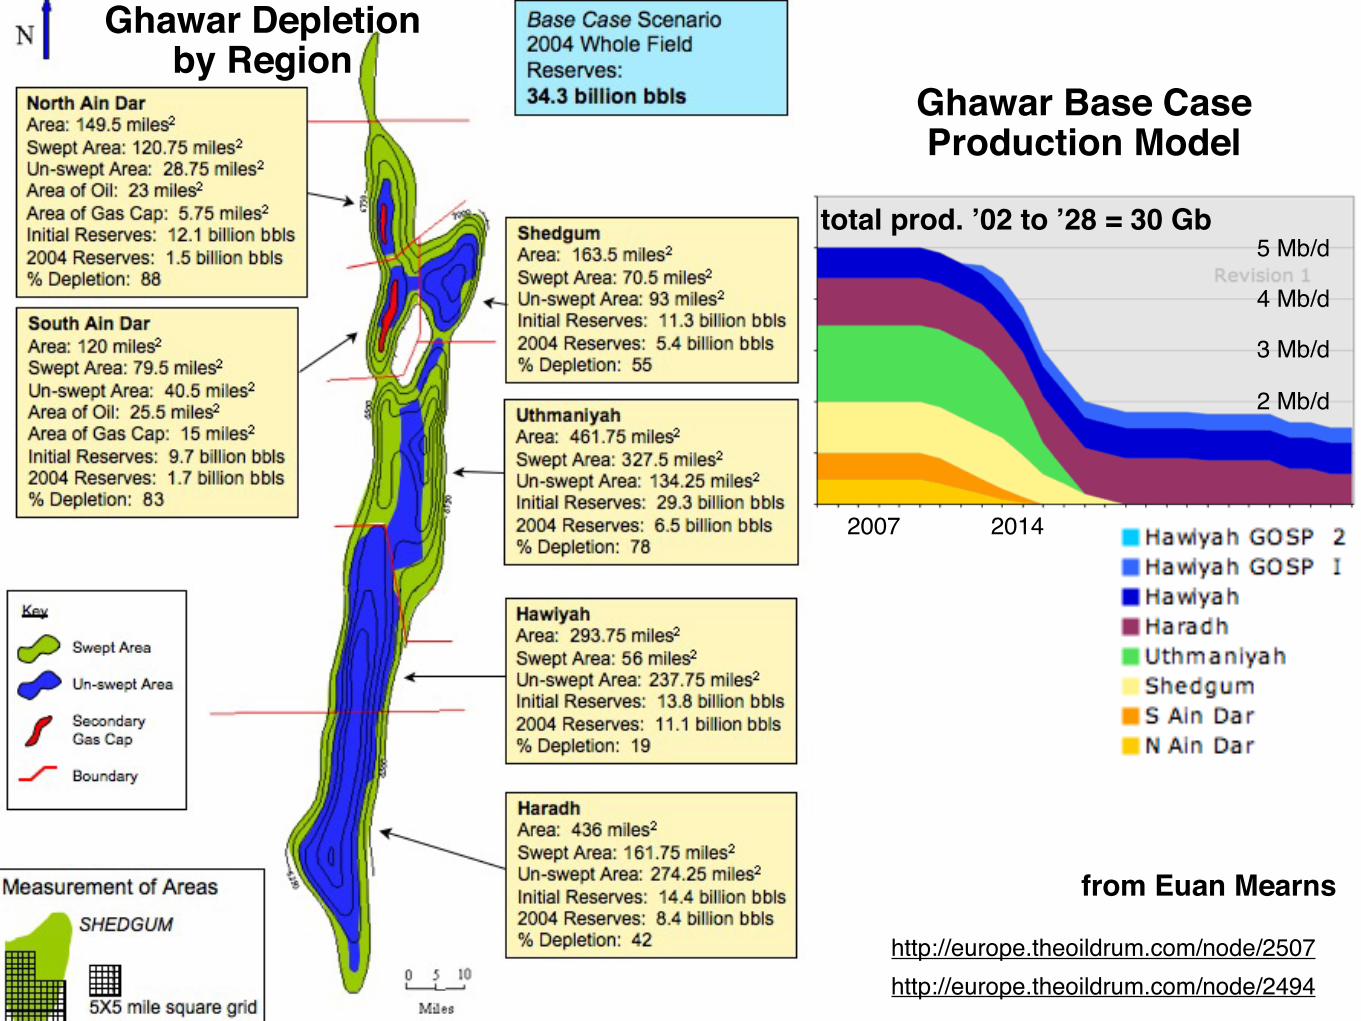
from Euan Mearns
http://europe.theoildrum.com/node/2494
Ghawar Base Case Production Model
5 Mb/d
2007 2014
total prod. ’02 to ’28 = 30 Gb
4 Mb/d
3 Mb/d
2 Mb/d
Ghawar Depletion by Region
http://europe.theoildrum.com/node/2507
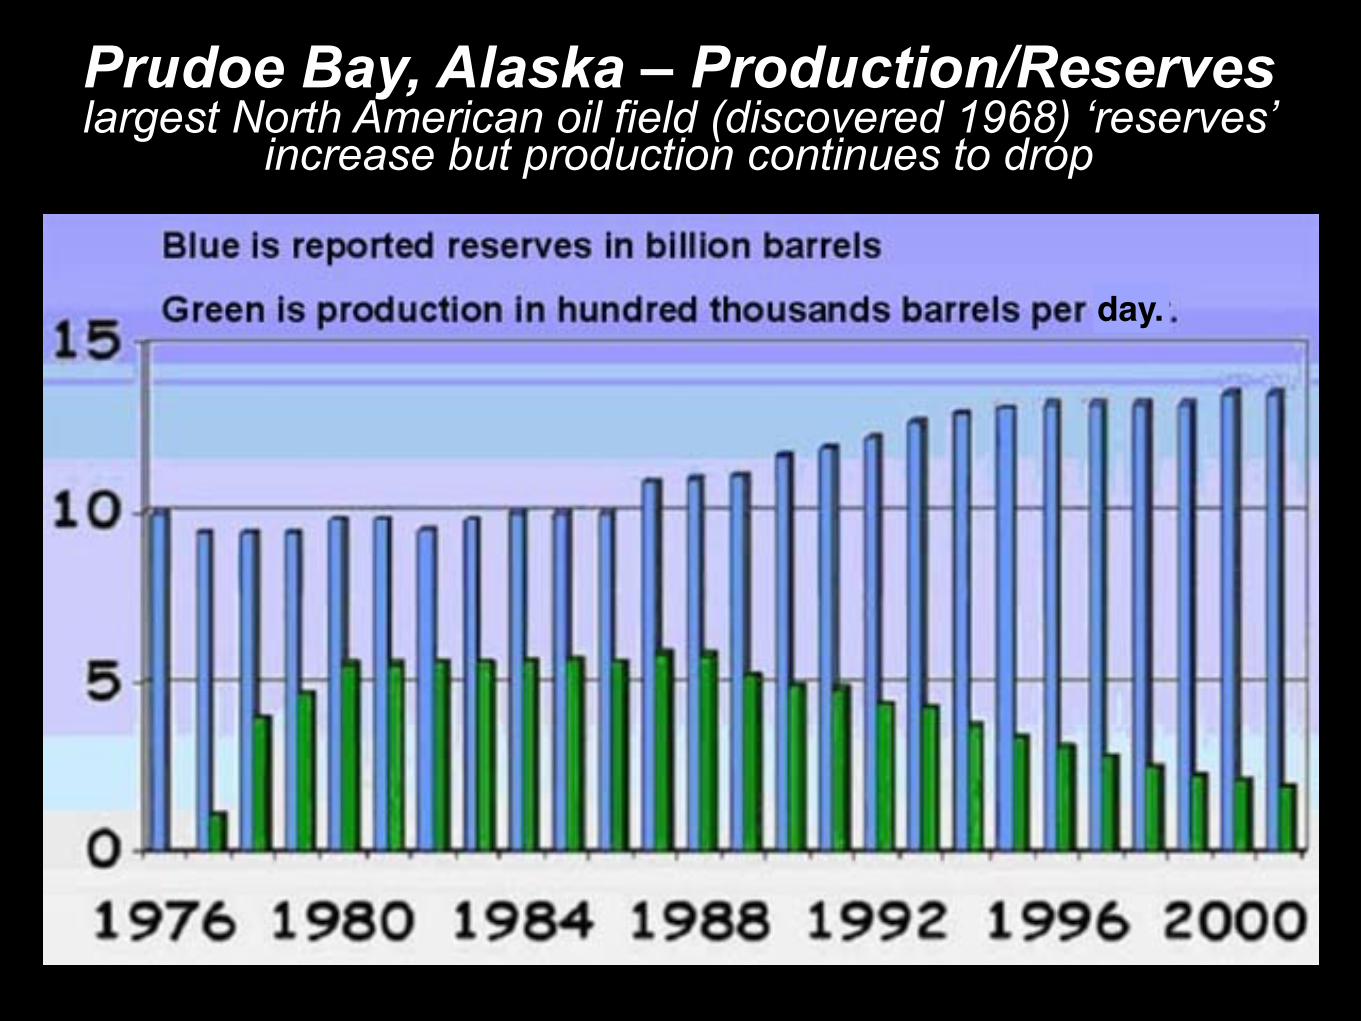
Prudoe Bay, Alaska – Production/Reserveslargest North American oil field (discovered 1968) ‘reserves’
increase but production continues to drop
day.
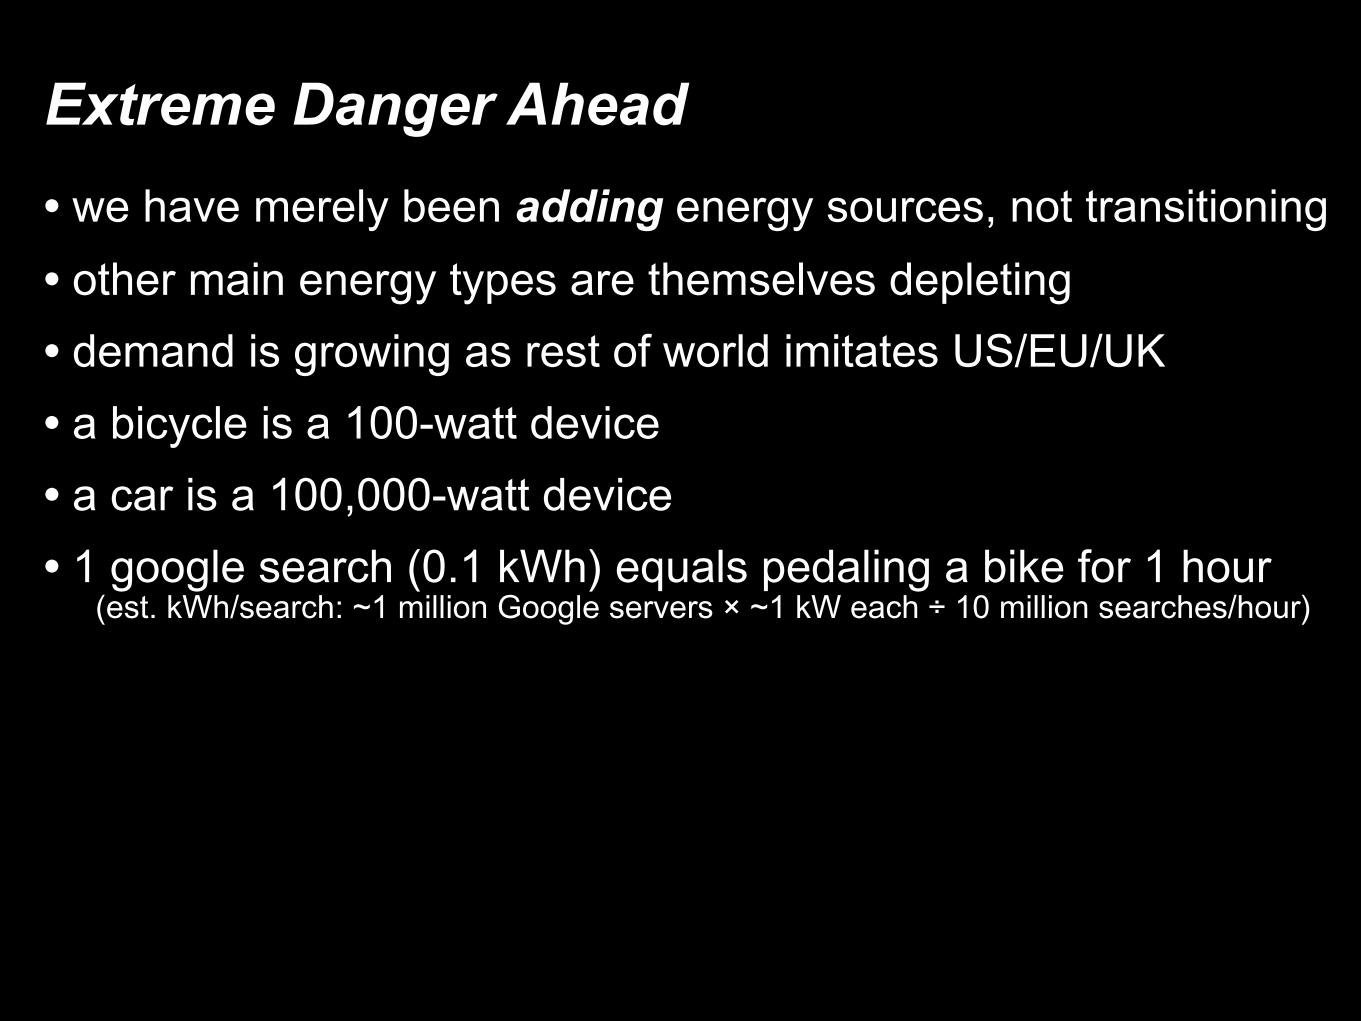
Extreme Danger Ahead
• we have merely been adding energy sources, not transitioning
• other main energy types are themselves depleting
• demand is growing as rest of world imitates US/EU/UK
• a bicycle is a 100-watt device
• a car is a 100,000-watt device
• 1 google search (0.1 kWh) equals pedaling a bike for 1 hour (est. kWh/search: ~1 million Google servers × ~1 kW each ÷ 10 million searches/hour)
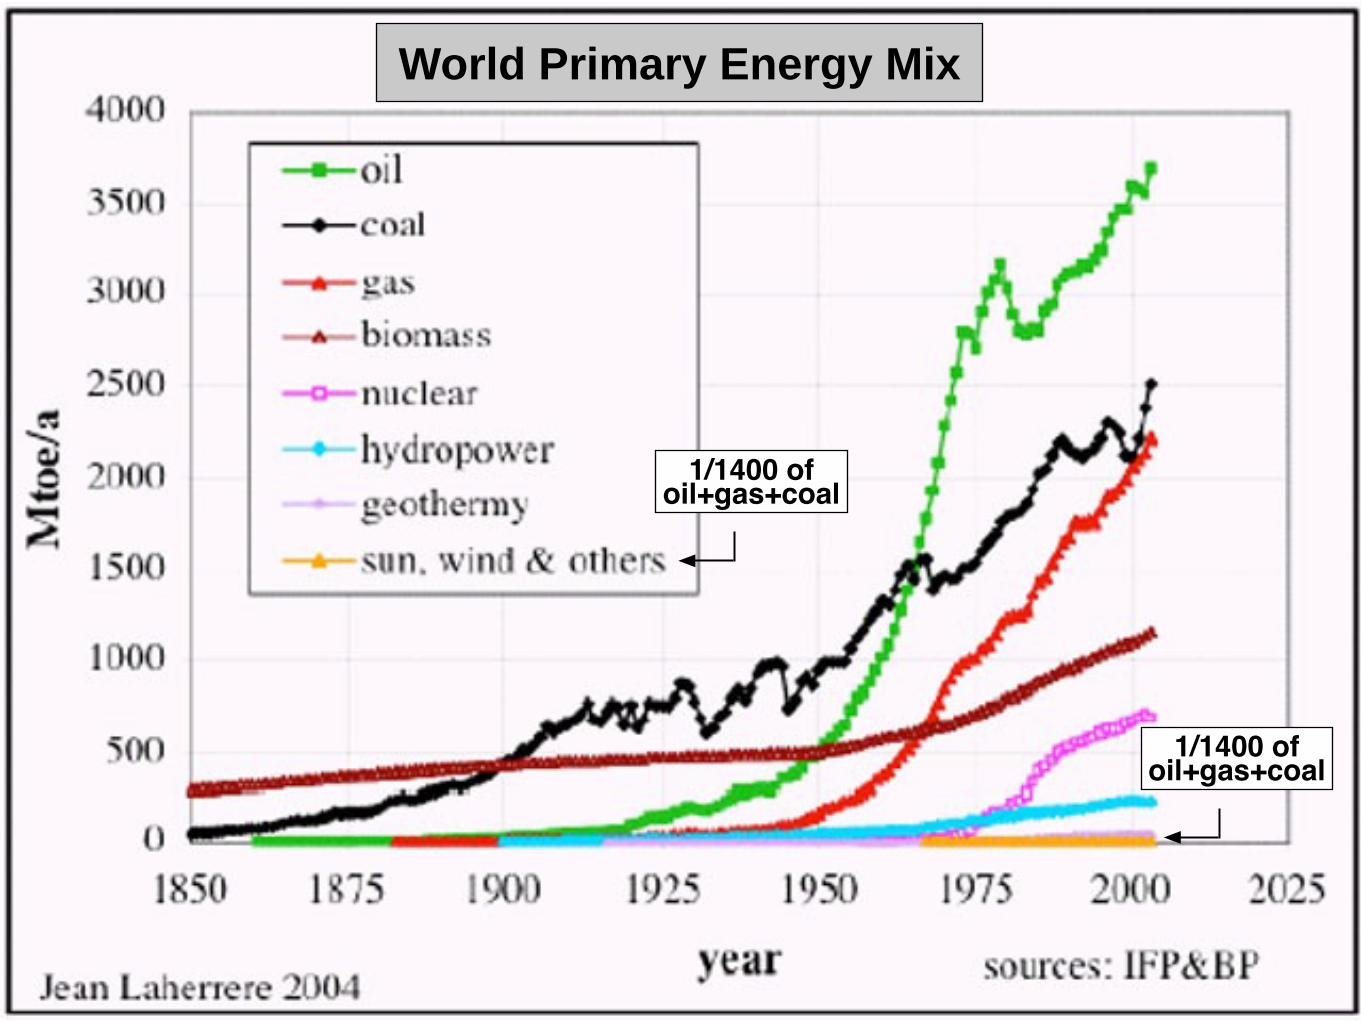
1/1400 ofoil+gas+coal
1/1400 ofoil+gas+coal
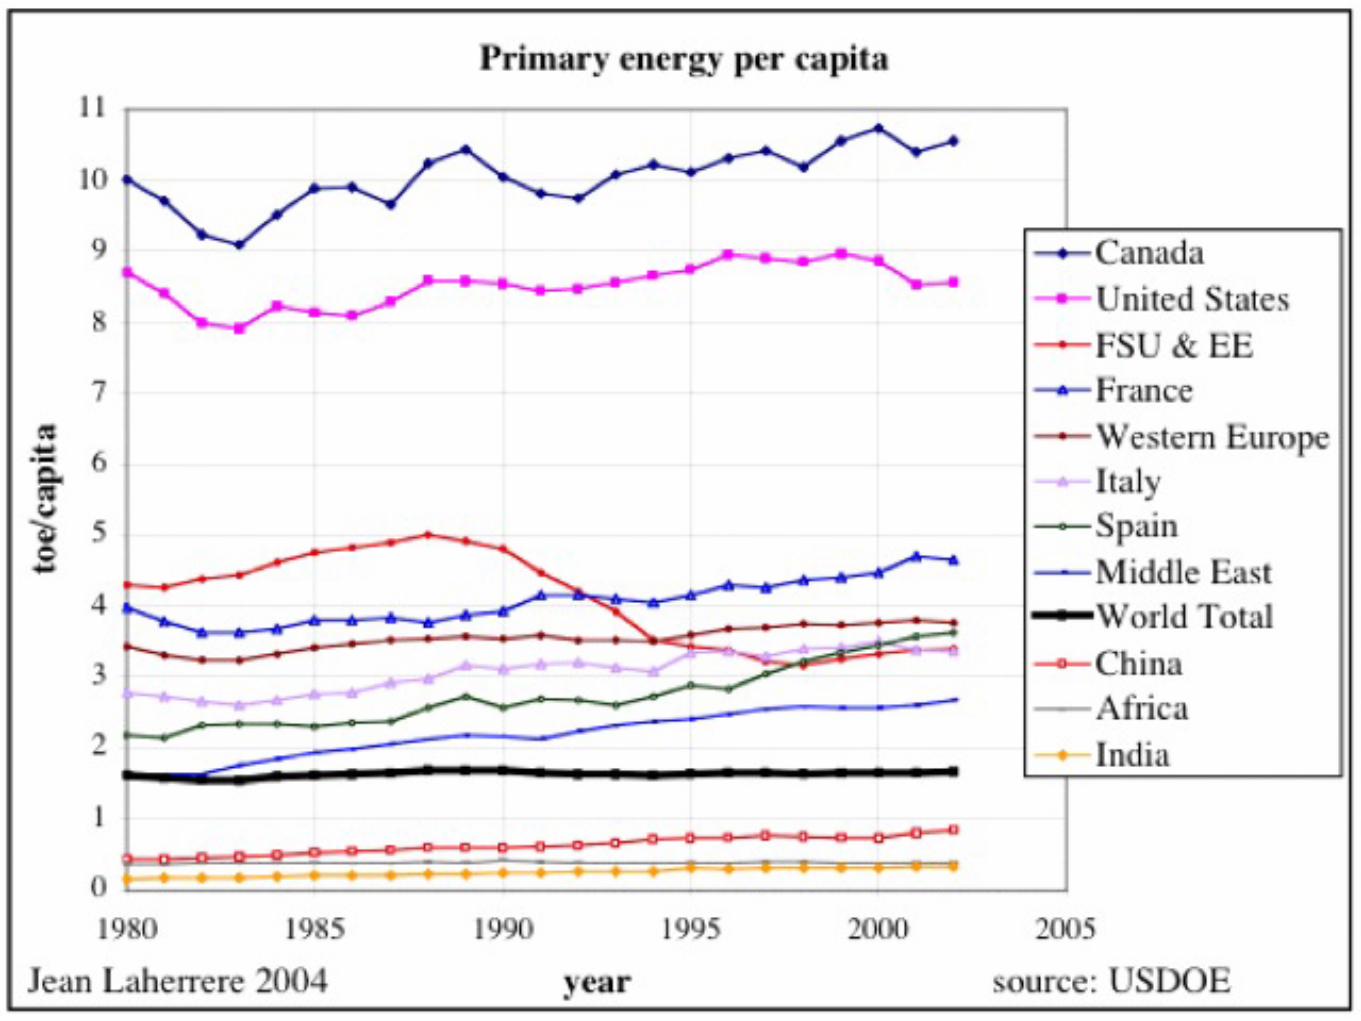
World Primary Energy Mix
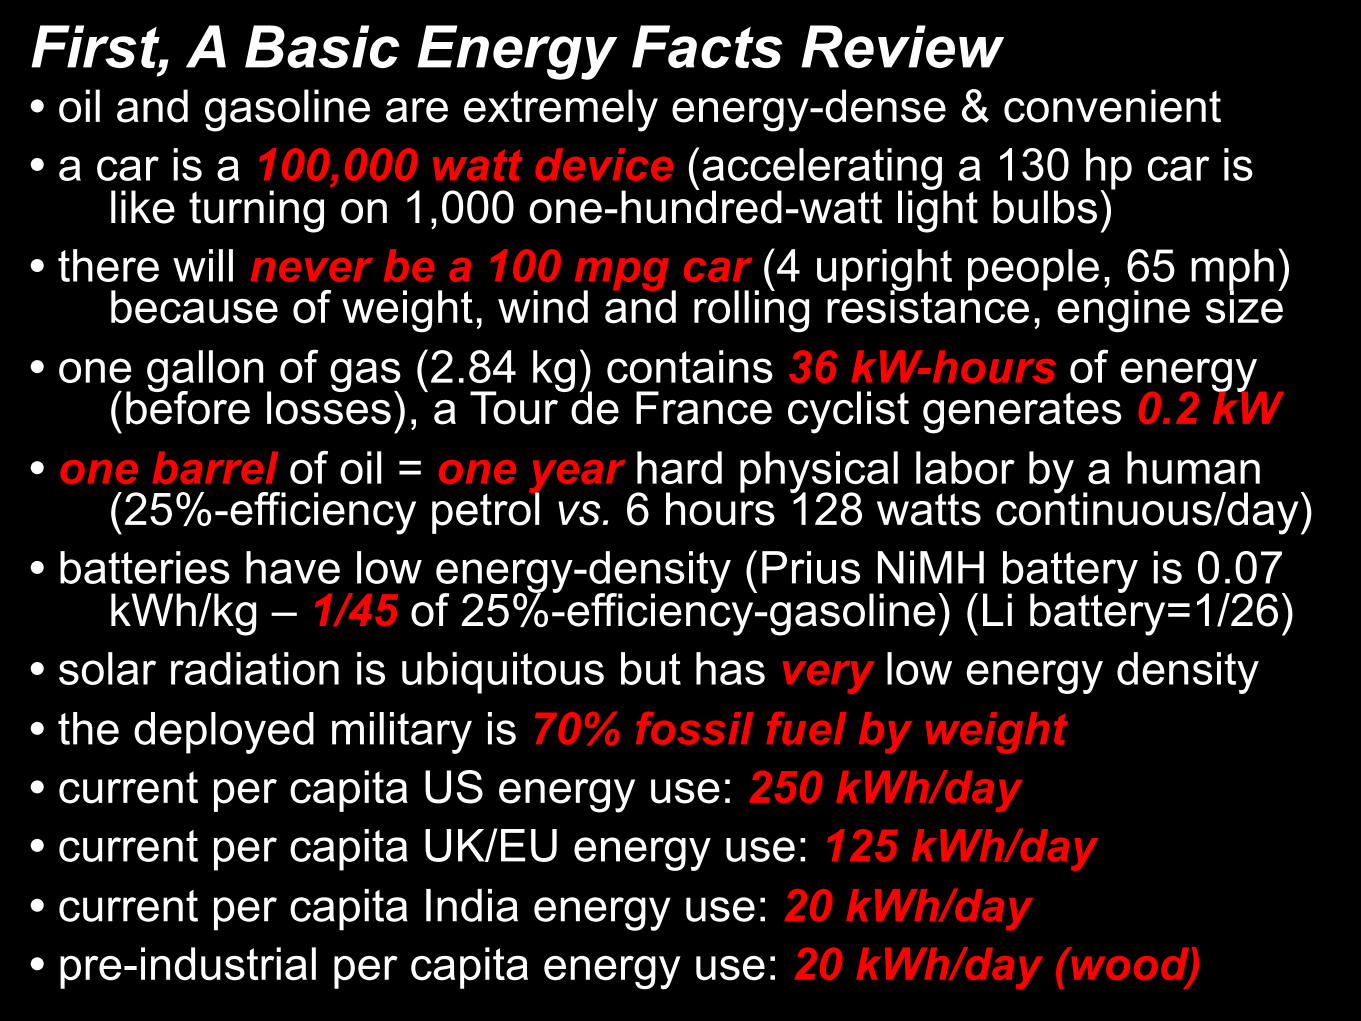
First, A Basic Energy Facts Review• oil and gasoline are extremely energy-dense & convenient• a car is a 100,000 watt device (accelerating a 130 hp car is
like turning on 1,000 one-hundred-watt light bulbs)• there will never be a 100 mpg car (4 upright people, 65 mph)
because of weight, wind and rolling resistance, engine size • one gallon of gas (2.84 kg) contains 36 kW-hours of energy
(before losses), a Tour de France cyclist generates 0.2 kW• one barrel of oil = one year hard physical labor by a human
(25%-efficiency petrol vs. 6 hours 128 watts continuous/day)• batteries have low energy-density (Prius NiMH battery is 0.07
kWh/kg – 1/45 of 25%-efficiency-gasoline) (Li battery=1/26)• solar radiation is ubiquitous but has very low energy density• the deployed military is 70% fossil fuel by weight• current per capita US energy use: 250 kWh/day• current per capita UK/EU energy use: 125 kWh/day• current per capita India energy use: 20 kWh/day• pre-industrial per capita energy use: 20 kWh/day (wood)
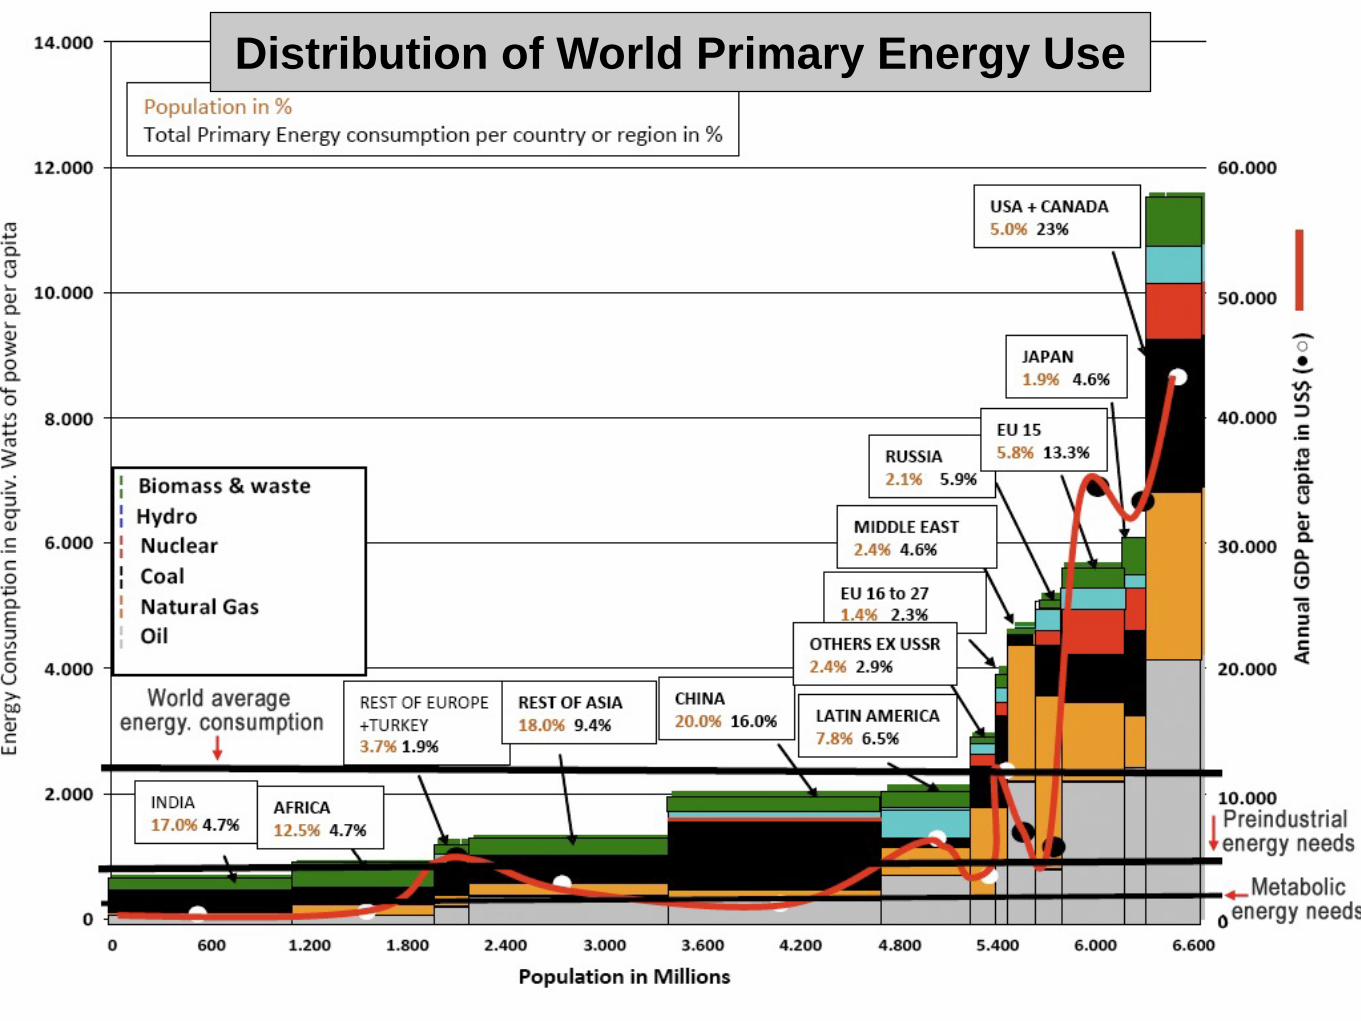
Distribution of World Primary Energy Use
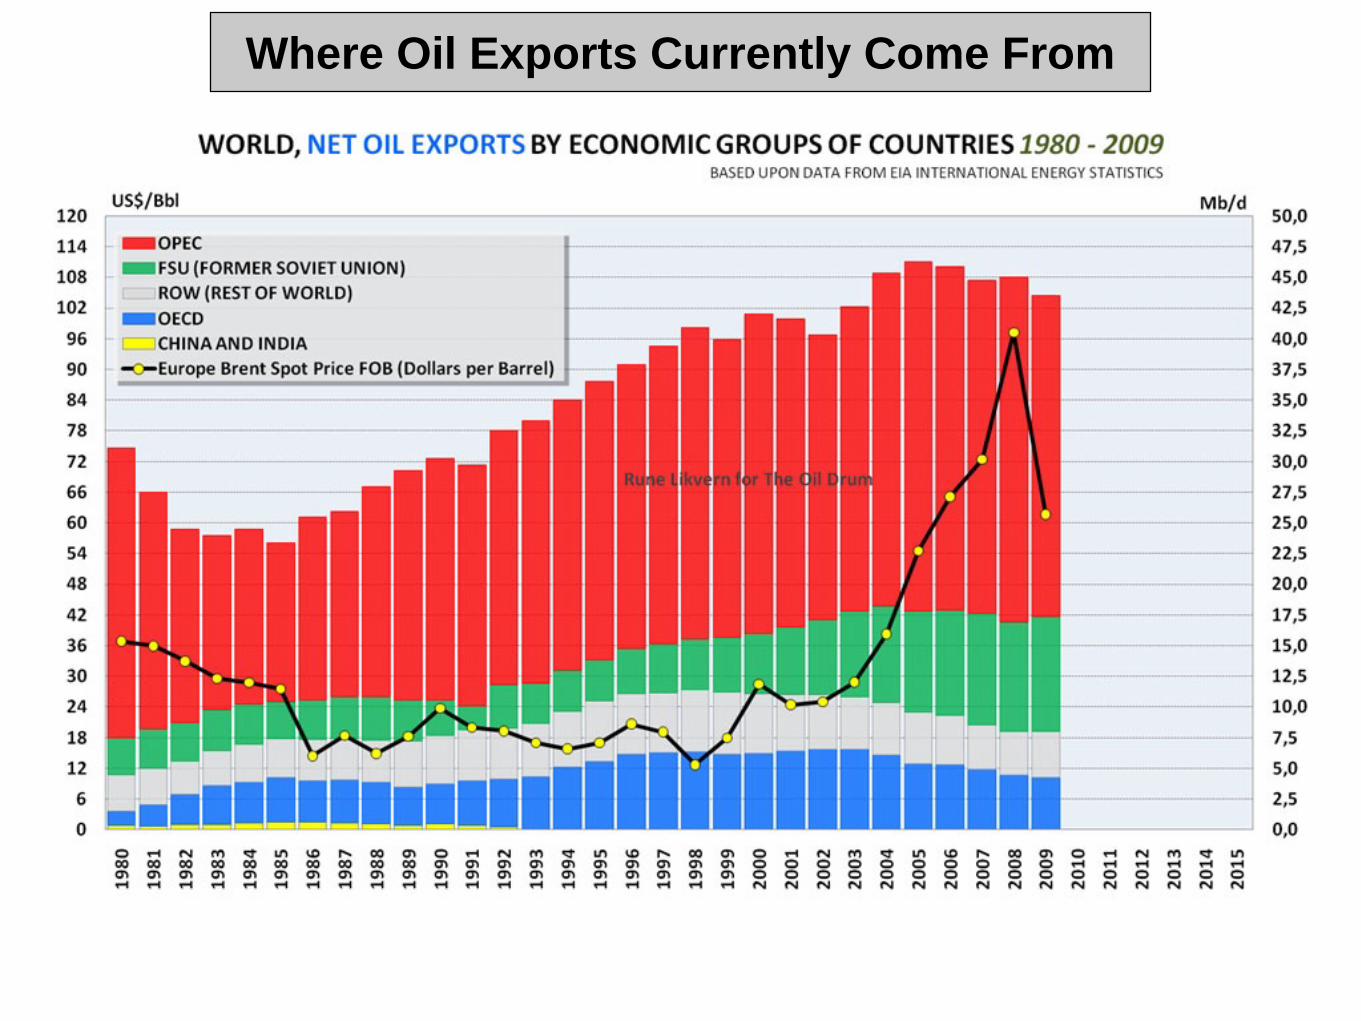
Where Oil Exports Currently Come From
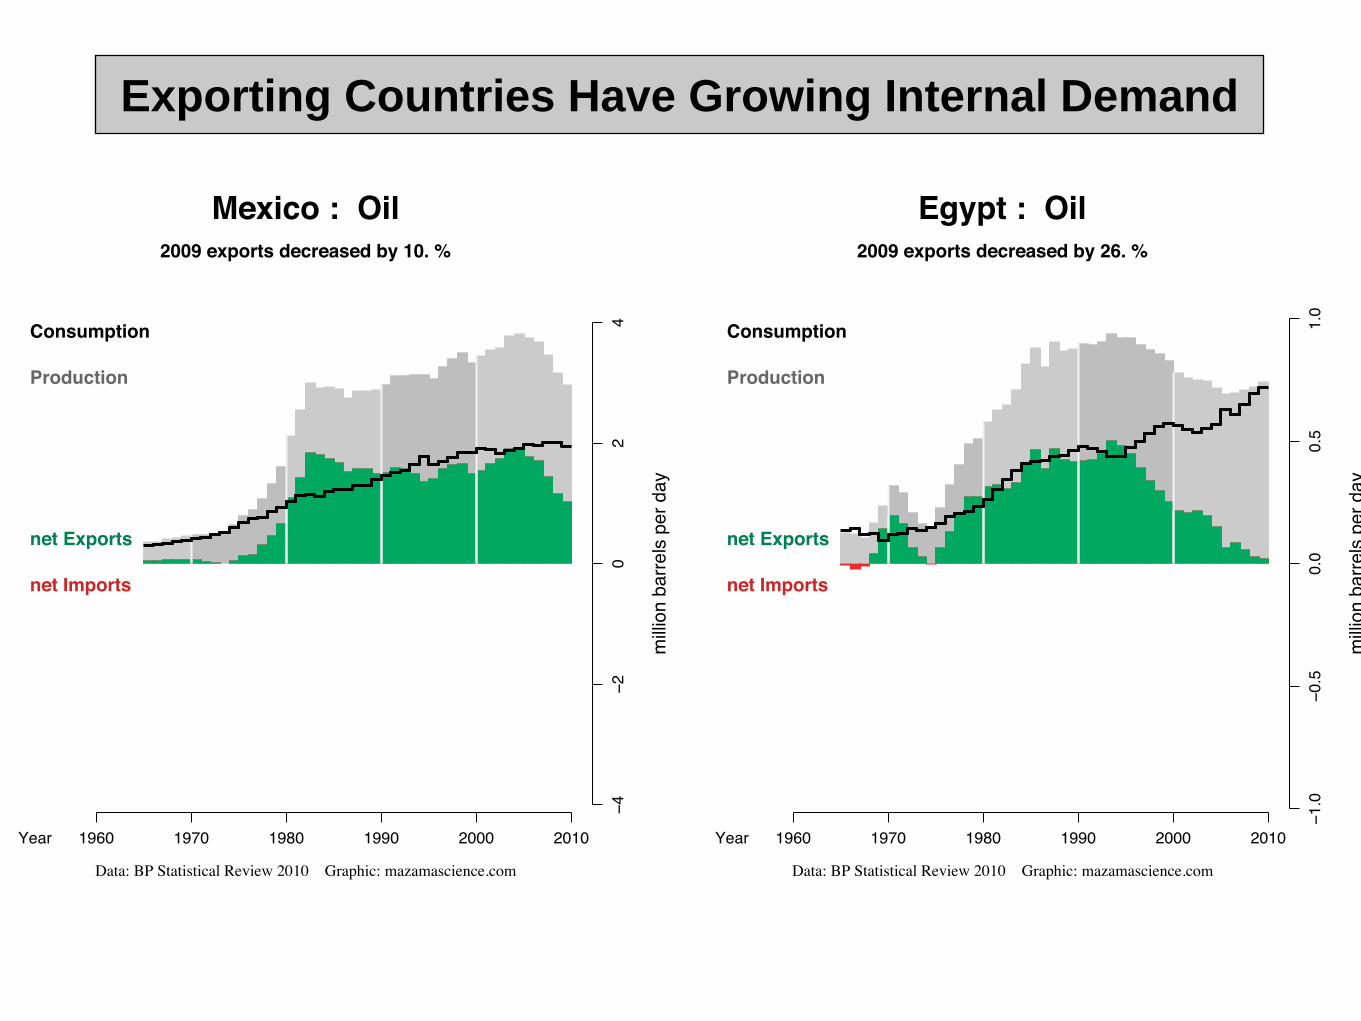
1960 1970 1980 1990 2000 2010
−1.0
−0.5
0.0
0.5
1.0
Egypt : Oil2009 exports decreased by 26. %
Data: BP Statistical Review 2010 Graphic: mazamascience.com
Year
milli
on b
arre
ls pe
r day
Consumption
Production
net Exports
net Imports
1960 1970 1980 1990 2000 2010
−4−2
02
4
Mexico : Oil2009 exports decreased by 10. %
Data: BP Statistical Review 2010 Graphic: mazamascience.com
Year
milli
on b
arre
ls pe
r day
Consumption
Production
net Exports
net Imports
Exporting Countries Have Growing Internal Demand
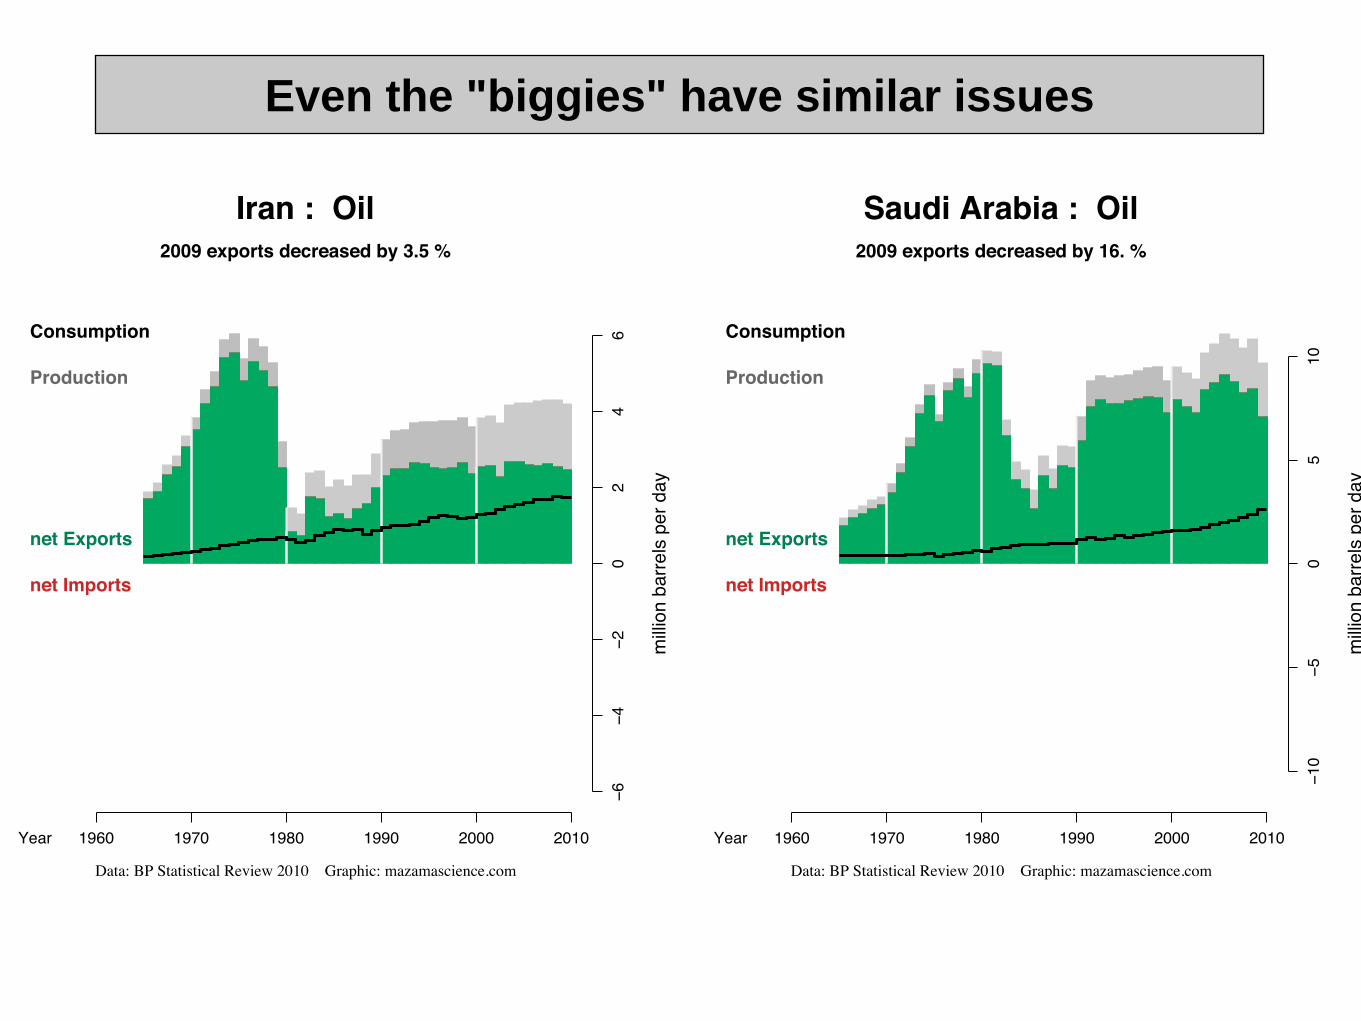
1960 1970 1980 1990 2000 2010
−10
−50
510
Saudi Arabia : Oil2009 exports decreased by 16. %
Data: BP Statistical Review 2010 Graphic: mazamascience.com
Year
milli
on b
arre
ls pe
r day
Consumption
Production
net Exports
net Imports
1960 1970 1980 1990 2000 2010
−6−4
−20
24
6
Iran : Oil2009 exports decreased by 3.5 %
Data: BP Statistical Review 2010 Graphic: mazamascience.com
Year
milli
on b
arre
ls pe
r day
Consumption
Production
net Exports
net Imports
Even the "biggies" have similar issues
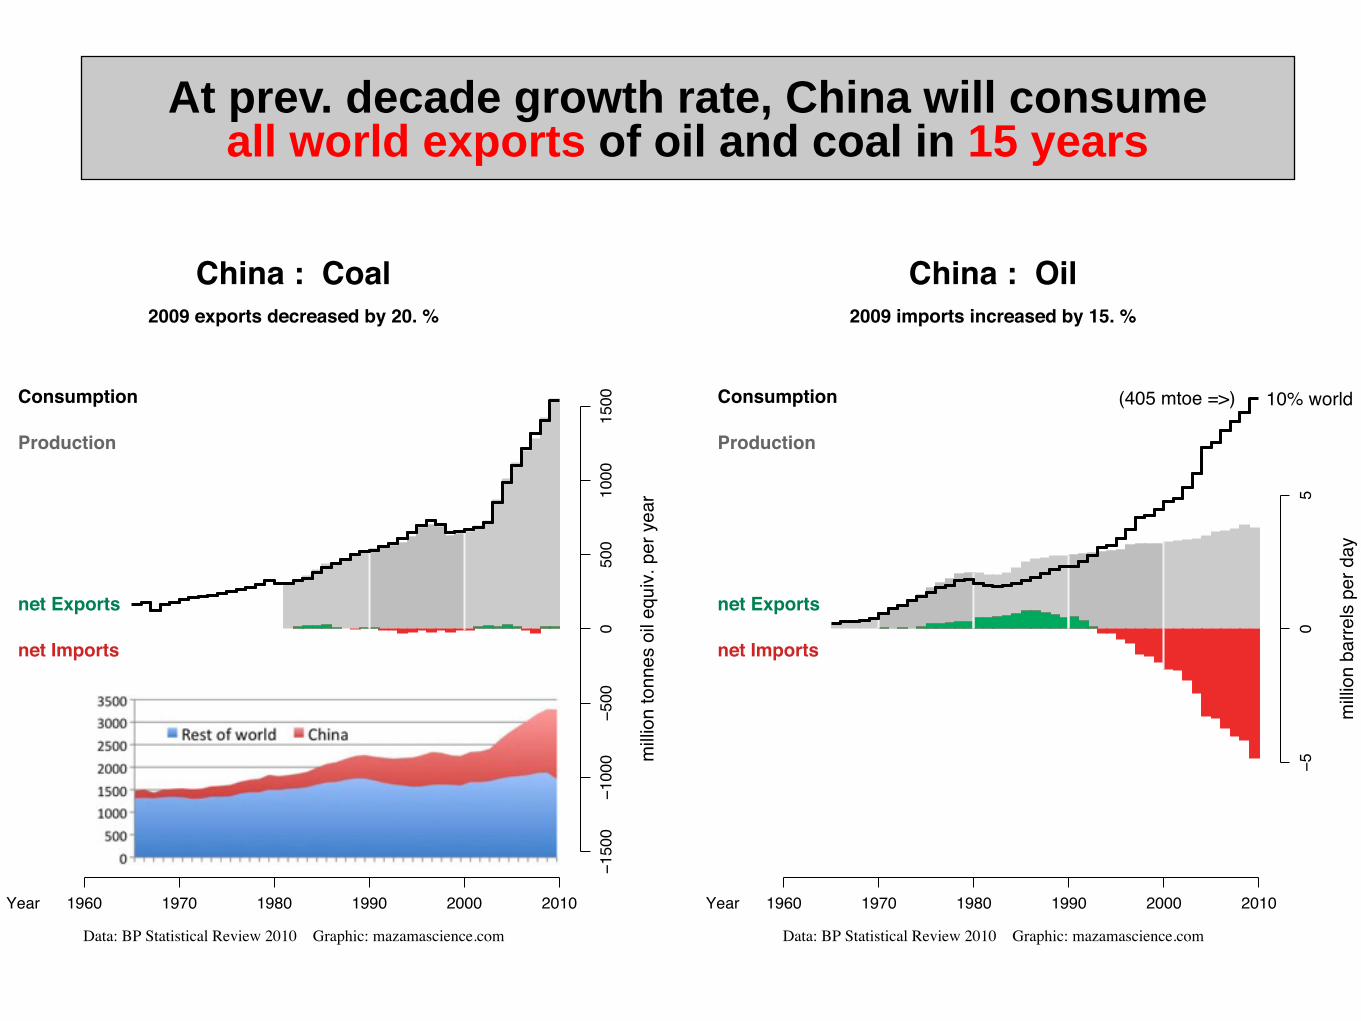
1960 1970 1980 1990 2000 2010
−50
5
China : Oil2009 imports increased by 15. %
Data: BP Statistical Review 2010 Graphic: mazamascience.com
Year
milli
on b
arre
ls pe
r day
Consumption
Production
net Exports
net Imports
1960 1970 1980 1990 2000 2010
−150
0−1
000
−500
050
010
0015
00
China : Coal2009 exports decreased by 20. %
Data: BP Statistical Review 2010 Graphic: mazamascience.com
Year
milli
on to
nnes
oil e
quiv.
per
yea
r
Consumption
Production
net Exports
net Imports
At prev. decade growth rate, China will consumeall world exports of oil and coal in 15 years
(405 mtoe =>) 10% world

Let's Take a Longer-Term View
• too doomer-ish?• perhaps the 'cornucopians' are correct
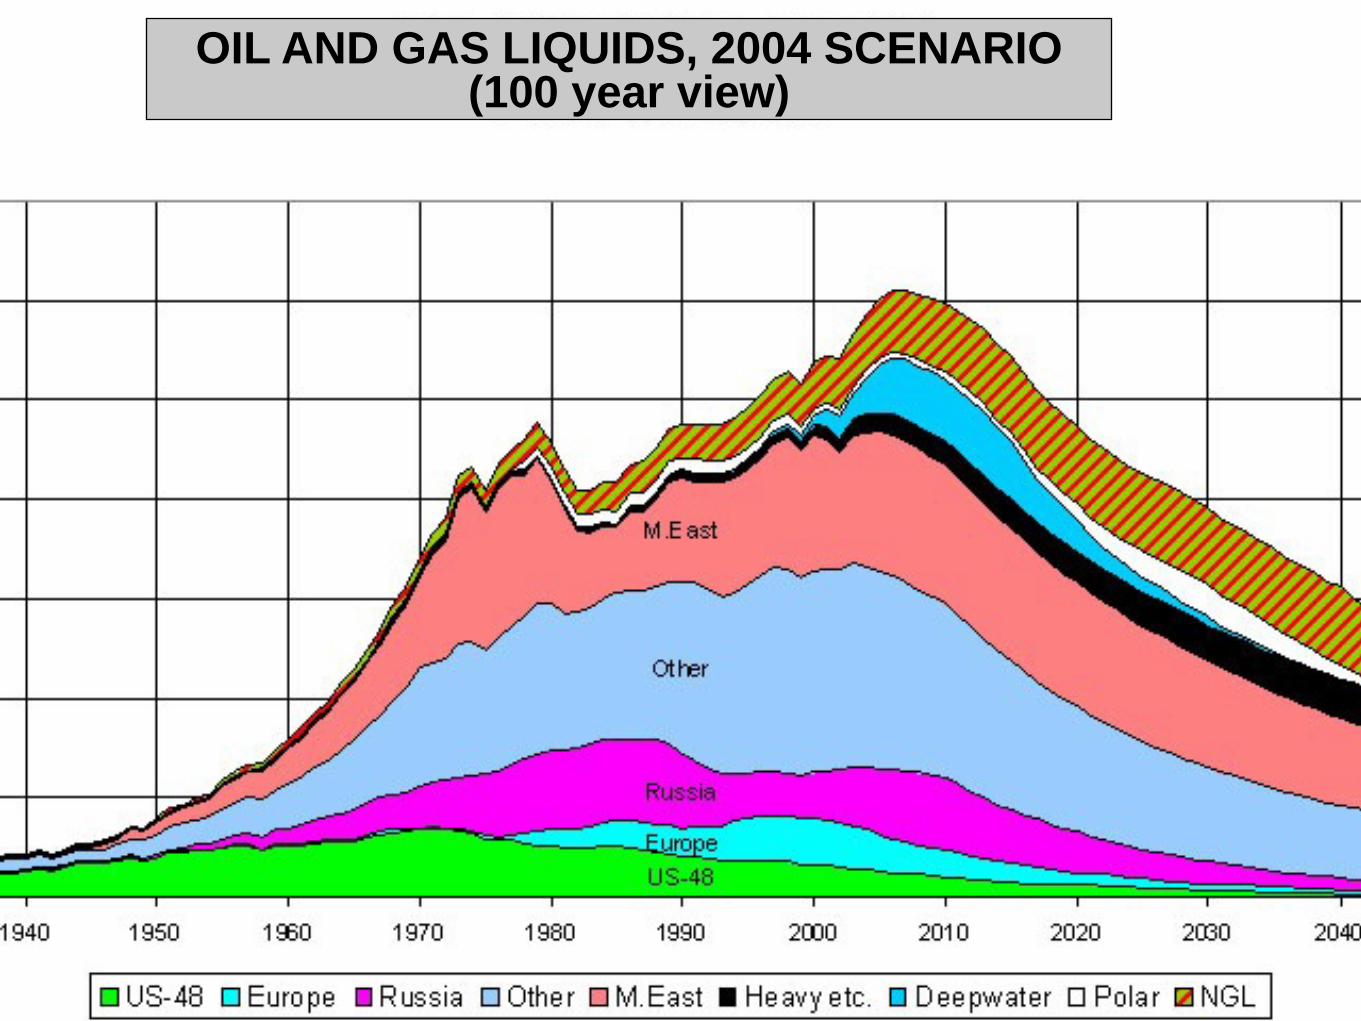
OIL AND GAS LIQUIDS, 2004 SCENARIO(100 year view)
SumerEgypt
RomeCrete GreeceChina
Yucatan EuropeanRenaissance
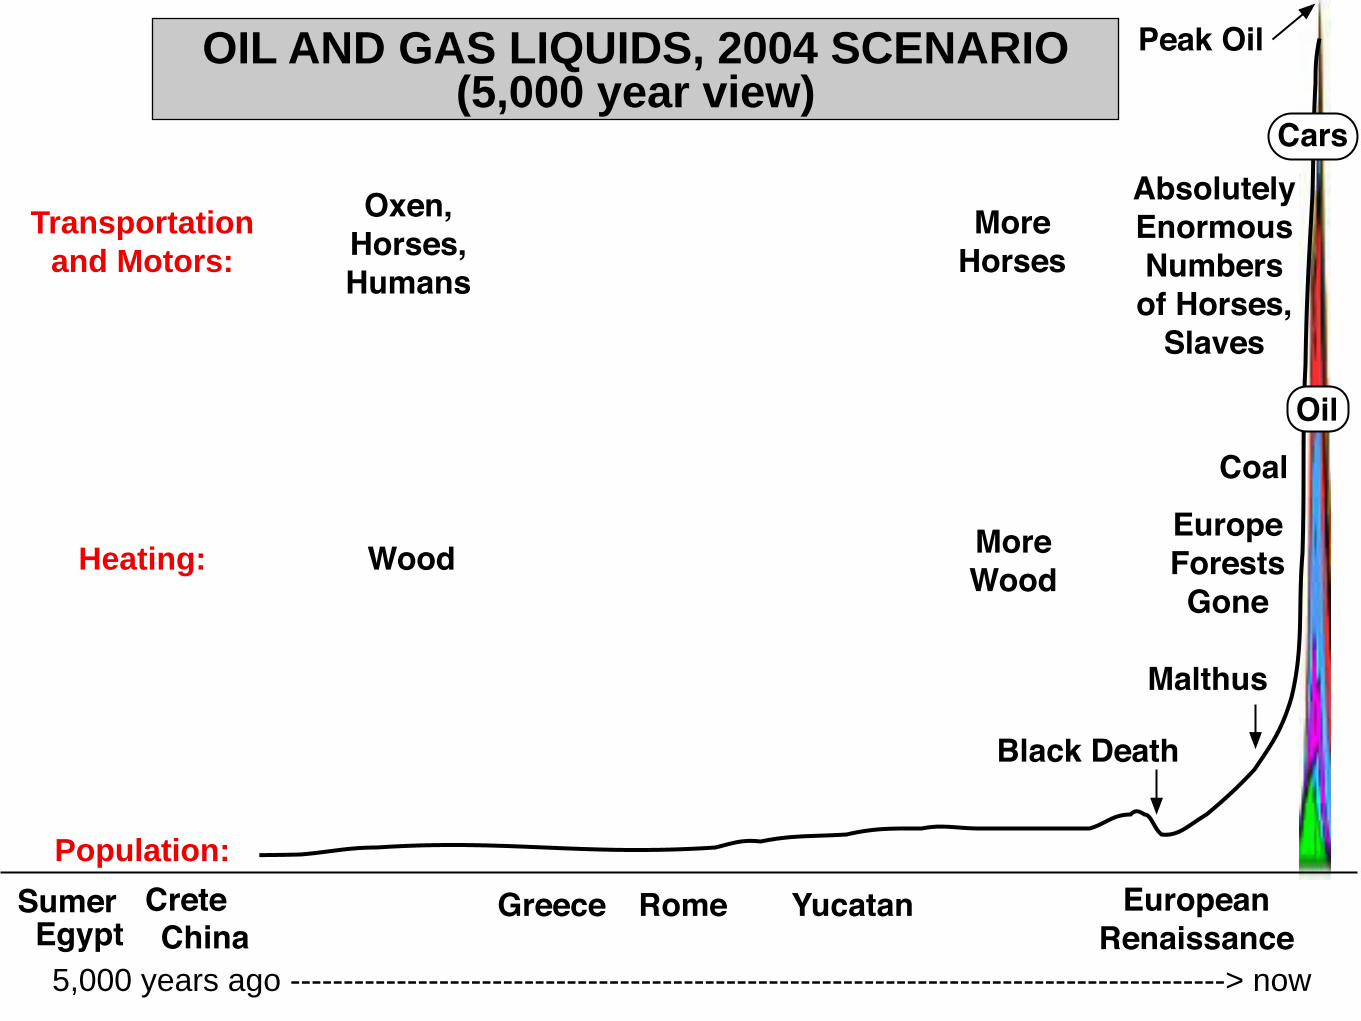
WoodEuropeForestsGone
Coal
Oxen, Horses,Humans
AbsolutelyEnormousNumbersof Horses,
Slaves
More Horses
Black Death
Oil
Cars
Population:
MoreWoodHeating:
Transportationand Motors:
5,000 years ago ----------------------------------------------------------------------------------------> now
Peak Oil
Malthus
OIL AND GAS LIQUIDS, 2004 SCENARIO(5,000 year view)
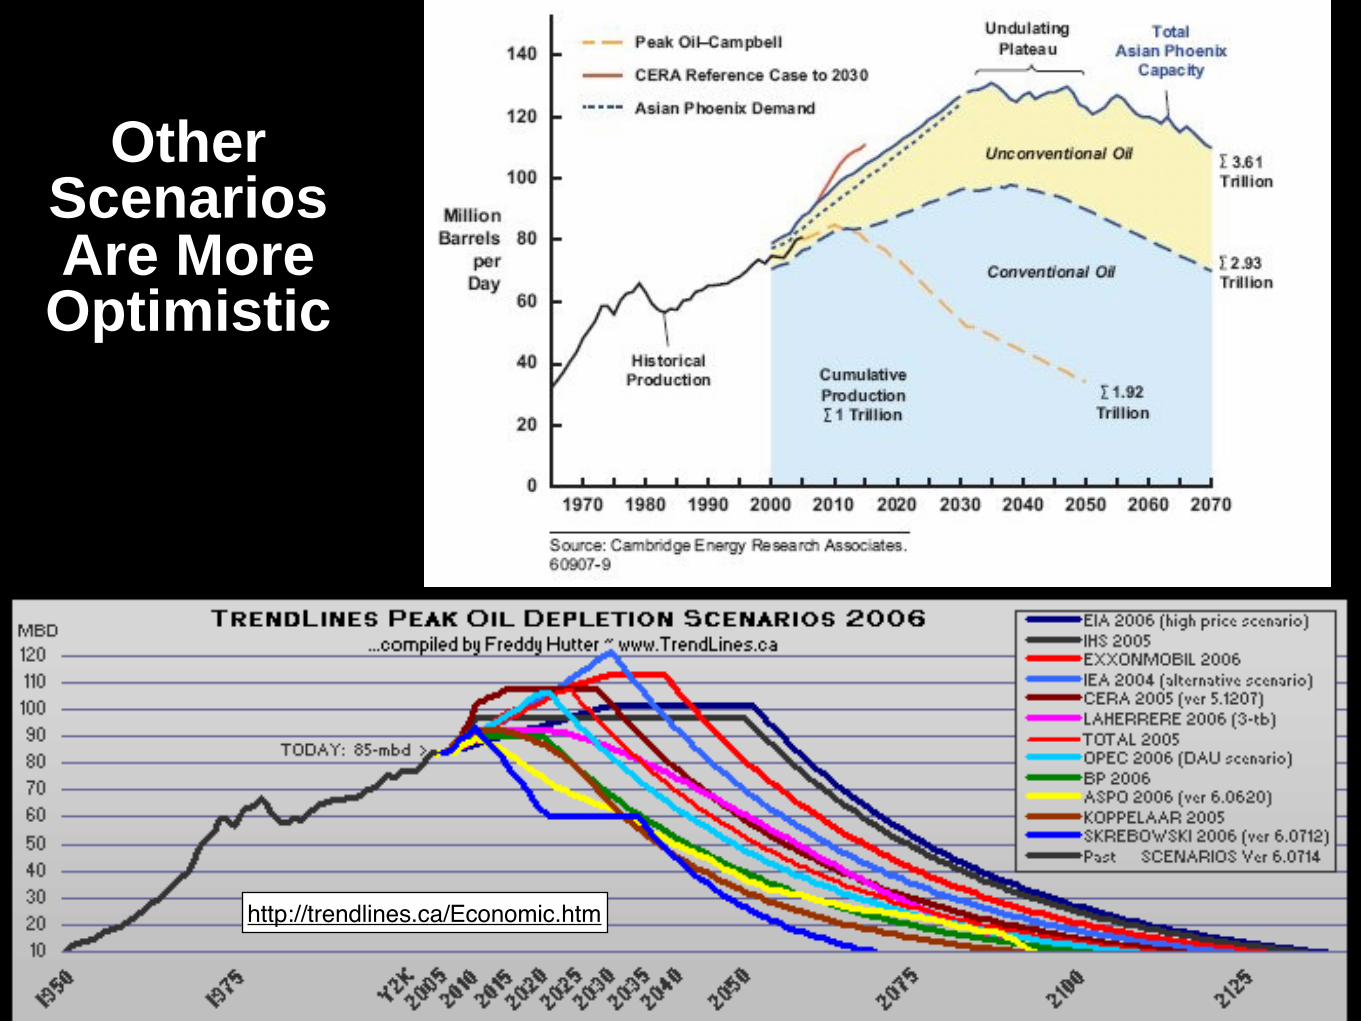
http://trendlines.ca/Economic.htm
Other Scenarios Are More Optimistic
2010
2009
2008
2006-2007
2001-2002
2003-2005
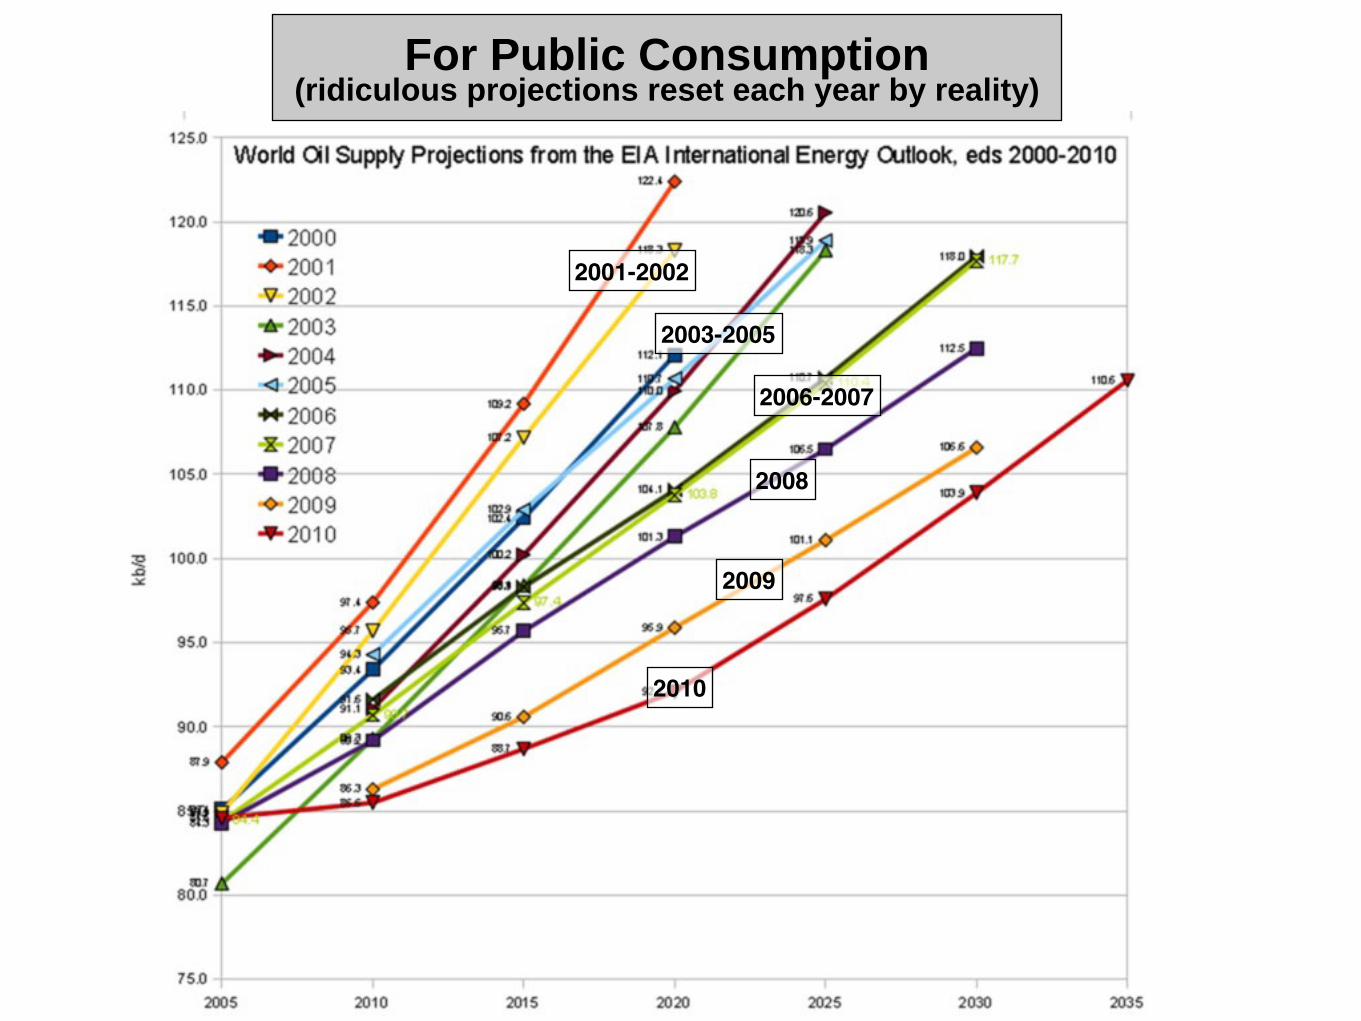
For Public Consumption(ridiculous projections reset each year by reality)
SumerEgypt
RomeCrete GreeceChina
Yucatan EuropeanRenaissance
WoodEuropeForestsGone
Coal
Oxen, Horses,Humans
AbsolutelyEnormousNumbersof Horses,
Slaves
More Horses
Black Death
Oil
Cars
Population:
MoreWoodHeating:
Transportationand Motors:
5,000 years ago ----------------------------------------------------------------------------------------> now
Peak Oil
Malthus
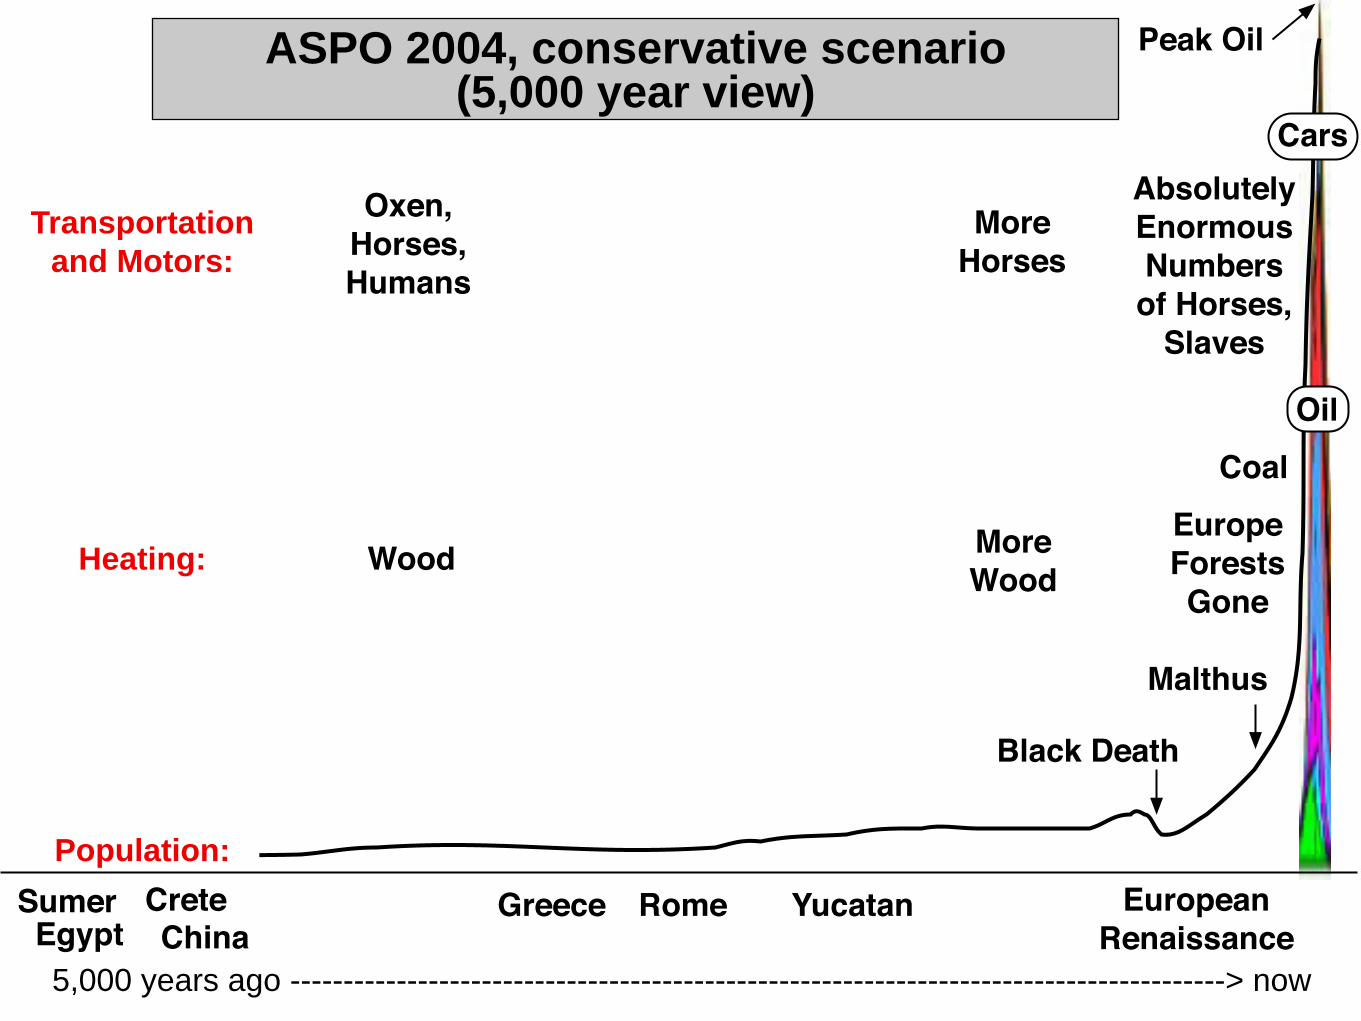
ASPO 2004, conservative scenario(5,000 year view)
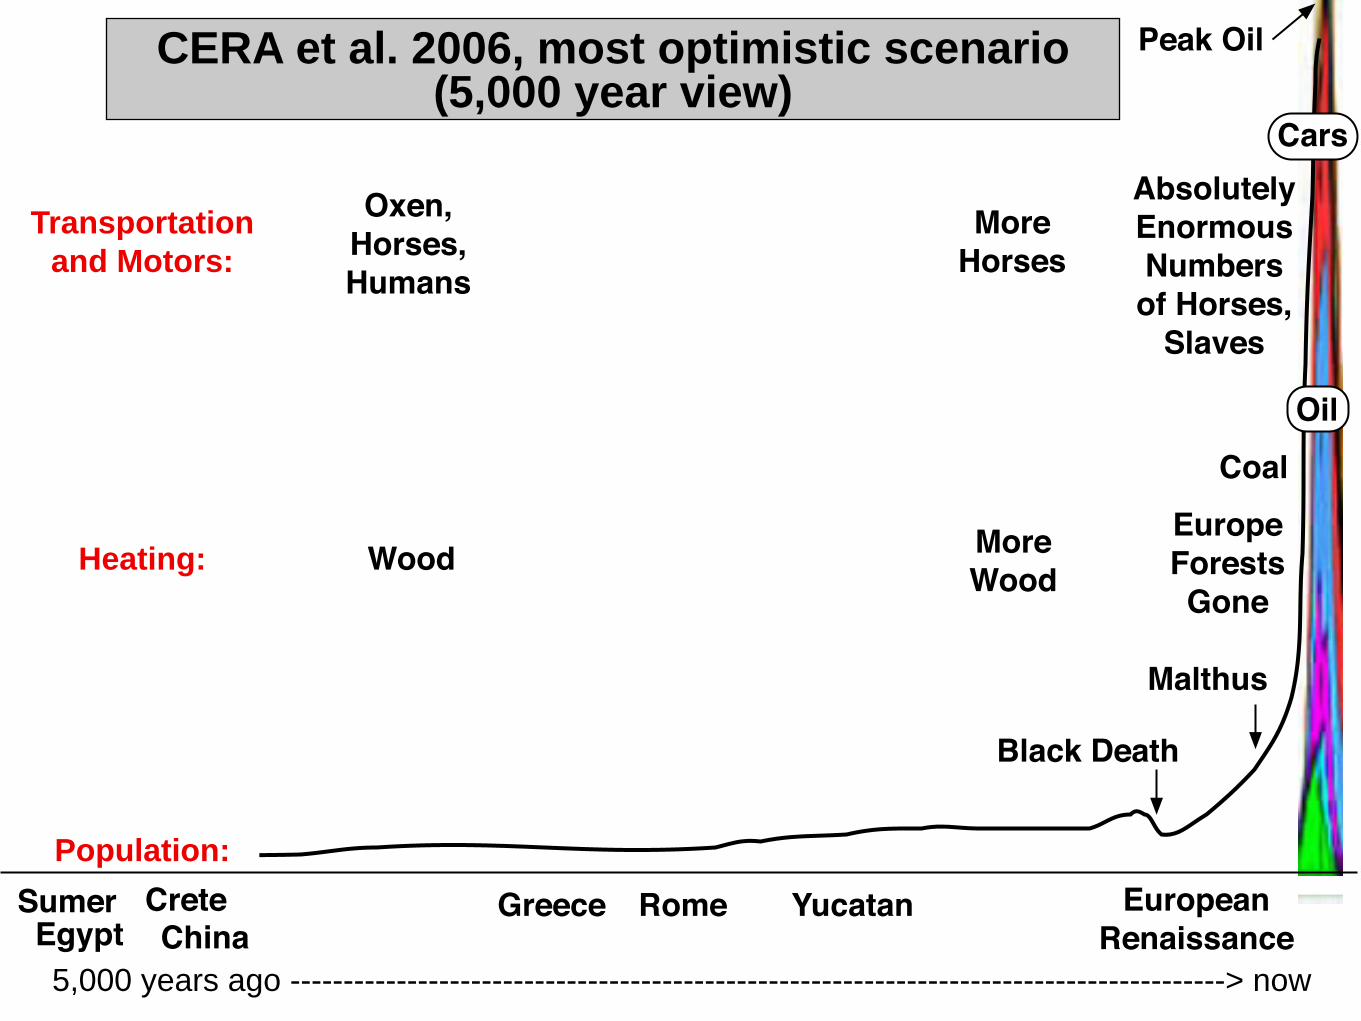
SumerEgypt
RomeCrete GreeceChina
Yucatan EuropeanRenaissance
WoodEuropeForestsGone
Coal
Oxen, Horses,Humans
AbsolutelyEnormousNumbersof Horses,
Slaves
More Horses
Black Death
Oil
Cars
Population:
MoreWoodHeating:
Transportationand Motors:
5,000 years ago ----------------------------------------------------------------------------------------> now
Peak Oil
Malthus
CERA et al. 2006, most optimistic scenario(5,000 year view)

OK, Let's Look At Other Energy Sources
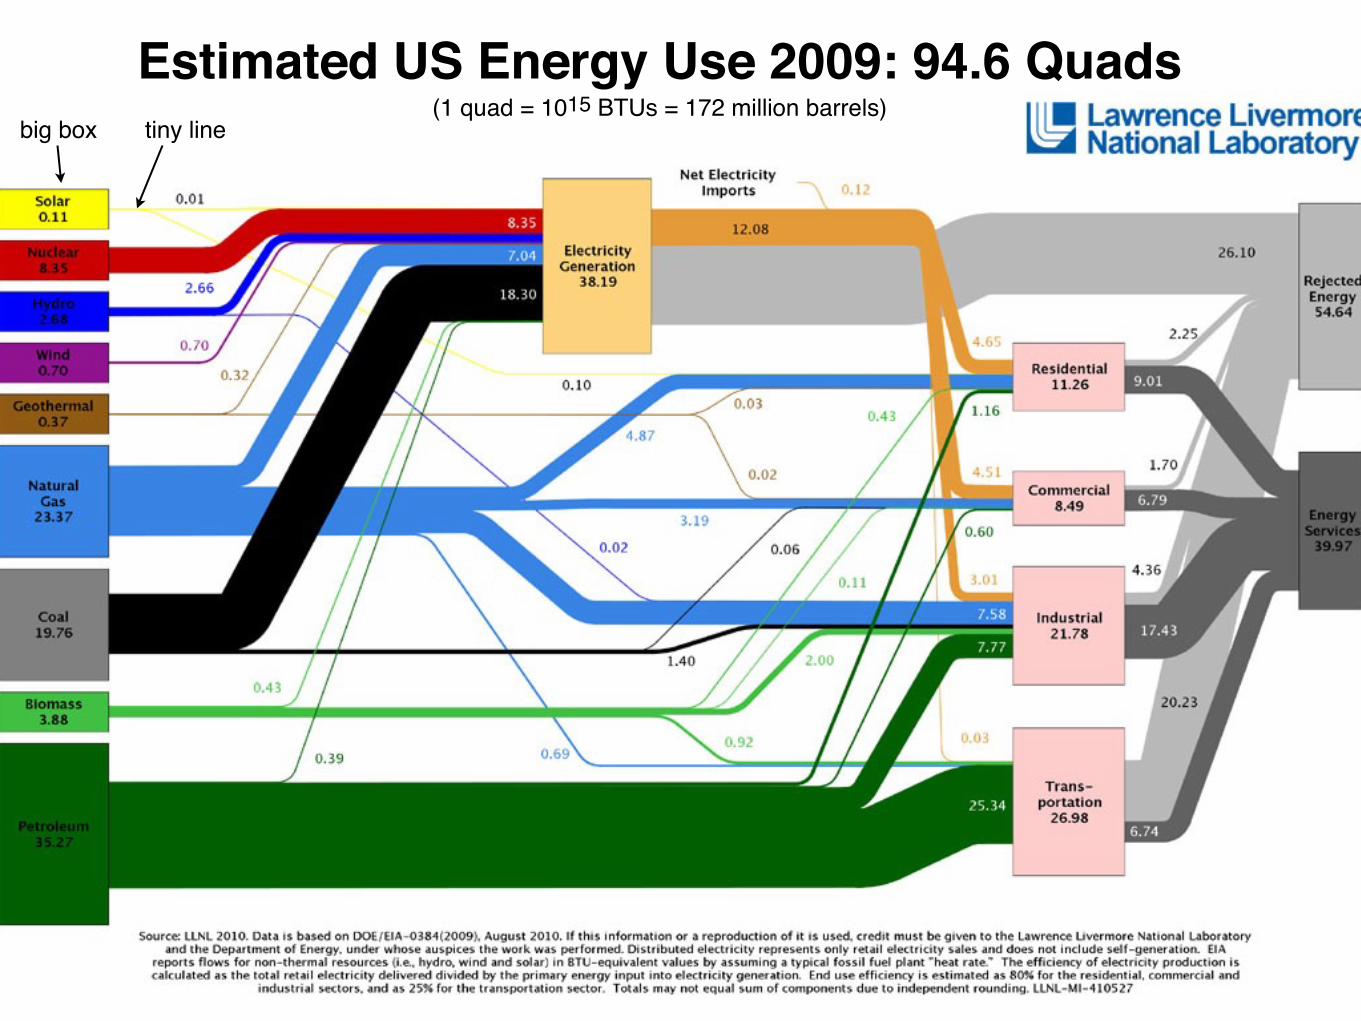
Estimated US Energy Use 2009: 94.6 Quads(1 quad = 1015 BTUs = 172 million barrels)
big box tiny line
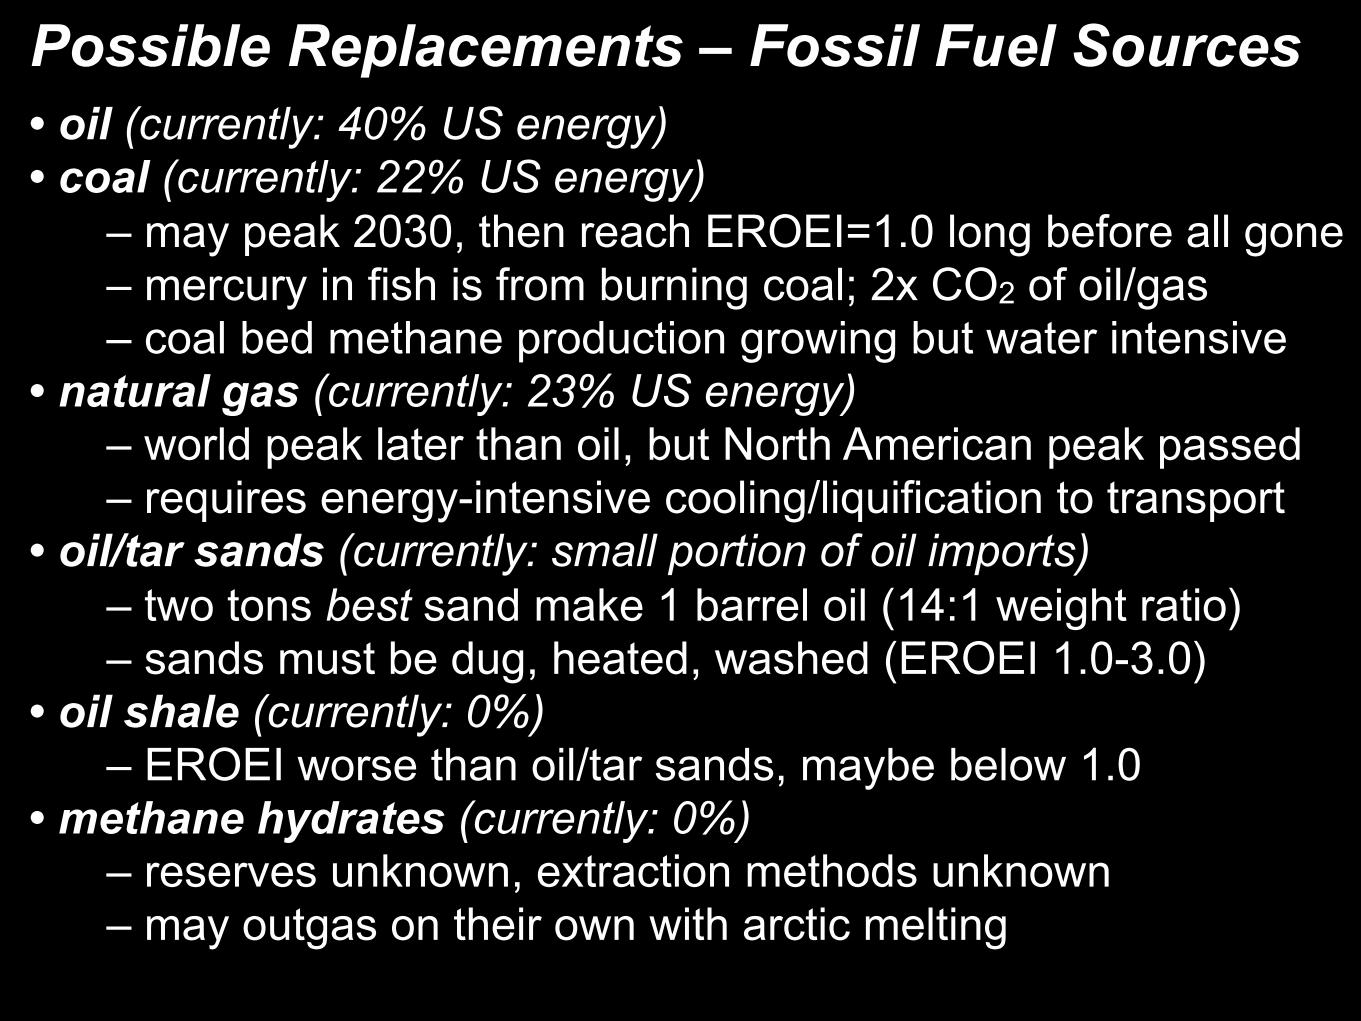
Possible Replacements – Fossil Fuel Sources• oil (currently: 40% US energy)• coal (currently: 22% US energy) – may peak 2030, then reach EROEI=1.0 long before all gone – mercury in fish is from burning coal; 2x CO2 of oil/gas – coal bed methane production growing but water intensive• natural gas (currently: 23% US energy) – world peak later than oil, but North American peak passed – requires energy-intensive cooling/liquification to transport• oil/tar sands (currently: small portion of oil imports) – two tons best sand make 1 barrel oil (14:1 weight ratio) – sands must be dug, heated, washed (EROEI 1.0-3.0)• oil shale (currently: 0%) – EROEI worse than oil/tar sands, maybe below 1.0• methane hydrates (currently: 0%) – reserves unknown, extraction methods unknown – may outgas on their own with arctic melting
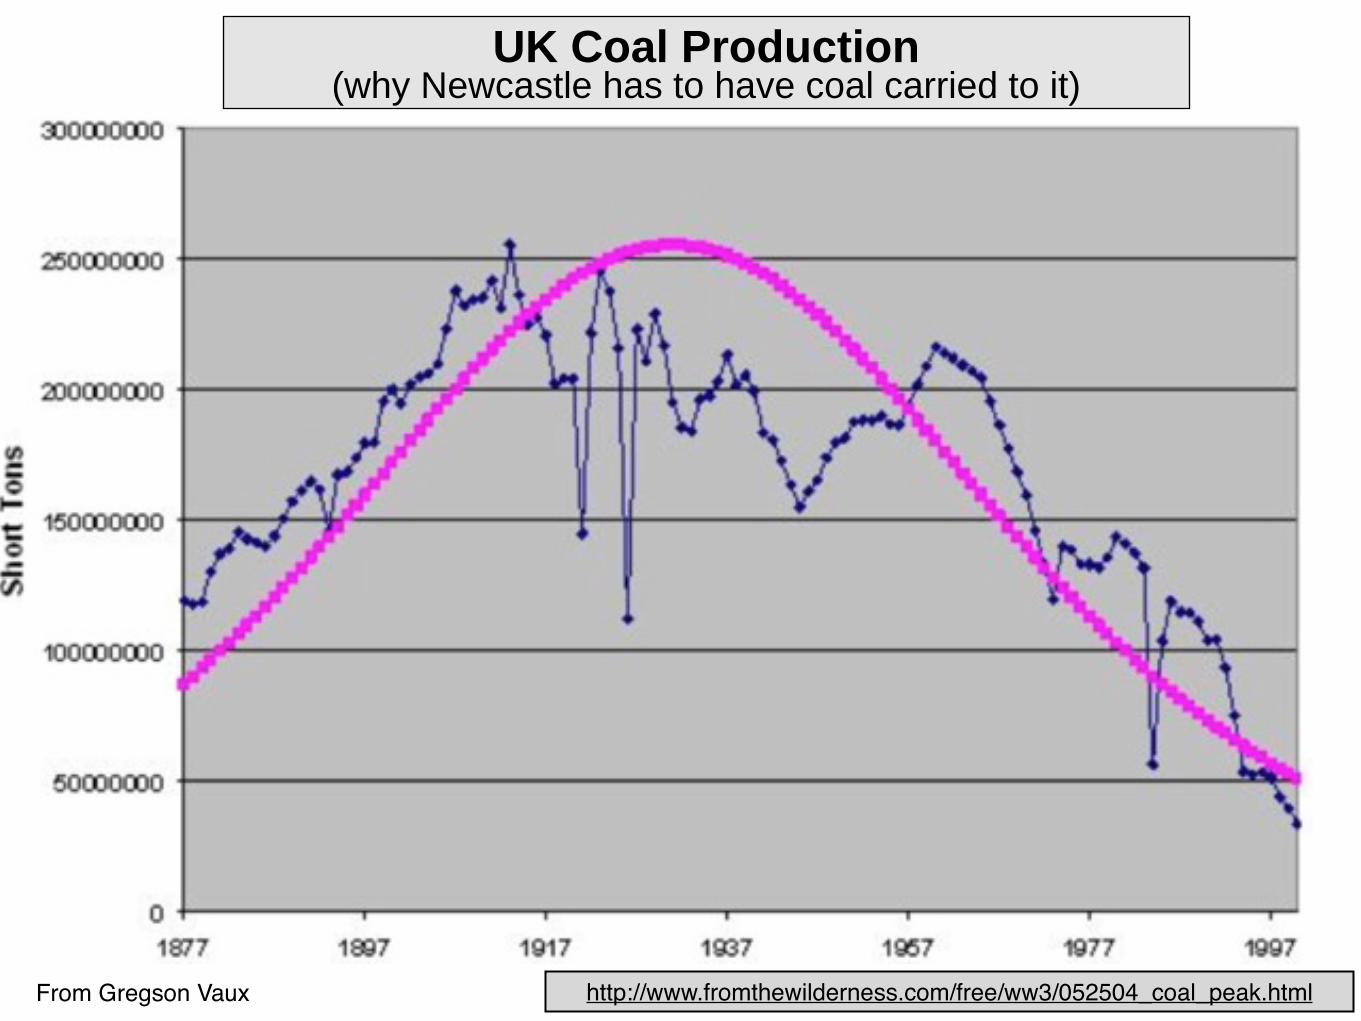
http://www.fromthewilderness.com/free/ww3/052504_coal_peak.html
UK Coal Production(why Newcastle has to have coal carried to it)
From Gregson Vaux
http://www.fromthewilderness.com/free/ww3/052504_coal_peak.html
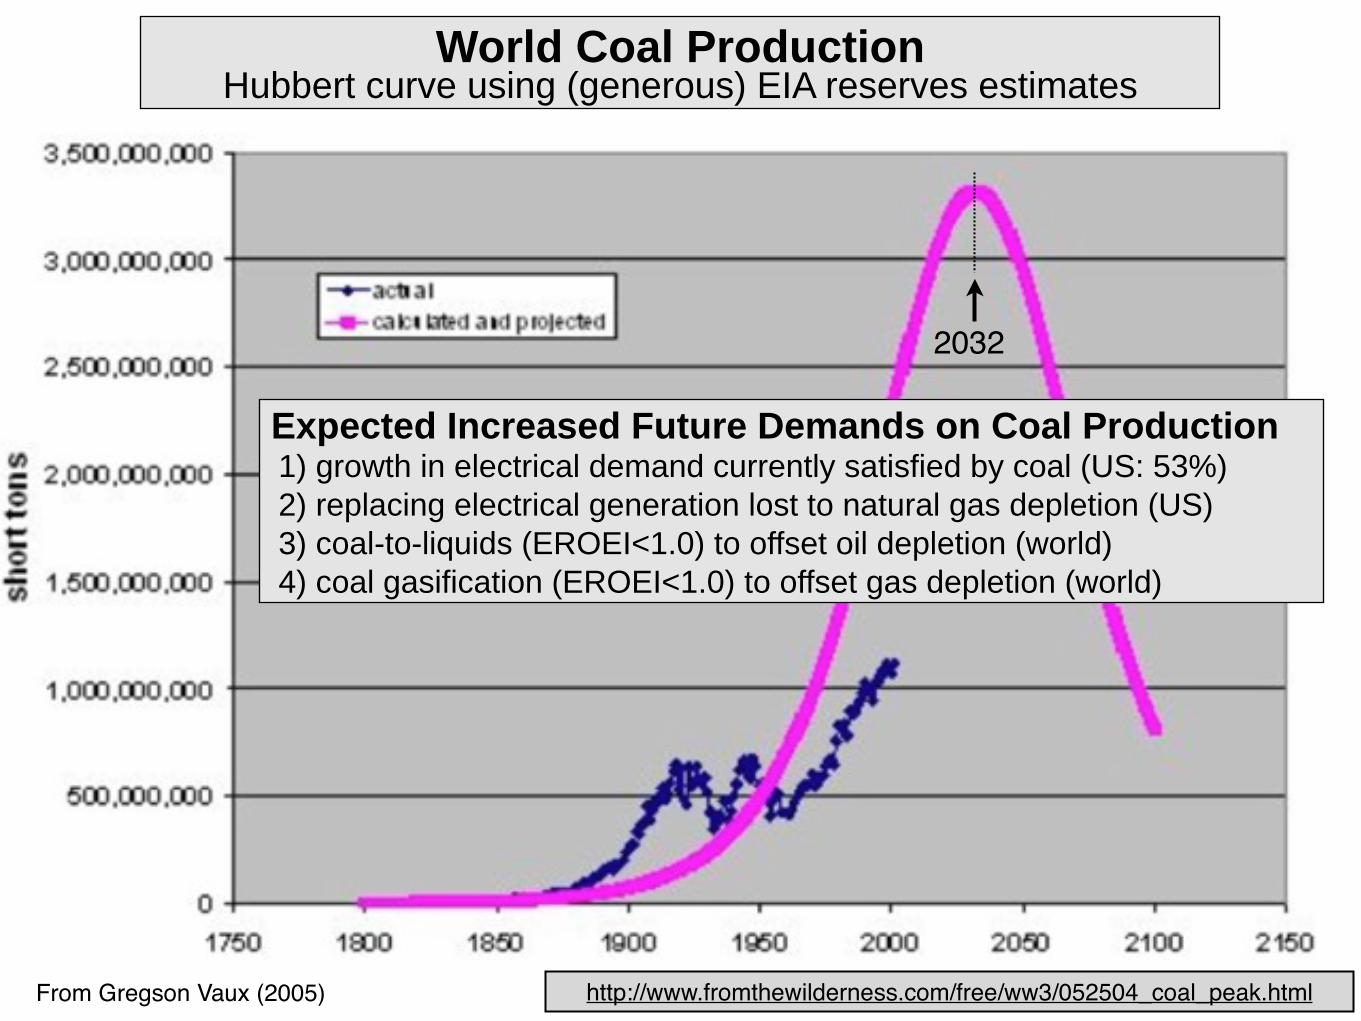
World Coal ProductionHubbert curve using (generous) EIA reserves estimates
2032
Expected Increased Future Demands on Coal Production 1) growth in electrical demand currently satisfied by coal (US: 53%) 2) replacing electrical generation lost to natural gas depletion (US) 3) coal-to-liquids (EROEI<1.0) to offset oil depletion (world) 4) coal gasification (EROEI<1.0) to offset gas depletion (world)
From Gregson Vaux (2005)
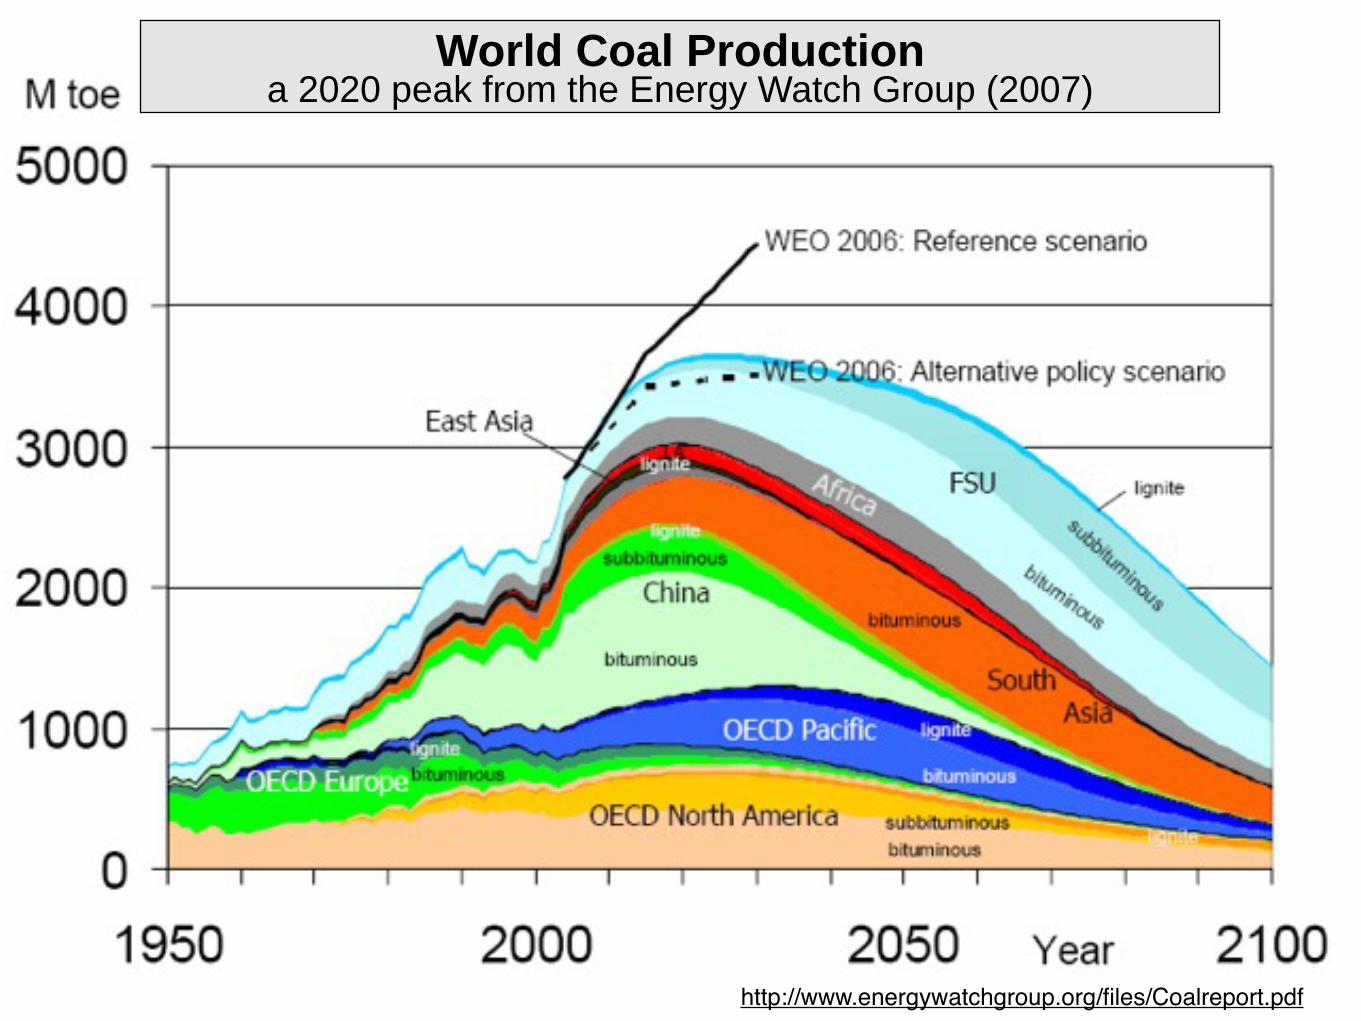
World Coal Productiona 2020 peak from the Energy Watch Group (2007)
http://www.energywatchgroup.org/files/Coalreport.pdf
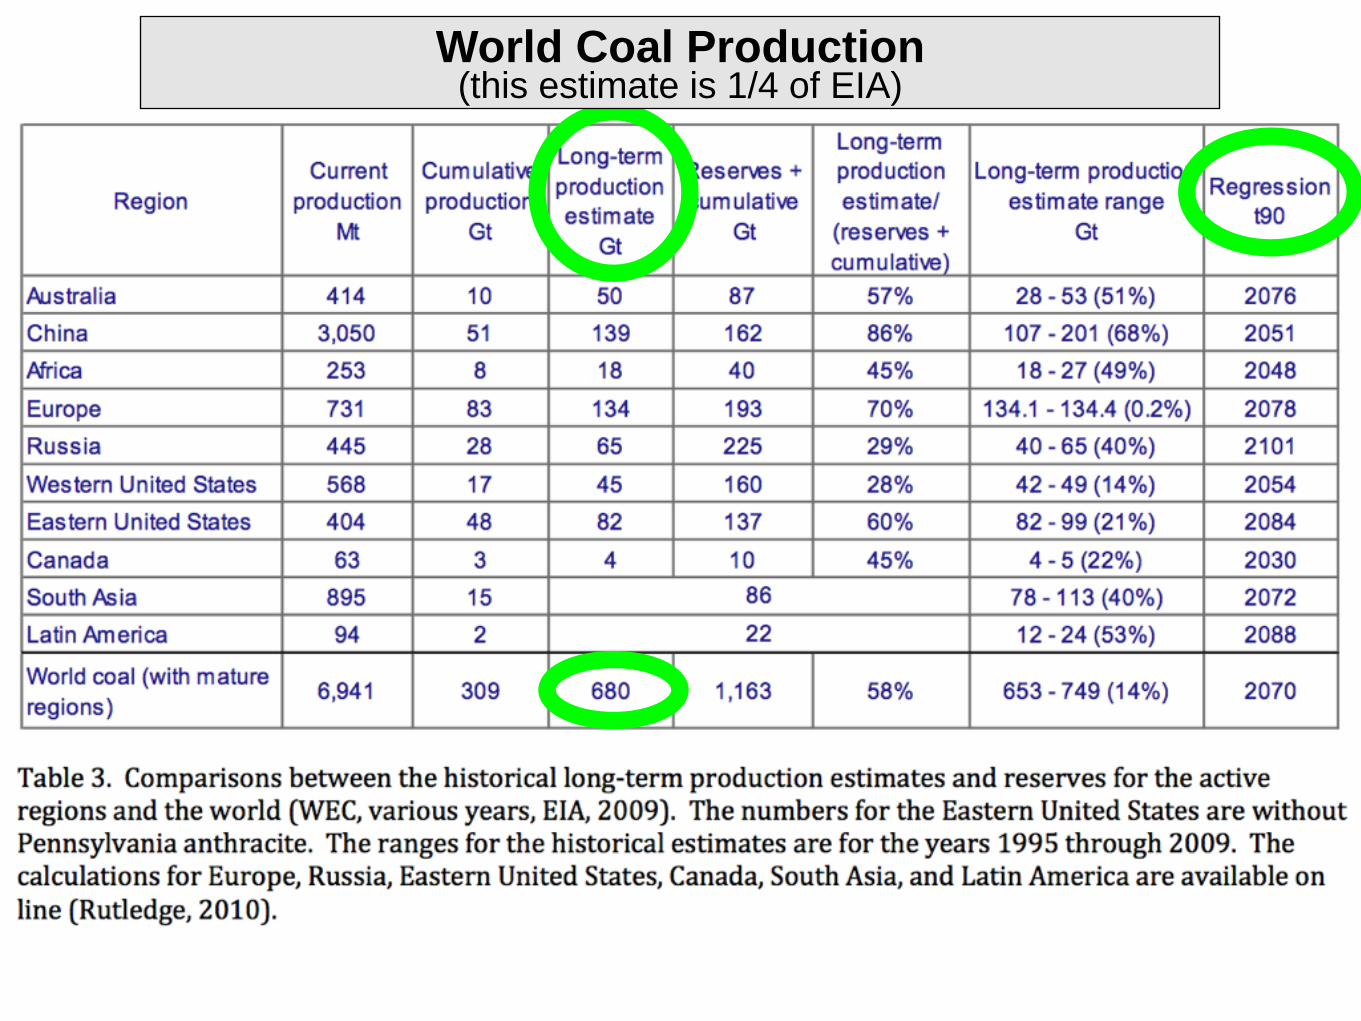
World Coal Production(this estimate is 1/4 of EIA)
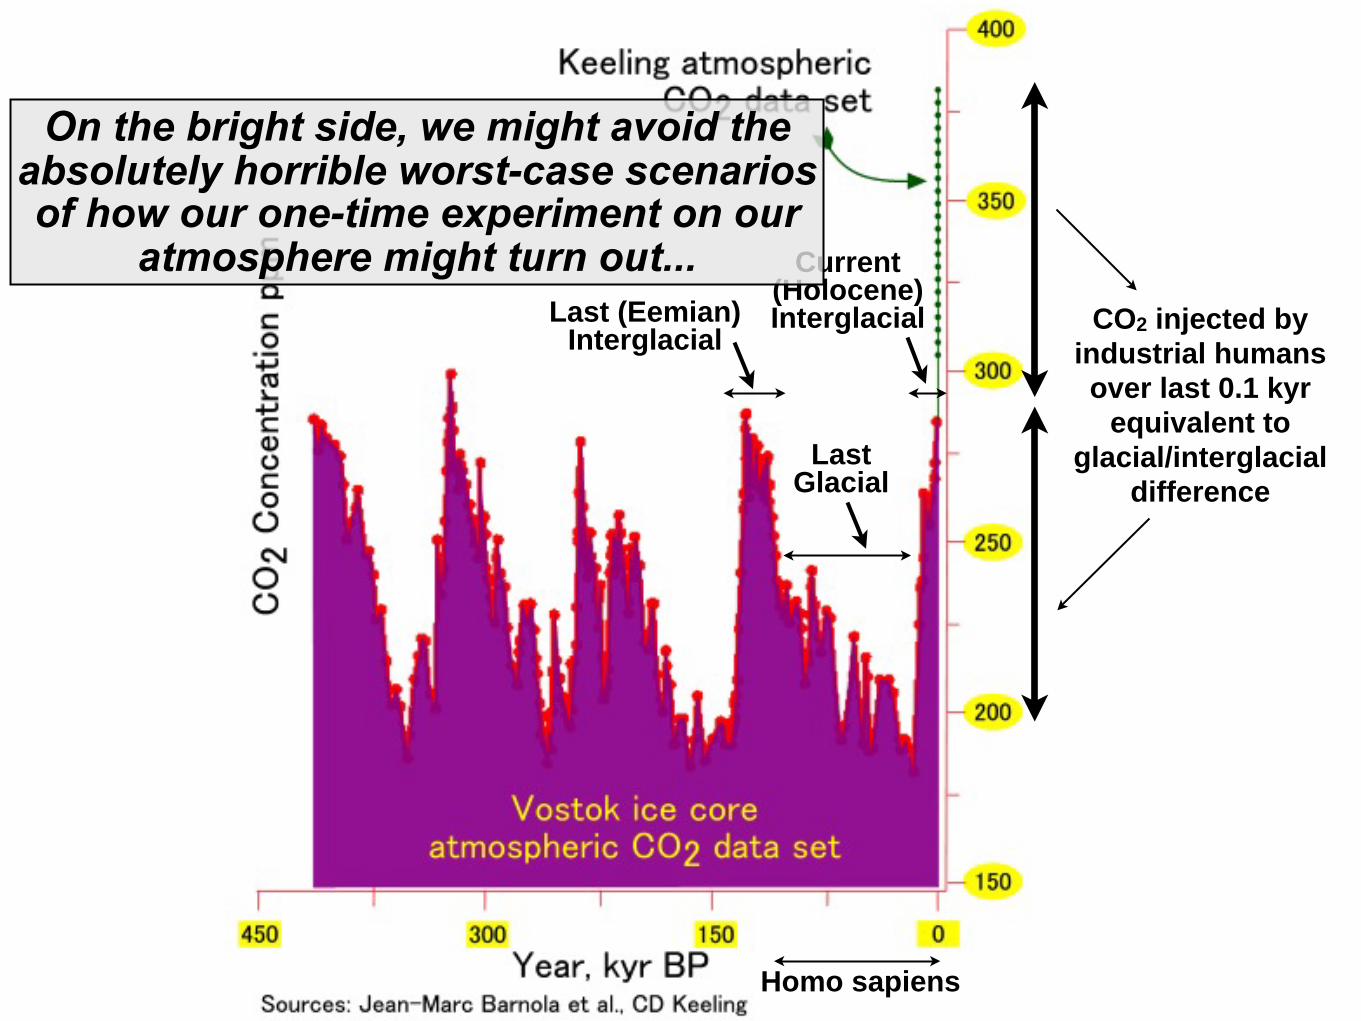
Last (Eemian)Interglacial
LastGlacial
Current (Holocene)Interglacial CO2 injected by
industrial humans over last 0.1 kyr
equivalent to glacial/interglacial
difference
Homo sapiens
On the bright side, we might avoid the absolutely horrible worst-case scenarios of how our one-time experiment on our
atmosphere might turn out...
Coal Mining & Burning (curr: 22% total US energy)
• burning coal (without carbon sequestration) generates 2X as much CO2 per unit energy as burning oil or natural gas
• coal-to-liquids and coal gasification generate more CO2 than burning the coal directly (EROEI<1.0 for both)
• carbon and mercury sequestration requires additional energy and will speed approach to EROEI=1.0
• a large number of new coal electric and coal-to-liquids plants are currently being commissioned and planned, virtually all without sequestration
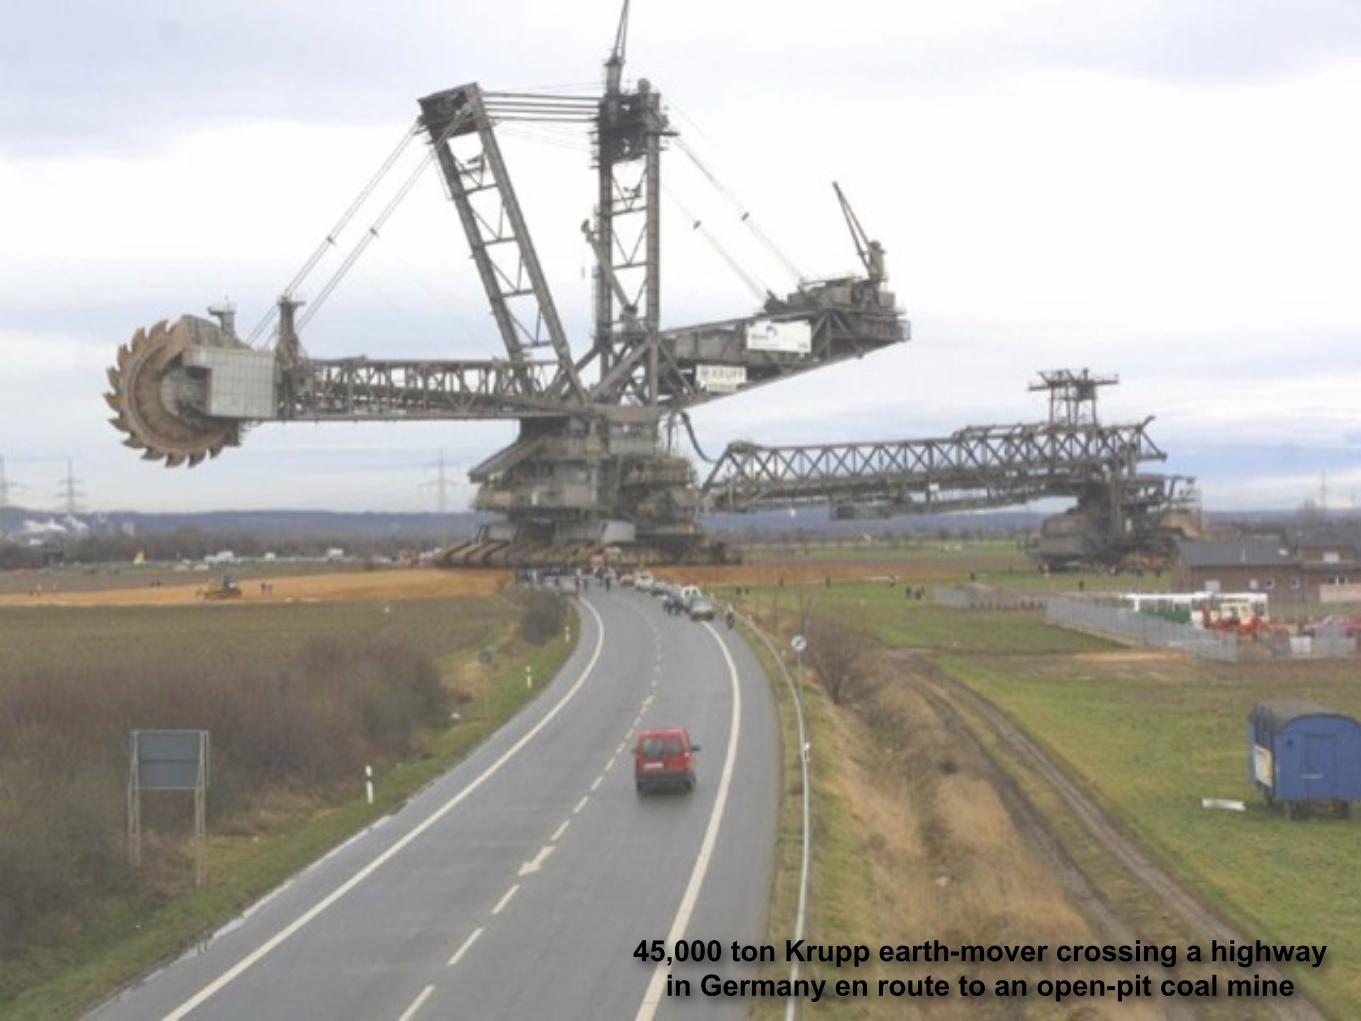
45,000 ton Krupp earth-mover crossing a highway in Germany en route to an open-pit coal mine
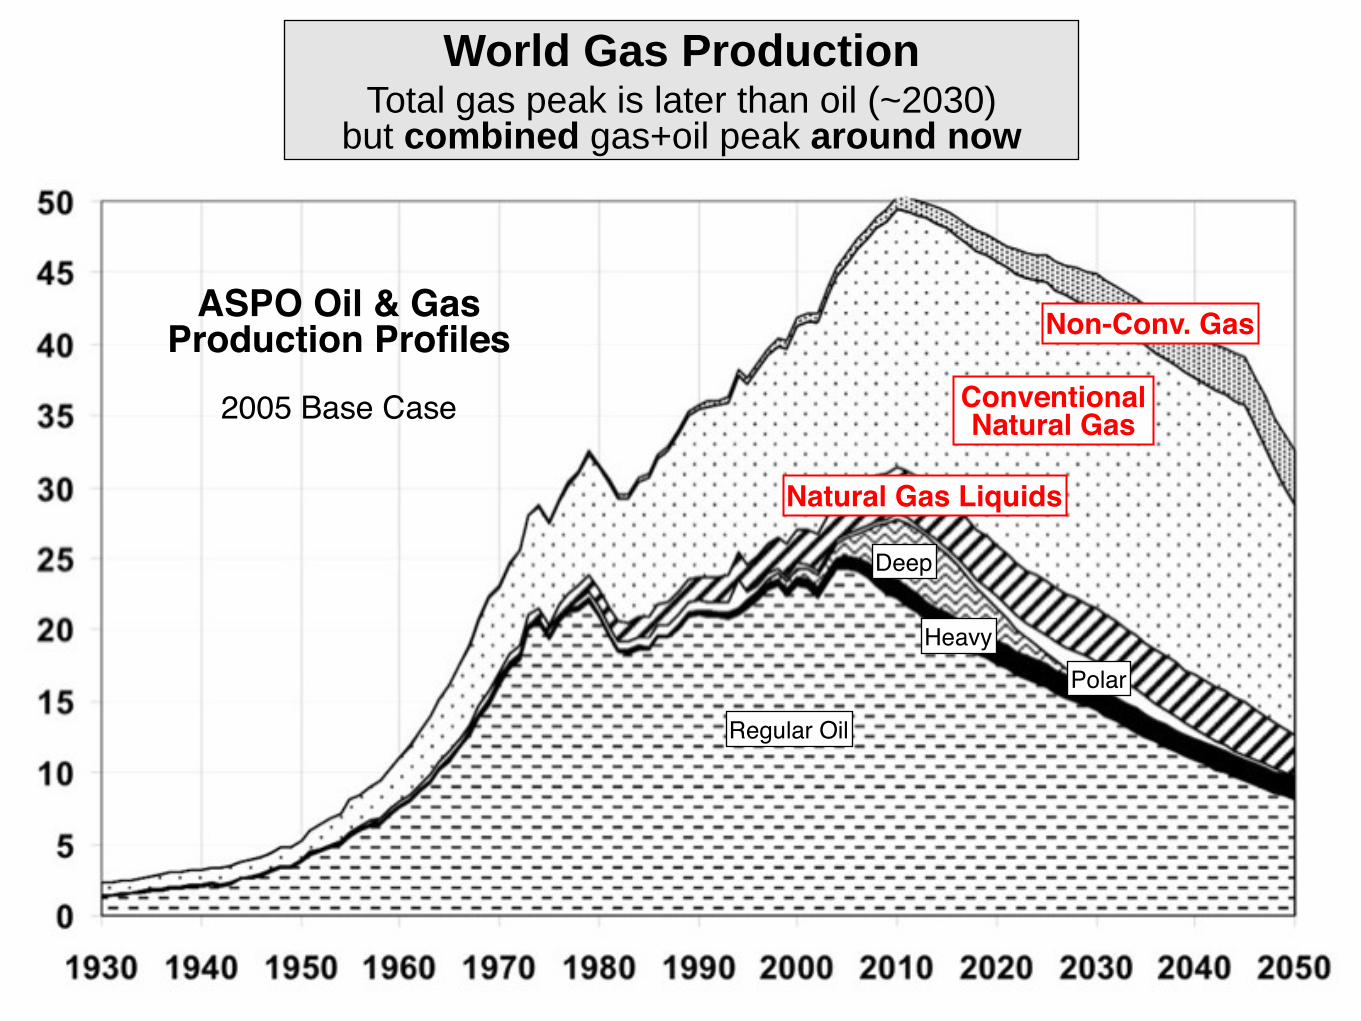
ASPO Oil & Gas Production Profiles
2005 Base Case
Regular Oil
Heavy
Deep
Natural Gas Liquids
ConventionalNatural Gas
Polar
Non-Conv. Gas
World Gas ProductionTotal gas peak is later than oil (~2030)
but combined gas+oil peak around now
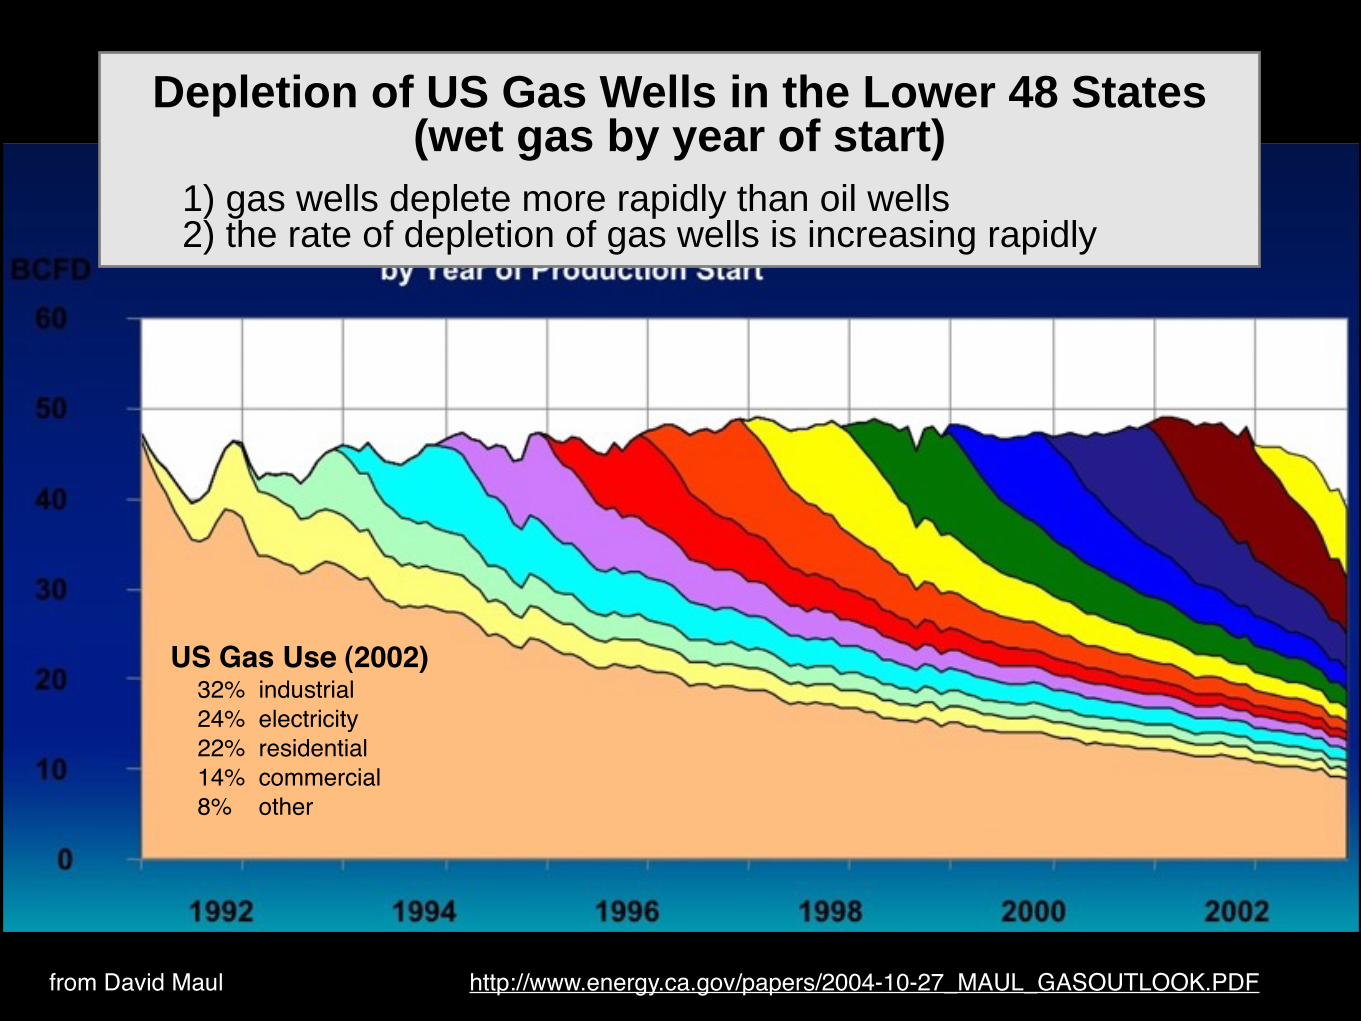
Depletion of US Gas Wells in the Lower 48 States (wet gas by year of start)
1) gas wells deplete more rapidly than oil wells2) the rate of depletion of gas wells is increasing rapidly
http://www.energy.ca.gov/papers/2004-10-27_MAUL_GASOUTLOOK.PDFfrom David Maul
US Gas Use (2002)32% industrial24% electricity22% residential14% commercial8% other
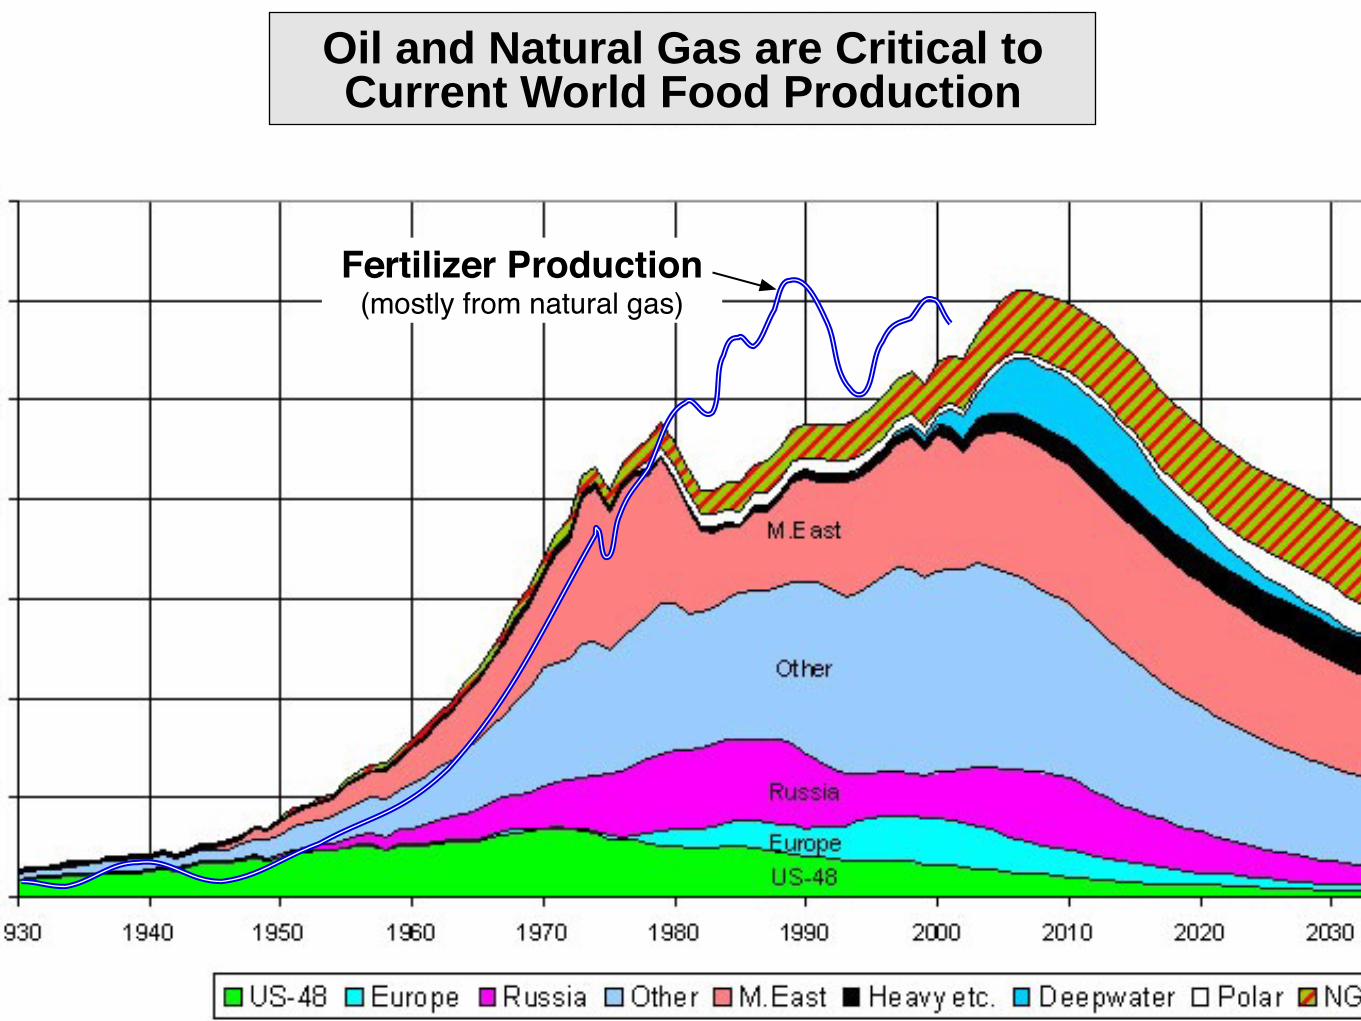
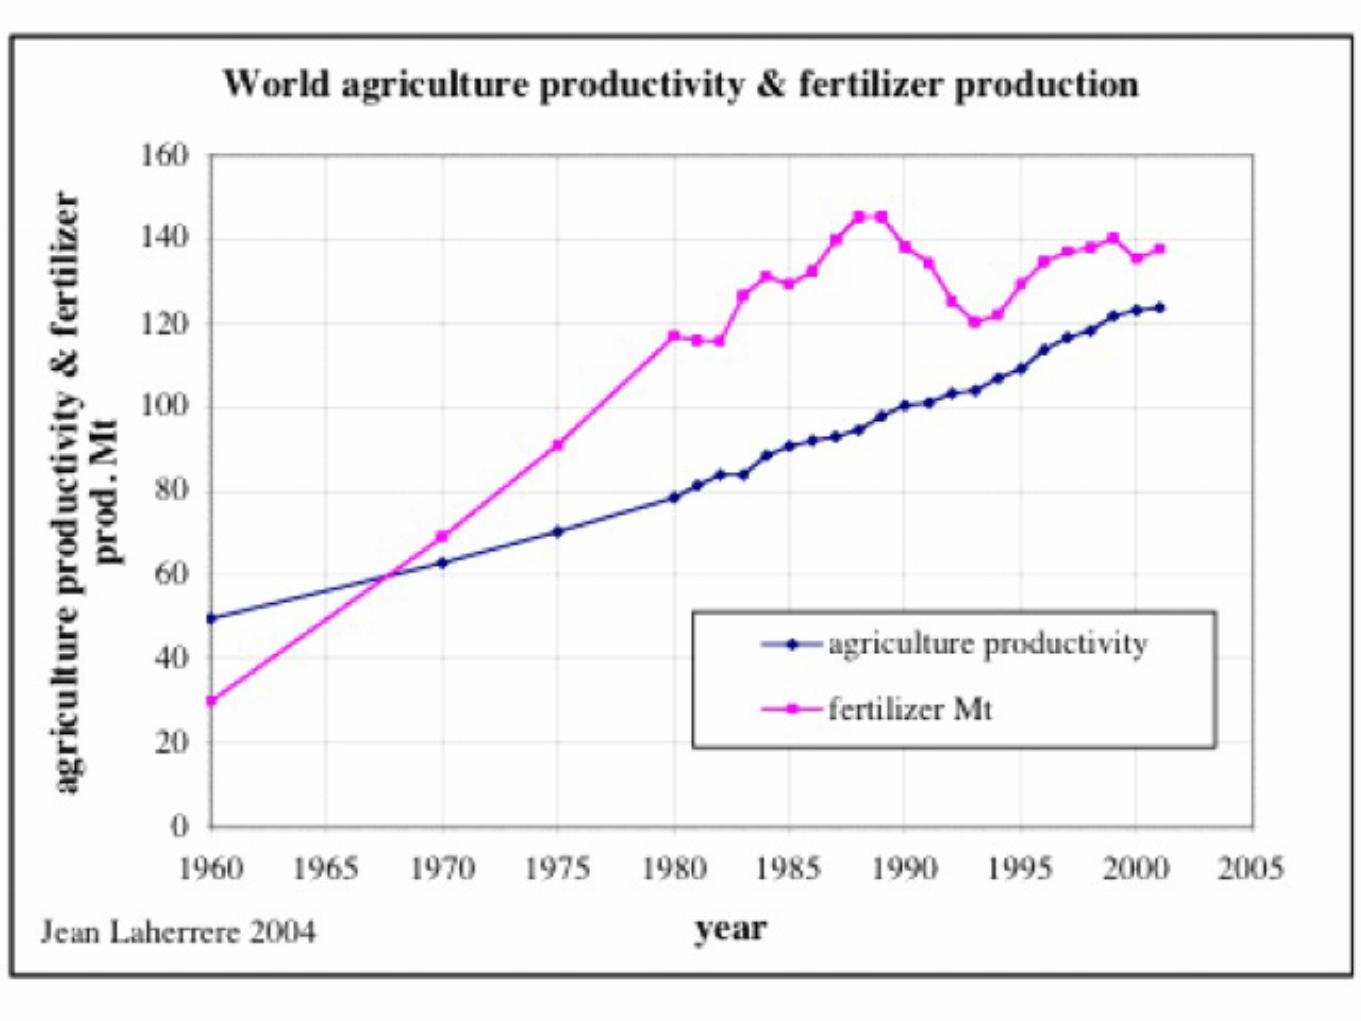
Fertilizer Production(mostly from natural gas)
Oil and Natural Gas are Critical to Current World Food Production
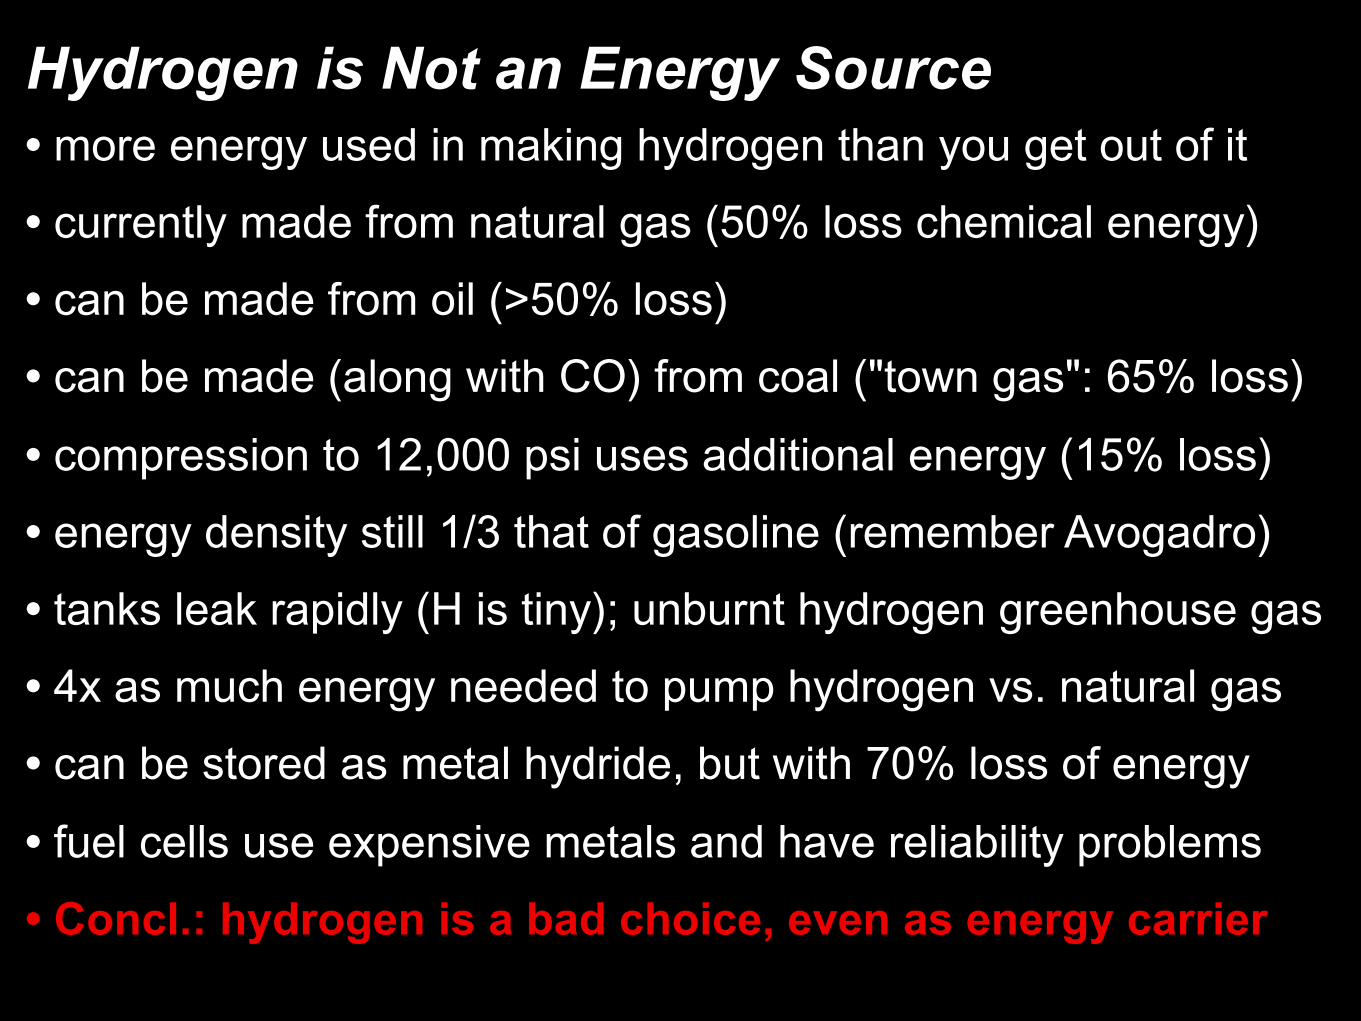
Hydrogen is Not an Energy Source• more energy used in making hydrogen than you get out of it
• currently made from natural gas (50% loss chemical energy)
• can be made from oil (>50% loss)
• can be made (along with CO) from coal ("town gas": 65% loss)
• compression to 12,000 psi uses additional energy (15% loss)
• energy density still 1/3 that of gasoline (remember Avogadro)
• tanks leak rapidly (H is tiny); unburnt hydrogen greenhouse gas
• 4x as much energy needed to pump hydrogen vs. natural gas
• can be stored as metal hydride, but with 70% loss of energy
• fuel cells use expensive metals and have reliability problems
• Concl.: hydrogen is a bad choice, even as energy carrier
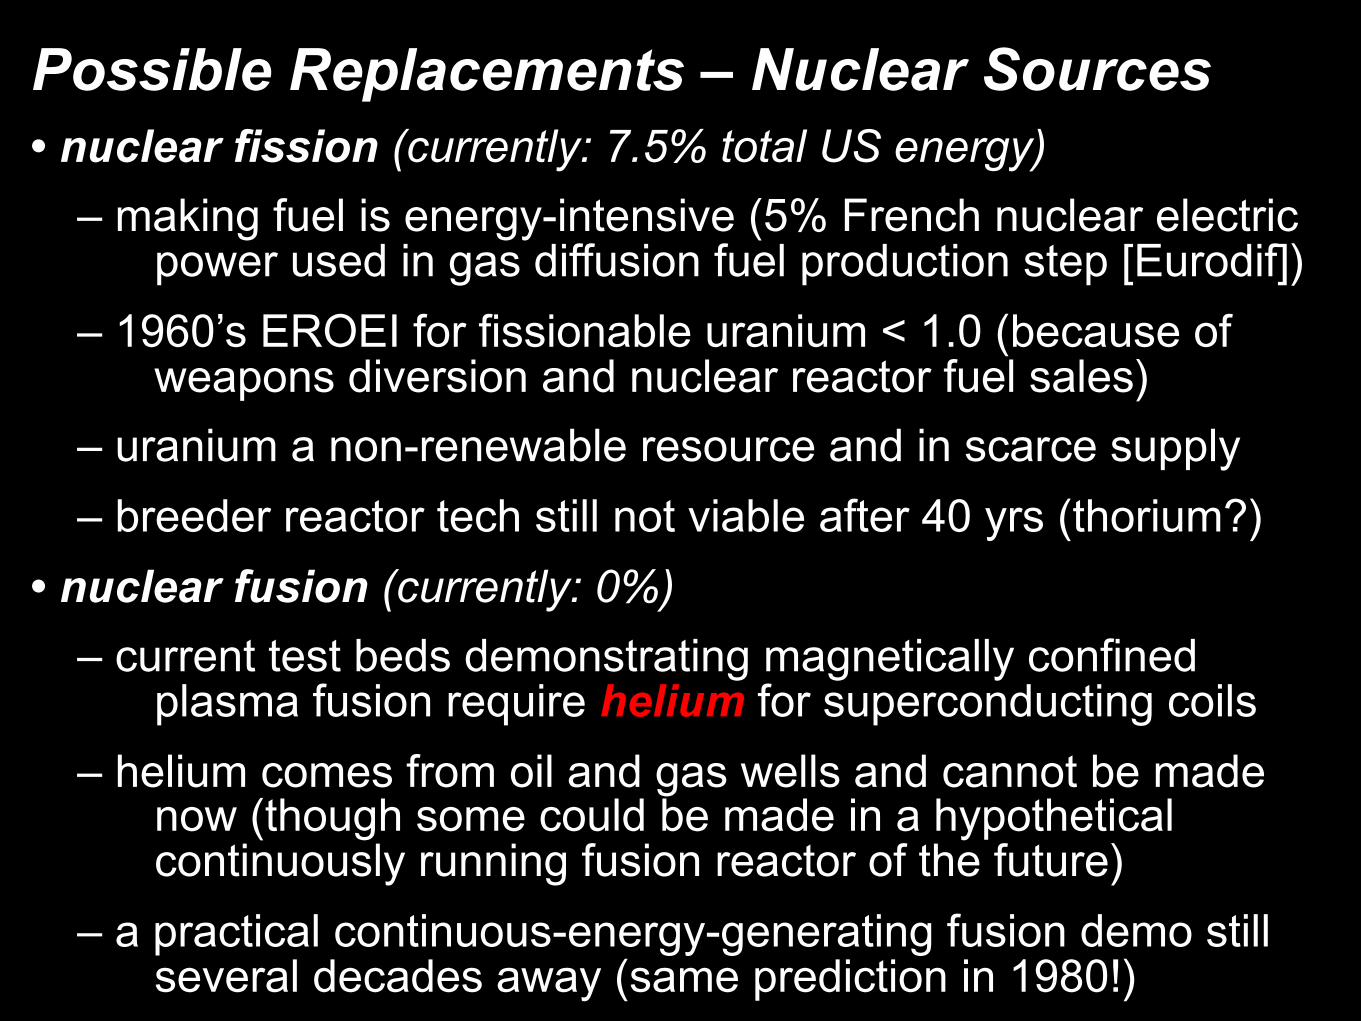
Possible Replacements – Nuclear Sources• nuclear fission (currently: 7.5% total US energy)
– making fuel is energy-intensive (5% French nuclear electric power used in gas diffusion fuel production step [Eurodif])
– 1960’s EROEI for fissionable uranium < 1.0 (because of weapons diversion and nuclear reactor fuel sales)
– uranium a non-renewable resource and in scarce supply
– breeder reactor tech still not viable after 40 yrs (thorium?)
• nuclear fusion (currently: 0%)
– current test beds demonstrating magnetically confined plasma fusion require helium for superconducting coils
– helium comes from oil and gas wells and cannot be made now (though some could be made in a hypothetical continuously running fusion reactor of the future)
– a practical continuous-energy-generating fusion demo still several decades away (same prediction in 1980!)
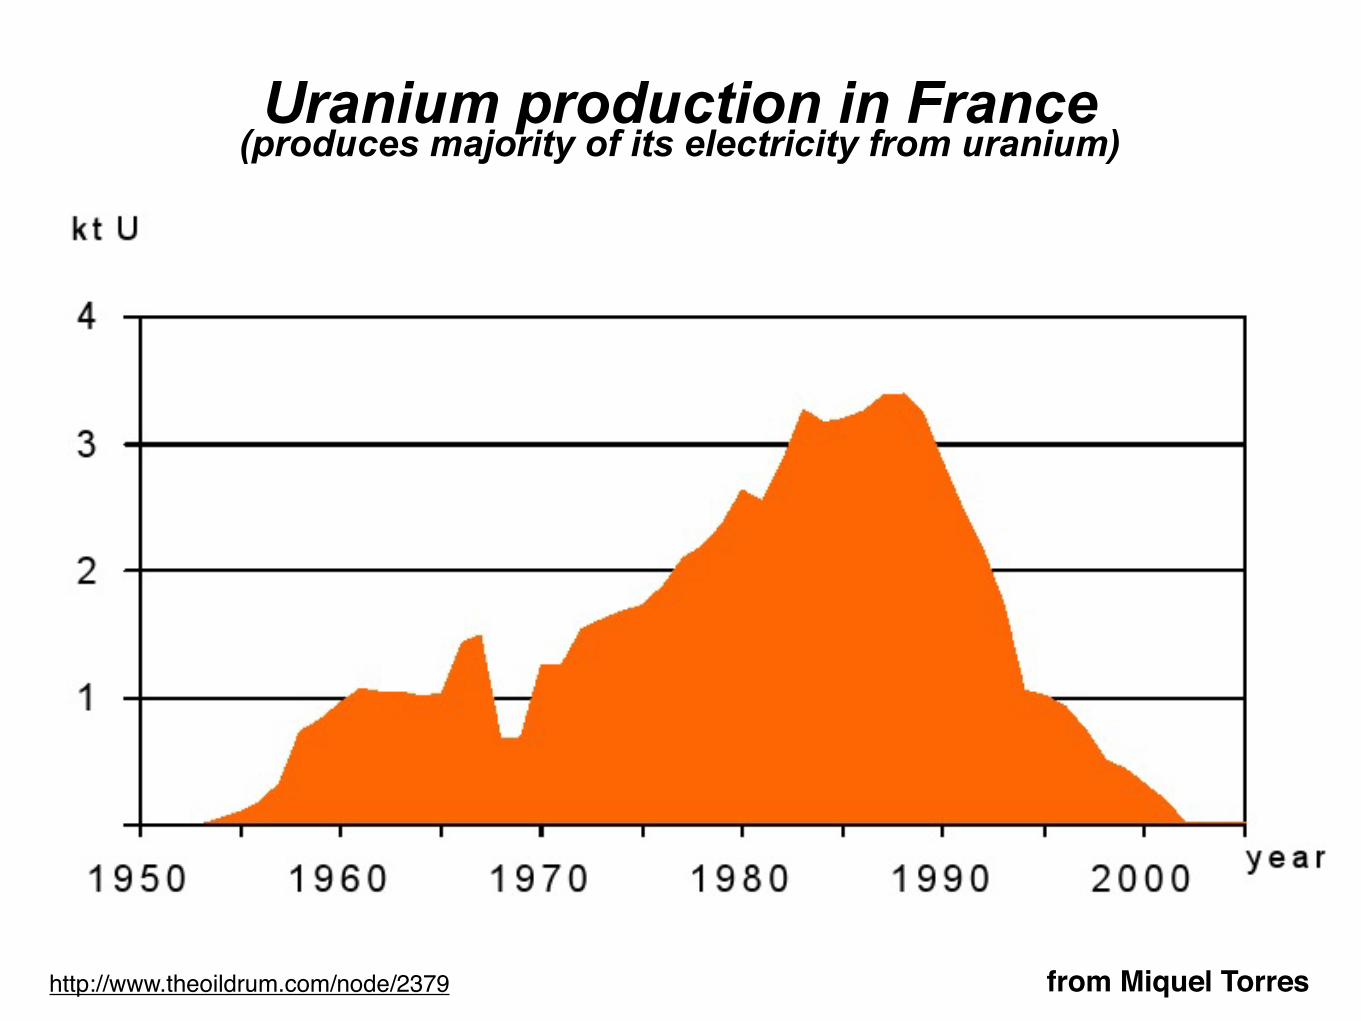
Uranium production in France (produces majority of its electricity from uranium)
http://www.theoildrum.com/node/2379 from Miquel Torres
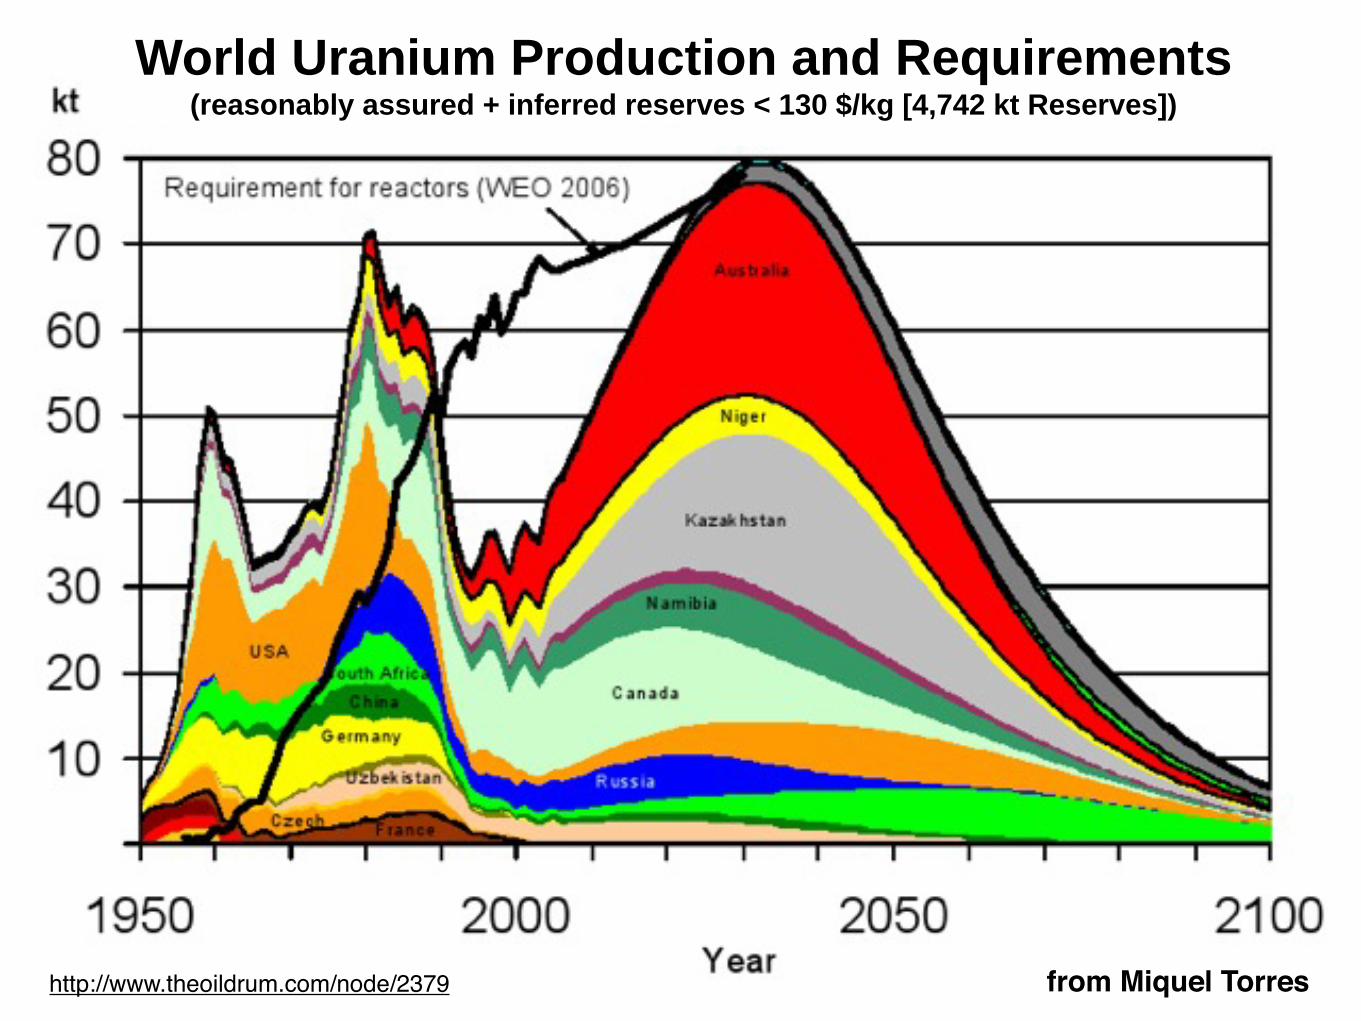
http://www.theoildrum.com/node/2379 from Miquel Torres
World Uranium Production and Requirements(reasonably assured + inferred reserves < 130 $/kg [4,742 kt Reserves])
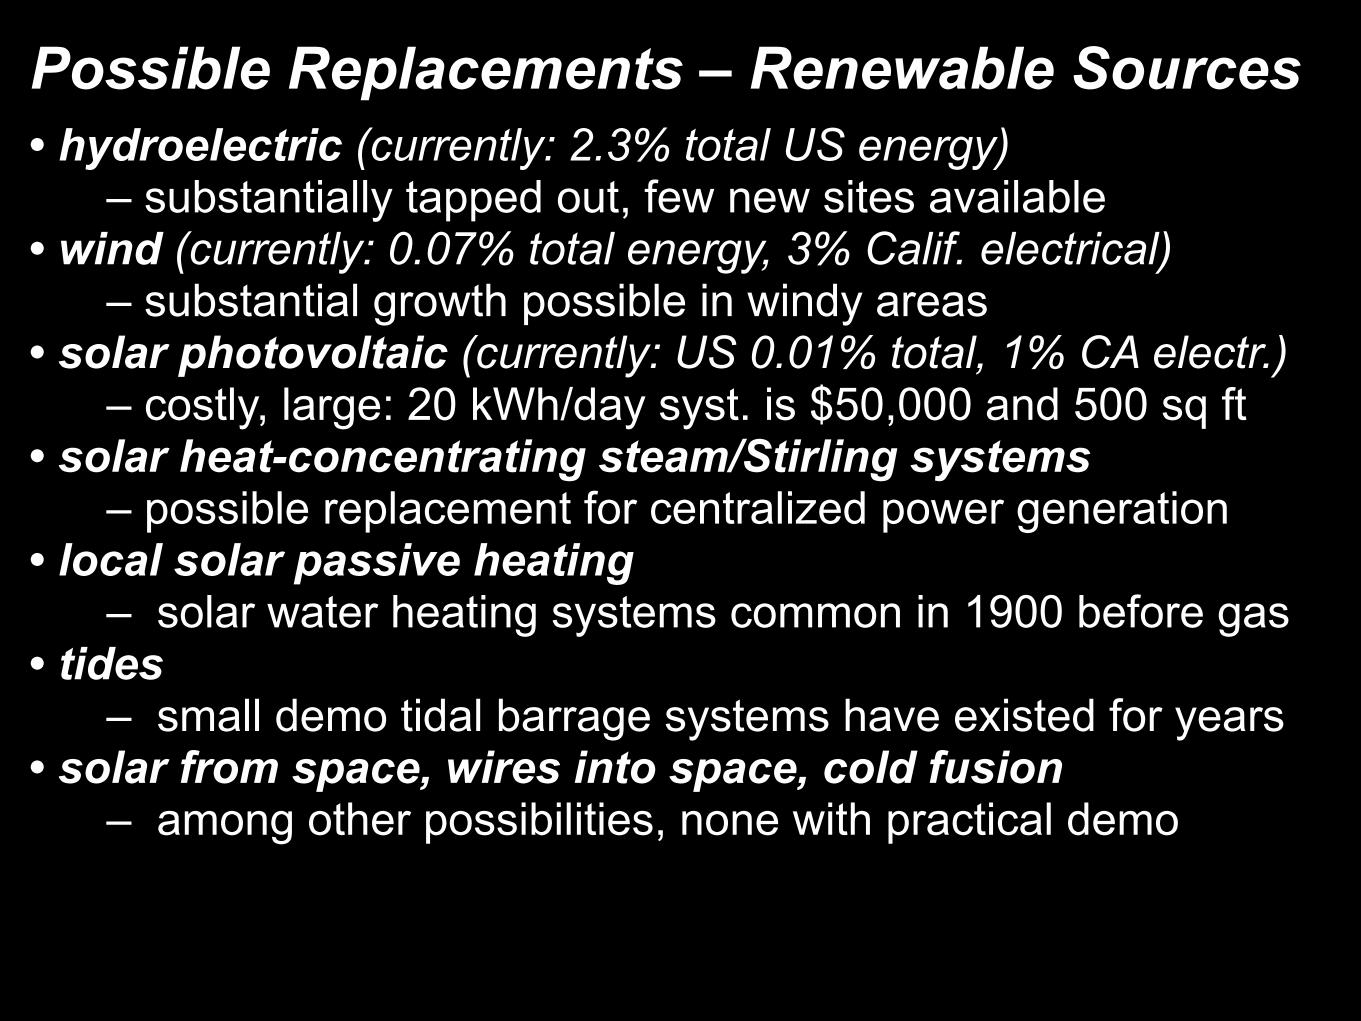
Possible Replacements – Renewable Sources• hydroelectric (currently: 2.3% total US energy) – substantially tapped out, few new sites available• wind (currently: 0.07% total energy, 3% Calif. electrical) – substantial growth possible in windy areas• solar photovoltaic (currently: US 0.01% total, 1% CA electr.) – costly, large: 20 kWh/day syst. is $50,000 and 500 sq ft• solar heat-concentrating steam/Stirling systems – possible replacement for centralized power generation• local solar passive heating – solar water heating systems common in 1900 before gas• tides – small demo tidal barrage systems have existed for years• solar from space, wires into space, cold fusion – among other possibilities, none with practical demo
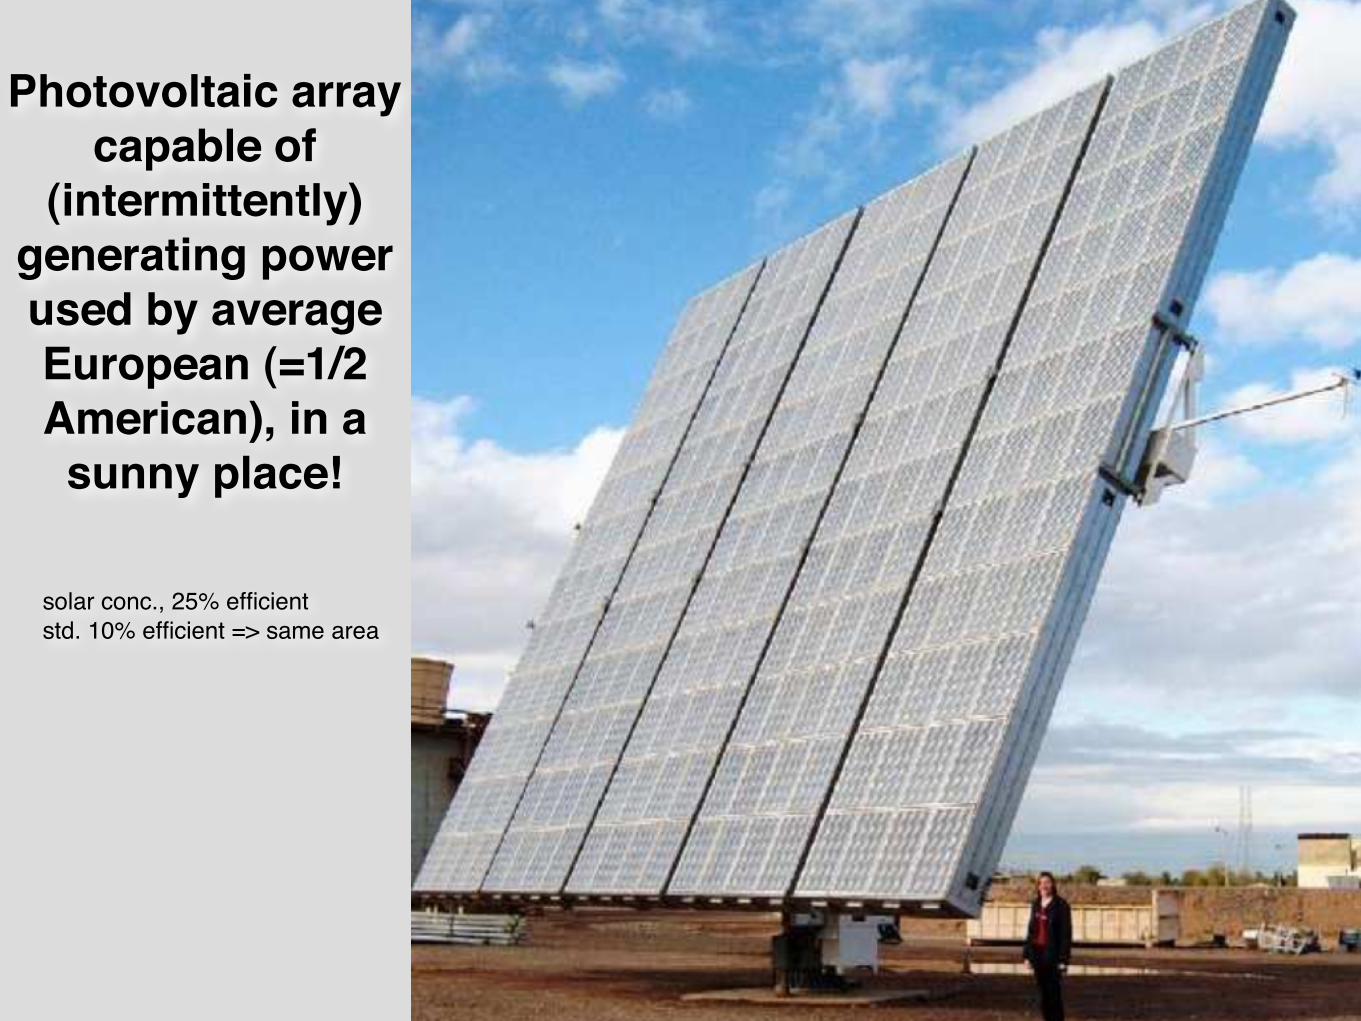
Photovoltaic array capable of
(intermittently)generating power used by average European (=1/2 American), in a sunny place!
solar conc., 25% efficientstd. 10% efficient => same area
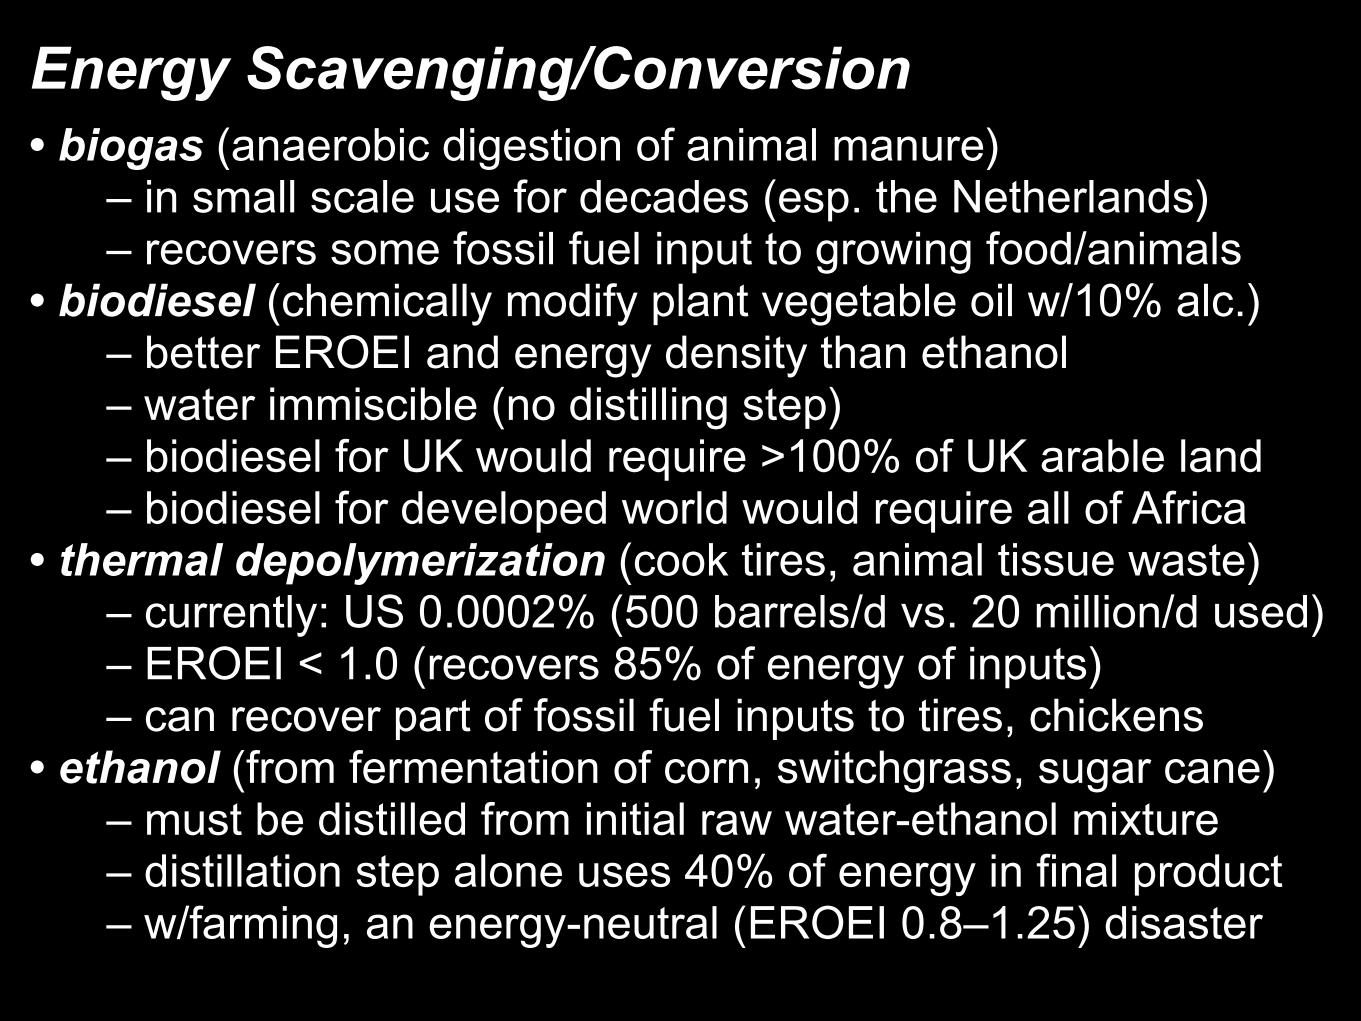
Energy Scavenging/Conversion• biogas (anaerobic digestion of animal manure) – in small scale use for decades (esp. the Netherlands) – recovers some fossil fuel input to growing food/animals• biodiesel (chemically modify plant vegetable oil w/10% alc.) – better EROEI and energy density than ethanol – water immiscible (no distilling step) – biodiesel for UK would require >100% of UK arable land – biodiesel for developed world would require all of Africa• thermal depolymerization (cook tires, animal tissue waste) – currently: US 0.0002% (500 barrels/d vs. 20 million/d used) – EROEI < 1.0 (recovers 85% of energy of inputs) – can recover part of fossil fuel inputs to tires, chickens• ethanol (from fermentation of corn, switchgrass, sugar cane) – must be distilled from initial raw water-ethanol mixture – distillation step alone uses 40% of energy in final product – w/farming, an energy-neutral (EROEI 0.8–1.25) disaster
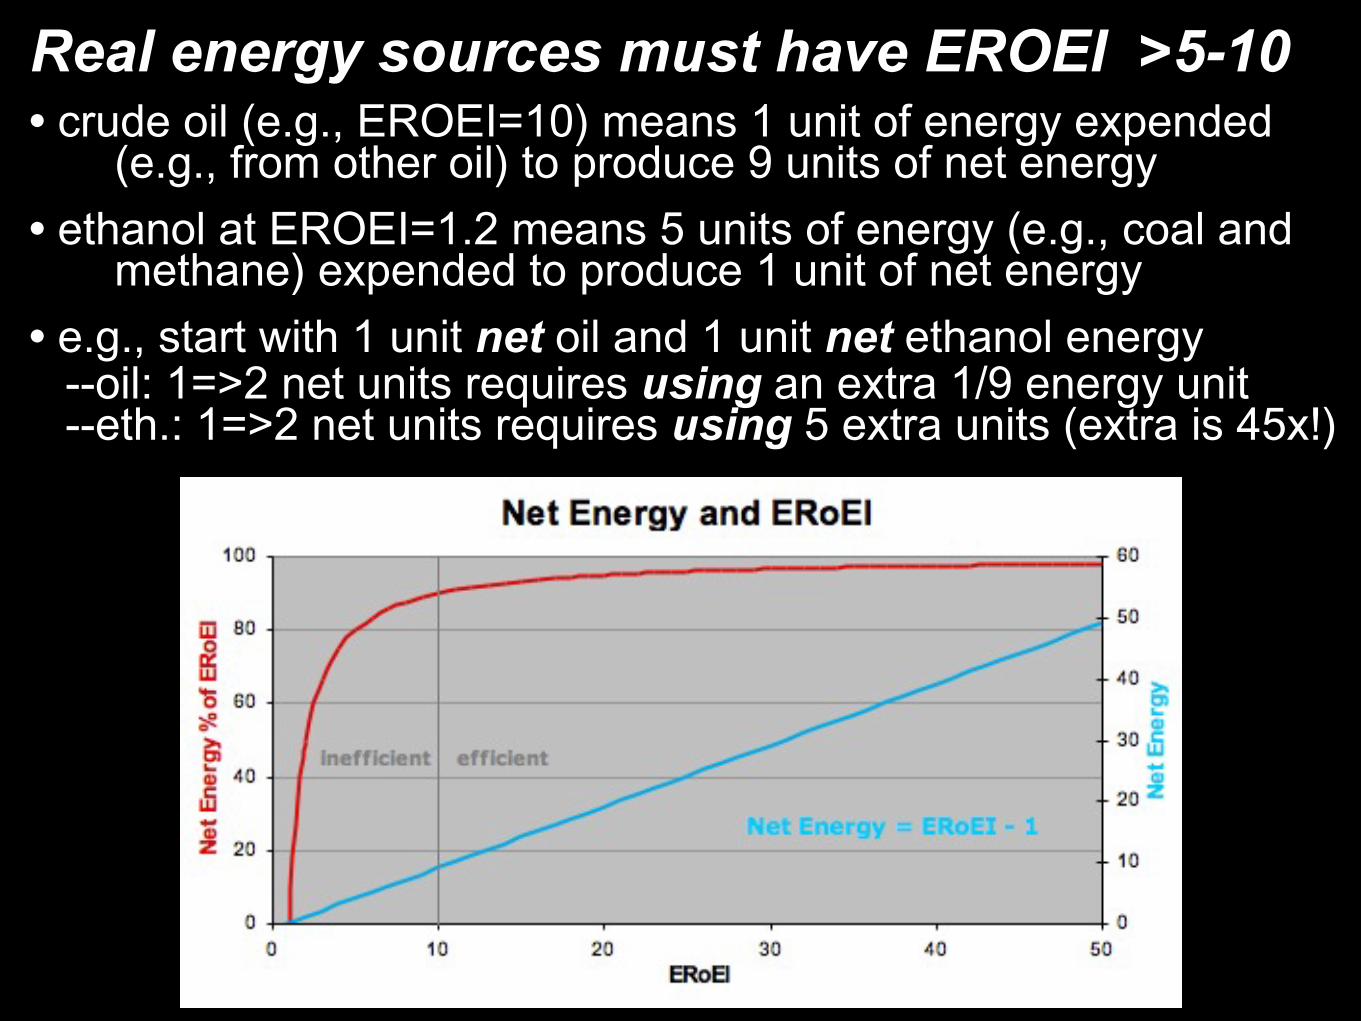
Real energy sources must have EROEI >5-10• crude oil (e.g., EROEI=10) means 1 unit of energy expended
(e.g., from other oil) to produce 9 units of net energy
• ethanol at EROEI=1.2 means 5 units of energy (e.g., coal and methane) expended to produce 1 unit of net energy
• e.g., start with 1 unit net oil and 1 unit net ethanol energy--oil: 1=>2 net units requires using an extra 1/9 energy unit--eth.: 1=>2 net units requires using 5 extra units (extra is 45x!)
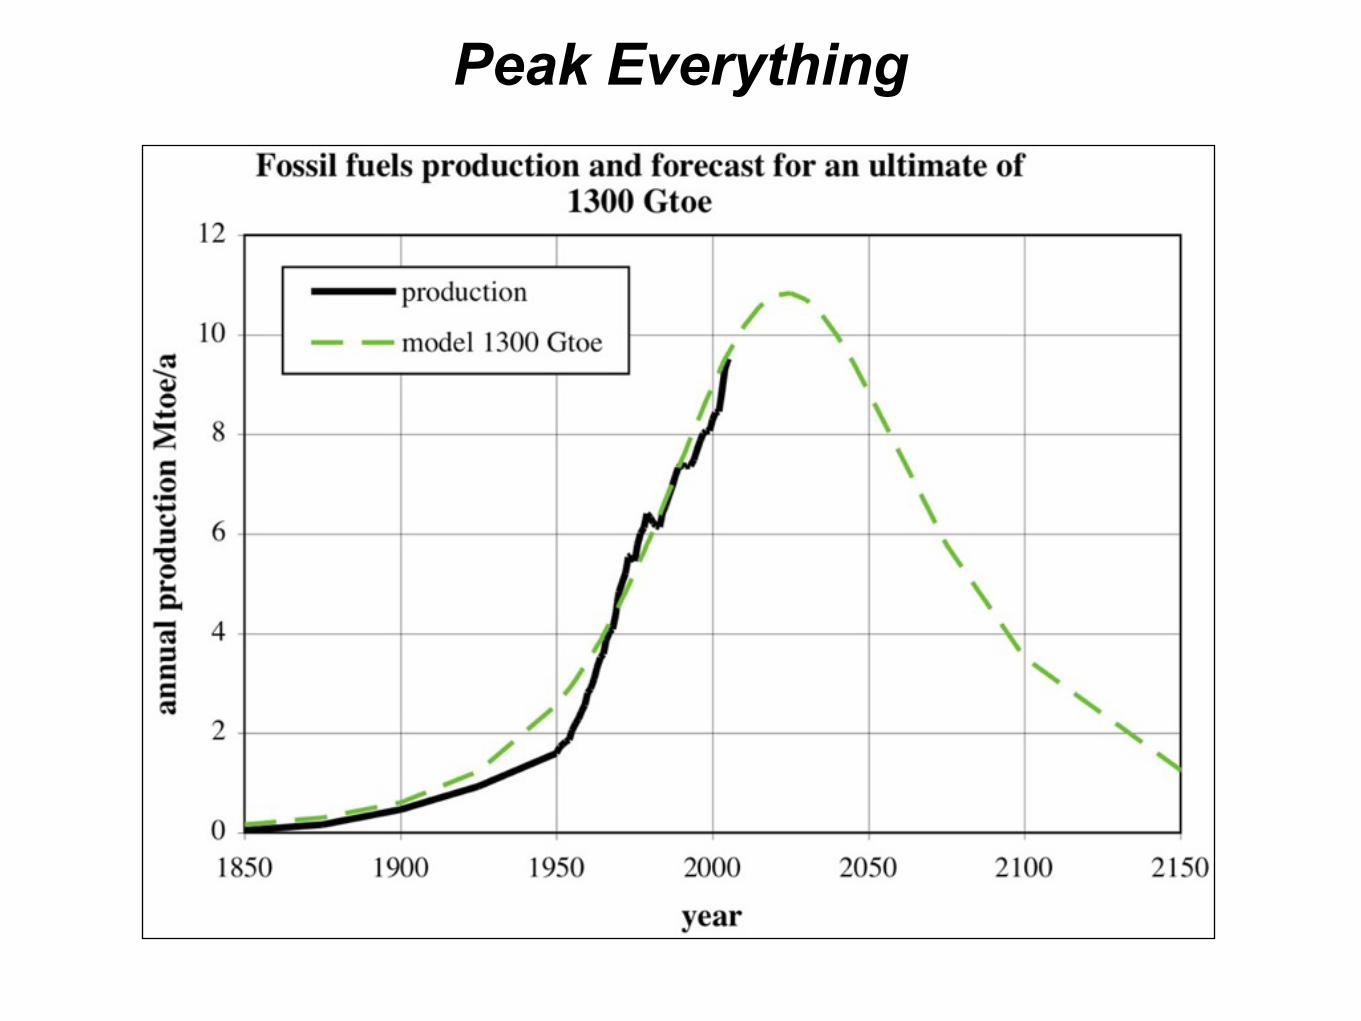
Peak Everything
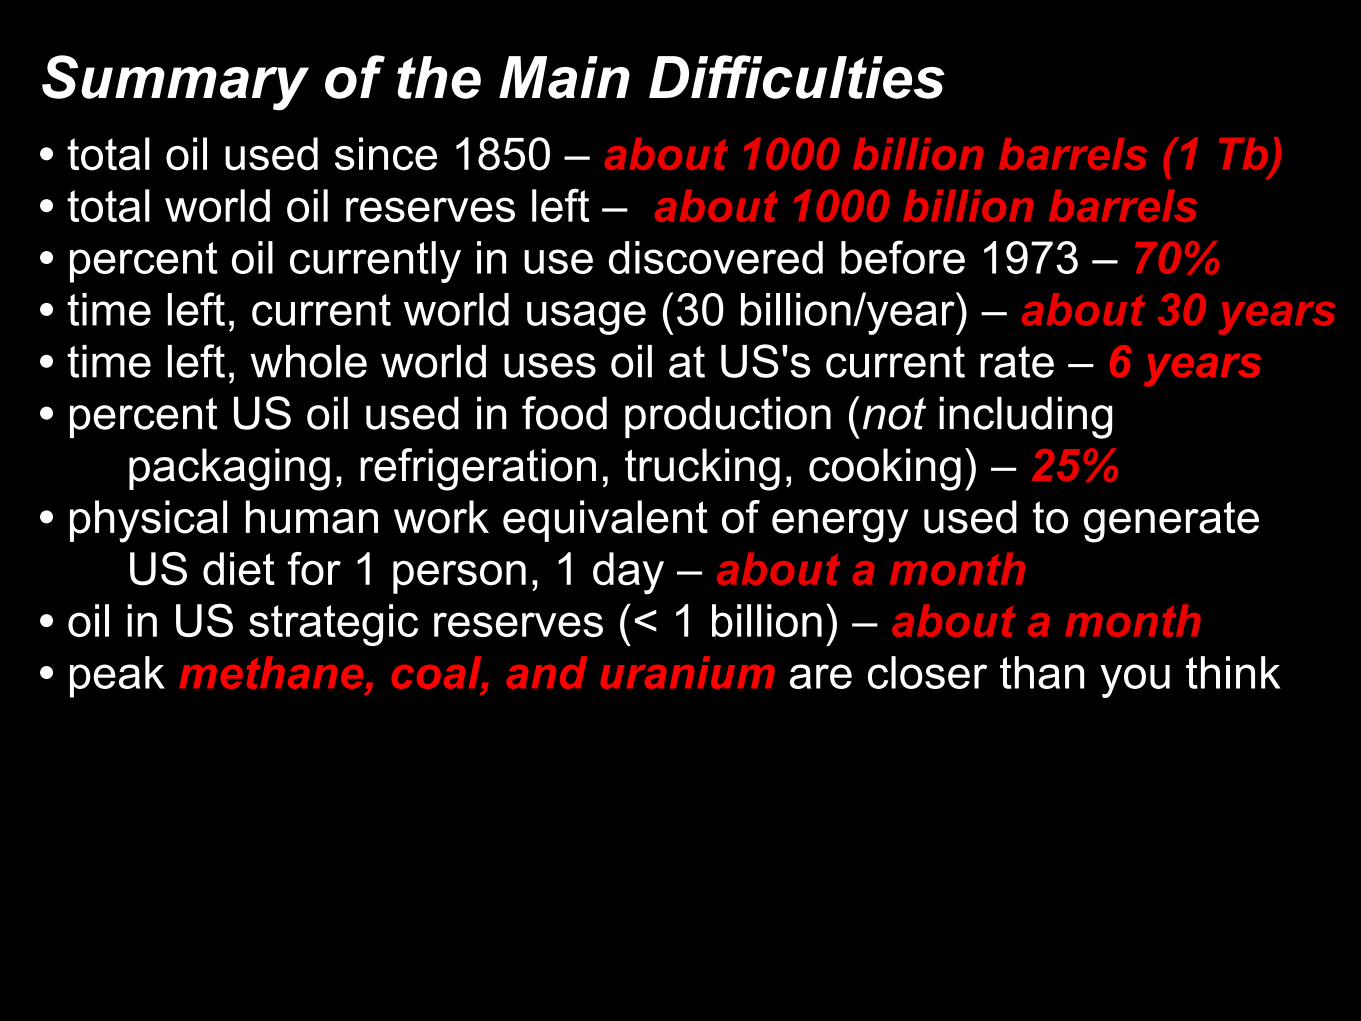
Summary of the Main Difficulties• total oil used since 1850 – about 1000 billion barrels (1 Tb)• total world oil reserves left – about 1000 billion barrels• percent oil currently in use discovered before 1973 – 70%• time left, current world usage (30 billion/year) – about 30 years• time left, whole world uses oil at US's current rate – 6 years• percent US oil used in food production (not including packaging, refrigeration, trucking, cooking) – 25%• physical human work equivalent of energy used to generate US diet for 1 person, 1 day – about a month• oil in US strategic reserves (< 1 billion) – about a month• peak methane, coal, and uranium are closer than you think
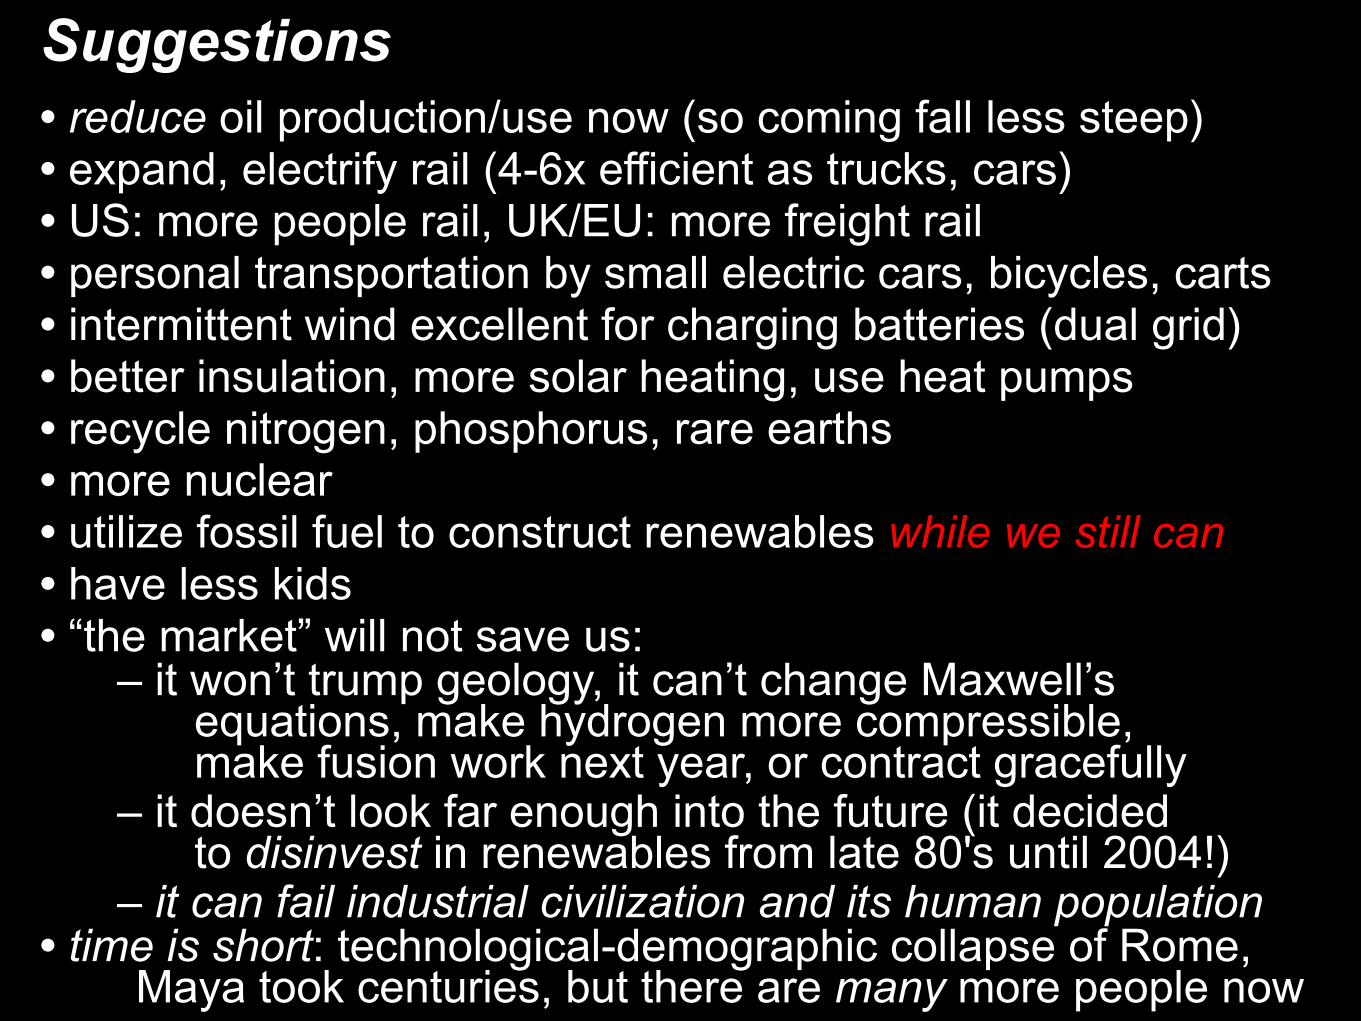
Suggestions• reduce oil production/use now (so coming fall less steep)• expand, electrify rail (4-6x efficient as trucks, cars)• US: more people rail, UK/EU: more freight rail• personal transportation by small electric cars, bicycles, carts• intermittent wind excellent for charging batteries (dual grid)• better insulation, more solar heating, use heat pumps• recycle nitrogen, phosphorus, rare earths• more nuclear• utilize fossil fuel to construct renewables while we still can• have less kids• “the market” will not save us: – it won’t trump geology, it can’t change Maxwell’s equations, make hydrogen more compressible, make fusion work next year, or contract gracefully – it doesn’t look far enough into the future (it decided to disinvest in renewables from late 80's until 2004!) – it can fail industrial civilization and its human population• time is short: technological-demographic collapse of Rome,
Maya took centuries, but there are many more people now
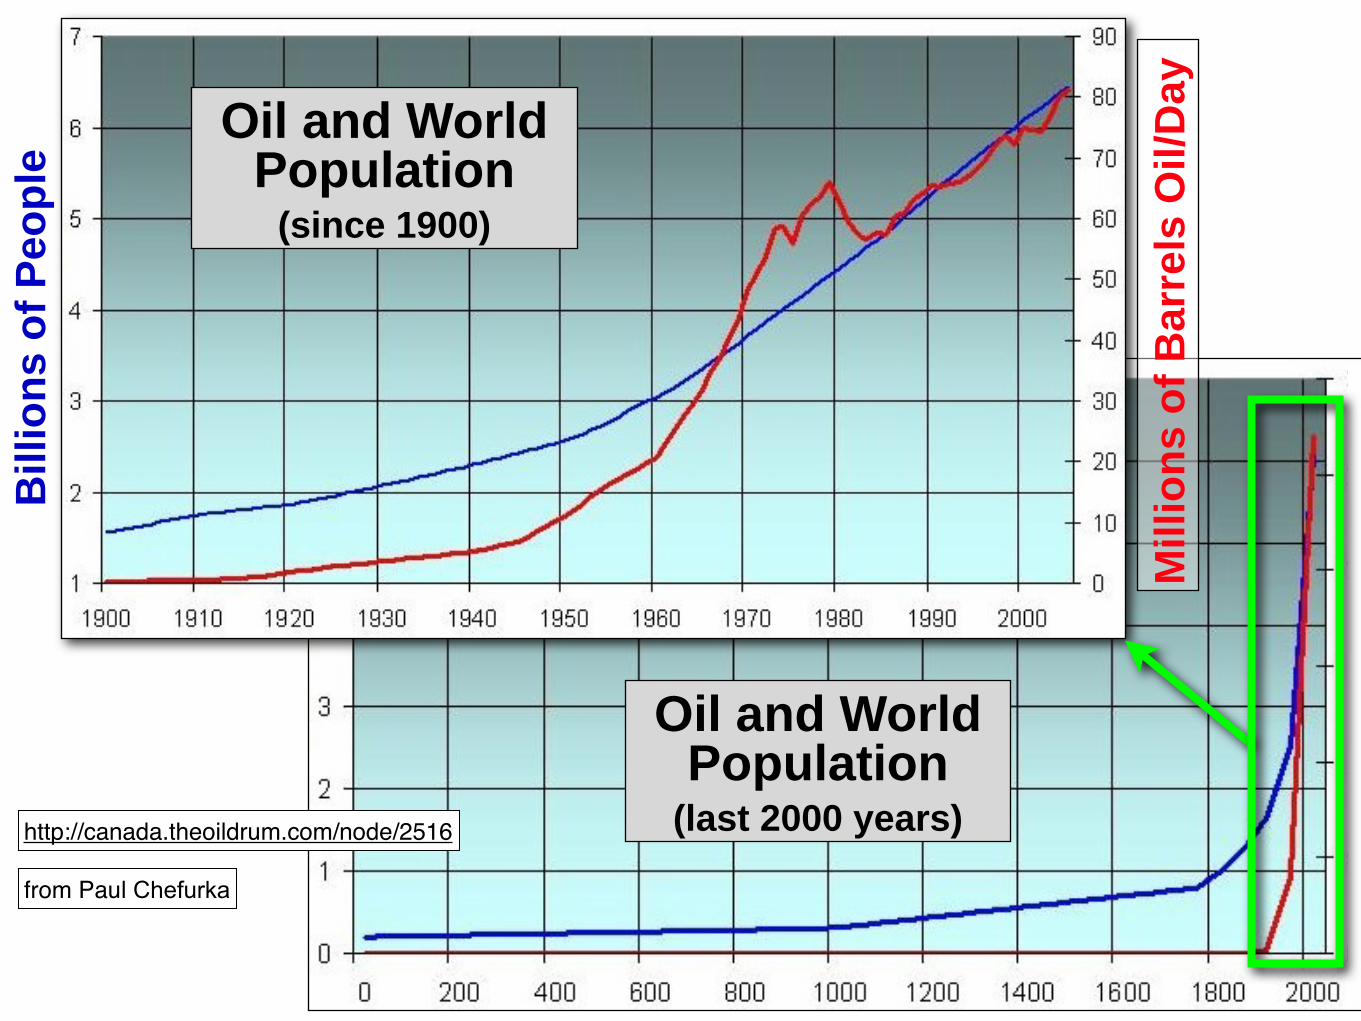
Oil and World Population
(since 1900)
Bill
ion
s o
f P
eop
le
Mill
ion
s o
f B
arre
ls O
il/D
ay
http://canada.theoildrum.com/node/2516
from Paul Chefurka
Oil and World Population
(last 2000 years)
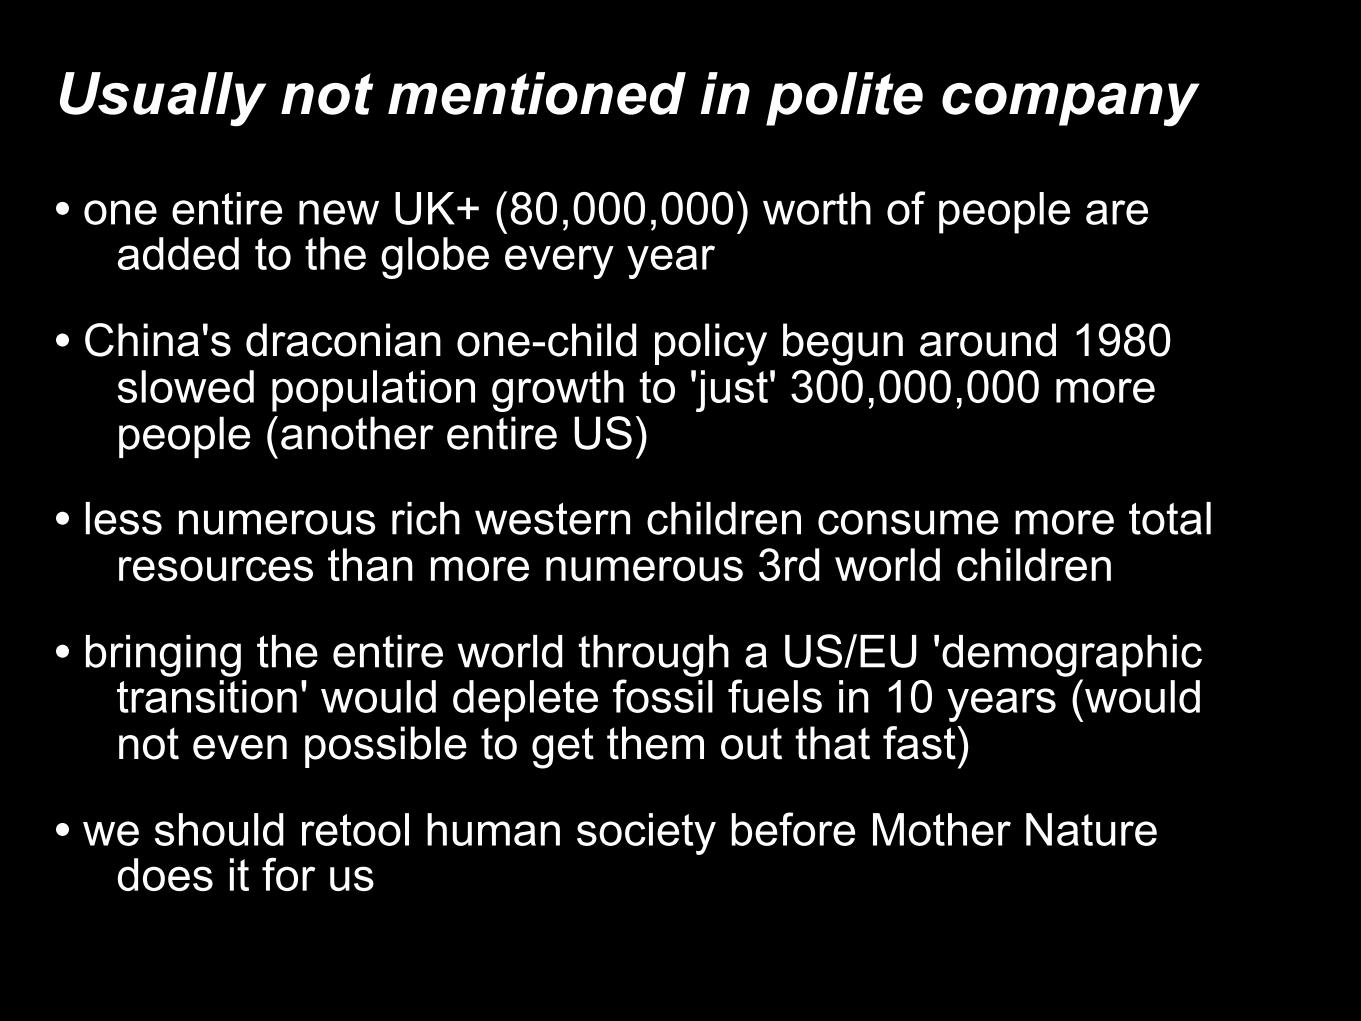
Usually not mentioned in polite company
• one entire new UK+ (80,000,000) worth of people are added to the globe every year
• China's draconian one-child policy begun around 1980 slowed population growth to 'just' 300,000,000 more people (another entire US)
• less numerous rich western children consume more total resources than more numerous 3rd world children
• bringing the entire world through a US/EU 'demographic transition' would deplete fossil fuels in 10 years (would not even possible to get them out that fast)
• we should retool human society before Mother Nature does it for us
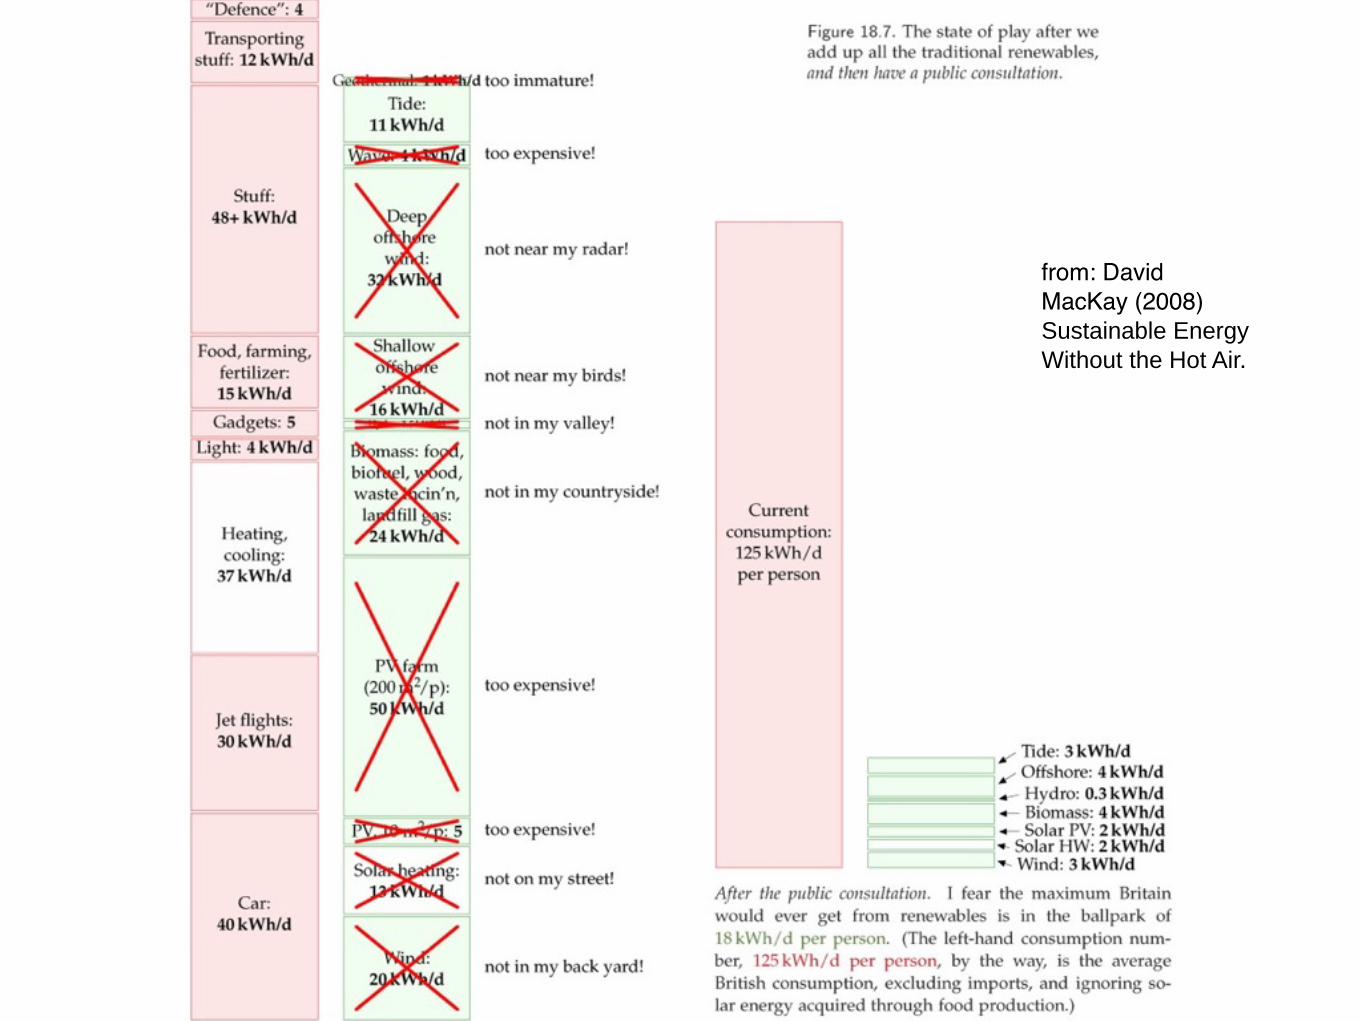
from: David MacKay (2008) Sustainable Energy Without the Hot Air.
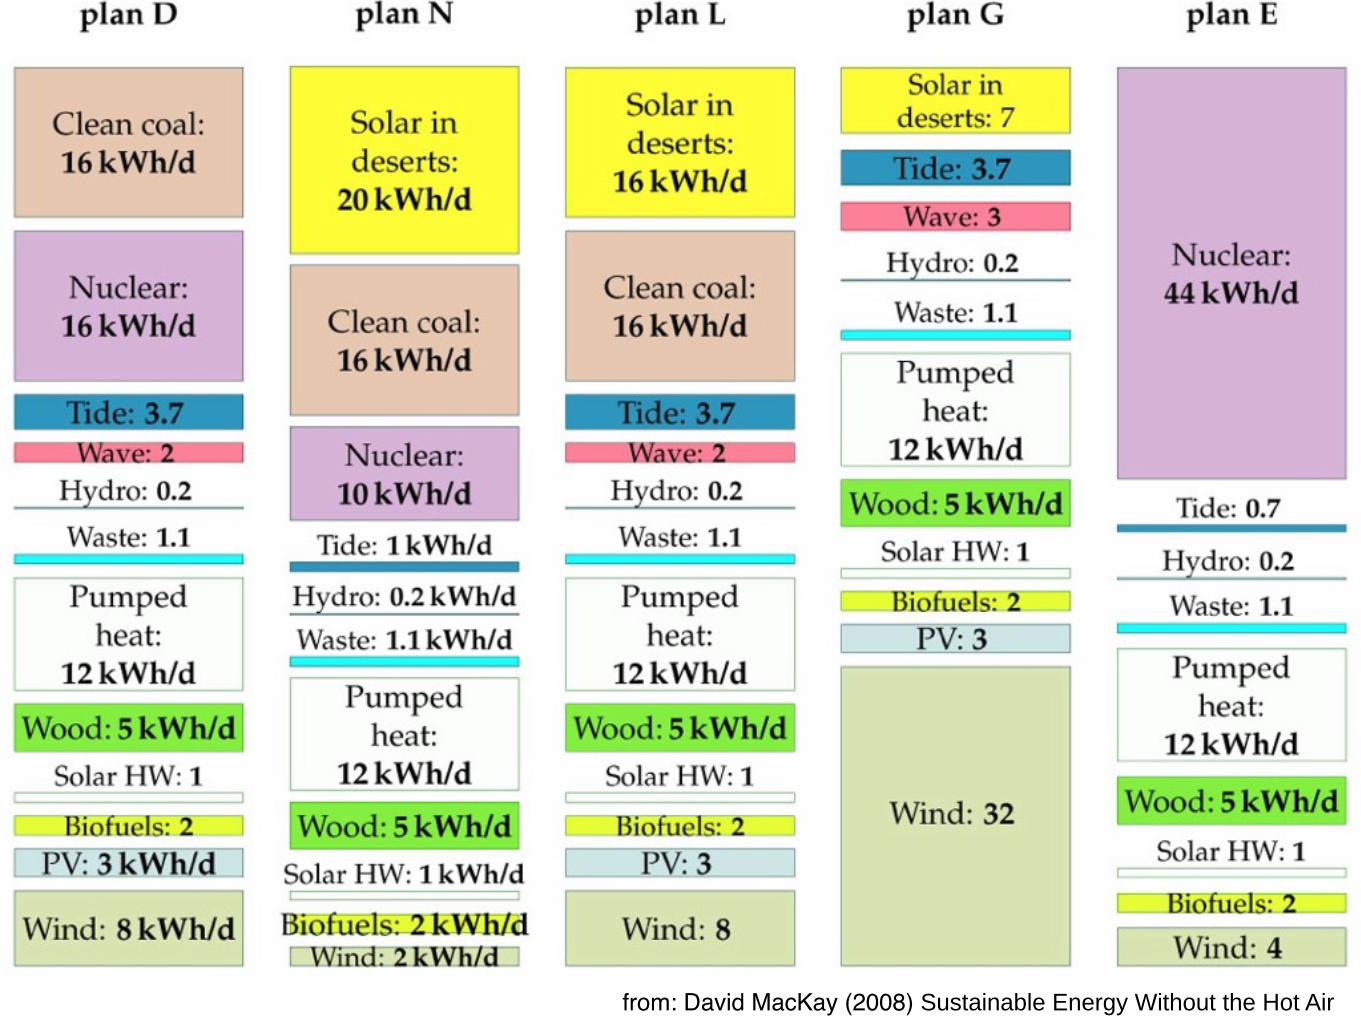
from: David MacKay (2008) Sustainable Energy Without the Hot Air
Recycling

Car pool

Train pool

Bicycle Trailer

Innovative Method for Transport of Stolen Methane
Recommended