MINISTRY OF POWERGOVERNMENT OF INDIA
MINISTRY OF POWERGOVERNMENT OF INDIA
NORMALIZATION DOCUMENT AND MONITORING & VERIFICATION GUIDELINES
Thermal Power Plant Sector


THERMAL POWER PLANT - Under Perform, Achieve and Trade i

THERMAL POWER PLANT - Under Perform, Achieve and Tradeii
© Bureau of Energy Efficiency, Government of India, March 2015
All rights reserved. No part of this document may be reproduced in any form or by any means without prior permission of Bureau of Energy Efficiency, Government of India.
Published byBureau of Energy EfficiencyMinistry of Power,Government of India4th Floor, Sewa BhawanR K PuramNew Delhi -110 066
Developed specifically for Designated Consumers notified under Perform Achieve and Trade (PAT) Program for National Mission for Energy Efficiency (NMEEE)
DisclaimerThis document has been developed after an extensive consultation with a number of experts and stakeholders of the scheme. BEE disclaim any liability for any kind of loss whatsoever, whether special, indirect, consequential, or compensatory, directly or indirectly resulting from the publication, or reliance on this document.
Conceptualized by Media NMEEE
Processed and Printed in India by Viba Press Pvt. Ltd., C-66/3, Okhla Industrial Area, Phase-II, New Delhi-110020Tel. : 011-41611300 / 301 Email : [email protected]

THERMAL POWER PLANT - Under Perform, Achieve and Trade iii
Contents
1. Introduction 1 Section 1.01 National Mission for Enhanced Energy Efficiency 1 Section 1.02 Perform, Achieve and Trade (PAT) Scheme 22. Background 23. Categorisation and Distribution 24. Baseline value establishment 3 Section 4.01 Definition 3 (a) Baseline Year 3 (b) Baseline Generation (P base) 3 (c) Baseline Specific Energy Consumption (SECbase) 3 (d) Baseline Capacity Utilization in % (CUbase) 35. Methodology for establishing the target 3 Section 5.01 Relationship 3 Section 5.02 Percentage Reduction target methodology 46. Formula for Target Setting 5 Section 6.01 Formula for target setting for Coal based Thermal Power Plant 5 (a) Design Net Heat Rate 5 (b) Operating Net Heat Rate 5 (c) Heat Hate Reduction Target 6
(d) Coal based thermal Power Plant Station Target Net Operating Heat Rate without Normalization 6
Section 6.02 Formula for target setting for Gas based Thermal Power Plant 6 (a) Design Parameters 6 (b) Operating parameters 6 (c) Heat Hate Reduction Target 7 (d) Target Station Net Operating Heat Rate without Normalization for AY 77. Examples for target setting 7 Section 7.01 Sample Calculation for Target Setting for Coal based Thermal Power Station 7 (a) Design Parameters 8 (b) Operating parameters 8 (c) Heat Hate Reduction Target 9 (d) Target Station Net Operating Heat Rate without Normalization for AY 10 Section 7.02 Sample Calculation for Target Setting for Gas based Thermal Power Station 10

THERMAL POWER PLANT - Under Perform, Achieve and Tradeiv
(a) Design Parameters 11 (b) Operating parameters 11 (c) Heat Hate Reduction Target 12 (d) Target Station Net Operating Heat Rate without Normalization for AY 138. Normalization/ Correction factor to be considered for target setting: 13 Section 8.01 Input Primary Energy 13 Section 8.02 Plant Load Factor 13 Section 8.03 Fuel Mix 13 Section 8.04 Fuel Quality 13 Section 8.05 Environmental Standards 149. Formulas of Normalization 14 Section 9.01 Common Calculations for Normalization 14 Section 9.02 Normalization for Coal/ Lignite base Thermal Power Plant 19 (a) Coal/Lignite Quality in Boiler IPP 19 (b) Plant Load Factor [Scheduling] 23 (c) Auxiliary Power Consumption (APC) Normalization 27 (d) Other Normalization 33 (e) Final Normalization Calculation for Coal Based Thermal Power plant 34 Section 9.03 Normalisation for Gas Based Thermal Power Plant 34 (a) Gas Fuel Mix Normalization 34 (b) Gas OC cycle Normalization 35 (c) Auxiliary Power Consumption (APC) Normalization 36 (d) PLF Normalization 38 (e) Gas Quality Normalization 39 (f) Other Normalization 40 (g) Final Normalization Calculation for Gas based Thermal Power plant 4210. Examples of Normalization 42 Section 10.01 Common Calculations for Normalization 42 Section 10.02 Normalization for Coal/ Lignite base Thermal Power Plant 48 (a) Coal/Lignite Quality in Boiler IPP 48 (b) Plant Load Factor [Scheduling] 53 (c) Auxiliary Power Consumption (APC) Normalization 58 (d) Other Normalization 68 (e) Final Normalization Calculation for Coal Based Thermal Power plant 71 Section 10.03 Normalisation for Gas Based Thermal Power Plant 71 (a) Gas Fuel Mix Normalization 71 (b) Gas OC cycle Normalization 74 (c) Gas Quality Normalization 77

THERMAL POWER PLANT - Under Perform, Achieve and Trade v
(d) Auxiliary Power Consumption (APC) Normalization 78 (e) Plant Load Factor [Scheduling] 81 (f) Other Normalization 86 (g) Final Normalization Calculation for Gas based Thermal Power plant 8911. Normalization for Fuel Mix (Gas + Oil) in Thermal Power Plant 89 Section 11.01 Formulas 89 Section 11.02 Examples 9012. Condition for Normalisation 92 Section 12.01 Documents to be maintained by plant 9213. Conclusion 93

THERMAL POWER PLANT - Under Perform, Achieve and Tradevi
Part-II
MONITORING & VERIFICATION GUIDELINES
1. Introduction 971.1. Background 971.2. Purpose 981.3. Definition of M&V 981.4. Empanelled Accredited Energy Auditor or Verifier 99
1.4.1. Qualification of Empanelled Accredited Energy Auditor (EmAEA) for Verification and Check-Verification
100
1.4.2. Obligation of Empanelled Accreditor Energy Auditor 1001.5. Important Documents required for M&V process 1011.6. Stakeholders 102
2. Broad Roles and Responsibilities 1022.1. General 1022.2. Designated Consumer 1032.3. Empanelled Accredited Energy Auditor (EmAEA) 1052.4. State Designated Agencies (SDA) 1062.5. Adjudicator 1072.6. Bureau of Energy Efficiency 1072.7. Ministry of Power 1082.8. Institutional Framework for PAT 108
3. Process & Timelines 1093.1. Activities and Responsibilities 1093.2. Process Interlinking 110
3.2.1. Process of Issuance of Escerts 1113.3. Flow Chart showing verification process (Rules and Act required dates in bold
Italics)112
4. Verification requirement 1134.1. Guidelines for Selection Criteria of EmAEA by Designated Consumer 1134.2. Guidelines for Empanelled Accredited Energy Auditor 1134.3. Guidelines for Verification process 114
4.3.1. Sector Specific Pro-forma 1144.3.2. Reporting in Sector Specific Pro-forma 115

THERMAL POWER PLANT - Under Perform, Achieve and Trade vii
4.3.3. Verification Process 1164.3.4. Primary and Secondary source of Documentation 119
5. Understanding Conditions 1435.1. Specific Issues 1445.2. Fuel 1455.3. Normalization Condition and calculation 1465.4. Normalisation General Issue 148
6. Abbreviations 1507. Annexure 151
7.1. Annexure I: Thermal Power Station 1527.2. Annexure II: Steel 1577.3. Annexure III: Cement 1627.4. Annexure IV: Fertilizer 1667.5. Annexure V: Aluminium 1837.6. Annexure VI: Pulp & Paper 1867.7. Annexure VII: Textile 2097.8. Annexure VIII: Chlor Alkali 215

THERMAL POWER PLANT - Under Perform, Achieve and Tradeviii
Tables
Table 1: Activities and Responsibilities for PAT Cycle I 109Table 2: Team Details (Minimum Team Composition) 114Table 3: Production and Capacity Utilisation details 119Table 4: Major Equipment capacity and Operating SEC 121Table 5: Boiler Details (Process and Co-Generation) 122Table 6: Electricity from Grid/Others, Renewable Purchase Obligation, Notified Figures 124Table 7: Own generation through Captive Power Plants 126Table 8: Solid Fuel Consumption 130Table 9: Liquid Fuel Consumption 133Table 10: Gaseous Fuel Consumption 136Table 11: Documents for Quality Parameter 138Table 12: Documents related to Environmental Concern, Biomass/Alternate
Fuel availability, Project Activities, New Line commissioning, Unforeseen Circumstances
139
Table 13: Documents related to External Factor 143Table 14: Lump Co-Generation treatment 147Table 15: Auxiliary Power Consumption Details (a,b,c) 152Table 16: Sponge Iron Subsector- Major Product details 159Table 17: Section wise Specific Power Consumption Details 163Table 18: Mass and Energy balance 164Table 19: Clinker Factor calculation 165Table 20: Material and Energy balance of Fertilizer sector 166Table 21: Material balance of all inputs in Fertilzer sector 169Table 22: Section wise Energy Consumption details 183Table 23: Section wise Energy Consumption details 184Table 24: Voltage Distribution 185Table 25: General details required in wood based Pulp and Paper Mills 187Table 26: Documents required wood based Pulp and Paper Mills 191Table 27: General details required in Agro based Pulp and Paper Mills 195Table 28: Document required for Agro based Pulp and Paper Mills 199Table 29: General details required in RCF based Pulp and Paper Mills 203Table 30: Documents required in RCF based Pulp and Paper 206Table 31: Section wise Energy Consumption 210Table 32: Section wise Energy Consumption 212Table 33: Product Name in Fiber Sun-sector 214Table 34: Section wise Energy Consumption 214Table 35: Section wise Energy details 215

THERMAL POWER PLANT - Under Perform, Achieve and Trade ix
Figures
Figure 1: M&V Documents 101Figure 2: Stakeholders 102Figure 3: Institutional Framework 108Figure 4: Stakeholders Interlinking 110Figure 5: Flow Chart of ESCerts issuance 111Figure 6: Time Line Flow Chart 112Figure 7: Stakeholders Output 117Figure 8: Ex-GtG Boundary for Thermal Power Plant 155Figure 9: Ex-Coal/Lignite/Oil/Gas based Thermal Power Plant Energy balance diagram 156Figure 10: Ex-CCGT Energy balance diagram 157Figure 11: Product Mix diagram 159Figure 12: Ex-GtG Boundary boundary for Sponge Iron Sub-sector 160Figure 13: Figure 14: Ex-GtG boundary for Cement Sector 164Figure 15: Fertilizer plant Battery Limit block diagram 171Figure 16: Overall Material and Energy balance 174Figure 17: Ex- GtG boundary for Aluminium (Refinery sub sector) 184Figure 18: Ex- GtG boundary for Aluminium (Smelter sub sector) 185Figure 19: Ex- GtG boundary for Aluminium (Cold Sheet sub sector) 186Figure 20: Ex- GtG boundary and metering details for Wood based Pulp and Paper Mill 190Figure 21: Ex- GtG boundary and metering details for Agro based Pulp and Paper Mill 198Figure 22: Ex- GtG boundary for Textile (Spinning sub sector) 211Figure 23: Ex- GtG boundary for Textile ( Composite/ Processing sub sector) 213Figure 24: Ex- GtG boundary for Textile (Fiber) Sub- sector 215Figure 25: Ex- GtG boundary for Chlor-Alkali sector 216


Foreword
PerformAchieveandTrade (PAT),aflagship initiativeunderNationalMission forEnhancedEnergyEfficiency(NMEEE),isaregulatoryinterventionforreductionofspecificenergyconsumption,with an associatedmarket basedmechanism throughwhich additional energy savings can bequantifiedandtradedasECSerts.
ThermalPowerPlantsector isoneof the8notifiedenergy intensivesectorsunderwhichatotalof144plantsareparticipatinginthisprogram.ThetargetsarespecifiedintermsofspecificpercentageoftheirpresentdeviationofNetOperatingHeatRatefromtheNetDesignHeatRate.ThetotalreportedenergyconsumptionoftheseDesignatedConsumers(DCs)isabout104milliontoe.BytheendofthefirstPATcycle,theenergysavingof3.211milliontoe/yearisexpectedtobeachieved,whichisaround48%oftotalnotionalenergysavingtargetsassessedunderPAT.
The publication of “Normalization Document and M&V Guidelines” for Thermal Power Plant SectorisanefforttofacilitatetheDCstocomplywithnotifiedPATrulestoparticipatewiththePATschemeandcontributetowardsachievingnationaltargetofenergysavings.ThisdocumentwillalsobehelpfultoallempanelledAccreditedEnergyAuditors(EmAEAs)andStateDesignatedAgencies(SDAs)inthemonitoringandverificationprocessofPAT.
IwanttorecordmyappreciationformembersoftheTechnicalCommitteeonThermalPowerPlantSector,chairedbyShri.Alok,DeputyDirectorGeneral(Technical),BureauofEnergyEfficiency(BEE), ShriA.K.Asthana, Senior Technical Expert, GIZ, Dr.Ashok Kumar, Energy Economist,BEE, andShriAbhishekKumarYadav, Project Engineer, BEE, Shri PiyushSharma,TechnicalExpert (GIZ)whoworked tirelessly toput together thebaselinedata,normalization factorsandM&Vmethodology for thesector. Iespeciallywant torecordmyappreciation forShriS.VikashRanjan,TechnicalExpert(GIZ)whohasputtogetherthedataandmethodologyassociatedwithnormalization.
I also compliment the efforts of all participating industrial units towards their endeavor incontributingtothenationalenergysavingtargets.
(Ajay Mathur)
ÅtkZ n{krk C;wjks¼Hkkjr ljdkj] fo|qr ea=ky;½
vt; ekFkqj] ih,p-Mhegkfuns’kd
Ajay Mathur, Ph.D.Director GeneralBUREAU OF ENERGY EFFICIENCY
(Government of India, Ministry of Power)
pkSFkk ry] lsok Hkou] vkj0 ds0 iqje] ubZ fnYyh&110 066
Lofgr ,oa jk"Vªfgr esa ÅtkZ cpk,¡ Save Energy for Benefit of Self and Nation
4th Floor, Sewa Bhawan, R.K. Puram, New Delhi - 110 066Vsyh/Tel : 26178316 (lh/kk/Direct) 26179699 (5 Lines) QSDl/Fax : 91 (11) 26178328
bZ&esy/E-mail : [email protected] osclkbZV/Web-Site : www.beeindia.in

THERMAL POWER PLANT - Under Perform, Achieve and Tradexii
Technical Committee on Thermal Power Plant Sector
S. No Name of Member Designation Position1 Shri Alok Deputy Director General (Technical), BEE Chairman2 Shri L.D. Papney Director (TE & TD), Central Electricity
Authority Member
3 Shri Chandrashekhar Director (C&E), Central Electricity Authority Member4 Shri N. S. Mondal Director (TR & M), Central Electricity
Authority Member
5 Shri S.C. Shrivastava Joint Chief (Engg), Central Electricity Regulatory Commission
Member
6 Shri A.K. Gupta Head of EEC, Excellence Enhancement Centre
Member
7 Shri Sankar Bandyopadhyay
General Manager, CenPEEP, NTPC Limited Member
8 Shri Anil K. Mittal Addl. Gen. Manager, CenPEEP, NTPC Limited
Member
9 Shri O.P. Khandelwal Director (Technical), RRVUNL Member10 Shri Anil R Nandanwar Executive Director (Gen O&M-II),
MAHAGENCO)Member
11 Shri Syamsundar Sen Director (O&M and Projects), WBSEDCL) Member12 Shri N. Sankar Director (Generation), TANGEDCO Member
Special Thanks to Team NMEEE
S. No Name of Member Designation
1. Shri Kapil Mohan, IAS Ex. Deputy Director General, NMEEE
2. Shri Alok, IAS Ex Deputy Director General, NMEEE
3. Shri K.K. Chakarvarti Ex .Energy Economist
4. Shri Ashok Kumar Energy Economist
5. Shri Sunil Khandare Energy Economist
6. Shri Saurabh Diddi Energy Economist
7. Shri Sameer Pandita Assistant Energy Economist, BEE
8. Shri Arijit Sengupta Assistant Energy Economist, BEE
9. Shri Girija Shankar Assistant Energy Economist, BEE
10. Smt. Vineeta Kanwal Assistant Energy Economist, BEE
11. Shri Ajay Tripathi Media Manager
12. Shri KK Nair Finance and Accounts officer, BEE
13. Shri A K Asthana Senior Technical Expert, GIZ
14. Shri Vikas Ranjan Technical Expert, GIZ

THERMAL POWER PLANT - Under Perform, Achieve and Trade 1
1. Introduction
The National Action Plan on Climate Change (NAPCC) released by the Prime Minister on 30 June, 2008, recognises the need to maintain high economic growth to raise the living standards of India’s vast majority of people and simultaneously reducing their vulnerability to the impacts of climate change.
The National Action Plan outlines eight national missions that represent multi-pronged, long-term, and integrated strategies for achieving key goals to mitigate the impact of climate change. These missions are listed below: National Solar Mission National Mission for Enhanced Energy
Efficiency National Mission on Sustainable Habitat National Water Mission National Mission for Sustaining the
Himalayan Ecosystem National Mission for a Green India National Mission for Sustainable
Agriculture National Mission for Strategic Knowledge
for Climate Change
1.1 National Mission for Enhanced Energy Efficiency
The National Mission for Enhanced Energy Efficiency (NMEEE) is one of the eight national
missions with the objective of promoting innovative policy and regulatory regimes, financing mechanisms, and business models which not only create, but also sustain, markets for energy efficiency in a transparent manner with clear deliverables to be achieved in a time bound manner. It also has inbuilt provisions for monitoring and evaluation so as to ensure transparency, accountability, and responsiveness. The Ministry of Power (MoP) and Bureau of Energy Efficiency (BEE) were tasked to prepare the implementation plan for NMEEE.
NMEEE spelt out the following four new initiatives to enhance energy efficiency, in addition to the programmes on energy efficiency being pursued. These are:¾ Perform, Achieve and Trade (PAT),
a market based mechanism to make improvements in energy efficiency in energy-intensive large industries and to make facilities more cost – effective by certification of energy saving that can be traded.
¾ Market Transformation for Energy Efficiency (MTEE) accelerates the shift to energy-efficient appliances in designated sectors through innovative measures that make the products more affordable.
¾ Energy Efficiency Financing Platform (EEFP), a mechanism to finance demand side management programmes in all sectors by capturing future energy savings.
¾ Framework for Energy Efficiency
Perform, Achieve and Trade
(PAT)
Market Transformation for
Energy Efficiency
(MTEE)
Energy Efficiency Financing
Platform
(EEFP)
Framework for Energy Efficient
Economic Development
(FEEED)
NMEEE

THERMAL POWER PLANT - Under Perform, Achieve and Trade2
Economic Development (FEEED), for developing fiscal instruments to promote energy efficiency.
1.2 Perform, Achieve and Trade (PAT) Scheme
Under the National Mission on Enhanced Energy Efficiency (NMEEE), a market based mechanism known as Perform, Achieve and Trade (PAT)
has been developed and launched to improve energy efficiency in the large energy intensive industries. It is envisaged that 6.686 million tonnes of oil equivalent will be reduced by 2014-15, which is about 4% of energy consumed by these industries. Under the PAT scheme, targets have been specified for all energy intensive industries notified as designated consumers (DCs) under the Energy Conservation Act, including thermal power stations.
2 Background
The methodology of setting targets for designated consumers is transparent, simple and easy to use. It is based on reduction of specific energy consumption (SEC) on a gate-to-gate (GtG) basis to achieve targeted savings in the first commitment period of 3 years (2012-2015); the reduction in this phase is of 4.1% which is estimated to 6.686 million tonnes of oil equivalent (mtoe). Out of the 23 mtoe set as target from NMEEE, the PAT scheme is focussed on achieving 6.686 mtoe by 2015.
With the threshold limit of 30,000 toe energy consumption for a power station to become a designated consumer, 144 thermal power stations, with Coal/Lignite/Gas/Diesel as primary energy consumption, have been identified in Cycle I of PAT. The categorisation
of plants based on fuel such as coal, gas and diesel made the setting of target simple. The total reported energy consumption of these designated consumers is about 104 million tonne of oil equivalent. By the end of the first PAT cycle, energy savings of 3.211 million tonne of oil equivalent/year is expected to be achieved, which is around 48% of the total national energy saving targets assessed under PAT.
3 Categorisation and Distribution
The Thermal Power Plants can be categorised into coal, gas, and oil/diesel based. The categorisation of the DCs under PAT cycle has been shown below. Apart from the type of fuel source, the plants are also categorised into State, Central and Private. However, the target and normalisation methodology for all are same.
1 1
27
7
12
22
48
National Energy Saving Targets under PAT (%)
Chlor-Alkali
Textile
Pulp & Paper
Aluminium
Fertilizer
Cement
Iron & Steel
Thermal Power Plants

THERMAL POWER PLANT - Under Perform, Achieve and Trade 3
Fuel based Power Plant
State Central Private TotalTotal No.
Capacity (MW)
% Total No.
Capacity (MW)
% Total No.
Capacity (MW)
% Total No.
Capacity (MW)
%
Coal 56 41534 46 23 30095 33 18 7231 8 97 78860 87Gas 20 3823 4 9 4392 5 11 3122 3 40 11337 12Diesel 4 385 0 0 0 0 3 412 0 7 797 1Total 80 45742 50 32 34487 38 32 10765 12 144 90994 100
It can be clearly observed from the table above that coal based thermal power plants occupy the major chunk in all the sectors, i.e., state, central and private, followed by gas and diesel, respectively. Coal based plants contribute to more than 75 per cent of the total target.
4. Baseline value establishmentSection 4.01 Definition
(a) Baseline Year Baseline year is declared as 2009-10.(b) Baseline Generation (P base) The arithmetic average of gross
generation figures in MUs of 2007-08, 2008-09 and 2009-10.
(c) Baseline Specific Energy Consumption (SECbase)
The arithmetic average of Net Design Heat Rate (Kcal/kWh), Net Operative Heat Rate (kcal/kWh), Auxiliary Power Consumption (APC %) and
Plant Load Factor (PLF %) figures of 2007-08, 2008-09 and 2009-10
(d) Baseline Capacity Utilization in % (CUbase)
Arithmetic average of PLF figures of 2007-08, 2008-09 and 2009-10 is taken as the baseline capacity utilization
5. Methodology for establishing the target
The methodology adopted for target setting is based on arithmetic average of Gross Design Heat Rate (kcal/kWh), Gross Operating Heat Rate (kcal/kWh)and Auxiliary Power consumption (%) figures of 2007-08, 2008-09 and 2009-10.
Section 5.01 Relationship Based on the arithmetic average figure
of three years, the Net Design Heat Rate (kcal/kWh) and Net Operating Heat Rate (kcal/kWh) has been calculated using the following formulae
Boiler
Efficiency (%)
Turbine Heat rate
(kcal / kWH)Fuel Input (MT) Gross Generation (kWH)
Gross Heat Rate
(Kcal / Kwh)
% Auxiliary Power
Consumption (%)
Net Heat Rate (Target)
(Kcal/kWH)
GCV Fuel
(Kcal / Kg)

THERMAL POWER PLANT - Under Perform, Achieve and Trade4
Net Operating Heat Rate = Gross operating Heat Rate / (1-APC %)Net Design Heat Rate = Gross Design Heat Rate / (1- APC %)Actual Deviation of net operating Heat Rate from net Design Heat Rate = Net Operating Heat Rate – Net Design Heat Rate% Deviation = Actual deviation from net design heat rate x 100/ net design heat rate
The targets are specified in terms of specific percentage of their present deviation of Net Operating Heat Rate from the Net Design Heat Rate. The stations are classified in to various bands according to their present deviations of operating heat rate from design heat rate and stations with higher deviations has given higher targets. The indicative classification and targets for various bands for the generating stations are as under:-Section 5.02 Percentage Reduction Target
methodology
The energy consumption norms and standards for power stations shall be specified in terms of
specific percentage of their present deviation of net operating heat rate, based on the average of previous three years, namely, 2007-08,2008-09 &2009-10 for the first cycle ,and for cycles thereafter in accordance with the provision of Rule 14 from the net design heat rate. The power stations shall be grouped into various bands according to their present deviations, of operating heat rate from design heat rate and for power stations with higher deviations the energy consumption norms and standards shall be established at lower level and shall be grouped taking into account percentage deviation as under
Designed [D]
Design Net
Heat rate
Operating [O]
Operating Net
Heat rate
Reduction of Heat rate
(O – D) x 0.1Deviation within0- 5%
Reduction of Heat rate
(O – D) x 0.17Deviation within5%- 10%
Reduction of Heat rate
(O – D) x 0.21Deviation within10%- 20%
Deviation More than 20%Reduction of Heat rate
(O – D) x 0.24
Category Variation in Net Station Heat Rate from Design Net Heat Rate
Reduction Target for % deviation in the Net Station Heat Rate
I Up to 5% 10%II More than 5% and up to 10% 17%III More than 10% and up to 20% 21%IV More than 20% 24%

THERMAL POWER PLANT - Under Perform, Achieve and Trade 5
Station Loading Factor (%) =([{U# 1 loading factor (%) X U# 1 Gross
Generation (MU)} +{ U#2 loading factor (%) X U# 2 Gross Generation (MU)} + … … …] )/(Station Gross Generation (MU))
Station Gross Generation(MU) =(U#1 Gross Generation (MU) + U#2
Gross Generation (MU) + … … …) Station Net Generation (MU) = Station Gross Generation (MU)x[1– APC
(%)/100]
Station OGHR (kcal/kWh) =([{U#1 OGHR (kcal/kWh) X U#1 Gross
Generation (MU)} +{ U#2 OGHR (kcal/kWh) X U#2 Gross Generation (MU) }+… … … …] )/(Station Gross Generation (MU))
6. Formula for Target SettingSection 6.01 Formula for target setting for
Coal based Thermal Power Plant(a) Design Net Heat Rate
Station Installed Capacity (MW) = [U#1 Capacity (MW) + U#2 Capacity
(MW) + … … … …]
Station Design Boiler Efficiency =([{U#1 Installed Capacity (MW) X
U#1 Boiler Efficiency(%)} + {U# 2 Installed Capacity (MW) XU# 2 Boiler
Station DGHR(kcal/kWh)=([{U# 1 DGHR X U# 1 Installed Capacity (MW)}+ U# 2 DGHR X U# 2 Installed Capacity (MW)} +… … … …])/
(Station Installed Capacity (MW))
Station Design Net Heat Rate (kcal/kWh) =(Station DGHR (kcal/kWh)
(1-%Operating APC))
WhereDGHR = Design Gross Heat Rate (kcal/kWh)THR = Turbine Heat Rate (kcal/kWh)DNHR = Design Net Heat Rate (kcal/kWh)APC= Auxiliary Power Consumption (%) [Operating APC in Baseline Year]
(b) Operating Net Heat RateStation Operating Load (MW) = U#1 Operating Load (MW) + U#2
Operating Load (MW) + … …
Operating Load (MW) = Unit Gross Generation (MWh)/Unit
Operating hours
Station ONHR (kcal/kWh) =Station ONHR (kcal/kWh)
1-%Operating APC
Efficiency(%)} +… … … …] )/( Station Installed Capacity (MW))
Station THR (kcal/kWh) =([{U# 1 THR X U#1 Installed Capacity
(MW)} + {U#2 THR X U#2 Installed Capacity (MW)} + … … … …])/(Station Installed Capacity (MW))
Unit DGHR (kcal/kWh) = Unit THR (kcal/kWh)/Boiler
Efficiency (%)
THERMAL POWER PLANT - Under Perform, Achieve and Trade6
WhereOGHR = Operating Gross Heat RateONHR = Operating Net Heat RateAPC=Auxiliary Power Consumption [Operating APC in Baseline Year]
(c) Heat Hate Reduction Target The target in Thermal Power Sector under
PAT Scheme is set by taking the deviation of NHR of Baseline year and design NHR. Based on the deviation percentage (to design), the target values for Heat Rate reduction are set in the slab.
Let the deviation percentage be “X”, then If X is <= 5(five), then the HR reduction
target is 10% of the deviation. If X is >5, but <=10, then the HR reduction
target is 17% of the deviation. If X is >10, but <=20, then the HR reduction
target is 21% of the deviation. If X is >20, then the HR reduction target is
24% of the deviation. (d) Coal based thermal Power Plant Station
Target Net Operating Heat Rate without Normalization
The Station Net Operating Heat Rate without Normalization is the ONHR of baseline year minus the heat rate reduction target given to it.
Target Sation ONHR (kcal/kWh) = Station Operating NHR for BY- Heat
Rate Reduction Target
WhereOGHR = Operating Gross Heat RateONHR = Operating Net Heat RateAPC= Auxiliary Power Consumption
This Heat Rate has to be attained by the Station. If the station fails to meet its target, i.e., operates
on a Heat Rate higher than the target, penalty will be levied on the Station. On the other hand, if the station over achieves its target, i.e., operates at a Heat Rate lesser than the target , it will be granted E-Certs, which can be traded in open market.
Section 6.02 Formula for target setting for Gas based Thermal Power Plant
(a) Design Parameters
Station Installed Capacity (MW) = [U#1 Capacity (MW) + U#2 Capacity
(MW) + … … … …]
Station Design Module Efficiency =([{U#1 Installed Capacity (MW) X U#1
Module Efficiency} + {U# 2 Installed Capacity (MW) XU# 2 Module Efficiency} +… … … …] )/( Station Installed Capacity (MW))
Station Module Heat Rate (Gross Heat Rate) (kcal/kWh) =([{U#1 THR X U#1 Installed Capacity
(MW)} + {U#2 THR X U#2 Installed Capacity (MW)}+])/(Station Installed Capacity (MW))
Station Design Net Heat Rate (kcal/kWh)
=(Station DGHR (kcal/kWh)
(1-%Operating APC)
(b) Operating Parameters Station Operating Load (MW)=U#1
Operating Load (MW)+U# 2 Operating Load (MW)+...
Station Gross Generation(MU)= (U#1 Gross Generation (MU)+U#2 Gross
Generation (MU) + …)
Station OGHR (kcal/kWh) =([{U#1 OGHR (kcal/kWh) X U#1 Gross
Generation (MU)} +{U#2 OGHR (kcal/kWh) X U#2 Gross Generation (MU) }+…
THERMAL POWER PLANT - Under Perform, Achieve and Trade 7
… … … ] )/(Station Gross Generation (MU))
Station Operating Net Heat Rate
Station ONHR (kcal/kWh) = (Station OGHR (kcal/kWh)
1- % Operating APC
WhereOGHR = Operating Gross Heat RateONHR = Operating Net Heat RateAPC = Auxiliary Power Consumption
(c) Heat Hate Reduction Target The target in Thermal Power Sector under
PAT Scheme is set by taking the deviation of NHR of Baseline year and design NHR. Based on the deviation percentage (to design), the target values for Heat Rate reduction are set in the slab.
Let the deviation percentage be “X”, then If X is <= 5(five), then the HR reduction
target is 10% of the deviation. If X is >5, but <=10, then the HR reduction
target is 17% of the deviation. If X is >10, but <=20, then the HR reduction
target is 21% of the deviation. If X is >20, then the HR reduction target is
24% of the deviation.
(d) Target Station Net Operating Heat Rate without Normalization for AY
The Station Net Operating Heat Rate without Normalization is the ONHR of baseline year minus the heat rate reduction target given to it.
Target Sation ONHR (kcal/kWh) = Station Operating NHR for BY- Heat
Rate Reduction Target
WhereOGHR = Operating Gross Heat RateONHR = Operating Net Heat RateAPC = Auxiliary Power Consumption
This Heat Rate has to be attained by the Station. If the station fails to meet its target, i.e., operates on a Heat Rate higher than the target, penalty will be levied on the Station. On the other hand, if the station over achieves its target, i.e., operates at a Heat Rate lesser than the target , it will be granted E-Certs, which can be traded in open market.
7. Examples for target settingSection 7.01 Sample Calculation for Target
Setting for Coal based Thermal Power Station
Coal based thermal power plants are plants having single primary fuel, which is coal. Oil is also used in these plants, but usually during the start-ups/shut-downs. These plants may be designed on a variety of grade of coal. Some plants are even designed for lignite. The normalization given caters to all the variety of coal and lignite used. Coal/Lignite Based Thermal Power plants operated on Rankine Cycle. For understanding the calculations and normalizations, we assume a Coal Based Thermal Power Station having 3(three) units of 210MW each.
Units Design Capacity
As Provided by Original Equipment Manufacturer (OEM)
As established during Performance Guarantee Test (PG Test) **
Boiler Efficiency
Turbine Heat Rate
Unit Heat Rate
Boiler Efficiency
Turbine Heat Rate
Unit Heat Rate
MW % kcal/kWh kcal/kWh % kcal/kWh kcal/kWhU#1 210 87.3 2045 2342.50 87.3 2100.00 2406.88U#2 210 87.3 2045 2342.50 87.3 2045.00 2343.84U#3 210 87.3 2045 2342.50 87.3 2045.00 2343.84
** Parameters established during Performance Guarantee Test shall only be considered if OEM data parameters are not available.

THERMAL POWER PLANT - Under Perform, Achieve and Trade8
The entire examples shall be worked out on the above mentioned table. Calculations based on the above mentioned Plant shall be:
(a) Design ParametersStation Installed Capacity (MW) = [U#1 Capacity (MW) + U#2 Capacity
(MW) + … … … …] = 210 +210+210 = 630 MW If the configuration of unit is complex, like
2X210MW +3X500 MW, the same formula holds good. The station Installed capacity in this case shall become
= 210+210+500+500+500 =1920 MW
Station Design Boiler Efficiency =([{U#1 Installed Capacity (MW) X
U#1 Boiler Efficiency} + {U# 2 Installed Capacity (MW) XU#2 Boiler Efficiency} +… … … …] )/( Station Installed Capacity (MW))
= [210X87.3 + 210X 87.3 + 210X87.3]/630 = 87.3 %
Station THR (kcal/kWh) =([{U#1 THR X U#1 Installed Capacity
(MW)} + {U#2 THR X U#2 Installed Capacity (MW)} + … … … …])/ (Station Installed Capacity (MW))
= (2045 X 210 + 2045X 210 + 2045 X210) /
(210 + 210 + 210) = 2045 kcal/ kWh
Unit DGHR (kcal/kWh)= (Unit THR (kcal/kWh)/ Boiler Efficiency %)U#1 DGHR = 2045/ 87.3 = 2342.5 kcal/kWhU#2 DGHR = 2045/ 87.3 = 2342.5 kcal/kWhU#3 DGHR = 2045/ 87.3 = 2342.5 kcal/kWhStation DGHR(kcal/kWh) =([{U# 1 DGHR X U# 1 Installed Capacity
(MW)}+ U# 2 DGHR X U# 2 Installed Capacity (MW)}+… … … …])/ (Station Installed Capacity (MW))
= (2342.5 X 210 + 2342.5 X 210 + 2342.5 X 210)/ (210 + 210 + 210)
= 2342.5 kcal/kWh
Station Design Net Heat Rate (kcal/kWh) =(Station DGHR (kcal/kWh))/((1-%
Operating APC)) = 2342.5 / (1 - 0.0757*) = 2534.35 kcal/Kwh * The Designed Auxiliary Power
Consumption (APC) is considered as 7.57%
(b) Operating parameters Now let us assume that the same Thermal
Power Plant was operating with some parameters in the baseline year and assessment year. Table below represents the data of the plant
Units Capacity (MW)
Current/ Assessment/ Target Year (20.... 20....) Baseline Year (20.... 20....)
Operating Load
Loading Factor
Gross Generation
Unit Gross Heat
Rate##
Operating Load
Loading Factor
Gross Generation
Unit Gross Heat Rate
##
MW % MU kcal/kWh MW % MU kcal/kWh
U#1 210 165 70 1445 2636 150 60 1314 2635
U#2 210 166 72 1454 2637 130 58 800 2636
U#3 210 150 60 1456 2800 120 55 714 2584

THERMAL POWER PLANT - Under Perform, Achieve and Trade 9
Station Operating Load (MW) =U#1 Operating Load (MW)+U#2
Operating Load (MW)+...
Station Operating load in Baseline Year = 150+130+120 = 400 MWStation Operating load in Assessment Year = 165+166+150 = 481 MW
Station Loading Factor (%) =([{U# 1 loading factor (%) X U# 1 Gross
Generation (MU)} +{ U#2 loading factor (%) X U# 2 Gross Generation (MU)} + … … …] )/(Station Gross Generation (MU))
Station loading factor in Baseline Year = {60*1314+58*800 +55*700} / (1314+800+714)= 57.89 %
Station loading factor in Assessment Year= {70*1445+72*1454+60*1456} / (1445+1454+1456)= 67.32%
Station Gross Generation(MU)=U# 1 Gross Generation (MU)+U#2 Gross Generation (MU) + …
Station gross Generation in Baseline Year = 1314 +800 +714 = 2828 (MU)
Station gross Generation in Assessment Year = 1445 +1454 +1456 = 4355 (MU)
Station OGHR (kcal/kWh)
=([{U#1 OGHR (kcal/kWh) X U#1 Gross Generation (MU)} +{ U#2 OGHR (kcal/kWh) X U#2 Gross Generation (MU) }+… … … …] )/(Station Gross Generation (MU))
Station Operation GHR for Baseline Year = (2635*1314 +2636*800 +2584*714) / 2828 = 2622.40 kcal/kWh
Station Operation GHR for Assessment Year=
(2636*1445 +2637*1454 +2800*1456) / 4355 = 2691.2 kcal/kWh
Station Operating Net Heat Rate
The Station Operating Gross Heat rate of Assessment and Baseline year has been calculated above. Now, considering the Auxiliary Power Consumption to be 6.89% and 7.57% for Assessment Year and baseline Year respectively, we can calculate the Net Operating Heat Rate.
Station ONHR (kcal/kWh)= Station OGHR (kcal/kWh)
1- % Operating APC
WhereOGHR = Operating Gross Heat RateONHR = Operating Net Heat RateAPC = Auxiliary Power Consumption
Station Operating Net Heat Rate for Baseline Year= 2622.4 / (1-0.0757)= 2837.17 kcal/kWh
Station Operating Net Heat Rate for Assessment Year= 2691.2/ (1-0.0689)= 2890.3 kcal/kWh
(c) Heat Hate Reduction TargetThe target in Thermal Power Sector under PAT Scheme is set by taking the deviation of NHR of Baseline year and design NHR. Based on the deviation percentage (to design), the target values for Heat Rate reduction are set in the slab.
Let the deviation percentage be “X”, then
If X is <= 5(five), then the HR reduction target is 10% of the deviation.
If X is >5, but <=10, then the HR reduction target is 17% of the deviation.
If X is >10, but <=20, then the HR reduction target is 21% of the deviation.
If X is >20, then the HR reduction target is 24% of the deviation.

THERMAL POWER PLANT - Under Perform, Achieve and Trade10
Accordingly, the target for the above mentioned Thermal Power Station has been calculated as below:
From Sections 1.6 and 2.5, we have-
Design Net Heat Rate (DNHR) =2534.35 kcal/KWh
Station Operating Net Heat Rate for Baseline Year (ONHR) =2837.17 kcal/kWh
Difference between Design and Operating NHR
= ONHR-DNHR
= 2837.17 -2535.35
= 301.82 kcal/kWhDifference/ Deviation Percentage from design =Difference/DNHR*100 =301.81/2534.35 *100 = 11.91%
As the deviation percentage is greater than 10, but less than 20, it qualifies for 21% slab.i.e., 301.82*21% = 63.38 kcal/kWh
Heat Rate Reduction Target = 63.38 kcal/kWh
(d) Target Station Net Operating Heat Rate without Normalization for AY
The Heat Rate Reduction Target is given on the basis of Baseline year and design parameters.
Section 3 depicts the Target Heat Rate that needs to be reduced, i.e., The station has to operate at a Net Heat Rate which is 63.38 kcal/kWh lesser than its baseline year. Hence,
The Station Net Operating Heat Rate without Normalization is ONHR for baseline year minus the HR reduction target
Target Heat Rate Reduction = 63.38 kcal/kWh
Target Operating Net Heat Rate in baseline Year = 2837.17-63.38 = 2773.79 kcal/kWh
This Heat Rate has to be attained by the Station. If the station fails to meet its target, i.e., operates on a Heat Rate higher than 2773.79 kcal/kWh, penalty will be levied on the Station. On the other hand, if the station over achieves its target, i.e., operates at a Heat Rate lesser than 2773.79 kcal/kWh, it will be granted E-Certs, which can be traded in open market.
Section 7.02 Sample Calculation for Target Setting for Gas based Thermal Power Station
Gas based Thermal Power plants are basically based on combined cycle. These plants may use gas as primary source of fuel or a mixture of gas and other fuels such as Naptha. These may be further divided into open and closed cycle depending upon the type/ load of operation. For understanding the calculations, let us take the example of a Station having three units of 210MW capacity each.
Table below, represents the capacity, THR with module efficiency is given in the table below.
Design Capacity As Provided by Original Equipment Manufacturer (OEM)
As established during Performance Guarantee Test (PG Test) **
Module Efficiency
Module Heat Rate@
Module Efficiency
Module Heat Rate
MW % kcal/kWh % kcal/kWh210 45.0 1911.11 45.0 1911.11210 45.0 1911.11 45.0 1911.11210 46.0 1869.57 47.0 1829.79
** Parameters established during Performance Guarantee Test shall only be considered if OEM data parameters are not available.

THERMAL POWER PLANT - Under Perform, Achieve and Trade 11
The entire examples shall be worked out on the above mentioned table. Calculations based on the above mentioned Station shall be:
(a) Design ParametersStation Installed Capacity (MW) = [U#1 Capacity (MW) + U#2 Capacity
(MW) + … … … …] = 210 +210+210 = 630 MWIf the configuration of unit is complex, like 2X210MW +3X500 MW, the same formula holds good. The station Installed capacity in this case shall become = 210+210+500+500+500 =1920 MW
Station Design Module Efficiency =([{U#1 Installed Capacity (MW) X U#1
Module Efficiency} + {U#2 Installed Capacity (MW) XU# 2 Module Efficiency} +… … … …] )/( Station Installed Capacity (MW))
= (210*45+ 210* 45 + 210*46)/ (210+210+210) = 45.33 %
Station Module Heat Rate (Gross Heat Rate) (kcal/kWh)
=([{U#1 THR X U#1 Installed Capacity (MW)} + {U#2 THR X U#2 Installed Capacity (MW)} + … … … …])/( Station Installed Capacity (MW))
=(1911.11* 210 +1911.11X 210 +1869.57X210) /(210 + 210 + 210)
= 1897.26 kcal/ kWh
Station Design Net Heat Rate (kcal/kWh)=Station DGHR (kcal/kWh))
(1-%Operating APC) = 1897.26/(1-0.0566) =2011.08 kcal/kWh
* The Designed Auxiliary Power Consumption (APC) is considered as 5.66%
(b) Operating parametersNow let us assume that the same Thermal Power Plant was operating with some parameters in the baseline year and assessment year. Table below represents the data of the plant
Units Capacity (MW)
Current/ Assessment/ Target Year (20.... 20....)
Baseline Year (20.... 20....)
Operating Load
Gross Generation
Unit Gross Heat Rate##
Operating Load
Gross Generation
Unit Gross Heat Rate ##
MW MU kcal/kWh MW MU kcal/kWhU#1 210 165 1445 2636 150 1314 2635U#2 210 166 1454 2637 130 800 2636U#3 210 150 1456 2800 120 714 2384
Station Operating Load (MW)=U#1 Operating Load (MW)+U# 2 Operating Load (MW)+...
Station Operating load in Baseline Year = 150+130+120 = 400 MW
Station Operating load in Assessment Year = 165+166+150 = 481 MW
Station Gross Generation(MU)=U#1 Gross Generation (MU)+U#2 Gross Generation (MU) + …

THERMAL POWER PLANT - Under Perform, Achieve and Trade12
Station gross Generation in Baseline Year = 1314 +800 +714 = 2828 (MU)Station gross Generation in Assessment Year = 1445 +1454 +1456 = 4355 (MU)
Station OGHR (kcal/kWh) =([{U# 1 OGHR (kcal/kWh) X U# 1 Gross
Generation (MU)} +{ U#2 OGHR (kcal/kWh) X U#2 Gross Generation (MU) }+ ... ... ]/ Generation (MU))
Station Operation GHR for Baseline Year = (2635*1314+2636*800+2384*714)/2828 = 2571.91 kcal/kWh
Station Operation GHR for Assessment Year = (2636*1445 +2637*1454 +2800*1456)/4355 = 2691.2 kcal/kWh
Station Operating Net Heat RateThe Station Operating Gross Heat rate of Assessment and Baseline year has been calculated above. Now, considering the Auxiliary Power Consumption to be 6.89% and 5.66% for Assessment Year and baseline Year respectively, we can calculate the Net Operating Heat Rate.
Station ONHR (kcal/kWh)=Station OGHR (kcal/kWh)
1- % Operating APC
WhereOGHR = Operating Gross Heat RateONHR = Operating Net Heat RateAPC = Auxiliary Power Consumption
Station Operating Net Heat Rate for Baseline Year = 2571.91/(1-0.0566) = 2726.21 kcal/kWh
Station Operating Net Heat Rate for Assessment
Year = 2691.2/ (1-0.0689) = 2890.3 kcal/kWh
(c) Heat Hate Reduction TargetThe target in Thermal Power Sector under PAT Scheme is set by taking the deviation of NHR of Baseline year and design NHR. Based on the deviation percentage (to design), the target values for Heat Rate reduction are set in the slab.Let the deviation percentage be “X”, then If X is <= 5(five), then the HR reduction target is 10% of the deviation. If X is >5, but <=10, then the HR reduction target is 17% of the deviation. If X is >10, but <=20, then the HR reduction target is 21% of the deviation. If X is >20, then the HR reduction target is 24% of the deviation.
Accordingly, the target for the above mentioned Thermal Power Station has been calculated as below:From Sections 1.6 and 2.5, we have-Design Net Heat Rate (DNHR) =2011.08 kcal/KWhStation Operating Net Heat Rate for Baseline Year (ONHR) =2726.21 kcal/kWhDifference between Design and Operating NHR = ONHR-DNHR = 2726.21-2011.08 = 715.13 kcal/kWhDifference/ Deviation Percentage from design =Difference/DNHR*100 =715.13/2011.08 *100 = 35.56%As the deviation percentage is greater than 20, it

THERMAL POWER PLANT - Under Perform, Achieve and Trade 13
qualifies for 24% slab.i.e., 715.13*24% = 171.63kcal/kWhHeat Rate Reduction Target = 171.63 kcal/kWh
(d) Target Station Net Operating Heat Rate without Normalization for AY
The Heat Rate Reduction Target is given on the basis of Baseline year and design parameters. Section 3 depicts the Target Heat Rate that needs to be reduced, i.e., The station has to operate at a Net Heat Rate which is 66.01 kcal/kWh lesser than its baseline year. Hence, The Station Net Operating Heat Rate without Normalization is the ONHR for baseline year minus the HR reduction targetWhereTarget Heat Rate Reduction = 171.63 kcal/kWhTarget Operating Net Heat Rate in Assessment
Year = 2726.21–171.63 = 2554.58 kcal/kWh
This Heat Rate has to be attained by the Station. If the station fails to meet its target, i.e., operates on a Heat Rate higher than 2554.58kcal/kWh, penalty will be levied on the Station. On the other hand, if the station over achieves its target, i.e., operates at a Heat Rate lesser than 2554.58kcal/kWh, it will be granted E-Certs, which can be traded in open market.
8. Normalization/ Correction factor to be considered for target setting:
There are several factors that need to be taken into consideration on capacity utilization of DCs for Normalization of a product under PAT rules, so that the undue advantage or disadvantage could not be imposed on DC. There are many factors, which can influence the SEC of a DC are listed below
Section 8.01 Input Primary Energy
Sr No
Sub-Group Elements Reason/ Requirement
Impact Documents
1 Coal Quality in Boiler IPP
%H, % Moisture, %Ash, GCV
Poor quality of Fuel effects the Power Station Performance
Boiler Efficiency /Gas Turbine
Ref Calculation provided for Boiler Efficiency (Coal Linkage with Coal Field leads to poor quality of Coal contains impurities like stone, Ash, high moisture etc because of poor performance of washeries)
Non Availability of fuel [External Factor]
Loss of Generation
Beyond DC’s control
Plant Load Factor
i. Documents from Coal Supplying company.
ii. Characteristics curve of Load Vs Design Turbine Heat Rate from OEM

THERMAL POWER PLANT - Under Perform, Achieve and Trade14
Section 8.02 Plant Load Factor
Section 8.03 Fuel Mix
Section 8.04 Fuel Quality
Sr No
Sub-Group Elements Reason/ Requirement
Impact Documents
2 Scheduling [External factor] or Backing down
PLF and Station heat rate
• Plant Load backing down due to lower power demand from the grid
• Variations in demand from the estimated or forecasted values, which cannot be absorbed by the grid.
Boiler Efficiency /Gas Turbine
i. Scheduling Documentsii. Reference documents are required for deterioration in Plant Load Factor
iii. Characteristics curve [Load Vs Heat Rate]
Unscheduled Power and Outage [External Factor]
PLF and Station heat rate
T r a n s m i s s i o n outages resulting in reduced power availability.
Plant Load Factor
Characteristics curve-Heat Rate Vs Load
Sr No
Sub-Group Elements Reason/ Requirement
Impact Documents
3 Fuel Use of different Fuel in same unit
Separate NHR for different fuel used in the unit
Boiler Efficiency
Fuel Quality and Quantity documentation
Sr No
Sub-Group Elements Reason/ Requirement
Impact Documents
3 Coal Use of coal with different calorific value in AY and BY
Coal quality is beyond the control of plant
Boiler Efficiency, Auxiliary Power Consumption
Fuel Quality and Quantity documentation, Energy consumption of mills in AY and BY
Gas Use of Gas with different calorific value in AY and BY
Gas quality may be compromised due to limited availability
Net Heat Rate
Fuel Quality and Quantity documentation

THERMAL POWER PLANT - Under Perform, Achieve and Trade 15
Section 8.05 Environmental Standards
Sr No
Sub-Group Elements Reason/ Requirement
Impact Documents
4 Additional Equipment Installation due to Environmental law
Auxilliary Power Consumption
The Energy will be normalized for additional Energy consumption. This is to be excluded from APC
APC The DC has to maintain the documents for additional installation of Environmental Equipment
5 Flood, Earthquake etc
Proper weightage could be given in SEC in terms of capacity utilisation, energy used for re-establishment
Plant Load Factor
The DC has to maintain the authentic documents for natural disaster
9. Formulas of NormalizationSection 9.01 Common Calculations for
Normalization
The target for Heat Rate Reduction is based on Baseline Year and Design parameters. However, there are factors which may have changed beyond control during the Assessment Year which may lead to higher Operating Net Heat Rate. These factors may be variation in coal quality, Plant Load Factor (PLF), Auxiliary Power Consumption (APC), number of start-
ups, etc. We cannot bring the station on a platform with similar operating conditions as the baseline year. However, we have given relaxations on these factors which are beyond the control of any Station. These relaxations are known as normalization.
In normalization, the deviation due to each external factor is calculated in terms of Heat Rate and is subtracted from the Station Operating Net Heat rate for Assessment Year.
Station Average Operating Hour (Hr) Caused by low ULF/MLF due to Fuel Unavailability
= ([U# 1 AOHr X U# 1 AOL (MW)}+ U# 2 AOHr X U# 2 AOL (MW) + … … … … ])/
Station AOL (MW) due to Fuel Unavailability
Where:ULF = Unit Load FactorMLF = Module Load FactorAOHr = Average Operating HourAOL = Average Operating Load
Station Average Operating Hour (Hr.)Caused by low ULF/MLF due to Scheduling
= ([{U# 1 AOHr X U# 1 AOL (MW)} +{ U# 2 AOHr + U# 2 AOL (MW)} + … … … …] )
Station AOL (MW) due to Scheduling
THERMAL POWER PLANT - Under Perform, Achieve and Trade16
WhereULF = Unit Load FactorMLF = Module Load FactorAOHr = Average Operating HourAOL = Average Operating Load
Station Average Operating Hour (Hr.)Caused by low ULF/ MLF due to Backing down
=[{U# 1 AOHr X U# 1 AOL (MW)}+ {U# 2 AOHr + U# 2 AOL (MW)}+ … … … …]
Station AOL (MW)due to backing down
WhereULF = Unit Load FactorMLF = Module Load FactorAOHr = Average Operating HourAOL = Average Operating Load
Station Average Operating Hours (Hr.) caused by ULF/MLF due to any other external Factor
=([{U# 1 AOHr X U# 1 AOL (MW)} + {U# 2 AOHr+ U# 2 AOL (MW)} + … … … …])
Station AOL (MW) due to backing down
WhereULF = Unit Load FactorMLF = Module Load Factor AOHr = Average Operating HourAOL = Average Operating LoadExternal factors = Fuel Unavailability/ Scheduling/ backing down/ any other external factor etc.
Unit Average Operating Load (MW) Caused by low ULF/MLF due to External factors = Total Generation (MWHr) / Total Operating Hour (Hr)
WhereTotal Generation = (Unit AOL (MW) X Unit AOHr) due to Fuel Unavailability + (Unit AOL
(MW) X Unit AOHr) due to Scheduling + (Unit AOL (MW) X Unit AOHr) due to Backing Down + (Unit AOL (MW) X Unit AOHr) due to any other external factor]
Total Operating Hour = [Unit AOHr due to Fuel Unavailability + Unit AOHr due to Scheduling + Unit AOHr due to Backing Down + Unit AOHr due to any other external factor]

THERMAL POWER PLANT - Under Perform, Achieve and Trade 17
ULF = Unit Load FactorMLF = Module Load FactorAOHr = Average Operating HourAOL = Average Operating LoadExternal factors = Fuel Unavailability/ Scheduling/ backing down/ any other external factor etc.
Station Average Operating Load (MW) caused by low ULF/MLF due to Fuel Unavailability/ Scheduling/ Backing down/ any other external factor= [U# 1 AOL (MW) + U# 2 AOL (MW) + … … … …]
Where:ULF = Unit Load FactorMLF = Module Load FactorAOL = Average Operating Load
Unit Average Operating Hours at Low ULF/MLF due to external Factors= Total Generation (MWHr)/ Total Average Operating load (MW)
WhereTotal Generation = (Unit AOL (MW) X U# AOHr) due to Fuel Unavailability + (Unit
AOL (MW) X Unit AOHr) due to Scheduling + (Unit AOL (MW) X Unit AOHr) due to Backing Down + (Unit AOL (MW) X Unit AOHr) due to any other external factor]
Total Average Operating Load = [{Unit AOL (MW) to Fuel Unavailability + Unit AOL (MW)} due
to Scheduling + Unit AOL (MW) to Backing Down + Unit AOL (MW) due to any other external factor]
ULF = Unit Load FactorMLF = Module Load FactorAOHr = Average Operating HourAOL = Average Operating LoadExternal factors = Fuel Unavailability/ Scheduling/ backing down/ any other external factor etc.
Station Average Operating Hours at Low ULF/MLF due to external factors = ([{(U# 1 AOL (MW) X U# 1 AOHr) at Low ULF/MLF due to external factor} + {(U# 2 AOL
(MW) X U# 2 AOHr) at Low ULF//MLF due to external factor} + … … … …] )/(Station AOL (MW) caused by low ULF/MLF due to external factors)

THERMAL POWER PLANT - Under Perform, Achieve and Trade18
WhereULF = Unit Load FactorMLF = Module Load FactorAOHr = Average Operating HourAOL = Average Operating LoadExternal factors = Fuel Unavailability/ Scheduling/ backing down/ any other external factor etc.
Unit Availability Factor={Hours in a Year – [RSHr + FO or Unavailability hour + PMO or Planned Unavailability]}/ Hours in a Year]
WhereRSHr = Reserve Shutdown HourFO = Forced OutagePMO = Planned Maintenance Outage
Station RSHr
= ([{U#1 RSHr X U#1 Capacity (MW)} + {U#2 RSHr X U#2 Capacity(MW)} + … … … … )
Total Station capacity X Hours in a Year
Station FO or Unavailability Hour
= ([{U#1 FO X U#1 Capacity (MW)} + {U#2 FO X U#2 Capacity(MW)} + … … … …])((Total Station capacity X Hours in a Year))
Station PMO or Planned
Unavailability=[{U#1 PMO X U#1 Capacity (MW)} + {U#2 PMO X U#2 Capacity (MW)} + ………….])
Total Station capacity X Hours in a Year)
Station Availability Factor= 1- [Station RSHr + Station FO or Unavailability hour + Station PMO or Planned Unavailability]
WhereRSHr = Reserve Shutdown HourFO = Forced OutagePMO = Planned Maintenance Outage
These formulas constitute the general working formulas which will find reference in all the calculations. These formulas are also used in day to day reporting to the plant management. The definition of terms mentioned above in sections shall be assumed only on above calculations in Sector specific Pro-forma (Form Sh)

THERMAL POWER PLANT - Under Perform, Achieve and Trade 19
Section 9.02 Normalization for Coal/ Lignite base Thermal Power Plant
(a) Coal/Lignite Quality in Boiler IPP Coal is extremely heterogeneous, varying
widely in their content and properties from country to country, mine to mine and even from seam to seam. The principle impurities are ash-forming minerals and sulphur. Some are interspersed through the coal seam; some are introduced by the mining process, and some principally organic sulphur, nitrogen and some minerals salts.
These impurities affect the properties of the coal and the combustion process, therefore the plant’s boiler efficiency & Turbine Efficiency. The generating companies have no control over the quality of coal supplied. The raw coal mainly being supplied to the power stations could have variation in coal quality. Further, imported coal is also being used and blended with Indian coal by large number of stations, which could also lead to variations in coal quality.
The methodology should have provisions to take care of the impact of variations in coal quality. Therefore, average “Ash, Moisture, Hydrogen and GCV” contents in the coal during the baseline period as well as for Design Coal could be considered for Normalization and the correction factor has to be worked out based on the following boiler efficiency formula:
Boiler Efficiency = 92.5 - [50 * A + 630 (M + 9 H)]G.C.V
Where:A= Ash percentage in coalM= Moisture percentage in coalH= Hydrogen percentage in coalG.C.V= Gross calorific value in kcal/kgStation heat rate (Kcal/kWh) = Turbine heat rate/Boiler efficiency
(i) Sample Calculation: Coal Quality- Designed Vs Actual
The quality of coal analyzed w.r.t. Proximate and Ultimate analysis. The ultimate analysis determines all coal component elements, solid or gaseous and the proximate analysis determines only the fixed carbon, volatile matter, and moisture and ash percentages. Coals of different ranks vary in chemical composition, lower ranks contains relatively lower carbon but higher oxygen, whereas for higher rank it will be reverse.
Proximate AnalysisUnit A Unit B
Item Unit Design Operating Design OperatingFixed Carbon % 22 Volatile matter
% 21 23.4
Moisture % 15 17.4 12 16Ash % 42 37.4 42 35.45Grindability Index
HGI 55
Higher Heating Value (GCV)
kcal/ kg
3300 3137 2824 2776
Size of Coal to Mill
mm 50
The table represents proximate and ultimate analysis of coal for a particular plant. The plant has been designed for a particular coal and any deviation from the designed could result in lower or higher efficiencies of Boiler.
Ultimate AnalysisUnit A Unit B
Item Unit Design Operating Design OperatingCarbon % 33.73 33.8 31.9 33.75Hydrogen % 2.35 2.69 2.44 2.47Sulphur % 0.37 0.5 0.5Nitrogen % 0.75 1.82 0.69 1.82Oxygen % 5.48 6.8 11.08 10.01Carbonates % 0.27 Phosphorous % 0.05 Moisture % 15 12 16Ash % 42 37.4 42 35.45
THERMAL POWER PLANT - Under Perform, Achieve and Trade20
The main constituent of Proximate and Ultimate analysis such as Ash, Moisture and hydrogen needs to be analysed w.r.t. the efficiency of Boiler.
(ii) Non Availability of fuel (Coal/Gas/Lignite) [External Factor]
Due to fuel non- availability, plant may opt to reduce the load on turbine leading to low efficiency of units and Station. Due to decreased loading, the Plant load Factor will be worsened and affects the unit heat rate. The comparison between baseline year and assessment year will be carried out through characteristics curve of Load Vs Heat rate for correction factor and will be covered under Scheduling chapter in Section 9.02.
Similar approach could be followed in case of gas/liquid fuel based generating stations. However the average plant load factor of these stations is much lower than the coal based stations perhaps due to low availability of Gas/Liquid fuel. Also the heat rate of the gas turbines is very sensitive to the unit loading and ambient air conditions. However, quality of gas supply does not vary widely and so correction for fuel quality would not be required.
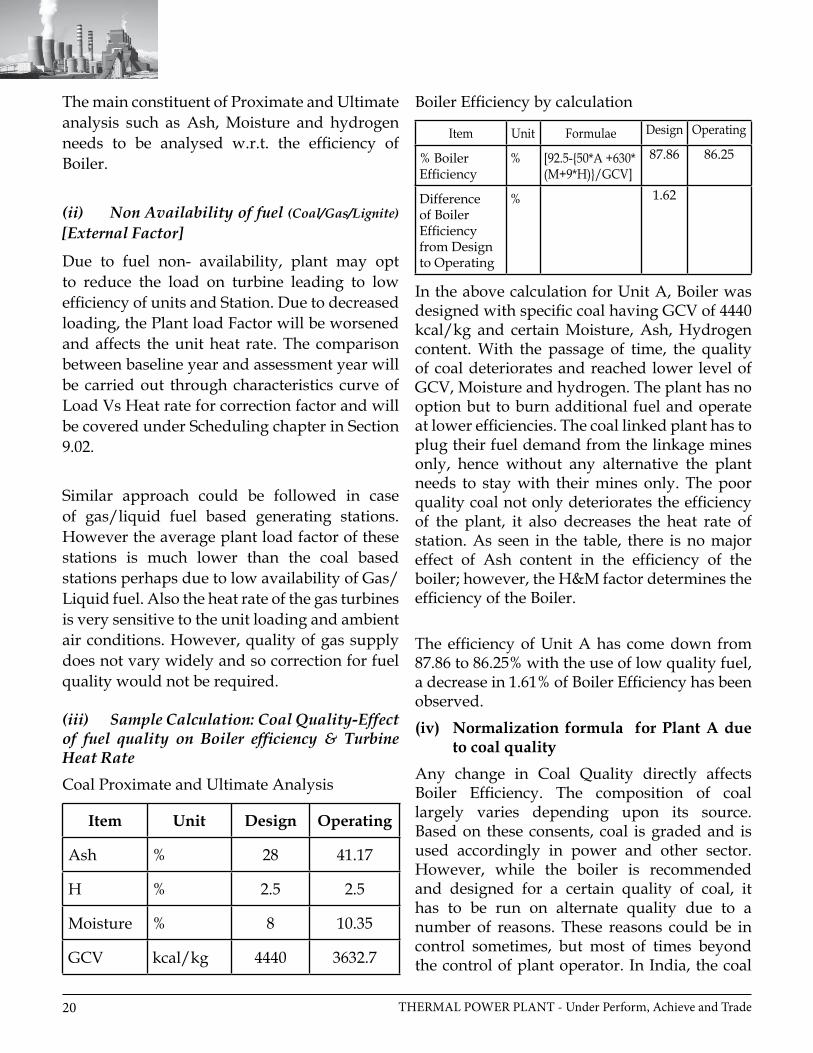
(iii) Sample Calculation: Coal Quality-Effect of fuel quality on Boiler efficiency & Turbine Heat RateCoal Proximate and Ultimate Analysis
Item Unit Design Operating
Ash % 28 41.17
H % 2.5 2.5
Moisture % 8 10.35
GCV kcal/kg 4440 3632.7
Boiler Efficiency by calculation
Item Unit Formulae Design Operating
% Boiler Efficiency
% [92.5-{50*A +630* (M+9*H)}/GCV]
87.86 86.25
Difference of Boiler Efficiency from Design to Operating
% 1.62
In the above calculation for Unit A, Boiler was designed with specific coal having GCV of 4440 kcal/kg and certain Moisture, Ash, Hydrogen content. With the passage of time, the quality of coal deteriorates and reached lower level of GCV, Moisture and hydrogen. The plant has no option but to burn additional fuel and operate at lower efficiencies. The coal linked plant has to plug their fuel demand from the linkage mines only, hence without any alternative the plant needs to stay with their mines only. The poor quality coal not only deteriorates the efficiency of the plant, it also decreases the heat rate of station. As seen in the table, there is no major effect of Ash content in the efficiency of the boiler; however, the H&M factor determines the efficiency of the Boiler.
The efficiency of Unit A has come down from 87.86 to 86.25% with the use of low quality fuel, a decrease in 1.61% of Boiler Efficiency has been observed. (iv) Normalization formula for Plant A due
to coal qualityAny change in Coal Quality directly affects Boiler Efficiency. The composition of coal largely varies depending upon its source. Based on these consents, coal is graded and is used accordingly in power and other sector. However, while the boiler is recommended and designed for a certain quality of coal, it has to be run on alternate quality due to a number of reasons. These reasons could be in control sometimes, but most of times beyond the control of plant operator. In India, the coal
THERMAL POWER PLANT - Under Perform, Achieve and Trade 21
availability has become a crisis and hence the plant management is most of the times forced to use any quality of coal that is available. Under such situations, where the coal quality cannot be controlled, and the boiler efficiency is affected, a normalization factor has been introduced. This normalization factor will take care of coal quality and give relief in Heat Rate, calculated from boiler efficiency as a result of deferred coal quality. Boiler Efficiency has been calculated using the formula considering all the aspects of coal.
Unit’s Boiler Efficiency (For design, BY and AY Coal )
=92.5 — {50*A +630*(M+9*H}
GCV of Coal
WhereBY = Baseline YearAY = Assessment YearGCV = Gross Calorific value (Kcal/ Kg)M = Moisture (in %) H = Hydrogen (in %)A = Ash (in %)
Percentage Decrease in Efficiency from calculated Boiler Operating Efficiency to calculated Boiler Design Efficiency in BY
={Calculated Boiler Design Efficiency - Calculated Boiler operating Efficiency in BY} X 100)
(Calculated Boiler Design Efficiency)
Percentage Decrease in Efficiency from calculated Boiler Operating Efficiency to calculated Boiler Design Efficiency in AY
={Calculated Boiler Design Efficiency - Calculated Boiler operating Efficiency in AY} X 100Calculated Boiler Design Efficiency
Degradation/ Upgradation of Actual Boiler Design Efficiency in BY
= {Actual Design Boiler η of Unit (As per OEM) X % Decrease in η in BY}100
WhereBY = Baseline YearOEM = Original Equipment Manufacturer
Degradation/Upgradation of Actual Boiler Design Efficiency in AY
= {Actual Design Boiler η of U# (As per OEM) X % Decrease in η in AY} 100
Where AY = Assessment YearOEM = Original Equipment Manufacturer

THERMAL POWER PLANT - Under Perform, Achieve and Trade22
Normalized Boiler Efficiency Design for Unit in BY =(Actual Design Boiler Efficiency of Unit (As per OEM) —Degradation or Upgradation of Actual Boiler Design in BY) WhereBY = Baseline YearOEM = Original Equipment Manufacturer Normalized Boiler Efficiency Design for Unit in AY = Actual Design Boiler Efficiency of Unit (As per OEM) - Degradation or Upgradation of Actual Boiler Design in AY
Where AY = Assessment YearOEM = Original Equipment Manufacturer
Difference in Normalized Boiler Efficiency between BY and AY =Normalized Boiler Design Efficiency in BY – Normalized Boiler Design Efficiency in AYWhereAY = Assessment YearBY = Baseline Year
Normalized Boiler Efficiency Design for Unit for the AY as compared to the BY If the difference in Normalized Boiler Efficiency between BY and AY is less than or equal to
zero, then No Normalization If the difference in Normalized Boiler Efficiency between BY and AY is greater than zero, then
the normalization is as below: = Actual Design Boiler Efficiency of Unit (as per OEM) – Difference in Normalized Boiler
Efficiency between BY and AY
WhereBY = Baseline YearAY = Assessment YearOEM = Original Equipment Manufacturer
Normalized Boiler Efficiency Design for Station: = [{U# 1 Capacity (MW) X Normalized Boiler Efficiency Design for U# 1 for the AY as
compared to the BY} + {U# 2 Capacity (MW) X Normalized Boiler Efficiency Design for U# 2 for the AY as compared to the BY} + …………] / Station total installed Capacity (MW)

THERMAL POWER PLANT - Under Perform, Achieve and Trade 23
WhereBY = Baseline YearAY = Assessment Year
Normalized Unit THR
= (Design THR X Normalized Boiler Efficiency Design for Unit in BY)
Normalized Boiler Efficiency Design for Unit in AY WhereTHR = Turbine Heat RateAY = Assessment YearBY = Baseline Year
Heat Rate to be normalized in the Unit Operating Heat Rate:
If the difference in Normalized Boiler Efficiency between BY and AY is less than or equal to zero, Then No Normalization.
If the difference in Normalized Boiler efficiency between BY and AY is greater than zero, then the Normalization is as below:
Turbine Heat Rate to be normalized = Normalized Unit Turbine Heat Rate – Unit Design Turbine Heat Rate
Turbine Heat Rate to be normalized in the station operating Turbine Heat Rate
=([{HR to be normalized in U# 1 THR X U# 1 Gross Generation (MU)} +{ HR to be normalized in U# 2 THR X U# 2 Gross Generation (MU) + ………..])/[U# 1 Gross Generation (MU) + U# 2 Gross Generation (MU)+ …………] )
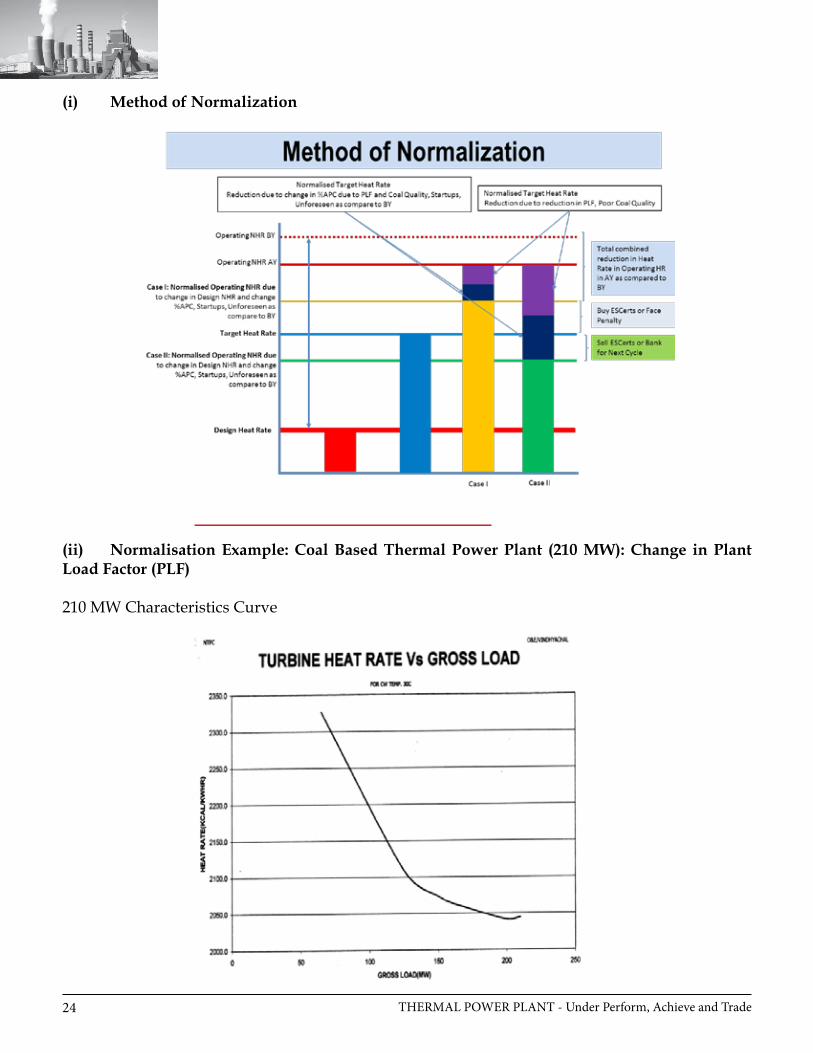
(b) Plant Load Factor [Scheduling]Coal/ Lignite based plants continued to have major contribution towards electricity generation with a major share of 86.4% of the total thermal generation. Plant load factor (PLF) of thermal power stations at the national level, during 2011-12, reduced to 73.32% from 75.08% achieved during previous year. The Lower PLF was due to increased generation loss due to coal supply problem and transmission constraints and Reserve Shut down/Low system demand
PLF will also have an effect on the Auxiliary Power Consumption of the Station. Due to low PLF, the percentage APC will increase.This factor may be beyond the control of station, such as during low schedule, grid restriction, etc. However this shall be considered in different sub-section of APC normalization.
THERMAL POWER PLANT - Under Perform, Achieve and Trade24
(i) Method of Normalization
(ii) Normalisation Example: Coal Based Thermal Power Plant (210 MW): Change in Plant Load Factor (PLF)
210 MW Characteristics Curve

THERMAL POWER PLANT - Under Perform, Achieve and Trade 25
Excel topology 210 MW Characteristics Curve
(iii) Normalisation Example for Plant A due to PLF
Change in Plant Load Factor (PLF) do affects the plant efficiency and the heat rate. PLF depends on a number of factors. These factors are sometimes under the control of plant operators and sometimes not. Moreover, at different period of times during a year, a plant may not run on a consistent PLF. All such factors which affects the generation, ultimately affects the
PLF. It is understood that the plant may not be operating on the same PLF in the Assessment Year as in Baseline Year for internal as well as external reasons. Hence, in PLF normalization, all such factors which were beyond the control of the plant management, has been taken care off and due advantage has been given. In PLF normalization, like other normalizations, the benefit has been calculated and given in terms of Heat rate which will directly be subtracted from the Net Operating Heat Rate.
y = 0.017x2 - 6.5974x + 2684.1
R² = 0.9974
2000
2050
2100
2150
2200
2250
2300
2350
0 50 100 150 200 250
kca
l/k
Wh
Load (MW)
Load (MW) Vs Turbine Heat Rate (kcal/kWh)
Percentage Difference between Design Turbine Heat Rate and Design Curve or HBD Turbine Heat Rate
=(Design THR @ 100% Load (OEM) - Design THR @ 100% Load (Curve or HBD) X 100)
Design THR @ 100% Load (OEM)
WhereTHR = Turbine Heat Rate (kcal/kWh)OEM = Original Equipment ManufacturerHBD = Heat Balance Diagram

THERMAL POWER PLANT - Under Perform, Achieve and Trade26
Total Operating hours in year as per Unit Availability factor (hrs/annum) = Total hour in a year X Plant Availability
Factor
Operating hours at full load (hrs/annum) =Total Operating hours in year as per Unit
Availability factor - AOHrs at Low ULF/MLF
WhereAOHr = Average Operating Hours (hr)ULF = Unit Load FactorMLF = Module Load Factor
Loading Vs Heat Rate Equation given as y = ax2 - bx + c will be used to calculate the Turbine Heat Rate as per Load Vs Heat Rate Equation due to external factor.
y = ax2 - bx + c (kcal/kWh)
WhereX = Operating Load (MW)A = Equation Constant 1 =0.0171b = Equation Constant 2 = 6.6159c = Equation Constant 3 = 2684.8
Turbine Heat Rate as per Load Vs Heat Rate Equation due to external factor (kcal/kWh)=Equation Constant 1*(Average Operating Load (MW)caused by low ULF, MLF due to external factor)^2Equation Constant 2* Average Operating Load (MW)caused by low ULF,MLF due to external factor+Equation Constant 3
Design Turbine Heat Rate after Curve correction and difference correction
= THR as per Load Vs HR Equation due to external factor X [1 + {% Difference between Design Turbine or Module HR and Design Curve or HBD Turbine or Module HR/ 100}]
Where
THR = Turbine Heat Rate (kcal/kWh)
L Vs HR = Load Vs Heat Rate
HBD = Heat balance Diagram
Normalized Design Turbine Heat rate due to external factor (kcal/kWh)
= [Design THR @ 100% Load (OEM) X Operating hours at full load + Design THR after Curve correction and difference correction X AOHrs at Low ULF/MLF ] /Total Operating hours in year as per UAF
Where
THR = Turbine Heat Rate (kcal/kWh)
OEM = Original Equipment Manufacturer
AOHr = Average Operating Hours
UAF = Unit Availability Factor
Difference of Turbine Heat Rate due to external factor between AY and BY (kcal/kWh)
= Normalized Design THR due to external factor in AY - Normalized Design THR due to external factor in BY
Where
THR = Turbine Heat Rate (kcal/kWh)
AY = Assessment Year
BY = Baseline Year
Normalized Design Turbine Heat rate due to external factor as compared to BY
= Design THR @ 100% Load (OEM) + Difference of THR due to external factor between AY and BY

THERMAL POWER PLANT - Under Perform, Achieve and Trade 27
Where THR = Turbine Heat Rate (kcal/kWh)AY = Assessment YearBY = Baseline YearOEM = Original Equipment Manufacturer
Normalized Designed Station Turbine Heat Rate due to ULF as compared to BY =[Normalized U# 1 Design THR due to
external factor as compared to BY X U# 1 Capacity + Normalized U# 2 Design THR due to external factor as compared to BY X U# 2 Capacity + ……………] / Station installed Total Capacity (MW)
WhereTHR = Turbine Heat Rate (kcal/kWh)BY = Baseline Year
Weighted Design Turbine Heat Rate of Station =[U# 1 Capacity X U# 1 Design THR @
100% Load (OEM) + U# 2 Capacity X U# 2 Design THR @ 100% Load (OEM) + …………..] / Station installed Total Capacity (MW)
WhereTHR = Turbine Heat Rate (kcal/kWh)OEM = Original Equipment Manufacturer
Difference of THR between Normalized Design Heat Rate and Design Heat Rate =Normalized Design Station THR due to
ULF as compared to BY – Station Weighted Design THR
ULF = Unit Load FactorTHR = Turbine Heat Rate (kcal/kWh)BY = Baseline Year
PLF Normalization = Difference of THR between NDHR and DHR
(c) Auxiliary Power Consumption (APC) Normalization
Auxiliary Power Consumption (APC) has a significant contribution in determining the Net Heat Rate of any Station. As other factors in a Power Plant, APC is also subject to change at different period of time. It primarily depends on the unit loading ultimately affecting the drives. It also depends on the ambient conditions at times. It is hence, very important to study the characteristics of APC during Assessment year and Baseline year. The APC in baseline Year and Assessment Year may not be same and therefore normalization for APC was needed to be introduced. Accordingly, The normalization has been worked out and, again as others,It gives the benefit in heat rate due to effect of APC. PLF will also have an effect on the Auxiliary Power Consumption of the Station. Due to low PLF, the percentage APC will increase. This factor may be beyond the control of station, such as during low schedule, grid restriction, etc. However this shall be considered in different sub-section of APC normalization.
The normalization of APC can be subdivided into three categoriesi) APC normalization due to external factorsii) APC normalization for PA Fan loading
due to change in coal qualityiii) APC normalization for Coal Grinding Mill,
ID Fans and Ash Handling Plantloading due to change in coal quality
(i) APC normalization due to external factorsThe APC of Thermal Power Plant is not fully dependent on the loading of plant. Due to decrease in PLF, the APC will not decrease with same ratio. Hence, a trend line equation could be generated from the normal operating condition of the Plant taking the data of APC and Plant loading for a station. The Excell topology of the Trendline equation is shown below

THERMAL POWER PLANT - Under Perform, Achieve and Trade28
| 38
y = -0.0001x2 - 0.0304x + 9.6114R² = 0.9031
0.00
1.00
2.00
3.00
4.00
5.00
6.00
7.00
8.00
0.00 20.00 40.00 60.00 80.00 100.00 120.00
Series1
Poly. (Series1)
Auxiliary Power Consumption Trendline Equationy = ax2 - bx + c will be used to calculate the Turbine Heat Rate as per Load Vs Heat Rate Equation due to external factor.y = ax2 - bx + c WhereX = Operating Load (MW)A = Equation Constant 1 b = Equation Constant 2c = Equation Constant 3
Operating Hours at full load =(Total hours in a year X PAF) —Weighted AOHr at Low loading due to external factor — Weighted AOHr at Low loading due to
internal factor)WherePAF = Plant Availability FactorAOHr = Average Operating Hours
Weighted Operating Station Load =[{Station Capacity X Operating Hours at
Full Load} + {Station AOL (MW) caused
by low loading due to external factor X Weighted AOHr at Low loading due to external factor} + {Station AOL (MW) caused by low loading due to internal factor X Weighted AOHr at Low loading due to internal factor} ] / [Weighted AOHr at Low loading due to external factor + Weighted AOHr at Low loading due to internal factor+ Operating Hours at full load]
WhereAOHr = Average Operating Hours (Hrs)AOL = Average Operating Load (MW)
Actual Loading Factor (%)
=(Weighted Operating Station Load X 100)
Station Capacity Actual Loading Factor for BY
= (461.92*100)/630 = 73.321 %Actual Loading Factor for AY
= (377.55*100)/630 = 59.929 %
Weighted Station Load without external factor (MW)= [{Station Capacity X Weighted AOHr at Low

THERMAL POWER PLANT - Under Perform, Achieve and Trade 29
loading due to external factor} + {Station Capacity X Operating hours at full Load} + {AOL (MW) caused by low loading due to Internal factor X Weighted AOHr at Low loading due to internal factor}] / [Weighted AOHr at Low loading due to external factor+Weighted AOHr at Low loading due to internal factor +Operating hours at full Load]
WhereAOHr = Average Operating Hours (Hrs)AOL = Average Operating Load (MW)
Normalized Loading Factor
=
(Weighted Station Load without external factor (MW)X 100
Station Capacity (MW) Percentage APC as per Trend Line for AY and BY
This shall be calculated by the % APC Trend Line equation mentioned above for Assessment Year and baseline year individually.
=Constant 1 *(Normalized Loading Factor) ^2-Constant 2*Normalized Loading Factor + Constant 3WhereAPC =Auxiliary Power ConsumptionBY = Baseline YearAY = Assessment Year
Difference in APC of AY From BY= % APC as per trend line in AY -% APC as per trend line in BY
WhereAPC =Auxiliary Power ConsumptionBY = Baseline YearAY = Assessment Year
Normalized APC If the difference in APC of AY From BY is
less than or equal to zero, then Normalized APC will be same as operating station APC.
If the difference in APC of AY From BY is greater than zero, then normalized APC is as below:
Normalized APC = Station Operating APC - Difference in APC of AY From BY
WhereAPC =Auxiliary Power ConsumptionBY = Baseline YearAY = Assessment Year
APC Normalization in terms of Heat Rate
APC Normalization for external factors (kcal/kWh)
= Operating GHR in AY
—1-% APC of AY
(Operating GHR in AY) (1- % normalized APC)
WhereGHR =Gross Heat Rate (kcal/kWh)AY =Assessment YearAPC =Auxiliary Power Consumption
(ii) APC normalization for PA Fan loading due to change in coal quality
Due to change in coal quality, there may be a marginal/ significant impact on the energy consumption of PA fans. This is primarily due to the reason that poor coal quality will increase the coal consumption and increased coal consumption will need more Primary air. To calculate this we arrive to a Trendline equation of specific PA consumption per tonne of coal by comparing the design Specific PA consumption of different sized units.
By the GCV of coal, Generation and GHR of Baseline and Assessment year, we can calculate the actual coal consumption of BY and AY. By comparing the GCV of BY with AY and

THERMAL POWER PLANT - Under Perform, Achieve and Trade30
multiplying it with the total coal flow of BY, we can obtain the normalized coal consumption of the unit. The excel topology of Trendline
y = 6.0487x-0.2055
R² = 0.8731
0.00
0.50
1.00
1.50
2.00
2.50
0.00 100.00 200.00 300.00 400.00 500.00 600.00
Sp
eci
fic
PA
/To
nn
eo
fC
oa
l
Load (MW)
equation for specific PA calculation is shown below.
From the above Trendline equation, we will calculate the total PA requirement with normalized coal consumption and that of BY. Now by calculating the volume of PA and ultimately the power consumption of PA, we can calculate the increase in Power consumption of PA as a result of change in Coal GCV. It shall be described with examples in the chapters ahead.
The formula for calculation of increase in energy consumption of PA as a result of change in coal quality is mentioned below.
Total Coal Consumption per unit (AY and BY) (Tonnes/Hr)= (GHR X Operating Load)/ Coal GCVWhere GHR = Gross Heat Rate (kcal/kWh)GCV = Gross Calorific Value (kcal/kg)
Normalized Total Coal Consumption per unit(Tonnes/Hr) = Total Coal Consumption X Coal GCV for BY/ Coal GCV for AY
Where GHR = Gross Heat Rate (kcal/kWh)GCV = Gross Calorific Value (kcal/kg)
Increase in coal consumption due to change in GCV of coal in AY (Tonnes/Hr)=Normalised Coal Consumption (tonne/hr)-Total consumption of BY (tonnes/hr)
Total Primary Air requirement per tonne of coal Trendline equation y=6.048x-0.2055
Where Y= total PA requirement /tonne of coal (Tonnes)x= operating load (MW)
Total Primary Air requirement (Tonnes/hr)=Normalised coal consumption (TPH) X PA requirement per tonne of coal as per Trendline equation(tonne)Where
Recommended