Deutsche Bank Corporate and Investment Bank
Inflation Hedging it & Trading it

This advertisement has been approved and/or communicated by Deutsche Bank AG London. The services described in this advertisement are provided by Deutsche Bank AG or by its subsidiaries and/or affiliates in accordance with appropriate local legislation and regulation. Deutsche Bank AG is authorised under German Banking Law (competent authority: BaFin – Federal Financial Supervising Authority) and regulated by the Financial Services Authority for the conduct of UK business. Securities and investment banking activities in the United States are performed by Deutsche Bank Securities Inc., member NYSE, FINRA and SIPC, and its broker-dealer affiliates. Lending and other commercial banking activities in the United States are performed by Deutsche Bank AG, and its banking affiliates. © Copyright Deutsche Bank 2011.
Deutsche Bank Corporate & Investment Bank
Winning for our clients:Inflation Derivatives House of the Year.At Deutsche Bank, we are dedicated to setting the stage so that our clients can perform at their best. We appreciate winning awards that recognize the quality of service that we deliver.
Doremus Deutsche Bank ClearPath 210x297mm 300944 Proof 01 07-07-2011
Inflation —Hedging it & Trading it Deutsche Bank
Introduction Why inflation, why now?
1.0 Deutsche Bank’s capabilities and credentials in this market 1.1 How Deutsche Bank’s inflation offering differs from competitors
2.0 Market Overview – the rise and rise of inflation volatility 2.1 Components of Inflation indices
3.0 Inflation Linked Bonds 3.1 Inflation Linked Bonds 3.2 Real Yield and Breakeven Inflation and Inflation Protection 3.3 Indexation and Breakeven Inflation 3.4 Risk Measures, EM Sovereign Linkers, Seasonality, and US TIPS 3.5 UK Index Linked Gilts, EUR Sovereign Linkers, and other Important Markets 3.6 ILB coupon frequency and settlement characteristics
4.0 Inflation Swaps 4.1 ILS Swaps and Markets 4.2 UK Swaps, Corporate Linkers, and US Swaps 4.3 ILS Indexation 4.4 ILS Pension Fund demand
5.0 Assessing Relative Value 5.1 Linker Asset Swaps and the Leverage Effect 5.2 5 sources of Asset Swap Difference 5.3 What is the ‘Fair’ Price for Inflation Protection? 5.4 Fair Credit Spread of Inflation Linked Bonds 5.5 Hedge with Bonds or Swaps 5.6 Summary
6.0 Inflation Options 6.1 Inflation Options 6.2 Who are the major players in the options market? 6.3 Option Products 6.4 What are the trading opportunities? 6.5 Option Strategies 6.6 Creating Optimal Hedges
7.0 Deflation tail risk 7.1 Deflation Tail Risk: DB 5 Year Note
8.0 Case Study – Zero-Coupon Option Trade
9.0 Further Reading 9.1 Inflation Hedging for Institutional Investors
10.0 Contacts 10.1 Deutsche Bank Global Inflation Team
Contents
Inflation —Hedging it & Trading it Deutsche Bank
There has never been a better time to talk about inflation
– Inflation looks set to be volatile for the next 5 to 10 years – Any client with a bond portfolio is exposed to inflation risk – Clients with revenues or liabilities indexed to inflation are especially vulnerable.
Deutsche Bank is very strongly positioned to advise clients on what to do
– We were recently voted the Best Inflation Derivatives house in the industry by Risk magazine – We have a large global inflation derivatives trading and structuring team – We have extensive experience of helping clients find inflation solutions
The Deutsche Bank inflation team has developed this briefing document to:
– Set out the challenges and opportunities faced by clients – Explain the products and strategies we have developed.
The Deutsche Bank Global Inflation team can help
Introduction Why inflation, why now?
Inflation Derivatives House of the Year

Inflation —Hedging it & Trading it Deutsche Bank
1Deutsche Bank’s credentials and capabilities in the Inflation marketHow Deutsche Bank’s inflation offerings differ from competitors
Contents
Inflation —Hedging it & Trading it Deutsche Bank
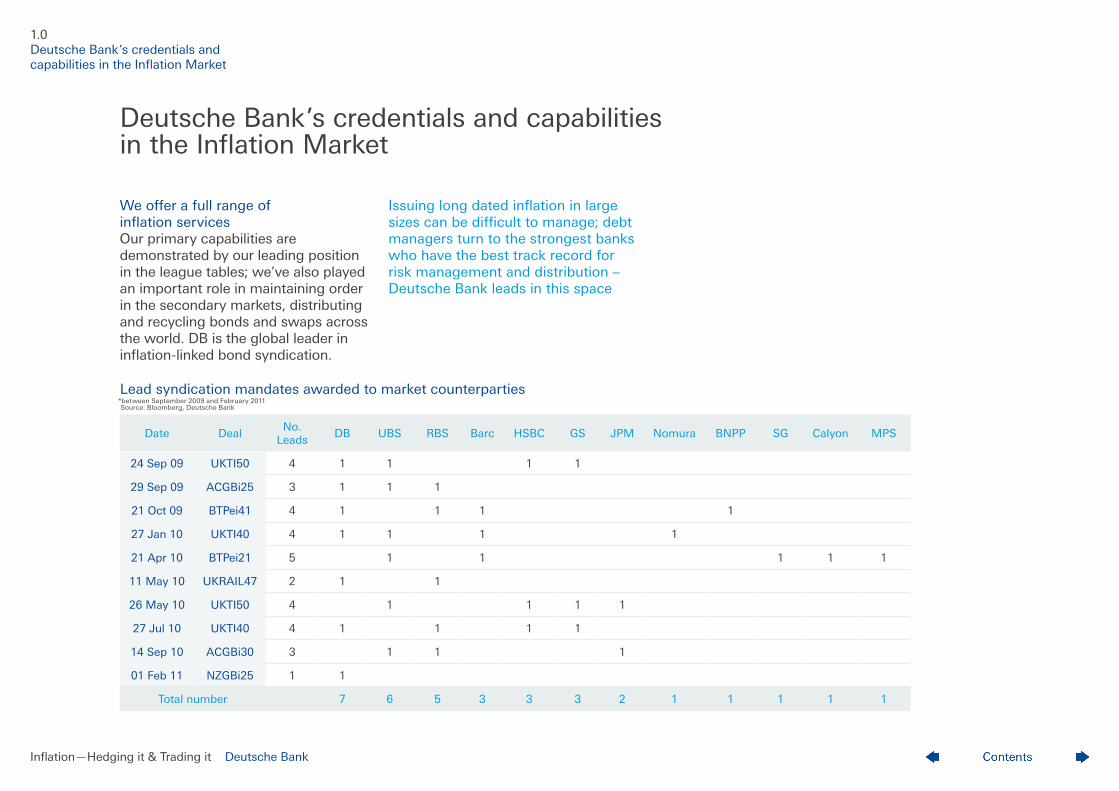
We offer a full range of inflation services Our primary capabilities are demonstrated by our leading position in the league tables; we’ve also played an important role in maintaining order in the secondary markets, distributing and recycling bonds and swaps across the world. DB is the global leader in inflation-linked bond syndication.
Date DealNo.
LeadsDB UBS RBS Barc HSBC GS JPM Nomura BNPP SG Calyon MPS
24 Sep 09 UKTI50 4 1 1 1 1
29 Sep 09 ACGBi25 3 1 1 1
21 Oct 09 BTPei41 4 1 1 1 1
27 Jan 10 UKTI40 4 1 1 1 1
21 Apr 10 BTPei21 5 1 1 1 1 1
11 May 10 UKRAIL47 2 1 1
26 May 10 UKTI50 4 1 1 1 1
27 Jul 10 UKTI40 4 1 1 1 1
14 Sep 10 ACGBi30 3 1 1 1
01 Feb 11 NZGBi25 1 1
Total number 7 6 5 3 3 3 2 1 1 1 1 1
Issuing long dated inflation in large sizes can be difficult to manage; debt managers turn to the strongest banks who have the best track record for risk management and distribution – Deutsche Bank leads in this space
Lead syndication mandates awarded to market counterparties *between September 2009 and February 2011 Source: Bloomberg, Deutsche Bank
Deutsche Bank’s credentials and capabilities in the Inflation Market
1.0 Deutsche Bank’s credentials and capabilities in the Inflation Market
Inflation —Hedging it & Trading it Deutsche Bank
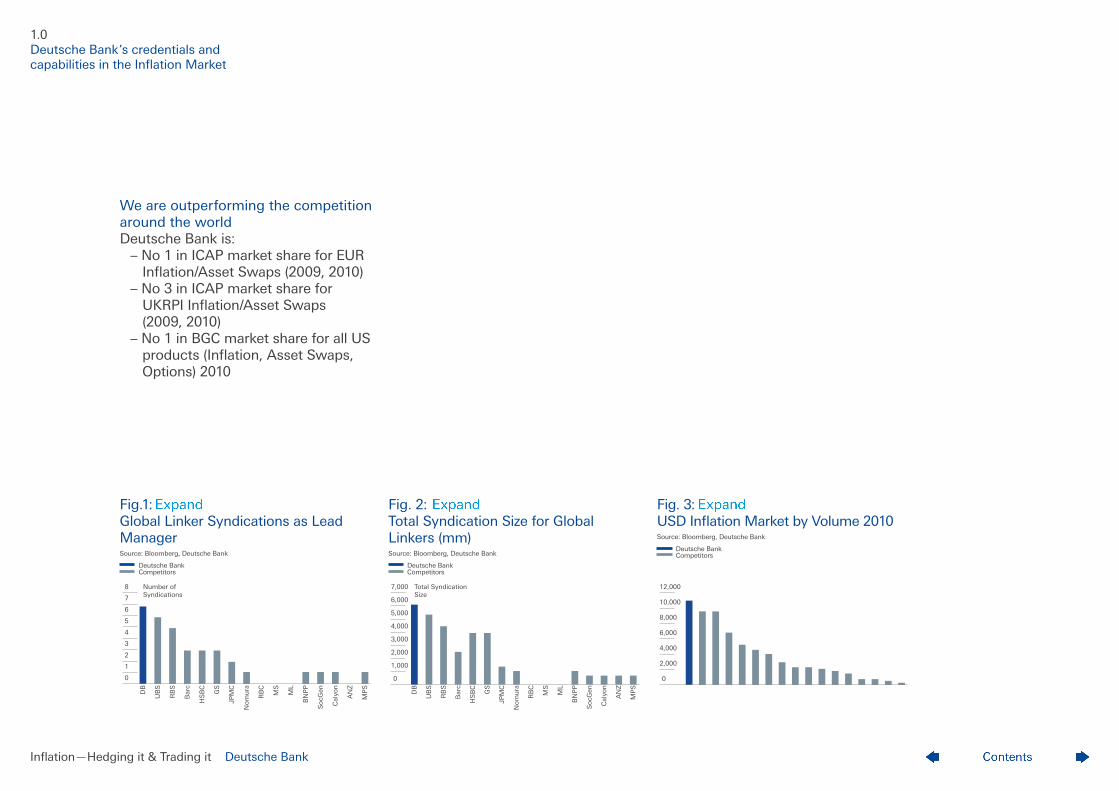
We are outperforming the competition around the world Deutsche Bank is: – No 1 in ICAP market share for EUR Inflation/Asset Swaps (2009, 2010) – No 3 in ICAP market share for UKRPI Inflation/Asset Swaps (2009, 2010) – No 1 in BGC market share for all US products (Inflation, Asset Swaps, Options) 2010 Fig.1: Global Linker Syndications as Lead Manager Source: Bloomberg, Deutsche Bank
Deutsche Bank Competitors
Fig. 2: Total Syndication Size for Global Linkers (mm) Source: Bloomberg, Deutsche Bank
Deutsche Bank Competitors
Fig. 3: USD Inflation Market by Volume 2010 Source: Bloomberg, Deutsche Bank
Deutsche Bank Competitors
DB
UB
S
RB
S
Bar
c
HS
BC
GS
JPM
C
No
mu
ra
So
cGen
BN
PP
ML
MS
RB
C
Cal
yon
AN
Z
MP
S
4
3
2
1
0
5
6
7
8 Number ofSyndications
0
7,000
6,000
5,000
4,000
3,000
2,000
1,000
DB
UB
S
RB
S
Bar
c
HS
BC
GS
JPM
C
No
mu
ra
So
cGen
BN
PP
ML
MS
RB
C
Cal
yon
AN
Z
MP
S
Total SyndicationSize
0
12,000
10,000
8,000
6,000
4,000
2,000
1.0 Deutsche Bank’s credentials and capabilities in the Inflation Market
Inflation —Hedging it & Trading it Deutsche Bank
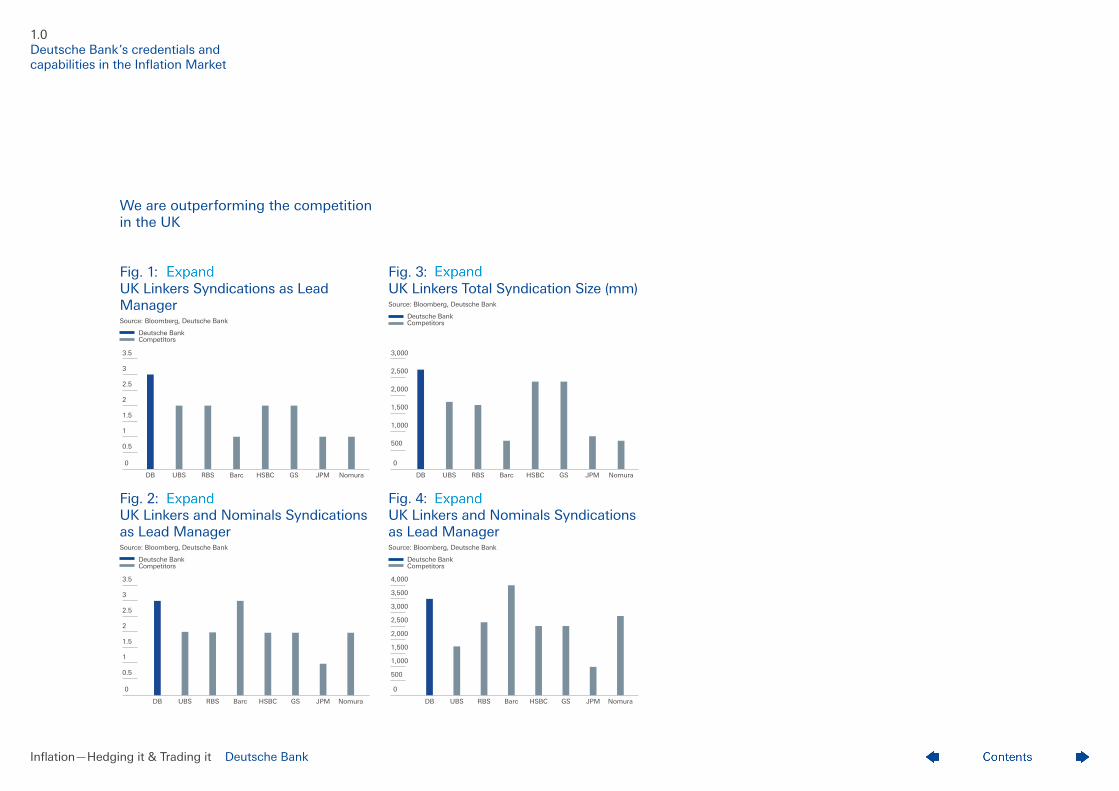
We are outperforming the competition in the UK Fig. 1: UK Linkers Syndications as Lead Manager Source: Bloomberg, Deutsche Bank
Deutsche Bank Competitors
Fig. 2: UK Linkers and Nominals Syndications as Lead Manager Source: Bloomberg, Deutsche Bank
Deutsche Bank Competitors
Fig. 3: UK Linkers Total Syndication Size (mm) Source: Bloomberg, Deutsche Bank
Deutsche Bank Competitors
Fig. 4: UK Linkers and Nominals Syndications as Lead Manager Source: Bloomberg, Deutsche Bank
Deutsche Bank Competitors
DB UBS RBS Barc HSBC GS JPM Nomura
0
3.5
3
2.5
2
1.5
1
0.5
DB UBS RBS Barc HSBC GS JPM Nomura
4,000
3,500
3,000
2,500
2,000
1,500
1,000
500
0
DB UBS RBS Barc HSBC GS JPM Nomura
0
3,000
2,500
2,000
1,500
1,000
500
0
3.5
3
2.5
2
1.5
1
0.5
DB UBS RBS Barc HSBC GS JPM Nomura
1.0 Deutsche Bank’s credentials and capabilities in the Inflation Market
Inflation —Hedging it & Trading it Deutsche Bank
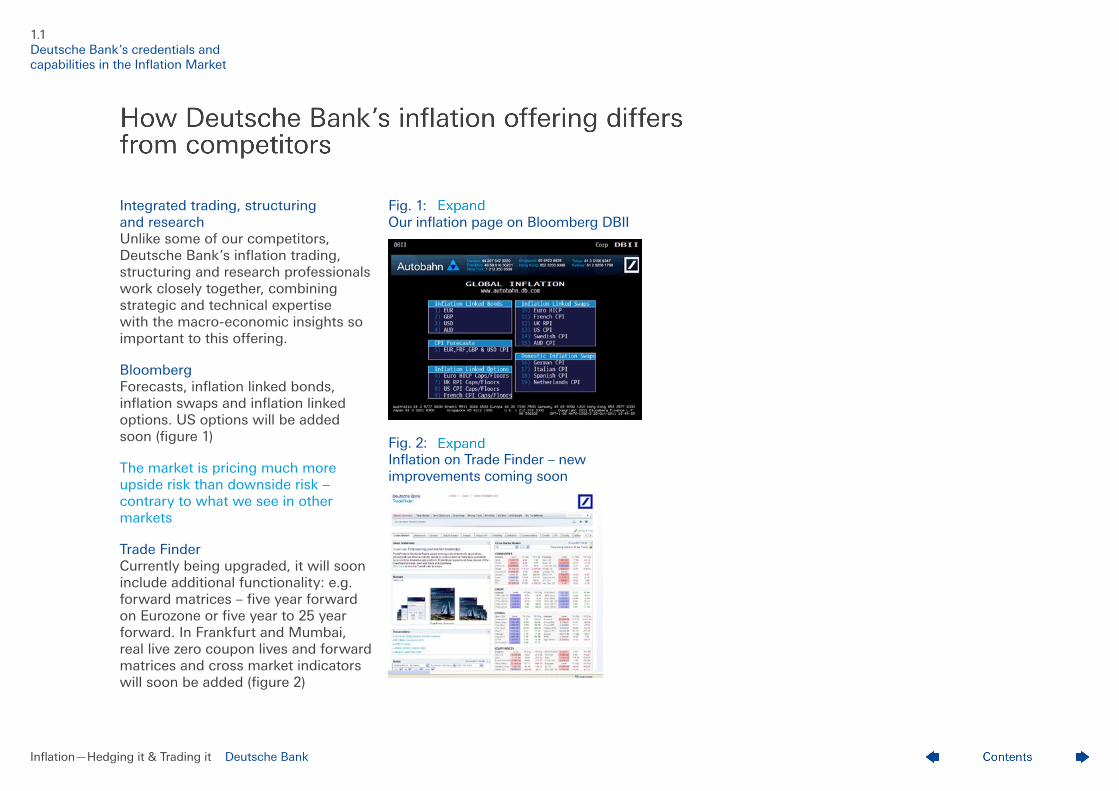
Integrated trading, structuring and research Unlike some of our competitors, Deutsche Bank’s inflation trading, structuring and research professionals work closely together, combining strategic and technical expertise with the macro-economic insights so important to this offering.
Bloomberg Forecasts, inflation linked bonds, inflation swaps and inflation linked options. US options will be added soon (figure 1)
The market is pricing much more upside risk than downside risk – contrary to what we see in other markets
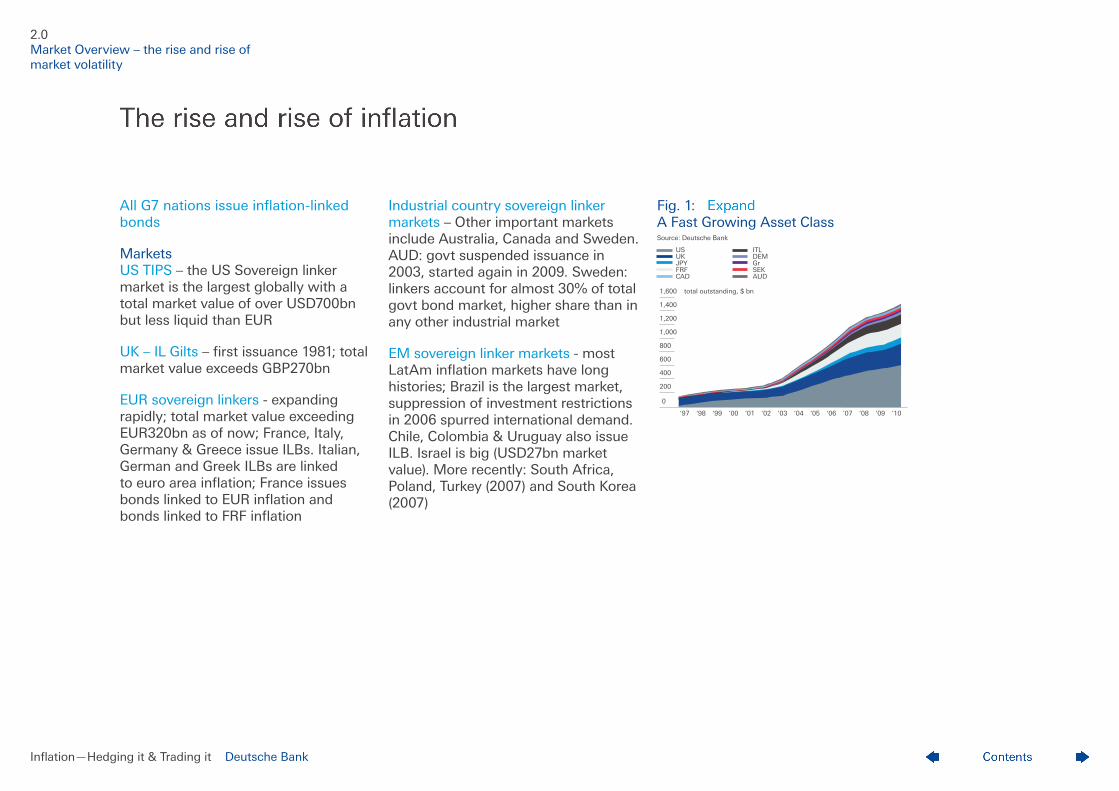
Trade Finder Currently being upgraded, it will soon include additional functionality: e.g. forward matrices – five year forward on Eurozone or five year to 25 year forward. In Frankfurt and Mumbai, real live zero coupon lives and forward matrices and cross market indicators will soon be added (figure 2)
Fig. 1: Our inflation page on Bloomberg DBII
Fig. 2: Inflation on Trade Finder – new improvements coming soon
1.1 Deutsche Bank’s credentials and capabilities in the Inflation Market

Inflation —Hedging it & Trading it Deutsche Bank
2 Market Overview
Components of Inflation indices
Contents
Inflation —Hedging it & Trading it Deutsche Bank
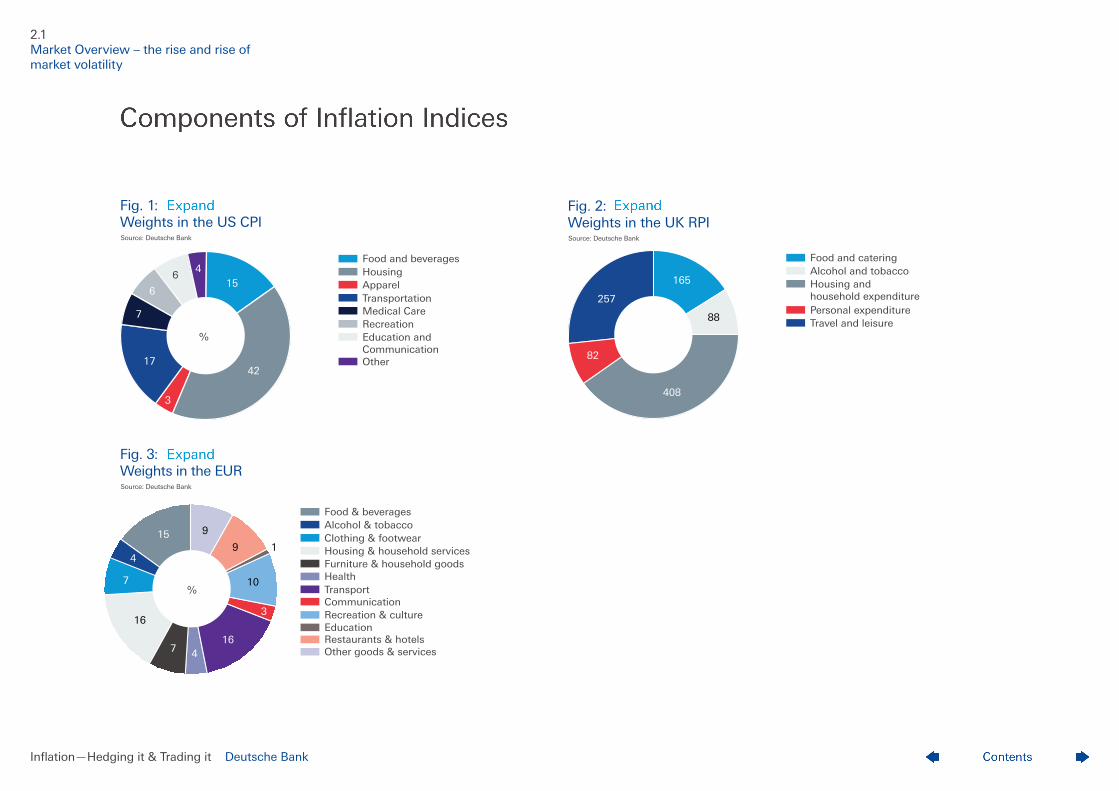
All G7 nations issue inflation-linked bonds
Markets US TIPS – the US Sovereign linker market is the largest globally with a total market value of over USD700bn but less liquid than EUR
UK – IL Gilts – first issuance 1981; total market value exceeds GBP270bn
EUR sovereign linkers - expanding rapidly; total market value exceeding EUR320bn as of now; France, Italy, Germany & Greece issue ILBs. Italian, German and Greek ILBs are linked to euro area inflation; France issues bonds linked to EUR inflation and bonds linked to FRF inflation
Industrial country sovereign linker markets – Other important markets include Australia, Canada and Sweden. AUD: govt suspended issuance in 2003, started again in 2009. Sweden: linkers account for almost 30% of total govt bond market, higher share than in any other industrial market
EM sovereign linker markets - most LatAm inflation markets have long histories; Brazil is the largest market, suppression of investment restrictions in 2006 spurred international demand. Chile, Colombia & Uruguay also issue ILB. Israel is big (USD27bn market value). More recently: South Africa, Poland, Turkey (2007) and South Korea (2007)
Fig. 1: A Fast Growing Asset Class Source: Deutsche Bank
US ITL UK DEM JPY Gr FRF SEK CAD AUD
2.0 Market Overview – the rise and rise of market volatility
‘97 ‘98 ‘99 ‘00 ‘09 ‘10‘01 ‘02 ‘03 ‘04 ‘05 ‘06 ‘07 ‘08
0
1,600 total outstanding, $ bn
1,200
1,400
1,000
800
600
400
200
Inflation —Hedging it & Trading it Deutsche Bank
‘97 ‘98 ‘99 ‘00 ‘09 ‘10‘01 ‘02 ‘03 ‘04 ‘05 ‘06 ‘07 ‘08
0
1,600
1,200
1,400
1,000
800
600
400
200
%
Food and beveragesHousingApparelTransportationMedical CareRecreation
Other
Education andCommunication
15
42
3
4
17
7
6
6
‘97 ‘98 ‘99 ‘00 ‘09 ‘10‘01 ‘02 ‘03 ‘04 ‘05 ‘06 ‘07 ‘08
0
1,600
1,200
1,400
1,000
800
600
400
200
Food and cateringAlcohol and tobaccoHousing andhousehold expenditurePersonal expenditureTravel and leisure88
408
82
257
165
%
Food & beverages
Clothing & footwear
Furniture & household goodsHealth
Alcohol & tobacco
Housing & household services
Recreation & cultureEducationRestaurants & hotelsOther goods & services
TransportCommunication
16
7
7
4
3
4
15
16
10
19
9
2.1 Market Overview – the rise and rise of market volatility
Fig. 3: Weights in the EUR Source: Deutsche Bank
Fig. 1: Weights in the US CPI Source: Deutsche Bank
Fig. 2: Weights in the UK RPI Source: Deutsche Bank
Inflation —Hedging it & Trading it Deutsche Bank
3 Inflation Linked Bonds
Inflation Linked Bonds Real Yield and Breakeven Inflation and Inflation Protection Indexation and Breakeven Inflation Risk Measures, EM Sovereign Linkers, Seasonality and US TIPS UK Index Linked Gilts, EUR Sovereign and other Important Markets ILB coupon frequency and settlement characteristics
Contents
Inflation —Hedging it & Trading it Deutsche Bank
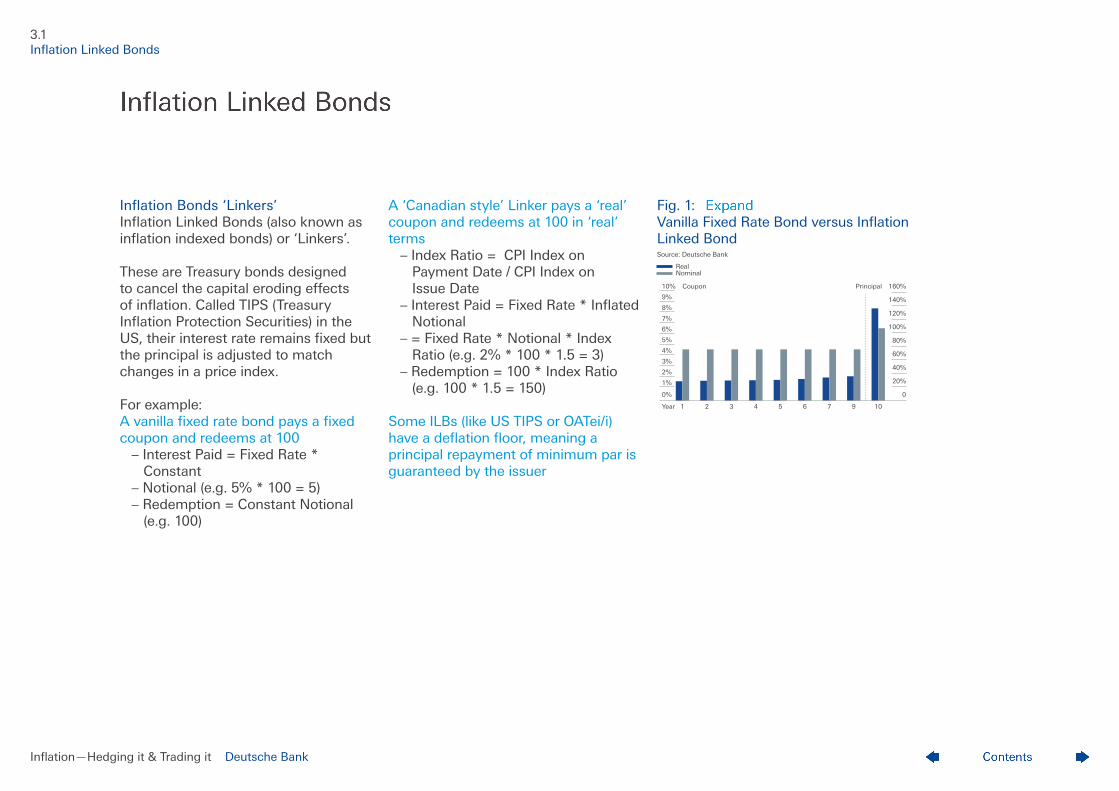
Inflation Bonds ‘Linkers’ Inflation Linked Bonds (also known as inflation indexed bonds) or ‘Linkers’.
These are Treasury bonds designed to cancel the capital eroding effects of inflation. Called TIPS (Treasury Inflation Protection Securities) in the US, their interest rate remains fixed but the principal is adjusted to match changes in a price index.
For example: A vanilla fixed rate bond pays a fixed coupon and redeems at 100 – Interest Paid = Fixed Rate * Constant – Notional (e.g. 5% * 100 = 5) – Redemption = Constant Notional (e.g. 100)
A ‘Canadian style’ Linker pays a ‘real’ coupon and redeems at 100 in ‘real’ terms – Index Ratio = CPI Index on Payment Date / CPI Index on Issue Date – Interest Paid = Fixed Rate * Inflated Notional – = Fixed Rate * Notional * Index Ratio (e.g. 2% * 100 * 1.5 = 3) – Redemption = 100 * Index Ratio (e.g. 100 * 1.5 = 150)
Some ILBs (like US TIPS or OATei/i) have a deflation floor, meaning a principal repayment of minimum par is guaranteed by the issuer
Fig. 1: Vanilla Fixed Rate Bond versus Inflation Linked Bond Source: Deutsche Bank
Real Nominal
3.1 Inflation Linked Bonds
1 2 3 4 5 6 7 9 10
6%
5%
4%
3%
2%
1%
0%
Year
7%
8%
9%
10% Coupon Principal
80%
60%
40%
20%
0
100%
120%
140%
160%
Inflation —Hedging it & Trading it Deutsche Bank
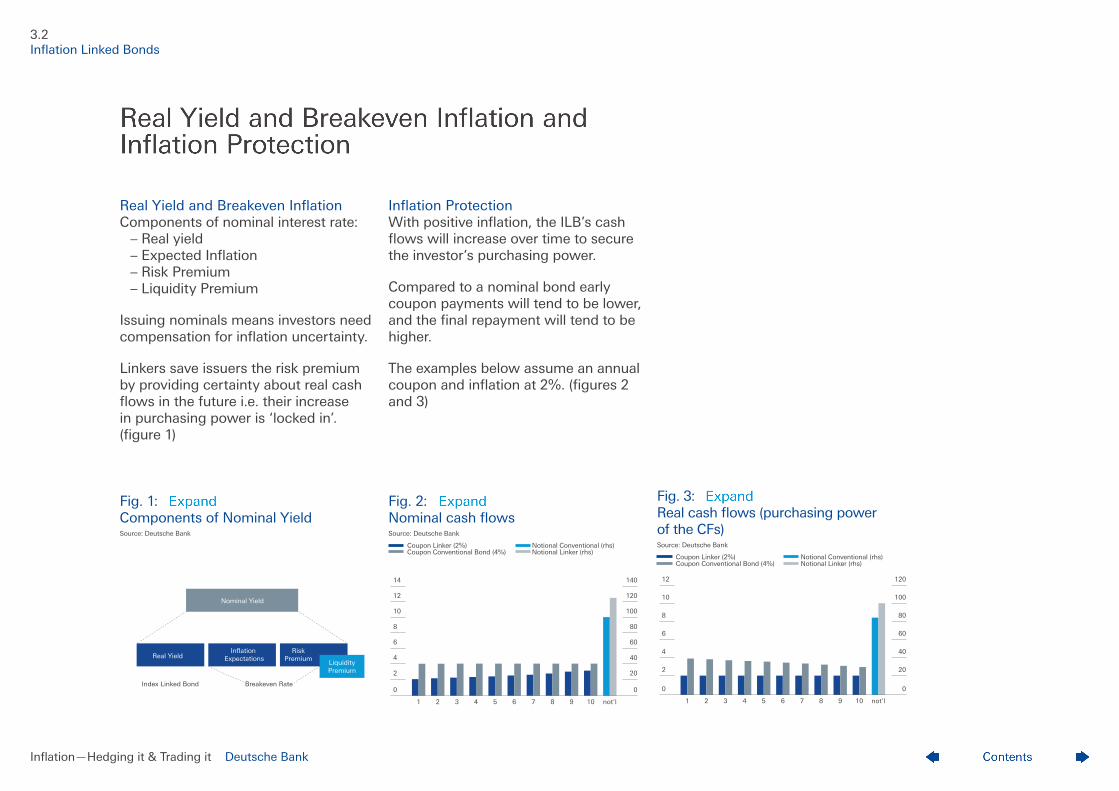
Real Yield and Breakeven Inflation Components of nominal interest rate: – Real yield – Expected Inflation – Risk Premium – Liquidity Premium
Issuing nominals means investors need compensation for inflation uncertainty.
Linkers save issuers the risk premium by providing certainty about real cash flows in the future i.e. their increase in purchasing power is ‘locked in’. (figure 1) Fig. 1: Components of Nominal Yield Source: Deutsche Bank
Inflation Protection With positive inflation, the ILB’s cash flows will increase over time to secure the investor’s purchasing power.
Compared to a nominal bond early coupon payments will tend to be lower, and the final repayment will tend to be higher.
The examples below assume an annual coupon and inflation at 2%. (figures 2 and 3) Fig. 2: Nominal cash flows Source: Deutsche Bank
Coupon Linker (2%) Notional Conventional (rhs) Coupon Conventional Bond (4%) Notional Linker (rhs)
Fig. 3: Real cash flows (purchasing power of the CFs) Source: Deutsche Bank
Coupon Linker (2%) Notional Conventional (rhs) Coupon Conventional Bond (4%) Notional Linker (rhs)
1 2 3 4 5 6 7 9 10
6%
5%
4%
3%
2%
1%
0%
7%
8%
9%
Nominal Yield
Breakeven RateIndex Linked Bond
Real YieldInflation
ExpectationsRisk
PremiumLiquidityPremium
1 2 3 4 5 6 7 8 9 not’l10
60
40
20
0
80
100
120
140
6
4
2
0
8
10
12
14
1 2 3 4 5 6 7 8 9 not’l10
60
40
20
0
80
100
120
6
4
2
0
8
10
12
3.2 Inflation Linked Bonds
Inflation —Hedging it & Trading it Deutsche Bank
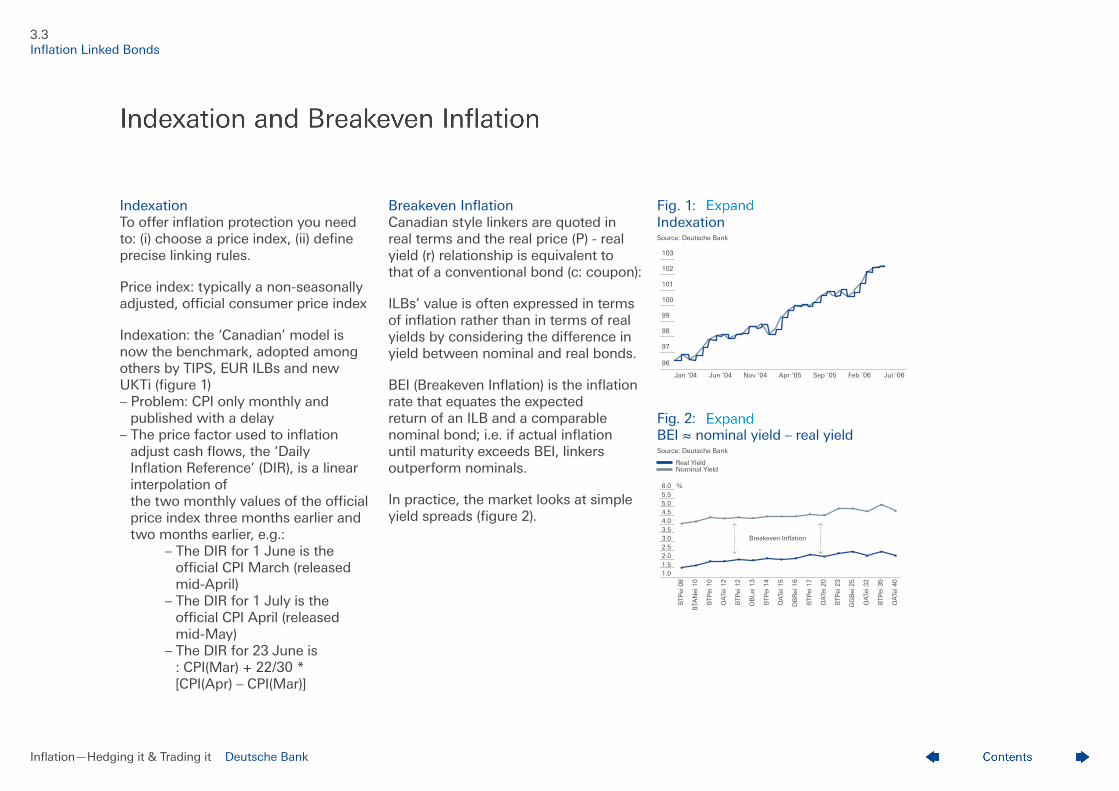
Indexation To offer inflation protection you need to: (i) choose a price index, (ii) define precise linking rules.
Price index: typically a non-seasonally adjusted, official consumer price index
Indexation: the ‘Canadian’ model is now the benchmark, adopted among others by TIPS, EUR ILBs and new UKTi (figure 1) – Problem: CPI only monthly and published with a delay – The price factor used to inflation adjust cash flows, the ‘Daily Inflation Reference’ (DIR), is a linear interpolation of the two monthly values of the official price index three months earlier and two months earlier, e.g.: – The DIR for 1 June is the official CPI March (released mid-April) – The DIR for 1 July is the official CPI April (released mid-May) – The DIR for 23 June is : CPI(Mar) + 22/30 * [CPI(Apr) – CPI(Mar)]
Breakeven Inflation Canadian style linkers are quoted in real terms and the real price (P) - real yield (r) relationship is equivalent to that of a conventional bond (c: coupon):
ILBs’ value is often expressed in terms of inflation rather than in terms of real yields by considering the difference in yield between nominal and real bonds.
BEI (Breakeven Inflation) is the inflation rate that equates the expected return of an ILB and a comparable nominal bond; i.e. if actual inflation until maturity exceeds BEI, linkers outperform nominals.
In practice, the market looks at simple yield spreads (figure 2).
Fig. 1: Indexation Source: Deutsche Bank
Fig. 2: BEI ≈ nominal yield – real yield Source: Deutsche Bank
Real Yield Nominal Yield
Jan ‘04 Jun ‘04 Nov ‘04 Apr ‘05 Sep ‘05 Feb ‘06 Jul ‘06
100
99
98
97
96
101
102
103
BTP
ei 0
8
BTA
Nei
10
BTP
ei 1
0
OA
Tei 1
2
BTP
ei 1
2
OB
Lei 1
3
BTP
ei 1
4
OA
Tei 1
5
DB
Rei
16
BTP
ei 1
7
OA
Tei 2
0
BTP
ei 2
3
GG
Bei
25
OA
Tei 3
2
BTP
ei 3
5
OA
Tei 4
0
Breakeven Inflation
%
4.54.03.53.02.5
1.52.0
1.0
5.05.56.0
3.3 Inflation Linked Bonds
Inflation —Hedging it & Trading it Deutsche Bank
Risk Measures – The concepts of duration and convexity can be applied to linkers in the same way as for conventional bonds – But in the case of linkers, duration describes the sensitivity of the price to a change in the real rate – Linkers have a higher duration than same maturity conventionals – Convexity rises exponentially with duration, for the same maturity ILBs have a higher convexity than nominals
EM Sovereign Linker Markets – Most Latin American inflation markets have long histories; Brazil is by far the largest market, suppression of investment restrictions in 2006 spurred international demand – Chile, Colombia & Uruguay also issue ILB – Israel has a large linker market (USD27bn market value) – More recently South Africa, Poland, Turkey (2007) and South Korea (2007)
Seasonality – Seasonal movements in price indices mean that inflation accrual is not linear – Quoted real yields of ILB adjust to the changing inflation uplift – real yields & BEI exhibit seasonal patterns – detecting the seasonal pattern in prices is important for valuing ILBs – Estimation of seasonal factors is not without difficulties, especially in the euro area where there is instability – There is no consensus on their precise value
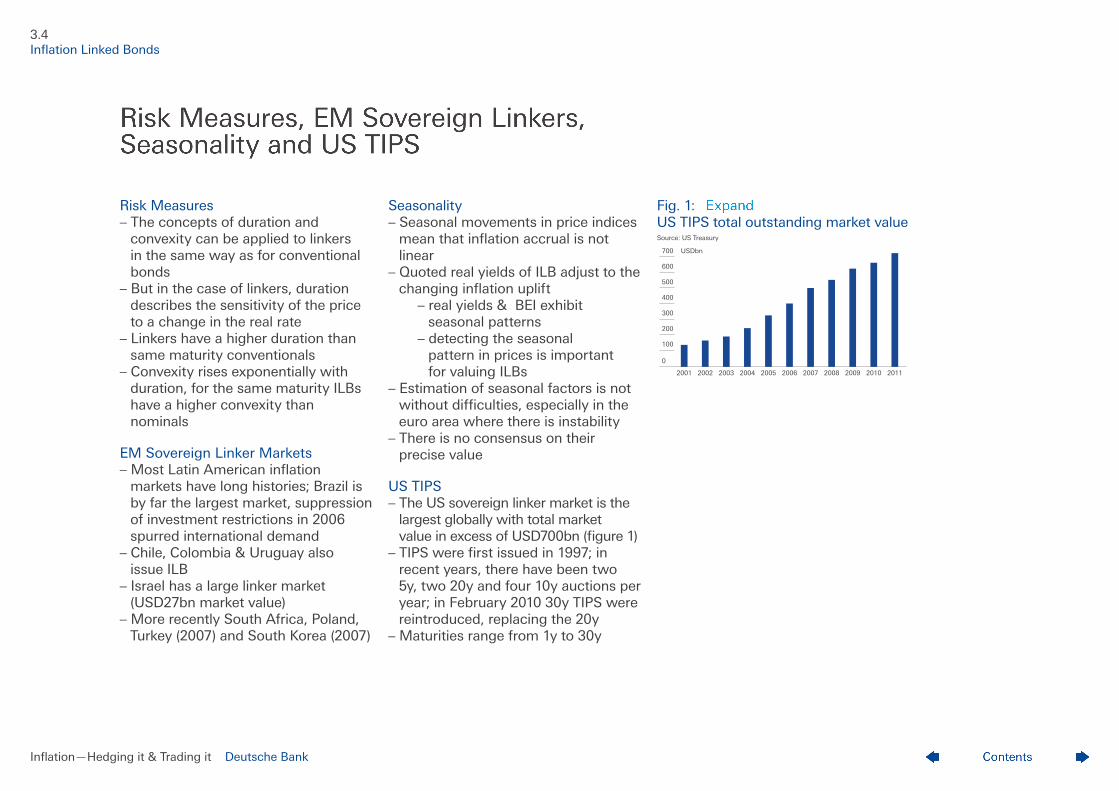
US TIPS – The US sovereign linker market is the largest globally with total market value in excess of USD700bn (figure 1) – TIPS were first issued in 1997; in recent years, there have been two 5y, two 20y and four 10y auctions per year; in February 2010 30y TIPS were reintroduced, replacing the 20y – Maturities range from 1y to 30y
Fig. 1: US TIPS total outstanding market value Source: US Treasury
3.4 Inflation Linked Bonds
2001 2002 2003 2004 2005 2006 2007 2008 2009 20112010
300
200
100
0
400
500
600
700 USDbn
Inflation —Hedging it & Trading it Deutsche Bank
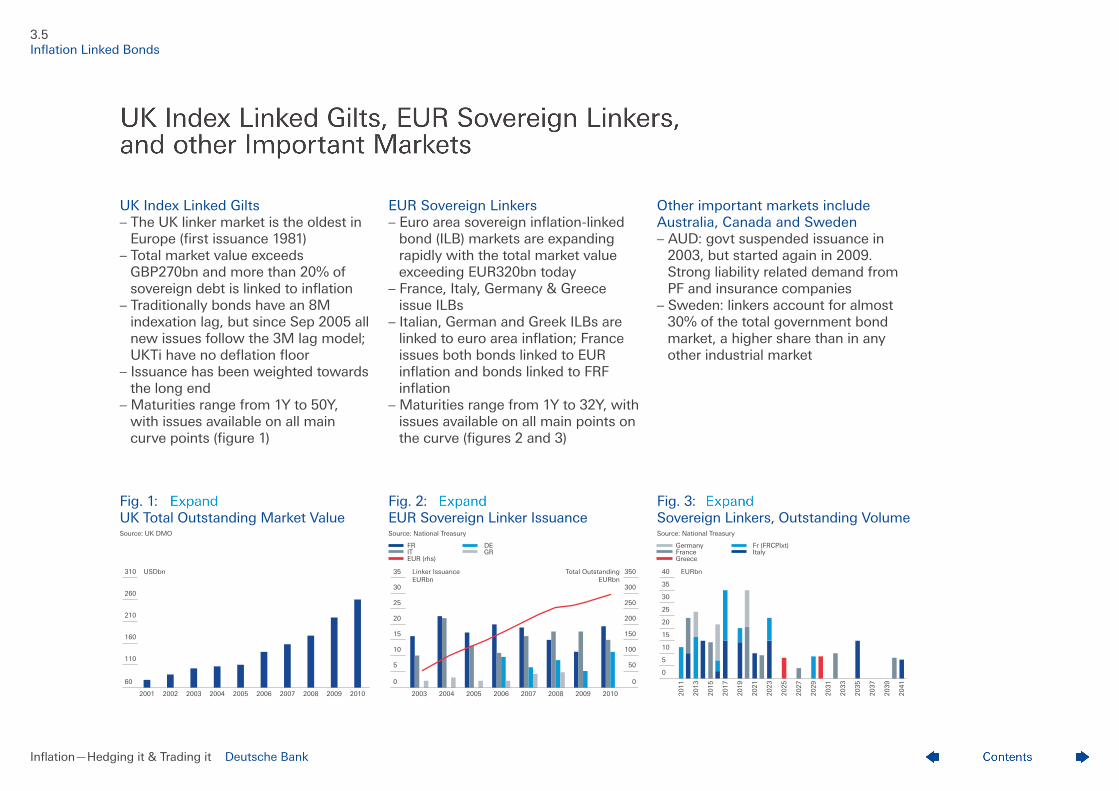
UK Index Linked Gilts – The UK linker market is the oldest in Europe (first issuance 1981) – Total market value exceeds GBP270bn and more than 20% of sovereign debt is linked to inflation – Traditionally bonds have an 8M indexation lag, but since Sep 2005 all new issues follow the 3M lag model; UKTi have no deflation floor – Issuance has been weighted towards the long end – Maturities range from 1Y to 50Y, with issues available on all main curve points (figure 1)
Fig. 1: UK Total Outstanding Market Value Source: UK DMO
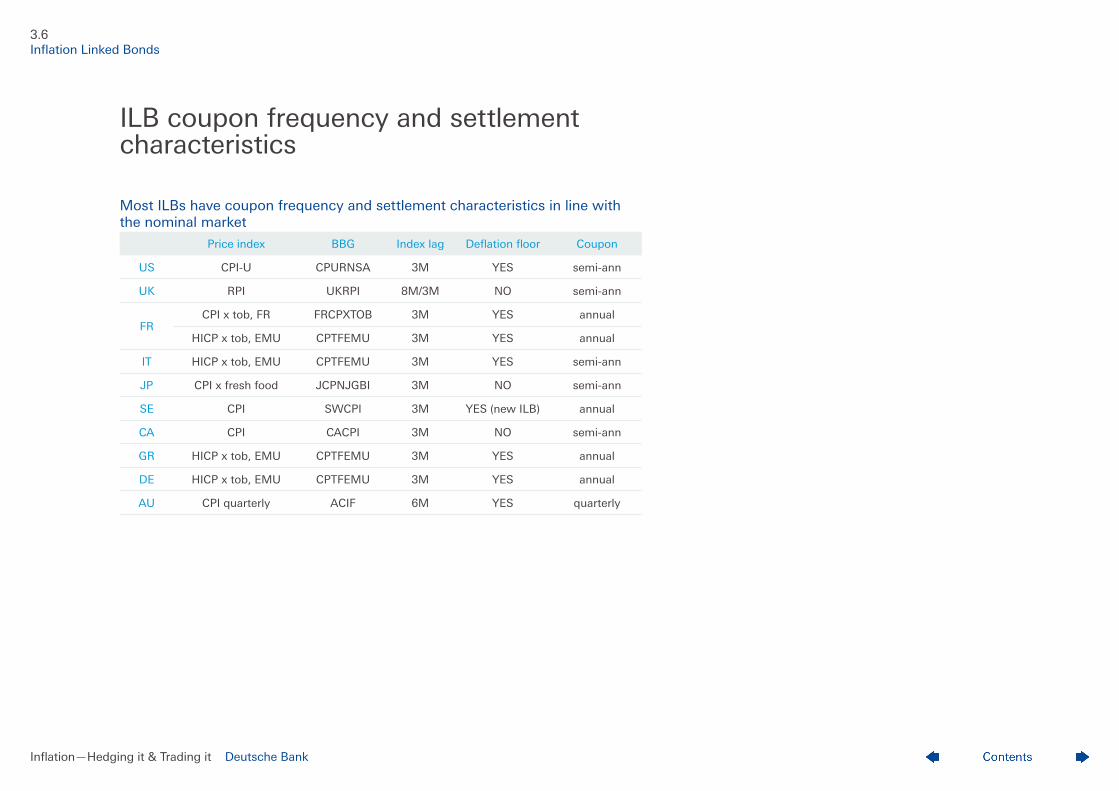
EUR Sovereign Linkers – Euro area sovereign inflation-linked bond (ILB) markets are expanding rapidly with the total market value exceeding EUR320bn today – France, Italy, Germany & Greece issue ILBs – Italian, German and Greek ILBs are linked to euro area inflation; France issues both bonds linked to EUR inflation and bonds linked to FRF inflation – Maturities range from 1Y to 32Y, with issues available on all main points on the curve (figures 2 and 3)
Fig. 2: EUR Sovereign Linker Issuance Source: National Treasury
FR DE IT GR EUR (rhs)
Other important markets include Australia, Canada and Sweden – AUD: govt suspended issuance in 2003, but started again in 2009. Strong liability related demand from PF and insurance companies – Sweden: linkers account for almost 30% of the total government bond market, a higher share than in any other industrial market
Fig. 3: Sovereign Linkers, Outstanding Volume Source: National Treasury
Germany Fr (FRCPIxt) France Italy Greece
2001 2002 2003 2004 2005 2006 2007 2008 2009 2010
110
60
160
210
260
310 USDbn
20102009200820072006200520042003
5
10
15
0
20
25
30
35
50
100
150
0
200
250
300
350Linker IssuanceEURbn
Total OutstandingEURbn
2011
2013
2015
2017
2019
2021
2023
2025
2027
2029
2031
2033
2035
2037
2039
2041
5
10
15
0
20
25
30
35
40 EURbn
3.5 Inflation Linked Bonds
Inflation —Hedging it & Trading it Deutsche Bank
Price index BBG Index lag Deflation floor Coupon
US CPI-U CPURNSA 3M YES semi-ann
UK RPI UKRPI 8M/3M NO semi-ann
FRCPI x tob, FR FRCPXTOB 3M YES annual
HICP x tob, EMU CPTFEMU 3M YES annual
IT HICP x tob, EMU CPTFEMU 3M YES semi-ann
JP CPI x fresh food JCPNJGBI 3M NO semi-ann
SE CPI SWCPI 3M YES (new ILB) annual
CA CPI CACPI 3M NO semi-ann
GR HICP x tob, EMU CPTFEMU 3M YES annual
DE HICP x tob, EMU CPTFEMU 3M YES annual
AU CPI quarterly ACIF 6M YES quarterly
3.6 Inflation Linked Bonds
Most ILBs have coupon frequency and settlement characteristics in line with the nominal market
ILB coupon frequency and settlement characteristics

Inflation —Hedging it & Trading it Deutsche Bank
4 Inflation Swaps
ILS Swaps and Markets UK Swaps, Corporate Linkers and US Swaps ILS Indexation ILS Pension Fund Demand
Contents
Inflation —Hedging it & Trading it Deutsche Bank
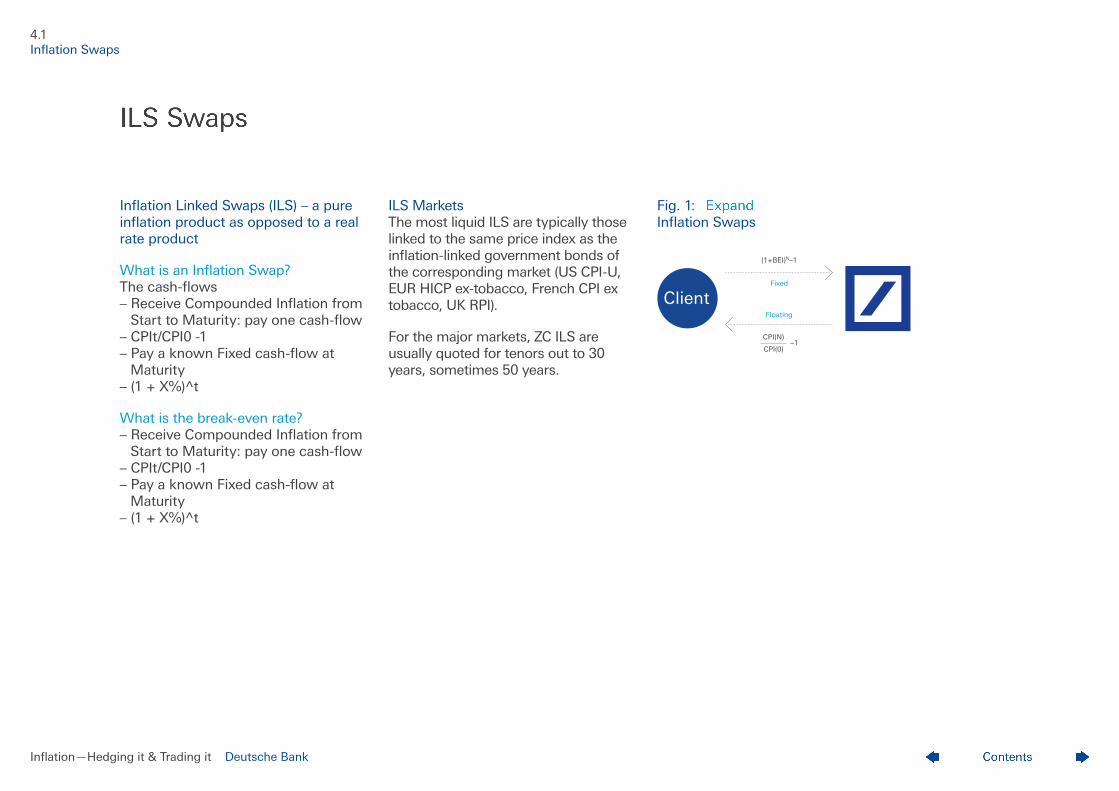
Inflation Linked Swaps (ILS) – a pure inflation product as opposed to a real rate product
What is an Inflation Swap? The cash-flows – Receive Compounded Inflation from Start to Maturity: pay one cash-flow – CPIt/CPI0 -1 – Pay a known Fixed cash-flow at Maturity – (1 + X%)^t
What is the break-even rate? – Receive Compounded Inflation from Start to Maturity: pay one cash-flow – CPIt/CPI0 -1 – Pay a known Fixed cash-flow at Maturity – (1 + X%)^t
ILS Markets The most liquid ILS are typically those linked to the same price index as the inflation-linked government bonds of the corresponding market (US CPI-U, EUR HICP ex-tobacco, French CPI ex tobacco, UK RPI).
For the major markets, ZC ILS are usually quoted for tenors out to 30 years, sometimes 50 years.
Fig. 1: Inflation Swaps
(1+BEI)N–1
Fixed
Floating
Client
CPI(N)
CPI(0)–1
4.1 Inflation Swaps
Inflation —Hedging it & Trading it Deutsche Bank
UK Swaps and Corporate Linkers Non-sovereign inflation supply in bonds & swaps has grown rapidly in the UK in particular 2006 and H107
MarketPrice Index
Lag CPI Fixing
US CPI-U 3M Interpolated
Euro areaHICP ex tobacco
3M Straight
FranceCPI ex
tobacco3M Interpolated
UK RPI 2M Straight
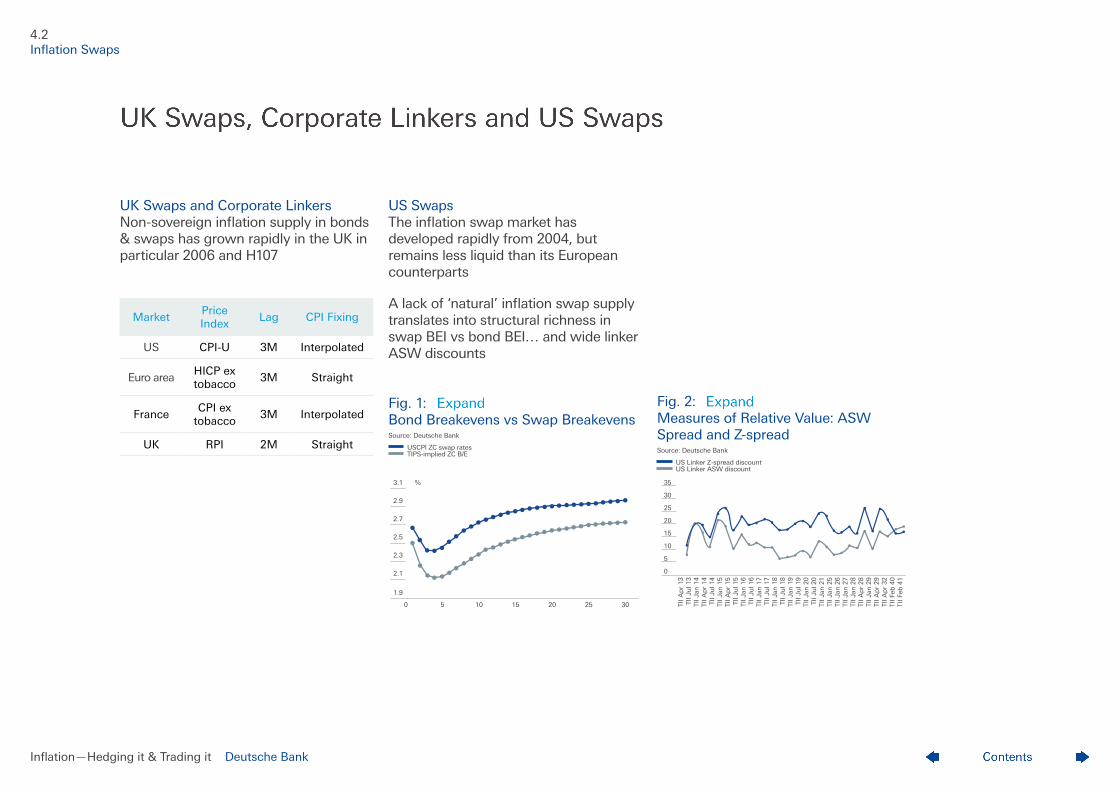
US Swaps The inflation swap market has developed rapidly from 2004, but remains less liquid than its European counterparts
A lack of ‘natural’ inflation swap supply translates into structural richness in swap BEI vs bond BEI… and wide linker ASW discounts Fig. 1: Bond Breakevens vs Swap Breakevens Source: Deutsche Bank
USCPI ZC swap rates TIPS-implied ZC B/E
Fig. 2: Measures of Relative Value: ASW Spread and Z-spread Source: Deutsche Bank
US Linker Z-spread discount US Linker ASW discount
4.2 Inflation Swaps
0 5 10 15 20 3025
2.5
2.3
2.1
1.9
2.7
2.9
3.1 %
TII A
pr
13
TII Ju
l 13
TII Ja
n 1
4TI
I A
pr
14
TII Ju
l 14
TII Ja
n 1
5TI
I A
pr
15
TII Ju
l 15
TII Ja
n 1
6TI
I Ju
l 16
TII Ja
n 1
7TI
I Ju
l 17
30
25
20
15
5
10
0
35
TII Ja
n 1
8TI
I Ju
l 18
TII Ja
n 1
9TI
I Ju
l 19
TII Ja
n 2
0TI
I Ju
l 20
TII Ja
n 2
1TI
I Ja
n 2
5TI
I Ja
n 2
6TI
I Ja
n 2
7TI
I Ja
n 2
8TI
I A
pr
28
TII Ja
n 2
9TI
I A
pr
29
TII A
pr
32
TII Fe
b 4
0TI
I Fe
b 4
1
Inflation —Hedging it & Trading it Deutsche Bank
ILS Indexation For FRCPIxt & US CPI, the indexation lag convention is the same as for the corresponding inflation-linked bond markets – Strong demand has led to a low level of real interest rates, lock in low financing costs – PFI projects with inflation component (usually bonds, but typically transformed into ASW) – Credit wrapping allowed corporates to issue highly rated debt which is more appealing to institutional investors
But has fallen significantly during the credit crisis
Main sources: regulated utilities, PFIs, property leases, railway companies, retailers, supranationals
Alternative supply has led to two-way swap market and narrow swap-bond B/E spread, but swap richness has increased again during the crisis
4.3 Inflation Swaps
ILS Indexation
Inflation —Hedging it & Trading it Deutsche Bank
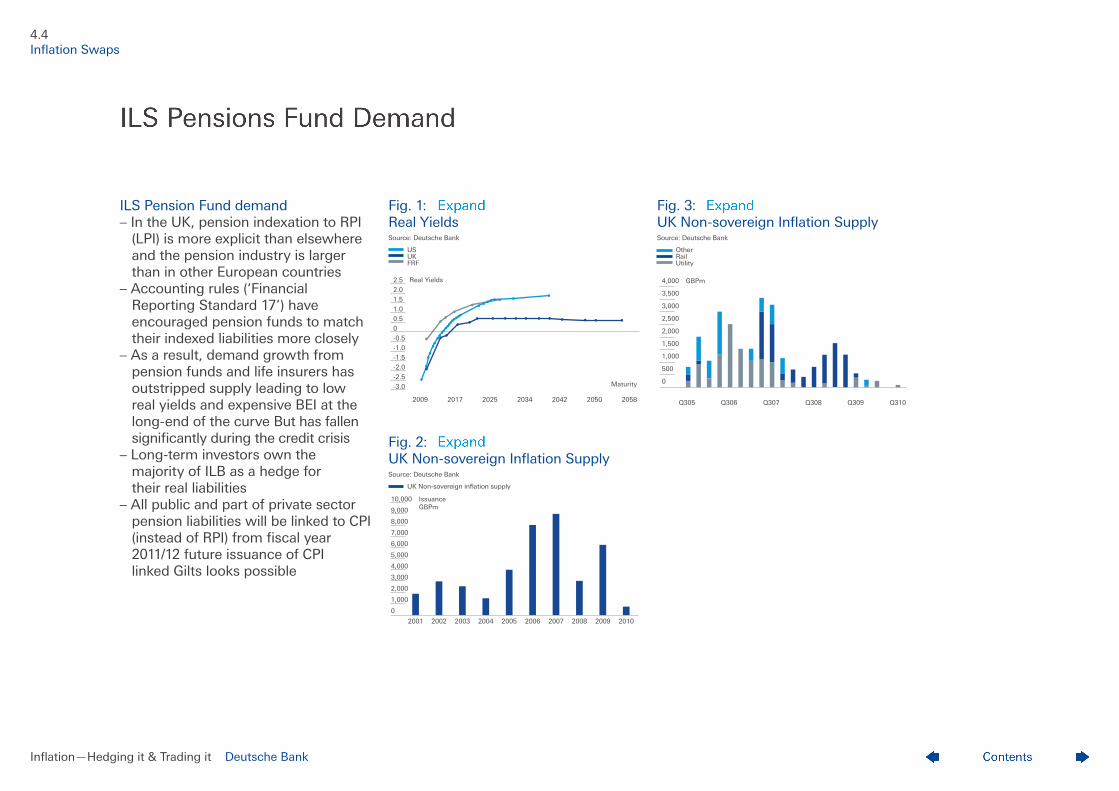
ILS Pension Fund demand – In the UK, pension indexation to RPI (LPI) is more explicit than elsewhere and the pension industry is larger than in other European countries – Accounting rules (‘Financial Reporting Standard 17’) have encouraged pension funds to match their indexed liabilities more closely – As a result, demand growth from pension funds and life insurers has outstripped supply leading to low real yields and expensive BEI at the long-end of the curve But has fallen significantly during the credit crisis – Long-term investors own the majority of ILB as a hedge for their real liabilities – All public and part of private sector pension liabilities will be linked to CPI (instead of RPI) from fiscal year 2011/12 future issuance of CPI linked Gilts looks possible
Fig. 1: Real Yields Source: Deutsche Bank
US UK FRF
Fig. 2: UK Non-sovereign Inflation Supply Source: Deutsche Bank
UK Non-sovereign inflation supply
Fig. 3: UK Non-sovereign Inflation Supply Source: Deutsche Bank
Other Rail Utility
4.4 Inflation Swaps
-3.0
-2.5
-2.0
-1.5
-1.0
-0.5
0
0.5
1.0
1.5
2.0
2.5
2058
Maturity
Real Yields
205020422034202520172009 Q310Q305 Q306 Q307 Q308 Q309
500
1,000
1,500
0
2,000
2,500
3,000
3,500
4,000 GBPm
2001 2002 2003 2004 2005 2006 2007 2008 2009 2010
6,000
5,000
4,000
3,000
2,000
1,000
0
7,000
8,000
9,000
10,000 IssuanceGBPm

Inflation —Hedging it & Trading it Deutsche Bank
5Assessing Relative Value
Linker Asset Swap and the Leverage Effect 5 Sources of Asset Swap Difference What is the ‘Fair’ Price for Inflation Protection? Fair Credit Spread of Inflation Linked Bonds Hedge with Bonds or Swaps Summary
Contents
Inflation —Hedging it & Trading it Deutsche Bank
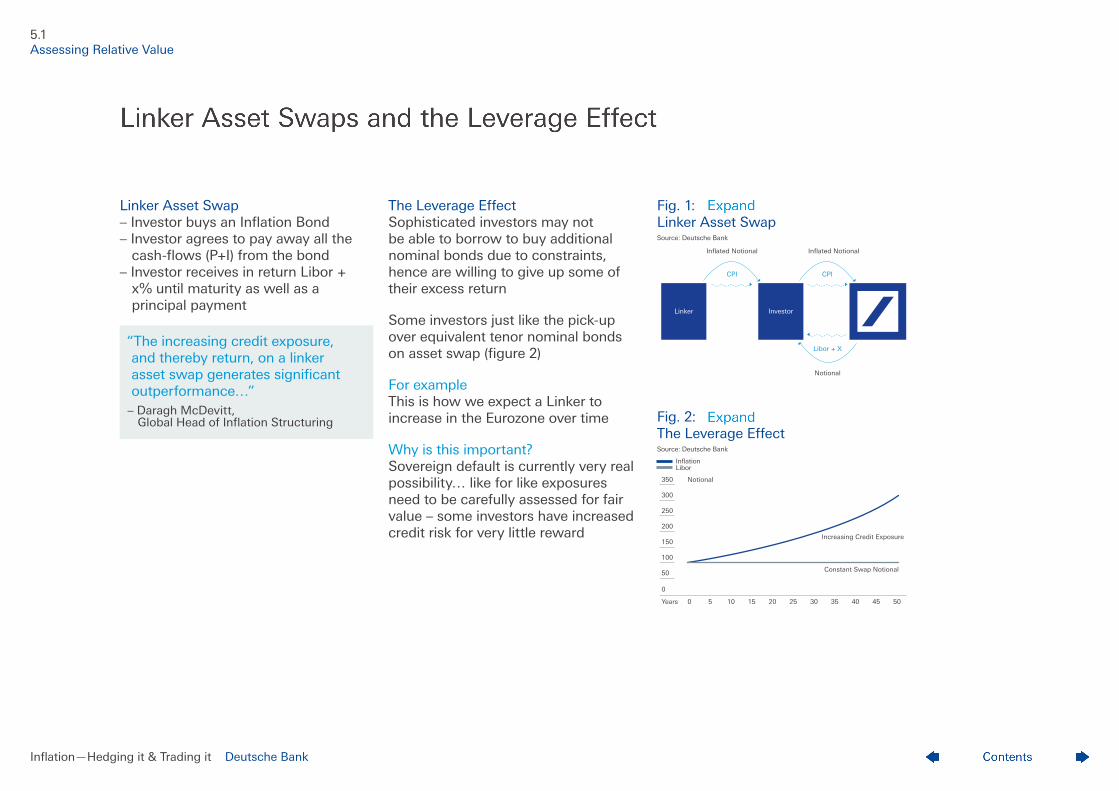
Linker Asset Swap – Investor buys an Inflation Bond – Investor agrees to pay away all the cash-flows (P+I) from the bond – Investor receives in return Libor + x% until maturity as well as a principal payment
The Leverage Effect Sophisticated investors may not be able to borrow to buy additional nominal bonds due to constraints, hence are willing to give up some of their excess return
Some investors just like the pick-up over equivalent tenor nominal bonds on asset swap (figure 2)
For example This is how we expect a Linker to increase in the Eurozone over time
Why is this important? Sovereign default is currently very real possibility… like for like exposures need to be carefully assessed for fair value – some investors have increased credit risk for very little reward
Fig. 1: Linker Asset Swap Source: Deutsche Bank
Fig. 2: The Leverage Effect Source: Deutsche Bank
Inflation Libor
5.1 Assessing Relative Value
Libor + X
Inflated Notional Inflated Notional
Notional
InvestorLinker
CPICPI
0 5 10 15 20 25
Constant Swap Notional
Increasing Credit Exposure
30 35 40Years 45 50
150
100
50
0
200
250
300
350 Notional
“The increasing credit exposure, and thereby return, on a linker asset swap generates significant outperformance…”
– Daragh McDevitt, Global Head of Inflation Structuring
Inflation —Hedging it & Trading it Deutsche Bank
5 Sources of Asset Swap Difference
PV01 difference – Linkers have a higher duration
Swap richness – The spread between inflation-linked swaps and implied bond break-evens gives rise to different asset swap levels for linkers and nominals – It also usually tells the story of swap supply and demand…
Seasonality – See the section on page 3.4
Credit / Liquidity – Mis-priced credit cost leading to ‘value’ for issuers
Tax – Favourable deferrals for issuers encourage supply
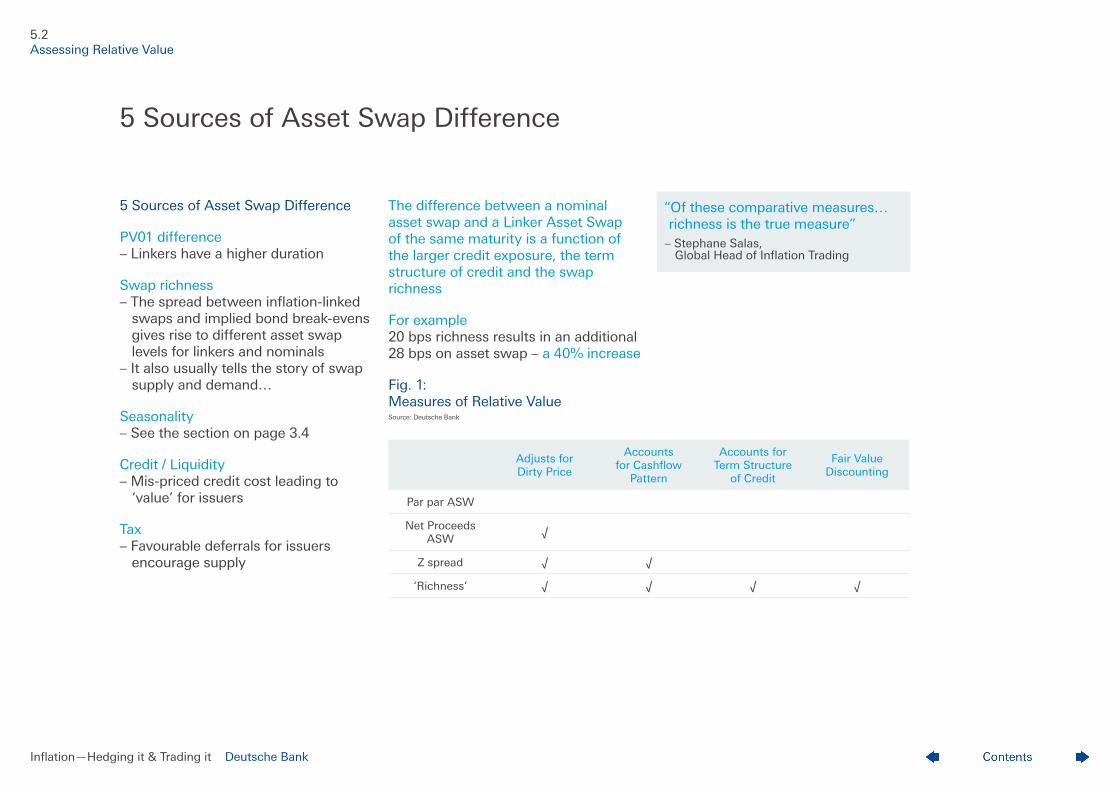
The difference between a nominal asset swap and a Linker Asset Swap of the same maturity is a function of the larger credit exposure, the term structure of credit and the swap richness
For example 20 bps richness results in an additional 28 bps on asset swap – a 40% increase
Fig. 1: Measures of Relative Value Source: Deutsche Bank
Adjusts for Dirty Price
Accounts for Cashflow
Pattern
Accounts for Term Structure
of Credit
Fair Value Discounting
Par par ASW
Net Proceeds ASW
√
Z spread √ √
‘Richness’ √ √ √ √
5.2 Assessing Relative Value
“Of these comparative measures… richness is the true measure”
– Stephane Salas, Global Head of Inflation Trading
5 Sources of Asset Swap Difference
Inflation —Hedging it & Trading it Deutsche Bank
What is the ‘Fair’ Price for Inflation Protection?
Inflation ‘Breakeven’ is not equal to market inflation expectations but is a factor of – Inflation expectations – ‘Risk Premium’ – ‘Liquidity Premium’
Inflation expectations over the very long run are hard to judge but tend to be based on current economic policy – ECB target rate is ‘under, but close to 2%’
Risk Premium includes – Potential change in monetary policy target (e.g. 4% plus or minus 1% instead of under 2%) – Abandonment of monetary policy in favour of employment or currency board – EUR breakup, expansion or succession – Asymmetric elasticity of inflation: wages are easier to raise than to cut
Liquidity premium includes – Relative demand and supply for inflation bonds v nominal bonds – Balance sheet costs of holding inflation bonds to recycle inflation – Opportunity cost of capital for cash used to hedge inflation
5.3 Assessing Relative Value
“The biggest mistake people make with inflation-linked bonds is thinking that the breakeven inflation is the market’s expected inflation rate. It is not and should not be. The breakeven includes what the market expects inflation to be and the major portion of the risk premium that you should find in the nominal market, and the liquidity premium”
– Markus Heider, Global Head of Inflation Research
What is the ‘Fair’ Price for Inflation Protection?
Inflation —Hedging it & Trading it Deutsche Bank
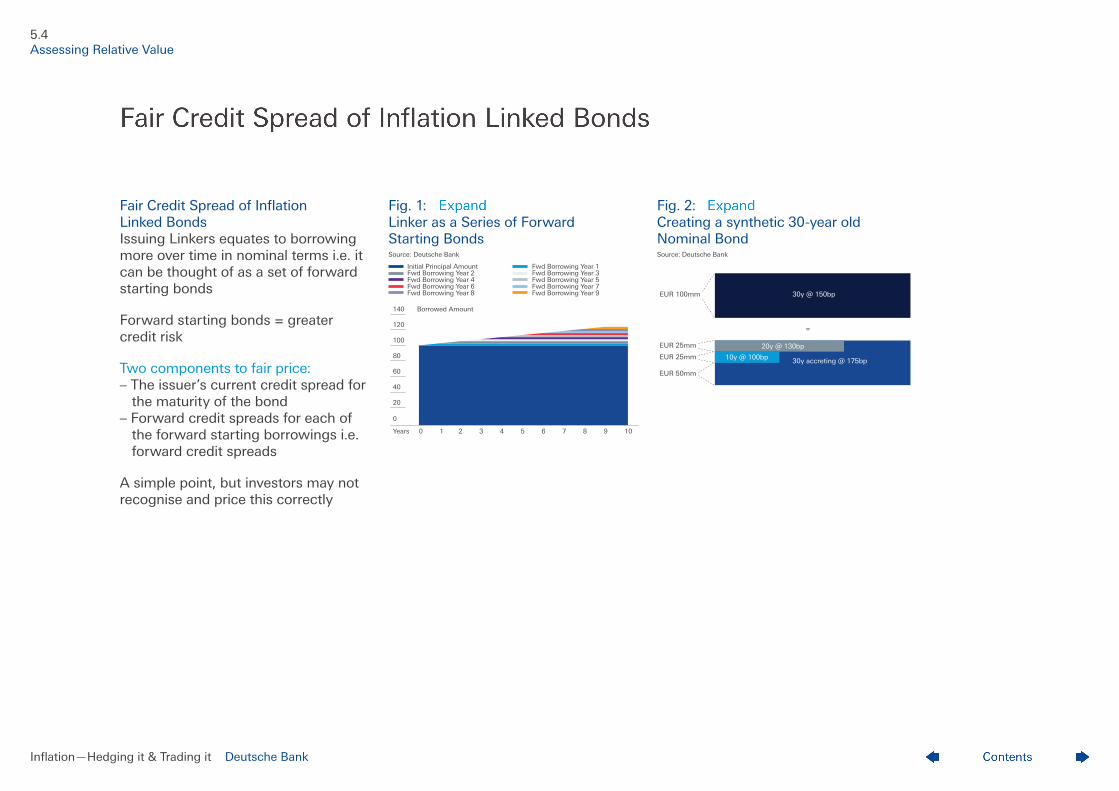
Fair Credit Spread of Inflation Linked Bonds Issuing Linkers equates to borrowing more over time in nominal terms i.e. it can be thought of as a set of forward starting bonds
Forward starting bonds = greater credit risk
Two components to fair price: – The issuer’s current credit spread for the maturity of the bond – Forward credit spreads for each of the forward starting borrowings i.e. forward credit spreads
A simple point, but investors may not recognise and price this correctly
Fig. 1: Linker as a Series of Forward Starting Bonds Source: Deutsche Bank
Initial Principal Amount Fwd Borrowing Year 1 Fwd Borrowing Year 2 Fwd Borrowing Year 3 Fwd Borrowing Year 4 Fwd Borrowing Year 5 Fwd Borrowing Year 6 Fwd Borrowing Year 7 Fwd Borrowing Year 8 Fwd Borrowing Year 9
Fig. 2: Creating a synthetic 30-year old Nominal Bond Source: Deutsche Bank
5.4 Assessing Relative Value
0 1 2 3 4 5 6 7 8Years 9 10
60
40
20
0
80
100
120
140 Borrowed Amount
=
EUR 100mm
EUR 25mm
EUR 25mm
EUR 50mm
20y @ 130bp
10y @ 100bp 30y accreting @ 175bp
30y @ 150bp
Inflation —Hedging it & Trading it Deutsche Bank
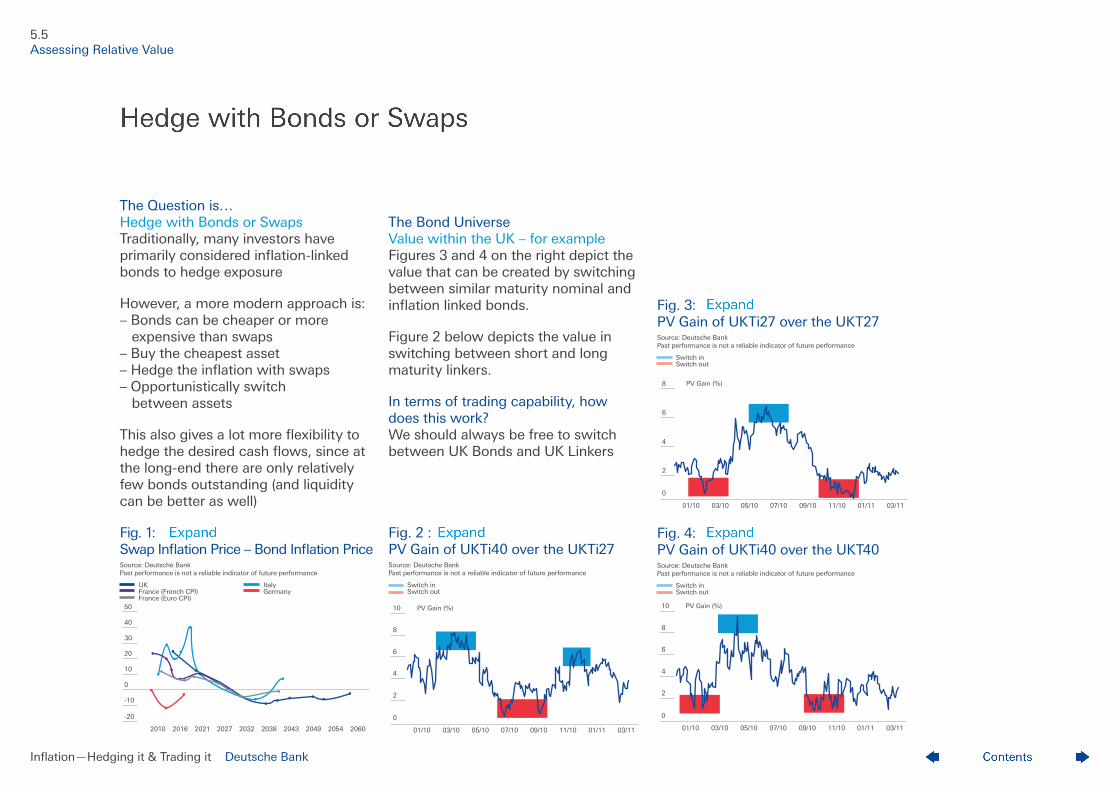
The Question is… Hedge with Bonds or Swaps Traditionally, many investors have primarily considered inflation-linked bonds to hedge exposure
However, a more modern approach is: – Bonds can be cheaper or more expensive than swaps – Buy the cheapest asset – Hedge the inflation with swaps – Opportunistically switch between assets
This also gives a lot more flexibility to hedge the desired cash flows, since at the long-end there are only relatively few bonds outstanding (and liquidity can be better as well)
Fig. 1: Swap Inflation Price – Bond Inflation Price Source: Deutsche Bank Past performance is not a reliable indicator of future performance
UK Italy France (French CPI) Germany France (Euro CPI)
The Bond Universe Value within the UK – for example Figures 3 and 4 on the right depict the value that can be created by switching between similar maturity nominal and inflation linked bonds.
Figure 2 below depicts the value in switching between short and long maturity linkers.
In terms of trading capability, how does this work? We should always be free to switch between UK Bonds and UK Linkers
Fig. 2 : PV Gain of UKTi40 over the UKTi27 Source: Deutsche Bank Past performance is not a reliable indicator of future performance
Switch in Switch out
Fig. 3: PV Gain of UKTi27 over the UKT27 Source: Deutsche Bank Past performance is not a reliable indicator of future performance
Switch in Switch out
Fig. 4: PV Gain of UKTi40 over the UKT40 Source: Deutsche Bank Past performance is not a reliable indicator of future performance
Switch in Switch out
5.5 Assessing Relative Value
2010 2016 2021 2027 2032 2038 2043 2049 2054 2060
10
0
-10
-20
20
30
40
50
01/10 03/10 05/10 07/10 09/10 11/10 01/11 03/11
2
0
4
6
8
10 PV Gain (%)
01/10 03/10 05/10 07/10 09/10 11/10 01/11 03/11
2
0
4
6
8
10 PV Gain (%)
01/10 03/10 05/10 07/10 09/10 11/10 01/11 03/11
2
0
4
6
8 PV Gain (%)
Inflation —Hedging it & Trading it Deutsche Bank
To sum up… – Given the displacement between inflation and nominal markets, there are opportunities for arbitrage – Asset swap spreads on linkers represent a premium for credit that is hard to price, and when coupled with demand/supply imbalances and higher duration, they offer a pickup to nominals for the same underlying issuer – Switching between equivalent risk sovereigns/supra sovereigns can often, driven by dynamics of the cross currency swaps market, provide additional yield pick-ups
– These displacements can be assessed by a variety of metrics – The value of switching is evident from the incremental excess pickup that is generated by selling the costlier asset to buy the cheapest asset from time to time – Used as a systematic strategy this can yield substantial returns over medium term horizons – These represent incredible opportunities for ‘asset-heavy’ investors, and the markets will likely normalize with time, hence it is important to act quickly
5.6 Assessing Relative Value
“There isn’t one risk free curve, there are 100, 150, 200… the key is when do you pick ‘the fruit’, when is the bond cheap enough?”
– Daragh McDevitt, Global Head of Inflation Structuring
“…there are incredible opportunities for asset-heavy investors…it is important to act quickly”
– Haroon Sana, Global Head of Rates Sales
Summary

Inflation —Hedging it & Trading it Deutsche Bank
6Inflation Options
Inflation Options Who are the major players in the options market? Option Products What are the trading opportunities? Option Strategies Creating Optimal Hedges
Contents
Inflation —Hedging it & Trading it Deutsche Bank
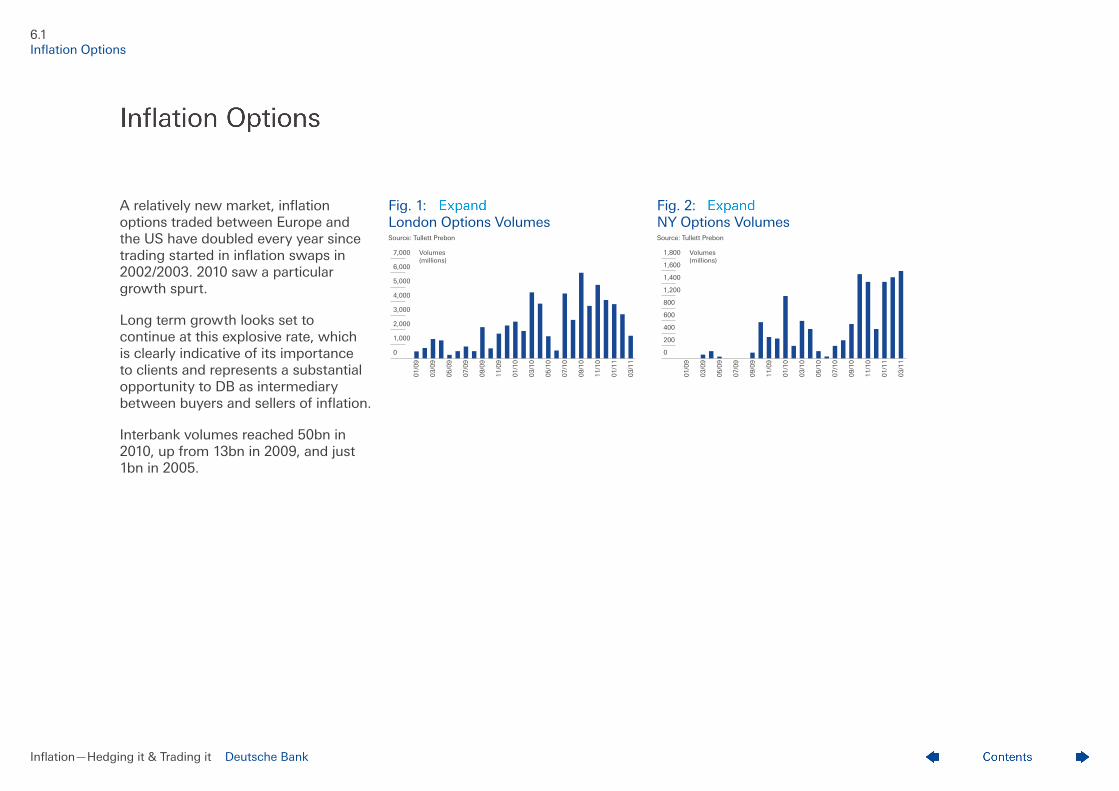
A relatively new market, inflation options traded between Europe and the US have doubled every year since trading started in inflation swaps in 2002/2003. 2010 saw a particular growth spurt.
Long term growth looks set to continue at this explosive rate, which is clearly indicative of its importance to clients and represents a substantial opportunity to DB as intermediary between buyers and sellers of inflation.
Interbank volumes reached 50bn in 2010, up from 13bn in 2009, and just 1bn in 2005.
Fig. 1: London Options Volumes Source: Tullett Prebon
Fig. 2: NY Options Volumes Source: Tullett Prebon
6.1 Inflation Options
01
/09
03
/09
05
/09
07
/09
09
/09
11
/09
01
/10
03
/10
05
/10
07
/10
09
/10
11
/10
01
/11
03
/11
400
200
600
0
800
1,200
1,400
1,600
1,800 Volumes(millions)
01
/09
03
/09
05
/09
07
/09
09
/09
11
/09
01
/10
03
/10
05
/10
07
/10
09
/10
11
/10
01
/11
03
/11
1,000
2,000
0
3,000
4,000
5,000
6,000
7,000 Volumes(millions)
Inflation —Hedging it & Trading it Deutsche Bank
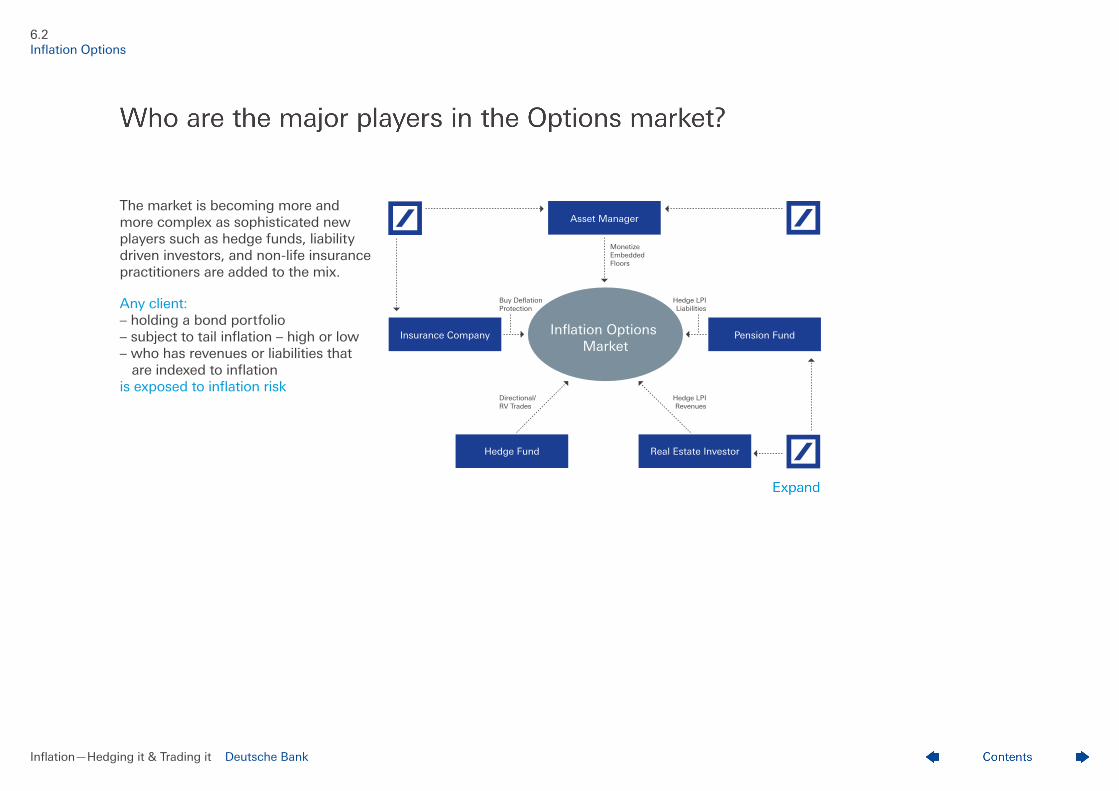
The market is becoming more and more complex as sophisticated new players such as hedge funds, liability driven investors, and non-life insurance practitioners are added to the mix.
Any client: – holding a bond portfolio – subject to tail inflation – high or low – who has revenues or liabilities that are indexed to inflation is exposed to inflation risk
6.2 Inflation Options
Hedge Fund Real Estate Investor
Asset Manager
Inflation Options Market
Insurance Company Pension Fund
Directional/RV Trades
Hedge LPIRevenues
Hedge LPILiabilities
Buy DeflationProtection
Monetize EmbeddedFloors
Inflation —Hedging it & Trading it Deutsche Bank
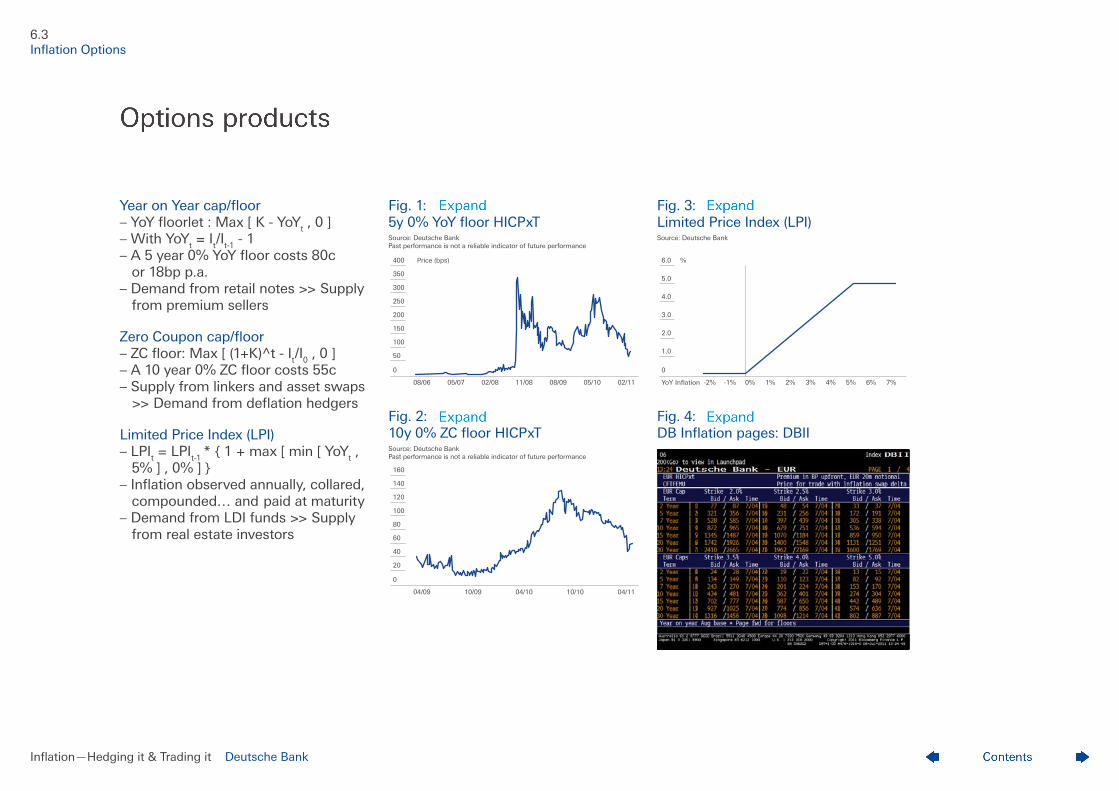
Year on Year cap/floor – YoY floorlet : Max [ K - YoYt , 0 ] – With YoYt = It/It-1 - 1 – A 5 year 0% YoY floor costs 80c or 18bp p.a. – Demand from retail notes >> Supply from premium sellers
Zero Coupon cap/floor – ZC floor: Max [ (1+K)^t - It/I0 , 0 ] – A 10 year 0% ZC floor costs 55c – Supply from linkers and asset swaps >> Demand from deflation hedgers
Limited Price Index (LPI) – LPIt = LPIt-1 * { 1 + max [ min [ YoYt , 5% ] , 0% ] } – Inflation observed annually, collared, compounded… and paid at maturity – Demand from LDI funds >> Supply from real estate investors
Fig. 1: 5y 0% YoY floor HICPxT Source: Deutsche Bank Past performance is not a reliable indicator of future performance
Fig. 2: 10y 0% ZC floor HICPxT Source: Deutsche Bank Past performance is not a reliable indicator of future performance
Fig. 3: Limited Price Index (LPI) Source: Deutsche Bank
Fig. 4: DB Inflation pages: DBII
6.3 Inflation Options
04/09 10/09 04/10 10/10 04/11
40
20
60
80
0
100
120
140
160
-2%YoY Inflation -1% 0% 1% 2% 3% 4% 5% 6% 7%
1.0
2.0
0
3.0
4.0
5.0
6.0 %
08/06 05/07 02/08 11/08 08/09 05/10 02/11
100
50
150
200
0
250
300
350
400 Price (bps)
Inflation —Hedging it & Trading it Deutsche Bank
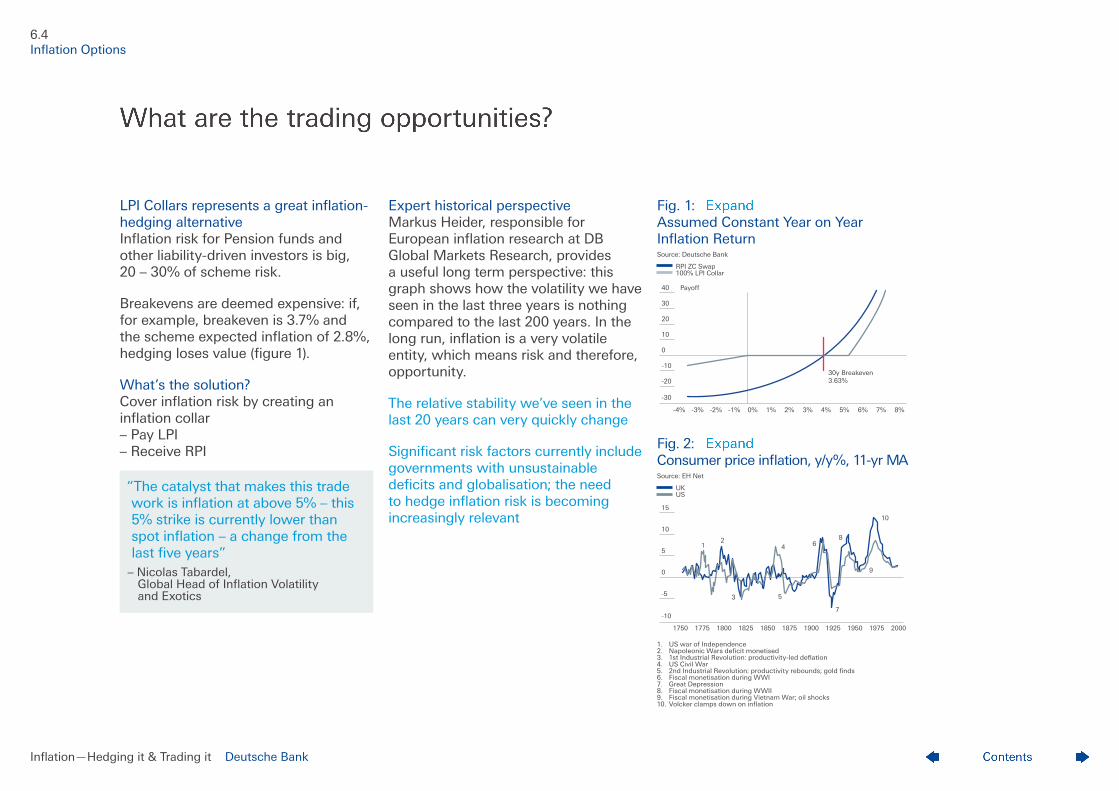
LPI Collars represents a great inflation-hedging alternative Inflation risk for Pension funds and other liability-driven investors is big, 20 – 30% of scheme risk.
Breakevens are deemed expensive: if, for example, breakeven is 3.7% and the scheme expected inflation of 2.8%, hedging loses value (figure 1).
What’s the solution? Cover inflation risk by creating an inflation collar – Pay LPI – Receive RPI
Expert historical perspective Markus Heider, responsible for European inflation research at DB Global Markets Research, provides a useful long term perspective: this graph shows how the volatility we have seen in the last three years is nothing compared to the last 200 years. In the long run, inflation is a very volatile entity, which means risk and therefore, opportunity.
The relative stability we’ve seen in the last 20 years can very quickly change
Significant risk factors currently include governments with unsustainable deficits and globalisation; the need to hedge inflation risk is becoming increasingly relevant
Fig. 1: Assumed Constant Year on Year Inflation Return Source: Deutsche Bank
RPI ZC Swap 100% LPI Collar
Fig. 2: Consumer price inflation, y/y%, 11-yr MA Source: EH Net
UK US
1. US war of Independence 2. Napoleonic Wars deficit monetised 3. 1st Industrial Revolution: productivity-led deflation 4. US Civil War 5. 2nd Industrial Revolution: productivity rebounds; gold finds 6. Fiscal monetisation during WWI 7. Great Depression 8. Fiscal monetisation during WWII 9. Fiscal monetisation during Vietnam War; oil shocks 10. Volcker clamps down on inflation
6.4 Inflation Options
-2%-3%-4% -1% 0% 1% 2% 3% 4% 5% 6% 7% 8%
-30
40
30
20
10
0
-10
-20
Payoff
30y Breakeven3.63%
180017751750 1825 1850 1875 1900 1925 1950 1975 2000
-10
15
10
5
0
-5
2
3
4
5
6
7
8
9
10
1
“The catalyst that makes this trade work is inflation at above 5% – this 5% strike is currently lower than spot inflation – a change from the last five years”
– Nicolas Tabardel, Global Head of Inflation Volatility and Exotics
Inflation —Hedging it & Trading it Deutsche Bank
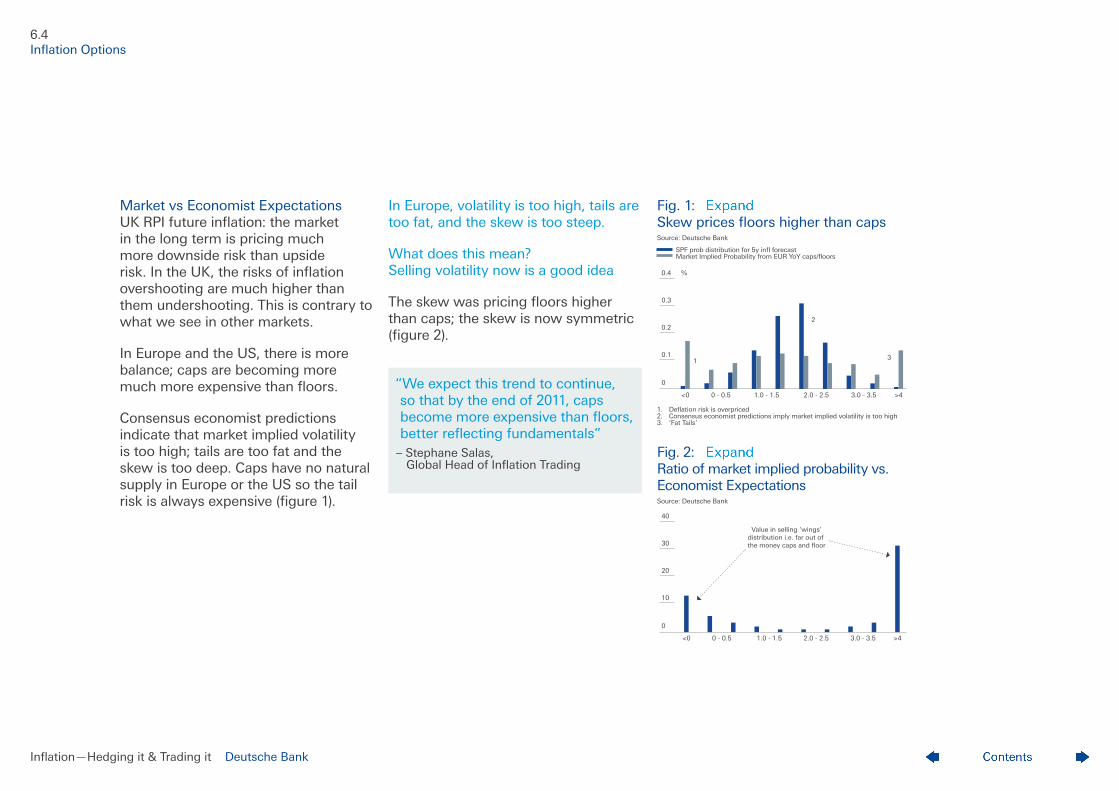
Market vs Economist Expectations UK RPI future inflation: the market in the long term is pricing much more downside risk than upside risk. In the UK, the risks of inflation overshooting are much higher than them undershooting. This is contrary to what we see in other markets.
In Europe and the US, there is more balance; caps are becoming more much more expensive than floors.
Consensus economist predictions indicate that market implied volatility is too high; tails are too fat and the skew is too deep. Caps have no natural supply in Europe or the US so the tail risk is always expensive (figure 1).
In Europe, volatility is too high, tails are too fat, and the skew is too steep.
What does this mean? Selling volatility now is a good idea
The skew was pricing floors higher than caps; the skew is now symmetric (figure 2).
Fig. 1: Skew prices floors higher than caps Source: Deutsche Bank
SPF prob distribution for 5y infl forecast Market Implied Probability from EUR YoY caps/floors 1. Deflation risk is overpriced 2. Consensus economist predictions imply market implied volatility is too high 3. ‘Fat Tails’
Fig. 2: Ratio of market implied probability vs. Economist Expectations Source: Deutsche Bank
6.4 Inflation Options
0
0.4
0.3
0.2
0.1
<0 0 - 0.5 1.0 - 1.5 2.0 - 2.5 3.0 - 3.5 >4
%
1
2
3
0
40
30
20
10
<0 0 - 0.5 1.0 - 1.5 2.0 - 2.5 3.0 - 3.5 >4
Value in selling ‘wings’distribution i.e. far out of the money caps and floor
“We expect this trend to continue, so that by the end of 2011, caps become more expensive than floors, better reflecting fundamentals”
– Stephane Salas, Global Head of Inflation Trading
Inflation —Hedging it & Trading it Deutsche Bank
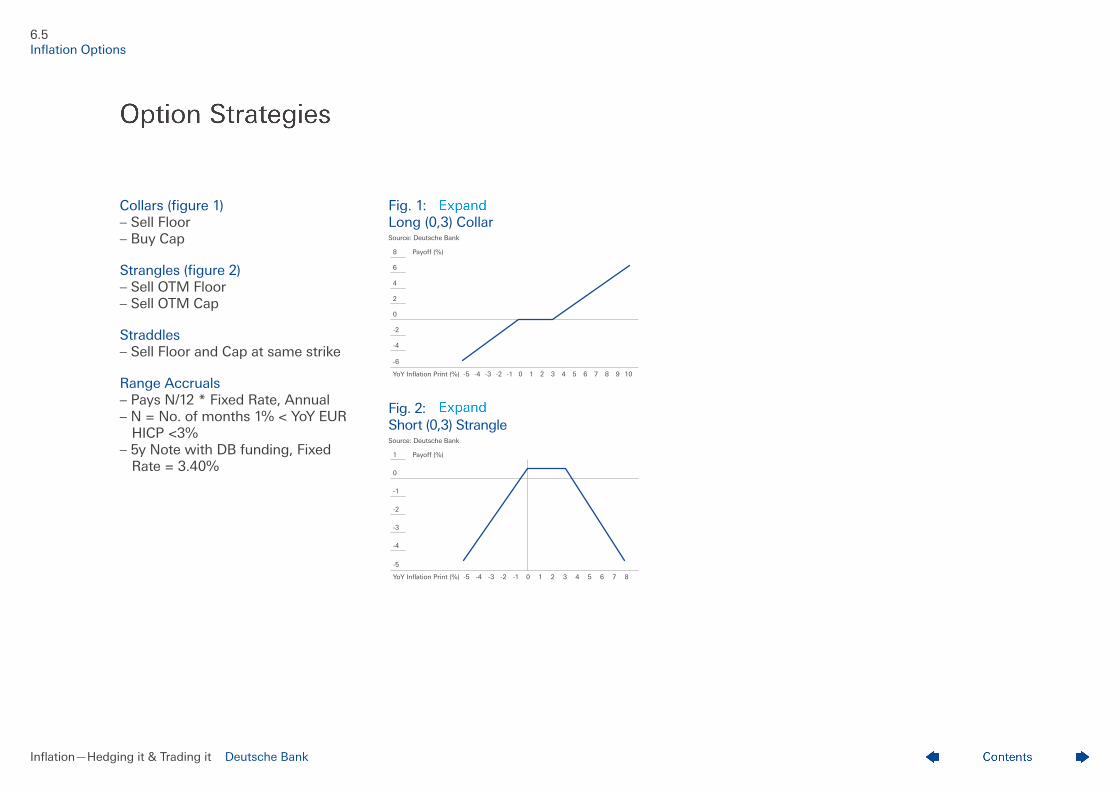
Collars (figure 1) – Sell Floor – Buy Cap
Strangles (figure 2) – Sell OTM Floor – Sell OTM Cap
Straddles – Sell Floor and Cap at same strike
Range Accruals – Pays N/12 * Fixed Rate, Annual – N = No. of months 1% < YoY EUR HICP <3% – 5y Note with DB funding, Fixed Rate = 3.40%
Fig. 1: Long (0,3) Collar Source: Deutsche Bank
Fig. 2: Short (0,3) Strangle Source: Deutsche Bank
6.5 Inflation Options
-6
8
6
4
2
0
-2
-4
-5 -3 -2-4 -1 1 20 3 654 7 8 9 10
Payoff (%)
YoY Inflation Print (%)
-5
1
0
-1
-2
-3
-4
-5 -3 -2-4 -1 1 20 3 654 7 8
Payoff (%)
YoY Inflation Print (%)
Inflation —Hedging it & Trading it Deutsche Bank
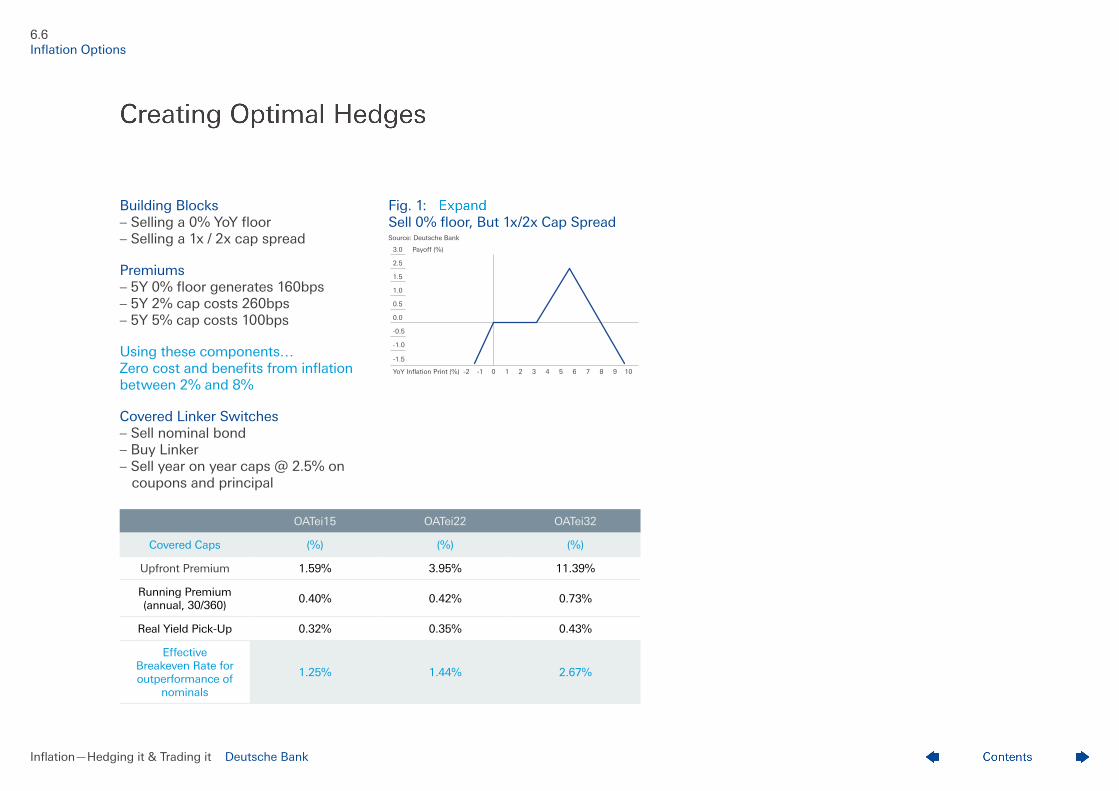
Building Blocks – Selling a 0% YoY floor – Selling a 1x / 2x cap spread
Premiums – 5Y 0% floor generates 160bps – 5Y 2% cap costs 260bps – 5Y 5% cap costs 100bps
Using these components… Zero cost and benefits from inflation between 2% and 8%
Covered Linker Switches – Sell nominal bond – Buy Linker – Sell year on year caps @ 2.5% on coupons and principal
OATei15 OATei22 OATei32
Covered Caps (%) (%) (%)
Upfront Premium 1.59% 3.95% 11.39%
Running Premium (annual, 30/360)
0.40% 0.42% 0.73%
Real Yield Pick-Up 0.32% 0.35% 0.43%
Effective Breakeven Rate for outperformance of
nominals
1.25% 1.44% 2.67%
Fig. 1: Sell 0% floor, But 1x/2x Cap Spread Source: Deutsche Bank
6.6 Inflation Options
-1.5
3.0
1.5
2.5
1.0
0.5
0.0
-0.5
-1.0
-2 -1 1 20 3 654 7 8 9 10
Payoff (%)
YoY Inflation Print (%)

Inflation —Hedging it & Trading it Deutsche Bank
7Deflation Tail Risk
Deflation Tail Risk: DB 5 Year Note
Contents
Inflation —Hedging it & Trading it Deutsche Bank
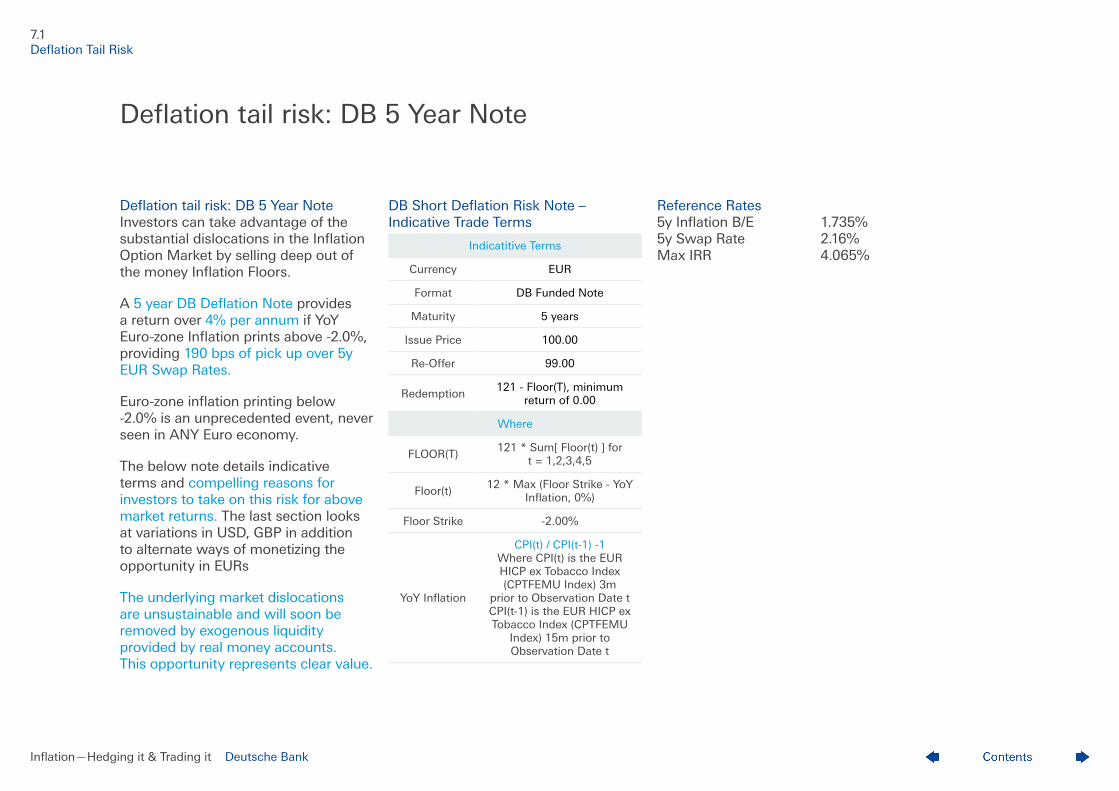
Deflation tail risk: DB 5 Year Note Investors can take advantage of the substantial dislocations in the Inflation Option Market by selling deep out of the money Inflation Floors.
A 5 year DB Deflation Note provides a return over 4% per annum if YoY Euro-zone Inflation prints above -2.0%, providing 190 bps of pick up over 5y EUR Swap Rates.
Euro-zone inflation printing below -2.0% is an unprecedented event, never seen in ANY Euro economy.
The below note details indicative terms and compelling reasons for investors to take on this risk for above market returns. The last section looks at variations in USD, GBP in addition to alternate ways of monetizing the opportunity in EURs
The underlying market dislocations are unsustainable and will soon be removed by exogenous liquidity provided by real money accounts. This opportunity represents clear value.
DB Short Deflation Risk Note – Indicative Trade Terms
Indicatitive Terms
Currency EUR
Format DB Funded Note
Maturity 5 years
Issue Price 100.00
Re-Offer 99.00
Redemption121 - Floor(T), minimum
return of 0.00
Where
FLOOR(T)121 * Sum[ Floor(t) ] for
t = 1,2,3,4,5
Floor(t)12 * Max (Floor Strike - YoY
Inflation, 0%)
Floor Strike -2.00%
YoY Inflation
CPI(t) / CPI(t-1) -1 Where CPI(t) is the EUR HICP ex Tobacco Index (CPTFEMU Index) 3m
prior to Observation Date t CPI(t-1) is the EUR HICP ex Tobacco Index (CPTFEMU
Index) 15m prior to Observation Date t
Reference Rates 5y Inflation B/E 1.735% 5y Swap Rate 2.16% Max IRR 4.065%
7.1 Deflation Tail Risk
Deflation tail risk: DB 5 Year Note

Inflation —Hedging it & Trading it Deutsche Bank
8Case Study: Zero-Coupon Option Trade
Contents
Inflation —Hedging it & Trading it Deutsche Bank
During the first six months of 2010, a Toronto-based insurer purchased deflation protection worth $21.539 billion in notional, paying $173.7 million in premium. The 10-year zero-coupon 0% options were denominated in dollars, euros and sterling, and were executed by Deutsche Bank and Citi.
The other side of the trade was largely taken by California-based fixed-income manager Pimco, which reported it had sold more than $8 billion of 10-year zero-coupon 0% inflation floors in a filing dated August 27. The floors were sold in return for more than $70 million in premium, with Deutsche and Citi as counterparties.
The transaction made perfect sense for both participants. For the insurer, the 0% floors acted as a hedge against deflation and the impact that would have on its equity portfolio. At the same time, Pimco was able to cash in on 0% inflation floors embedded in its sizable portfolio of Treasury inflation-protected securities (Tips). Dealers say the headlines generated by the trade had a positive impact on the market, encouraging other clients to express
their views on the direction of inflation by buying or selling zero-coupon options.
Daragh McDevitt, DB Global Head of Inflation Structuring said, “It sparked interest because you have very intelligent investors on both sides who are taking opposite sides of the trade.”
Since Q2, 2010, quantitative easing has encouraged more clients to sell implied inflation volatility at levels that look expensive. In particular, many market players have looked to play inflation volatility versus interest rate volatility – for example, by buying interest rate caps and selling inflation caps at similar strikes. “We’ve seen a lot of clients coming in on the same side as Pimco, viewing the probability of deflation priced in by these options to be inflated. They are either selling the options embedded in their bond portfolios, selling the options outright or entering into some kind of interest rate options strategy,” says McDevitt.
The transaction made perfect sense for both participants. For the insurer, the 0% floors acted as a hedge against deflation and the impact that would have on its equity portfolio. At the same time, Pimco was able to cash in on 0% inflation floors embedded in its sizable portfolio of Treasury inflation-protected securities.
8.1 Case Study
Case Study: Zero-Coupon Option Trade

Inflation —Hedging it & Trading it Deutsche Bank
9Further Reading
Contents
Inflation —Hedging it & Trading it Deutsche Bank
Inflation Hedging for Institutional Investors Examining dynamic asset allocation strategies for high inflation scenarios and the effect of financial market changes on inflation hedging instruments.
Weekly Inflation Research update
Research Inflation Markets Guide
Inflation Big Picture Study
9.1 Further Reading
Further Reading

ContentsInflation —Hedging it & Trading it Deutsche Bank
10Contacts
Contents
Inflation —Hedging it & Trading it Deutsche Bank
Sales
Haroon Sana [email protected] +44 20 754 73671
Matthew Yencken [email protected] +31 2 8258 2010
Michael Durr [email protected] +44 20 754 73671
David Martins-da-Silva [email protected] +44 20 754 74159
Matthew Blackwell [email protected] +65 68 83 16 20
Ed Rubin [email protected] +1 212 250 0551
Tai-Zhong Jiang (Tai-Chu) [email protected] +81 3 5156 6186
Structuring
Daragh McDevitt [email protected] +44 20 754 52750
Xavier Avila [email protected] +44 20 754 72731
Michael Parker [email protected] +65 68 83 08 88
Josh Heller [email protected] +61 2 8258 3619
Research
Markus Heider [email protected] +44 20 754 2167
Alex Li [email protected] +1 212 250 5483
Trading
Stephane Salas [email protected] +44 20 754 78809
Nicolas Tabardel [email protected] +44 20 754 55748
Allan Levin [email protected] +1 212 250 7105
Katsuya Miyoshi [email protected] +81 3 5156 6205
Vaughan Harvey [email protected] +61 2 8258 1848
Integrated trading, structuring and research Unlike some of our competitors, Deutsche Bank’s inflation trading, structuring and research professionals work closely together, combining strategic and technical expertise with the macro-economic insights so important with this offering.
10.1 Contacts
Contacts – Deutsche Bank Global Inflation Team

Inflation —Hedging it & Trading it Deutsche Bank
This document is intended for discussion purposes only and does not create any legally binding obligations on the part of Deutsche Bank AG and/or its affiliates (“DB”). Without limitation, this document does not constitute an offer, an invitation to offer or a recommendation to enter into any transaction. When making an investment decision, you should rely solely on the final documentation relating to the transaction and not the summary contained herein. DB is not acting as your financial adviser or in any other fiduciary capacity with respect to this proposed transaction. The transaction(s) or products(s) mentioned herein may not be appropriate for all investors and before entering into any transaction you should take steps to ensure that you fully understand the transaction and have made an independent assessment of the appropriateness of the transaction in the light of your own objectives and circumstances, including the possible risks and benefits of entering into such transaction. For general information regarding the nature and risks of the proposed transaction and types of financial instruments please go to http://www.globalmarkets.db.com/riskdisclosures www.globalmarkets.db.com/riskdisclosures. You should also consider seeking advice from your own advisers in making this assessment. If you decide to enter into a transaction with DB, you do so in reliance on your own judgment. The information contained in this document is based on material we believe to be reliable; however, we do not represent that it is accurate, current, complete, or error free. Assumptions, estimates and opinions contained in this document constitute our judgment as of the date of the document and are subject to change without notice. Any projections are based on a number of assumptions as to market conditions and there can be no guarantee that any projected results will be achieved. Past performance is not a guarantee of future results. This material was prepared by a Sales or Trading function within DB, and was not produced, reviewed or edited by the Research Department. Any opinions expressed herein may differ from the opinions expressed by other DB departments including the Research Department. Sales and Trading functions are subject to additional potential conflicts of interest which the Research Department does not face. DB may engage in transactions in a manner inconsistent with the views discussed herein. DB trades or may trade as principal in the instruments (or related derivatives), and may have proprietary positions in the instruments (or related derivatives) discussed herein. DB may make a market in the instruments (or related derivatives) discussed herein. Sales and Trading personnel are compensated in part based on the volume of transactions effected by them. The distribution of this document and availability of these products and services in certain jurisdictions may be restricted by law. You may not distribute this document, in whole or in part, without our express written permission. DB SPECIFICALLY DISCLAIMS ALL LIABILITY FOR ANY DIRECT, INDIRECT, CONSEQUENTIAL OR OTHER LOSSES OR DAMAGES INCLUDING LOSS OF PROFITS INCURRED BY YOU OR ANY THIRD PARTY THAT MAY ARISE FROM ANY RELIANCE ON THIS DOCUMENT OR FOR THE RELIABILITY, ACCURACY, COMPLETENESS OR TIMELINESS THEREOF. DB is authorised under German Banking Law (competent authority: BaFin - Federal Financial Supervising Authority) and regulated by the Financial Services Authority for the conduct of UK business. This document is intended for discussion purposes only. You may not distribute this document, in whole or in part, without express written permission. Without limitation, this document does not constitute an offer, an invitation to offer or a recommendation to enter into any transaction. The information contained in this document is based on material we believe to be reliable; however, we do not represent that it is accurate, current, complete, or error free. Assumptions, estimates and opinions contained in this document constitute our judgment as of the date of the document and are subject to change without notice. Any projections are based on a number of assumptions as to market conditions and there can be no guarantee that any projected results will be achieved. Past performance is not a guarantee of future results. The services described in this document are provided by Deutsche Bank AG or by its subsidiaries and/or affiliates in accordance with appropriate local legislation and regulation. Deutsche Bank Securities Inc., a subsidiary of Deutsche Bank AG, conducts investment banking and securities activities in the United States. Deutsche Bank Securities Inc. is a member of NYSE, FINRA and SIPC. Investments are subject to investment risk, including market fluctuations, regulatory change, counterparty risk, possible delays in repayment and loss of income and principal invested. The value of investment can fall as well as rise and you might not get back the amount originally invested at any point in time. © Copyright Deutsche Bank AG 2011.
Recommended