C A R B O N 5 6 ( 2 0 1 3 ) 4 5 – 4 9
.sc ienced i rec t .com
Avai lab le a t wwwjournal homepage: www.elsevier .com/ locate /carbon
Passivation of microbial corrosion using a graphene coating
A. Krishnamurthy a,1, V. Gadhamshetty b,*,1, R. Mukherjee a, Z. Chen c, W. Ren c,H-M. Cheng c, N. Koratkar a,*
a Mechanical, Aerospace and Nuclear Engineering, Rensselaer Polytechnic Institute, 110 8th Street, Troy, NY 12180, USAb Civil and Environmental Engineering, Rensselaer Polytechnic Institute, 110 8th Street, Troy, NY 12180, USAc Shenyang National Laboratory for Materials Science, Institute of Metal Research, Chinese Academy of Sciences, Shenyang 110016, China
A R T I C L E I N F O
Article history:
Received 21 November 2012
Accepted 18 December 2012
Available online 5 January 2013
0008-6223/$ - see front matter � 2013 Elsevihttp://dx.doi.org/10.1016/j.carbon.2012.12.060
* Corresponding author.E-mail addresses: [email protected] (V. Gad
1 These authors contributed equally to this
A B S T R A C T
Microbial corrosion limits the use of metallic structures in a variety of technological pro-
cesses and applications. Here, we report the first demonstration of graphene as a passive
layer that retards microbially-induced galvanic corrosion (MIC) of metals for extended peri-
ods of time (�2700 h). The effectiveness of the MIC-resistant graphene coating was evalu-
ated under realistic operating conditions by testing baseline Ni foams and graphene-coated
Ni foams as anodes in a microbial fuel cell. The rates of Ni dissolution in the graphene-
coated Ni anode were at least an order of magnitude lower than the baseline (uncoated)
Ni electrode. Electrochemical impedance spectroscopy characterization revealed that the
MIC of Ni was impeded by over 40-fold when coated with graphene.
� 2013 Elsevier Ltd. All rights reserved.
altering the metal-solution interface [2,3]. Classic techniques
1. IntroductionThe annual costs related to corrosion have been estimated to
be nearly $276 billion and represents 3.1% of the U.S. Gross
Domestic Product [1]. Metallic corrosion is a major contributor
to these costs especially in oil production, power plants, ship-
ping and aviation industries, drinking water systems, pipe-
lines, bridges, and public buildings [1,2]. While corrosion
typically occurs under acidic conditions, microbial corrosion
is more complex as the microbes are adept at inducing corro-
sion even under ambient temperatures and neutral pH condi-
tions [2]. The galvanic corrosion process can be represented
as two half-cell reactions, namely: (i) the oxidation of electron
donors (i.e. metals such as Ni) (Eq. (1)) and (ii) the reduction of
electron acceptors (Eq. (2)).
Anode : Ni2þ þ 2e� ! Ni; EA ¼ �0:25 V ð1Þ
Cathode : Fe3ðCNÞ3�6 þ e� ! Fe3ðCNÞ4�6 ; Ec ¼ 0:36 V ð2Þ
In an aqueous environment, microbes develop biofilm lay-
ers on the metal surface, and accelerate metallic corrosion by
er Ltd. All rights reserved
hamshetty), koratn@rpi.
work.
to prevent MIC includes physical (e.g. flushing) and chemical
methods (e.g. biocides), and by application of passivation lay-
ers (e.g. thiol-based mono-layers) [2]. While graphene (Gr)
coatings have been reported to be resistant towards oxidation
and corrosion in abiotic environments [4–9], there is so far no
report on the microbial corrosion resistance of graphene.
Here we report that conformal graphene coatings are remark-
ably effective in inhibiting microbially-induced metallic cor-
rosion (MIC) for time periods of up to 2700 h.
Microbial fuel cells (MFCs) represent a galvanic cell that
produces electric current by integrating: (i) bioelectrochemical
oxidation of organic matter at the anode (Eq. (3)) and (ii) abiotic
reduction of electron acceptor at the cathode (Eq. (2)) [10]
6CO2 þ 24Hþ þ 24e� ! C6H12O6 þ 6H2O; EA ¼ 0:014 V ð3Þ
MFCs have been widely used as a galvanic tool to simulate
extracellular electron transfer mechanisms of microbes and
the bio-electrochemical oxidation of organic matter [10]. Me-
tal anodes are typically not used in MFCs since they are
strongly susceptible to galvanic corrosion. In this study, we
.
edu (N. Koratkar).
46 C A R B O N 5 6 ( 2 0 1 3 ) 4 5 – 4 9
employ MFCs as a test-bed to study the MIC of nickel-anode
(Ni) and graphene-coated-nickel anode (Gr/Ni) in nickel-
anode-based MFCs (NABMs), with the objective of demon-
strating the MIC resistance of graphene coatings.
2. Experimental procedure
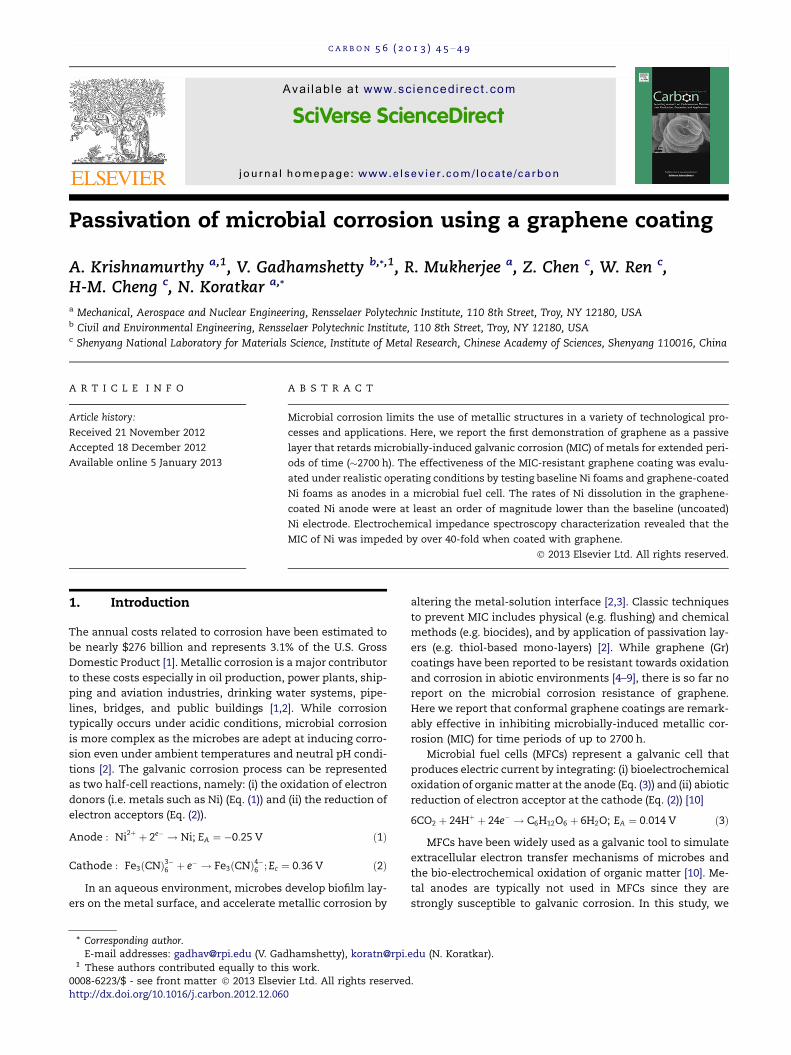
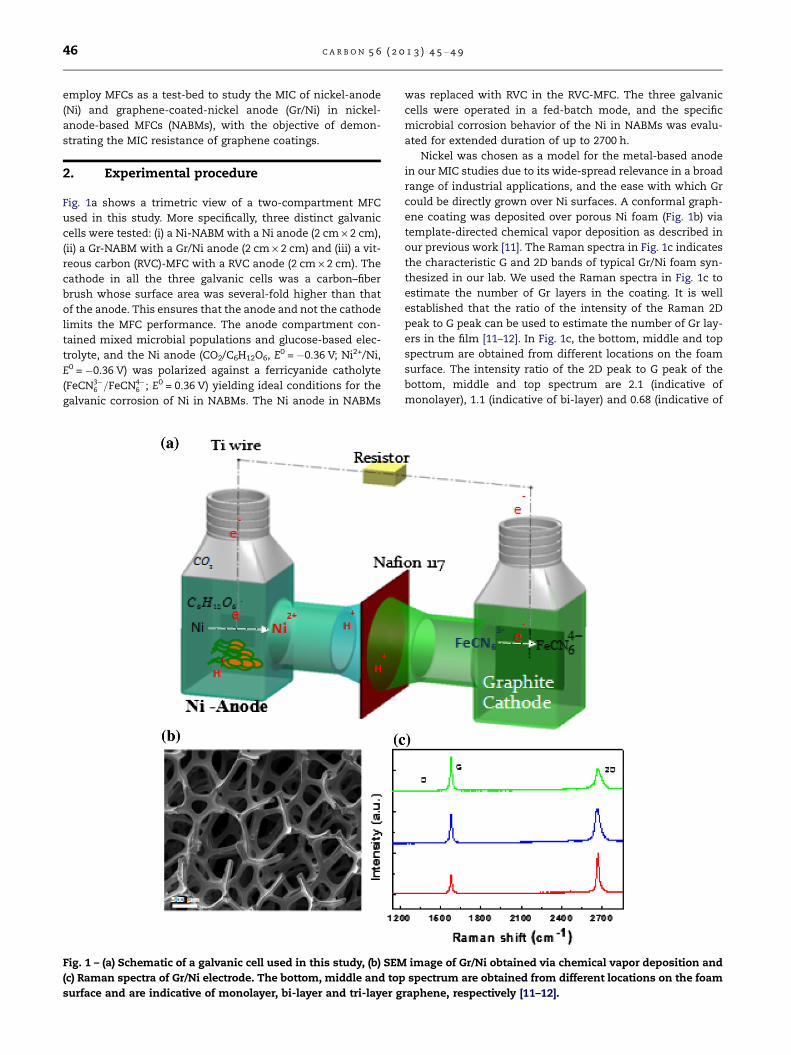
Fig. 1a shows a trimetric view of a two-compartment MFC
used in this study. More specifically, three distinct galvanic
cells were tested: (i) a Ni-NABM with a Ni anode (2 cm · 2 cm),
(ii) a Gr-NABM with a Gr/Ni anode (2 cm · 2 cm) and (iii) a vit-
reous carbon (RVC)-MFC with a RVC anode (2 cm · 2 cm). The
cathode in all the three galvanic cells was a carbon–fiber
brush whose surface area was several-fold higher than that
of the anode. This ensures that the anode and not the cathode
limits the MFC performance. The anode compartment con-
tained mixed microbial populations and glucose-based elec-
trolyte, and the Ni anode (CO2/C6H12O6, E0 = �0.36 V; Ni2+/Ni,
E0 = �0.36 V) was polarized against a ferricyanide catholyte
(FeCN3�6 =FeCN4�
6 ; E0 = 0.36 V) yielding ideal conditions for the
galvanic corrosion of Ni in NABMs. The Ni anode in NABMs
Fig. 1 – (a) Schematic of a galvanic cell used in this study, (b) SEM
(c) Raman spectra of Gr/Ni electrode. The bottom, middle and top
surface and are indicative of monolayer, bi-layer and tri-layer g
was replaced with RVC in the RVC-MFC. The three galvanic
cells were operated in a fed-batch mode, and the specific
microbial corrosion behavior of the Ni in NABMs was evalu-
ated for extended duration of up to 2700 h.
Nickel was chosen as a model for the metal-based anode
in our MIC studies due to its wide-spread relevance in a broad
range of industrial applications, and the ease with which Gr
could be directly grown over Ni surfaces. A conformal graph-
ene coating was deposited over porous Ni foam (Fig. 1b) via
template-directed chemical vapor deposition as described in
our previous work [11]. The Raman spectra in Fig. 1c indicates
the characteristic G and 2D bands of typical Gr/Ni foam syn-
thesized in our lab. We used the Raman spectra in Fig. 1c to
estimate the number of Gr layers in the coating. It is well
established that the ratio of the intensity of the Raman 2D
peak to G peak can be used to estimate the number of Gr lay-
ers in the film [11–12]. In Fig. 1c, the bottom, middle and top
spectrum are obtained from different locations on the foam
surface. The intensity ratio of the 2D peak to G peak of the
bottom, middle and top spectrum are 2.1 (indicative of
monolayer), 1.1 (indicative of bi-layer) and 0.68 (indicative of
image of Gr/Ni obtained via chemical vapor deposition and
spectrum are obtained from different locations on the foam
raphene, respectively [11–12].
C A R B O N 5 6 ( 2 0 1 3 ) 4 5 – 4 9 47
tri-layer). Therefore we estimate that the graphene skin is
comprised of few-layered (between 1 and 3 layers) graphene
sheets. Both Ni and Gr/Ni foams represent 3D micro porous
structures with interconnected conductive-scaffolds that are
well-suited for microbial growth in an MFC setting.
3. Results and discussion
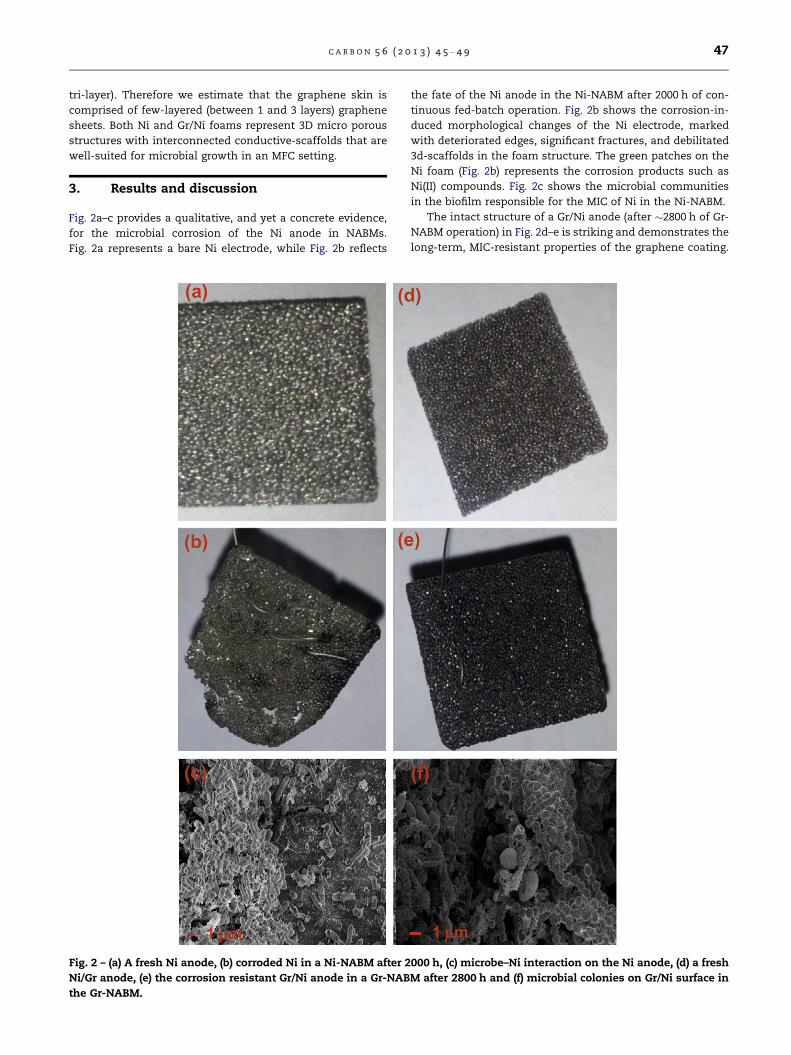
Fig. 2a–c provides a qualitative, and yet a concrete evidence,
for the microbial corrosion of the Ni anode in NABMs.
Fig. 2a represents a bare Ni electrode, while Fig. 2b reflects
Fig. 2 – (a) A fresh Ni anode, (b) corroded Ni in a Ni-NABM after 2
Ni/Gr anode, (e) the corrosion resistant Gr/Ni anode in a Gr-NAB
the Gr-NABM.
the fate of the Ni anode in the Ni-NABM after 2000 h of con-
tinuous fed-batch operation. Fig. 2b shows the corrosion-in-
duced morphological changes of the Ni electrode, marked
with deteriorated edges, significant fractures, and debilitated
3d-scaffolds in the foam structure. The green patches on the
Ni foam (Fig. 2b) represents the corrosion products such as
Ni(II) compounds. Fig. 2c shows the microbial communities
in the biofilm responsible for the MIC of Ni in the Ni-NABM.
The intact structure of a Gr/Ni anode (after �2800 h of Gr-
NABM operation) in Fig. 2d–e is striking and demonstrates the
long-term, MIC-resistant properties of the graphene coating.
000 h, (c) microbe–Ni interaction on the Ni anode, (d) a fresh
M after 2800 h and (f) microbial colonies on Gr/Ni surface in
0.01 0.1 1 10 100 1000 100000
400
800
1200
Frequency [Hz]
Mod
ulus
[Z]
0.01 0.1 1 10 100 1000 100000
20
40
60
80
100
Frequency [Hz]
Mod
ulus
[Z
]
Gr-NABM
RVC
Ni-NABM
Gr-NABM
RVC
0 200 400 600 8000
400
800
1200
Zreal (Ω)
-Zim
g ( Ω
)
0 20 40 60 80 1000
5
10
15
20
Zreal (Ω)
-Zim
g (Ω
)
Gr-NABM
RVC
Ni-NABM
(a)
(b)
Fig. 4 – EIS analysis of 3 galvanic cells (T = 2800 h) (a) Nyquist
Plots (b) Bode plots (Insets: clear view of Ni-NABM).
48 C A R B O N 5 6 ( 2 0 1 3 ) 4 5 – 4 9
Fig. 2f shows the interconnected microbial network (biofilm)
on the Gr/Ni surface due to NABM operation. It should be
noted that signs of deterioration on the Ni anode appeared
within 10 days, and the Ni electrode has totally collapsed after
80 days of NABM operation; however, the Gr/Ni anode demon-
strated excellent anti-MIC properties and retained its physical
integrity even after over 110 days of continuous operation
(Fig. 2e).
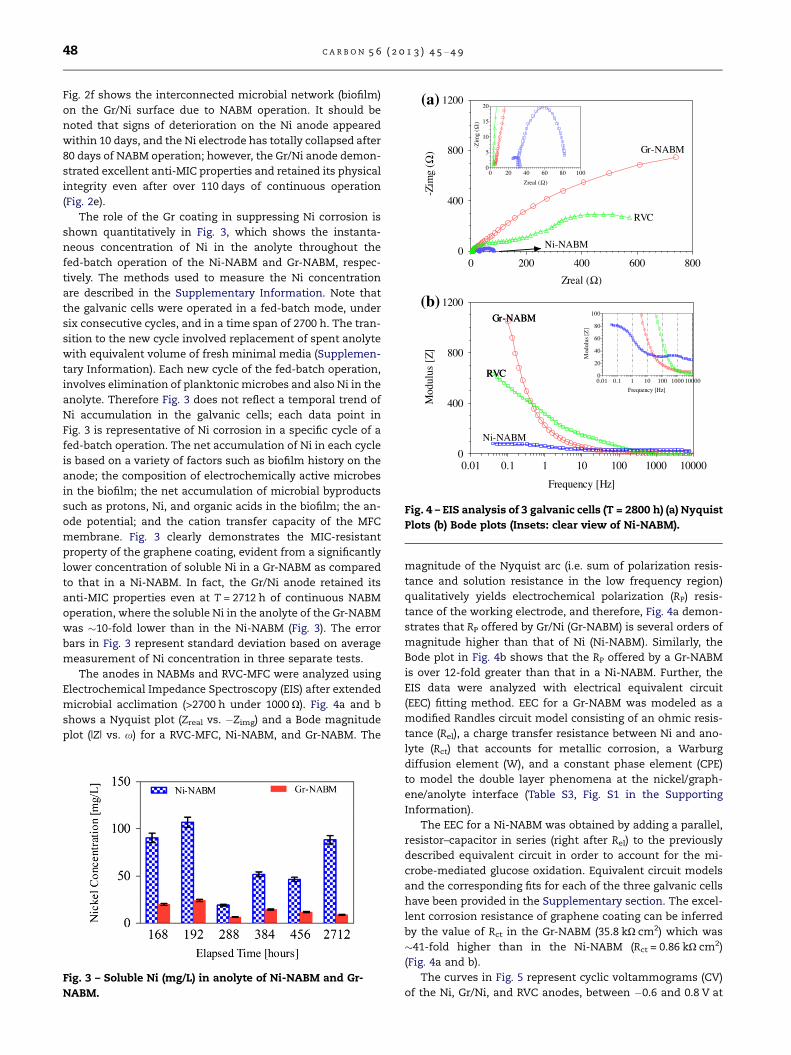
The role of the Gr coating in suppressing Ni corrosion is
shown quantitatively in Fig. 3, which shows the instanta-
neous concentration of Ni in the anolyte throughout the
fed-batch operation of the Ni-NABM and Gr-NABM, respec-
tively. The methods used to measure the Ni concentration
are described in the Supplementary Information. Note that
the galvanic cells were operated in a fed-batch mode, under
six consecutive cycles, and in a time span of 2700 h. The tran-
sition to the new cycle involved replacement of spent anolyte
with equivalent volume of fresh minimal media (Supplemen-
tary Information). Each new cycle of the fed-batch operation,
involves elimination of planktonic microbes and also Ni in the
anolyte. Therefore Fig. 3 does not reflect a temporal trend of
Ni accumulation in the galvanic cells; each data point in
Fig. 3 is representative of Ni corrosion in a specific cycle of a
fed-batch operation. The net accumulation of Ni in each cycle
is based on a variety of factors such as biofilm history on the
anode; the composition of electrochemically active microbes
in the biofilm; the net accumulation of microbial byproducts
such as protons, Ni, and organic acids in the biofilm; the an-
ode potential; and the cation transfer capacity of the MFC
membrane. Fig. 3 clearly demonstrates the MIC-resistant
property of the graphene coating, evident from a significantly
lower concentration of soluble Ni in a Gr-NABM as compared
to that in a Ni-NABM. In fact, the Gr/Ni anode retained its
anti-MIC properties even at T = 2712 h of continuous NABM
operation, where the soluble Ni in the anolyte of the Gr-NABM
was �10-fold lower than in the Ni-NABM (Fig. 3). The error
bars in Fig. 3 represent standard deviation based on average
measurement of Ni concentration in three separate tests.
The anodes in NABMs and RVC-MFC were analyzed using
Electrochemical Impedance Spectroscopy (EIS) after extended
microbial acclimation (>2700 h under 1000 X). Fig. 4a and b
shows a Nyquist plot (Zreal vs. �Zimg) and a Bode magnitude
plot (|Z| vs. x) for a RVC-MFC, Ni-NABM, and Gr-NABM. The
Fig. 3 – Soluble Ni (mg/L) in anolyte of Ni-NABM and Gr-
NABM.
magnitude of the Nyquist arc (i.e. sum of polarization resis-
tance and solution resistance in the low frequency region)
qualitatively yields electrochemical polarization (RP) resis-
tance of the working electrode, and therefore, Fig. 4a demon-
strates that RP offered by Gr/Ni (Gr-NABM) is several orders of
magnitude higher than that of Ni (Ni-NABM). Similarly, the
Bode plot in Fig. 4b shows that the RP offered by a Gr-NABM
is over 12-fold greater than that in a Ni-NABM. Further, the
EIS data were analyzed with electrical equivalent circuit
(EEC) fitting method. EEC for a Gr-NABM was modeled as a
modified Randles circuit model consisting of an ohmic resis-
tance (Rel), a charge transfer resistance between Ni and ano-
lyte (Rct) that accounts for metallic corrosion, a Warburg
diffusion element (W), and a constant phase element (CPE)
to model the double layer phenomena at the nickel/graph-
ene/anolyte interface (Table S3, Fig. S1 in the Supporting
Information).
The EEC for a Ni-NABM was obtained by adding a parallel,
resistor–capacitor in series (right after Rel) to the previously
described equivalent circuit in order to account for the mi-
crobe-mediated glucose oxidation. Equivalent circuit models
and the corresponding fits for each of the three galvanic cells
have been provided in the Supplementary section. The excel-
lent corrosion resistance of graphene coating can be inferred
by the value of Rct in the Gr-NABM (35.8 kX cm2) which was
�41-fold higher than in the Ni-NABM (Rct = 0.86 kX cm2)
(Fig. 4a and b).
The curves in Fig. 5 represent cyclic voltammograms (CV)
of the Ni, Gr/Ni, and RVC anodes, between �0.6 and 0.8 V at
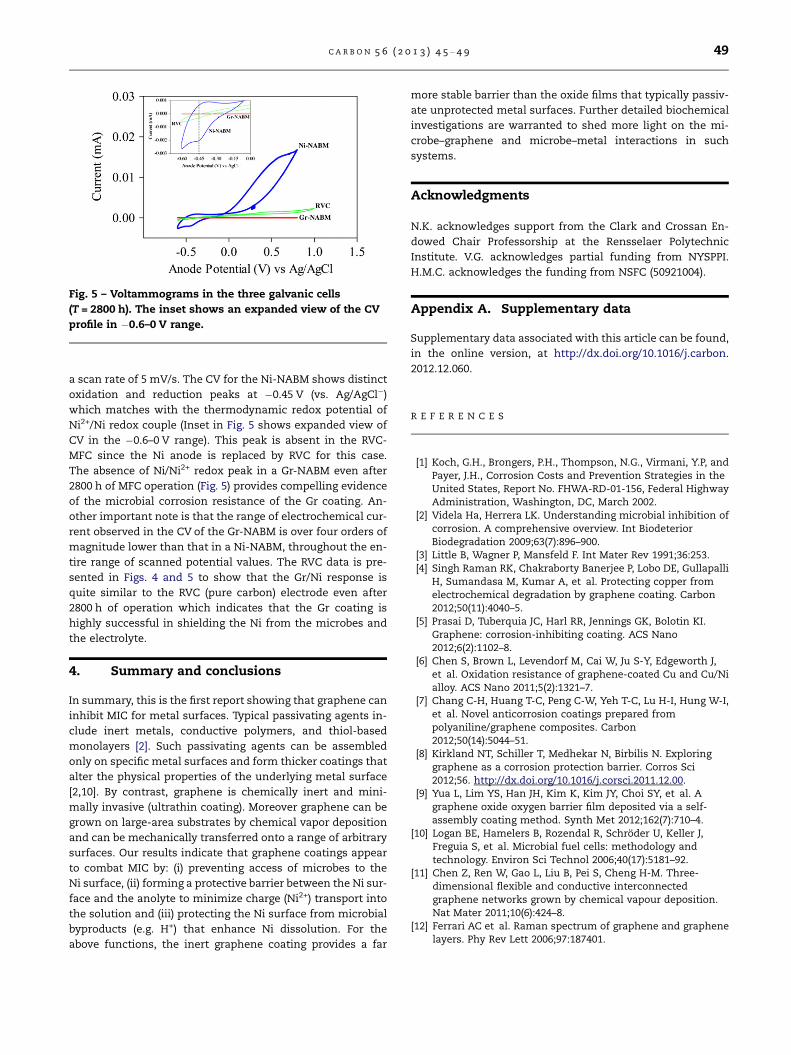
Fig. 5 – Voltammograms in the three galvanic cells
(T = 2800 h). The inset shows an expanded view of the CV
profile in �0.6–0 V range.
C A R B O N 5 6 ( 2 0 1 3 ) 4 5 – 4 9 49
a scan rate of 5 mV/s. The CV for the Ni-NABM shows distinct
oxidation and reduction peaks at �0.45 V (vs. Ag/AgCl�)
which matches with the thermodynamic redox potential of
Ni2+/Ni redox couple (Inset in Fig. 5 shows expanded view of
CV in the �0.6–0 V range). This peak is absent in the RVC-
MFC since the Ni anode is replaced by RVC for this case.
The absence of Ni/Ni2+ redox peak in a Gr-NABM even after
2800 h of MFC operation (Fig. 5) provides compelling evidence
of the microbial corrosion resistance of the Gr coating. An-
other important note is that the range of electrochemical cur-
rent observed in the CV of the Gr-NABM is over four orders of
magnitude lower than that in a Ni-NABM, throughout the en-
tire range of scanned potential values. The RVC data is pre-
sented in Figs. 4 and 5 to show that the Gr/Ni response is
quite similar to the RVC (pure carbon) electrode even after
2800 h of operation which indicates that the Gr coating is
highly successful in shielding the Ni from the microbes and
the electrolyte.
4. Summary and conclusions
In summary, this is the first report showing that graphene can
inhibit MIC for metal surfaces. Typical passivating agents in-
clude inert metals, conductive polymers, and thiol-based
monolayers [2]. Such passivating agents can be assembled
only on specific metal surfaces and form thicker coatings that
alter the physical properties of the underlying metal surface
[2,10]. By contrast, graphene is chemically inert and mini-
mally invasive (ultrathin coating). Moreover graphene can be
grown on large-area substrates by chemical vapor deposition
and can be mechanically transferred onto a range of arbitrary
surfaces. Our results indicate that graphene coatings appear
to combat MIC by: (i) preventing access of microbes to the
Ni surface, (ii) forming a protective barrier between the Ni sur-
face and the anolyte to minimize charge (Ni2+) transport into
the solution and (iii) protecting the Ni surface from microbial
byproducts (e.g. H+) that enhance Ni dissolution. For the
above functions, the inert graphene coating provides a far
more stable barrier than the oxide films that typically passiv-
ate unprotected metal surfaces. Further detailed biochemical
investigations are warranted to shed more light on the mi-
crobe–graphene and microbe–metal interactions in such
systems.
Acknowledgments
N.K. acknowledges support from the Clark and Crossan En-
dowed Chair Professorship at the Rensselaer Polytechnic
Institute. V.G. acknowledges partial funding from NYSPPI.
H.M.C. acknowledges the funding from NSFC (50921004).
Appendix A. Supplementary data
Supplementary data associated with this article can be found,
in the online version, at http://dx.doi.org/10.1016/j.carbon.
2012.12.060.
R E F E R E N C E S
[1] Koch, G.H., Brongers, P.H., Thompson, N.G., Virmani, Y.P, andPayer, J.H., Corrosion Costs and Prevention Strategies in theUnited States, Report No. FHWA-RD-01-156, Federal HighwayAdministration, Washington, DC, March 2002.
[2] Videla Ha, Herrera LK. Understanding microbial inhibition ofcorrosion. A comprehensive overview. Int BiodeteriorBiodegradation 2009;63(7):896–900.
[3] Little B, Wagner P, Mansfeld F. Int Mater Rev 1991;36:253.[4] Singh Raman RK, Chakraborty Banerjee P, Lobo DE, Gullapalli
H, Sumandasa M, Kumar A, et al. Protecting copper fromelectrochemical degradation by graphene coating. Carbon2012;50(11):4040–5.
[5] Prasai D, Tuberquia JC, Harl RR, Jennings GK, Bolotin KI.Graphene: corrosion-inhibiting coating. ACS Nano2012;6(2):1102–8.
[6] Chen S, Brown L, Levendorf M, Cai W, Ju S-Y, Edgeworth J,et al. Oxidation resistance of graphene-coated Cu and Cu/Nialloy. ACS Nano 2011;5(2):1321–7.
[7] Chang C-H, Huang T-C, Peng C-W, Yeh T-C, Lu H-I, Hung W-I,et al. Novel anticorrosion coatings prepared frompolyaniline/graphene composites. Carbon2012;50(14):5044–51.
[8] Kirkland NT, Schiller T, Medhekar N, Birbilis N. Exploringgraphene as a corrosion protection barrier. Corros Sci2012;56. http://dx.doi.org/10.1016/j.corsci.2011.12.00.
[9] Yua L, Lim YS, Han JH, Kim K, Kim JY, Choi SY, et al. Agraphene oxide oxygen barrier film deposited via a self-assembly coating method. Synth Met 2012;162(7):710–4.
[10] Logan BE, Hamelers B, Rozendal R, Schroder U, Keller J,Freguia S, et al. Microbial fuel cells: methodology andtechnology. Environ Sci Technol 2006;40(17):5181–92.
[11] Chen Z, Ren W, Gao L, Liu B, Pei S, Cheng H-M. Three-dimensional flexible and conductive interconnectedgraphene networks grown by chemical vapour deposition.Nat Mater 2011;10(6):424–8.
[12] Ferrari AC et al. Raman spectrum of graphene and graphenelayers. Phy Rev Lett 2006;97:187401.
Recommended