SATHOSA MOTORS PLC
Annual Report 2014/15
Passion forSatisfaction
SATHOSA MOTORS PLC
ANNUAL REPORT 2014/15


Service is at the heart of the operational being of Sathosa Motors. In becoming the dynamic visionary leader, we’ve acknowledged the role service excellence plays in developing our position within the Industry. Driven by a high sense of customer satisfaction, our passion for service is derived through the provision of quality products at competitive prices. Our team of highly motivated staff has dedicated themselves to serve passionately, serve from the heart with the commitment of maximising returns to all stakeholders. That is why Sathosa Motors is increasingly becoming every Automobile Enthusiast’s preferred choice in the 21st Century.
Passion forSatisfaction
SATHOSA MOTORS PLC

SATHOSA MOTORS PLC | Annual Report 2014/152
Our VisionTo be the trusted leader in the Sri Lankan Automobile vehicle industry by ensuring that we deliver only the best quality to our valued customers.
Our MissionTo achieve excellence in customer satisfaction by cultivating a dynamic and productive organizational culture with highly motivated staff to provide the best quality vehicles at competitive and affordable prices, thereby generating the maximum benefit to all our stakeholders.
Key Corporate Values• Wevalueandbelieveinmaintainingthehigheststandards
of integrity, honesty, transparency, responsibility and ethical behaviour in all our dealings and transactions.
• Werespectthedignityofpeople
• Wearepassionateaboutdeliveringthehighest levelsofservice quality to all our internal and external stakeholders.
• Weencourageandrespectdiversityamongour team inorder to create an inclusive organizational culture.
• Webelieveinleadingbyexample.
• We firmly believe in taking all prudent and responsiblemeasures to strengthen our Company’s financial foundation.
• Webelieve in the importanceof ensuring excellence inall our processes and systems as a means of maintaining a strong niche position in the Sri Lankan market: from expanding our dealership network, to introducing innovative product ranges to the market, to market development, to leveraging training as an opportunity to enhance expertise and productivity.
• We are committed at all times to strengthening thecorporate image of Sathosa Motors by communicating and delivering on our core values.

3
�History of Sathosa Motors PLC 4 �Financial Highlights 6 �The New Isuzu Series Reward 8
�Chairman’s Review 10 �Managing Director Review 14 �Board of Directors 18
�Management Discussion and Analysis 24 �Corporate Governance 30 �Risk Management Review 32
�Annual Report of the Board of Directors on the Affairs of the Company 38
�Independent Auditors’ Report 41 �Statement of Profit or Loss and Other Comprehensive Income 42
�Statement of Financial Position 43 �Statement of Changes in Equity 44 �Statement of Cash Flow 46
�Notes to the Financial Statements 47 �Report of the Audit Committee 89 �Information to Investor 91
�Statement of Value Added 93 �Notice of Annual General Meeting 94 �Form of Proxy 95
�Corporate Information Inner Back Cover
Contents

2007The Company was re-registered under the Company’s Act
No 7 of 2007, as Sathosa Motors PLC (SML).
2012The controlling stake of SML was acquired by Access Engineering Company
Limited.
1962The Isuzu Agency was secured by the Co-operative
Wholesale Establishment (CWE), under their New
Vehicles and Machinery Department.
1978Strengthens its foothold in the industry after the liberalization of imports.
1985Converts the New Vehicles and Machinery Department into a
fullyownedsubsidiaryof theCWE,under theauspicesof
the Ministry of Trade and Commerce as “Sathosa Motors
Limited” to enable the Company to operate more
independently and efficiently, catering to the
growing demand.
Company HistoryWith a history that spans over five decades in time, SathosaMotors PLC has established its name as a
trustedleaderintheautomotiveindustryofSriLanka.Withacomprehensiveproductofferwhichcaterstodifferent
economic segments, the Isuzu range of vehicles include Double Cab Pickup Trucks, Light and Heavy Duty Commercial
vehicles, luxury passenger coaches and special purpose vehicles. Further enhancing this growing vehicle portfolio is its latest
addition, the Isuzu Sports Utility Vehicle range.
The Head Office at No.25, Vauxhall Street, Colombo 02 comprises of a state of the art new vehicle
showroom, a spare part department and a workshop capable of handling all Isuzu vehicle repairs.
Equipped with modern technology, the main workshop at Peliyagoda is renowned for both
problem identification as well as rectification of all models under the prestigious
Isuzu brand. For the convenience of customers, a spare parts unit has also
been established at Panchilawathtaha.

2007The Company was re-registered under the Company’s Act
No 7 of 2007, as Sathosa Motors PLC (SML).
2012The controlling stake of SML was acquired by Access Engineering Company
Limited.
1962The Isuzu Agency was secured by the Co-operative
Wholesale Establishment (CWE), under their New
Vehicles and Machinery Department.
1978Strengthens its foothold in the industry after the liberalization of imports.
1985Converts the New Vehicles and Machinery Department into a
fullyownedsubsidiaryof theCWE,under theauspicesof
the Ministry of Trade and Commerce as “Sathosa Motors
Limited” to enable the Company to operate more
independently and efficiently, catering to the
growing demand.
2013A strategic decision was made to acquire 50% stake in
Frontier Automotive Pvt Ltd, the exclusive distributor for Land
Rover in Sri Lanka, a luxury European Brand, best known as the ‘Sri
Lankan Military’s Vehicle of Choice’.
2014Further strengthening the product offer with the
Introduction of Isuzu SUV with distinctive styling,
spacious interiors and the promise of a smooth
drive, complementing the existing Isuzu
heavy and light commercial trucks and
Isuzu luxury buses and double cabs.
1992Partial privatization of Sathosa Motors Limited, in line
with the government policy. 60% of the issued
capital was acquired by M/s Itoch & Co limited
(ITOUCH Corporation, Tokyo Japan, a leading
trading organization in Japan, 10% of
the balance shares were gifted to
employees, and 30% was issued
to the general public.

SATHOSA MOTORS PLC | Annual Report 2014/156Financial Highlights
Rs. 2,737 Mn.
Net Revenue
Company
Rs. 253 Mn.
PAT
Rs. 41.93EPS
21.18%ROCE
Company Group
06/07 07/08 08/09 09/10 10/11 11/12 12/13 13/14 14/15 13/14 14/15
Gross Turnover (Rs.000) 1,110,934 1,411,026 885,743 824,765 1,449,396 1,902,741 2,334,937 2,459,490 2,752,023 3,075,580 3,527,240
Profit before Taxation (Rs.000) 144,891 164,137 73,981 42,513 175,775 242,311 286,342 322,327 349,652 415,067 382,172
Profit after Taxation (Rs.000) 92,562 100,732 55,352 26,995 110,512 173,026 205,752 231,771 252,968 288,233 269,805
Property Plant & Equipment (Rs.000)& pre paid Lease Payment 33,165 31,768 51,364 45,393 41,349 39,012 44,897 74,465 118,079 178,779 337,928
Investment Property ( Rs.000) - - - - - 21,683 24,192 24,192 24,192 24,192
Gross Dividends Paid (Rs.000) 60,336 96,538 36,202 12,067 30,168 30,168 30,168 30,168 30,168 30,168 30,168
Gross Dividends Proposed (Rs.000) - - - - - - - 30,168 42,235 30,168 42,235
Dividend Per Share Paid / Propose (Rs.) 10.00 16.00 6.00 2.00 5.00 5.00 5.00 5.00 7.00 5.00 7.00
Dividend Cover (Times) 1.53 1.04 1.53 2.24 3.66 5.74 6.82 7.68 5.99 8.62 6.18
Earnings Per Share (Rs.) 15.34 16.70 9.17 4.47 18.32 28.68 34.10 38.41 41.93 43.09 43.32
Net Asset Per Share (Rs.) 60.35 67.04 60.22 58.69 74.51 98.64 127.76 161.08 197.96 165.76 204.02
Net Profit to Revenue (%) (Before tax) 13.16 11.74 8.42 5.20 12.28 13.02 12.39 13.24 12.77 13.65 10.91
Current Ratio (Times) 2.57 2.85 2.69 4.69 1.77 1.73 2.14 2.36 2.50 1.99 1.96
Quick Assets Ratio (Times) 1.65 1.68 0.87 2.61 0.85 0.83 0.74 1.30 1.14 1.15 0.97
Return on Capital Employed (%) 25.42 24.90 15.24 7.62 24.58 29.07 26.69 23.85 21.18 28.82 21.92

7Revenue Analysis
of Year 2014/15
(Gross)
Revenue(Gross)
Rs.
New Vehicles 2,367,465,952
Spareparts 174,910,967
Workshop 160,396,871
Others 49,248,284
Total 2,752,022,074
Return on Capital Employed
(After Tax)
Profitability
Earning & Dividend Per
Share
1.79%5.83%
6.36%
86.03%
0
500
1000
1500
2000
2500
3000
14/1513/1412/1311/1210/11
5
10
15
20
25
30
14/1513/1412/1311/1210/11
100
150
200
250
300
350
14/1513/1412/1311/1210/11
0
10
20
30
40
50
14/1513/1412/1311/1210/11
In Rs. Mn.
Year 10/11 11/12 12/13 13/14 14/15
Revenue 1449.4 1902.74 2334.94 2459.49 2752.02
In Rs. Mn.
Year 10/11 11/12 12/13 13/14 14/15
Profit Before Tax 175.78 242.31 286.34 322.33 349.65
Profit After Tax 110.51 173.03 205.75 231.77 252.97
In Rs.
Year 10/11 11/12 12/13 13/14 14/15
Dividend Per Share 5.00 5.00 5.00 5.00 7.00
Earning Per Share 18.32 28.68 34.10 38.41 41.93
Year 10/11 11/12 12/13 13/14 14/15
Return on Capital Employed % 7.62% 24.58% 26.69% 23.85% 21.18%
Capital Employed Rs. Mn. 449.55 595.17 770.83 971.90 1,194.39
Net Profit After Tax Rs. Mn. 110.51 173.02 205.75 231.77 252.97

THE NEW ISUZUSERIES REWARD


SATHOSA MOTORS PLC | Annual Report 2014/1510Chairman’s Review
Dear Valued Shareholders,
It gives me immense pleasure to share with you the performance and outlook of the Sathosa Motors
PLC (SML) Group as it recorded the highest-ever profitability in the group’s history. Sathosa Motors PLC’s
group revenue rose by over 15.13% during the Financial Year 2014/15 from Rs.3.04 billion in the previous
year to Rs.3.50 billion, while the company revenue rose by 12.34% from Rs.2.43 billion to Rs.2.73 billion.
As a result, the profit attributable to the owners or the ordinary shareholders of the Sathosa Motors
group rose from Rs.260.00 million to Rs.261.38 million during the year under review.
Despite the by now routine ad hoc nature of imposing taxes on the automobile sector and the fiercely
competitive market conditions, the Group recorded an outstanding financial performance supported
by a high level of strategic management expertise, which helped us achieve the ambitious goals we had
set for ourselves in the previous financial year. I would like to bring to your notice that Sathosa Motors is
highlightedasthehighestReturnonEarnings(ROE)generatingcompanyinthesectorbyanalysts.We
are in the leading position in the Light Commercial Vehicle segment, being the exclusive distributor of
Isuzu and Land Rover brands in Sri Lanka. Overall, despite severe pressure from local market conditions,
the macro economic climate proved to be reasonable during the period under review.
Economic Climate in Sri LankaIn Sri Lanka, the macro economic policies set in motion in 2014 resulted in low levels of inflation of
3.3% and an economic growth rate close to 7.8% as targeted in the Central Bank of Sri Lanka’s roadmap
for 2014. This was achieved amidst a global economy where the US showed signs of recovery and
other major economies such as Europe, Russia, China and Australia exhibited low moderate economic
climate. Sri Lanka experienced Foreign Direct Investments (FDIs) of over US $1 billion and the Colombo
Stock Exchange All Share Index rose from 5,913 points to 7,299 points, marking a growth of 23.4%. The
fiscal policy has targeted capital formation in both hard and soft infrastructure, while state investments
in road and transport, aviation, port, irrigation, telecommunication and knowledge continued. The Sri
Lankan Rupee has been through one of its least volatile phases, with monthly averages not exceeding
the Rs. 131 per USD mark in the first half of FY2014/15. As such, the Sri Lankan rupee remained stable
against the US Dollar with a marginal depreciation of 0.3 % by the end of 2014. During the year under
review, Sri Lanka’s higher expenditure on imports of motor vehicles for personal use was the main
contributor to the growth in consumer goods imports.
Automobile IndustryGlobal Trends
Analysts note that the world market for cars and other light vehicles will expand from the current rate
of 80 million units a year to well over 100 million by 2020, reflecting the enormous growth potential
of emerging economies. By present estimates, the global automotive industry is worth US $ 800
billion. Analysts forecast that the world market for cars and other light vehicles will expand from the
I would like to bring to your notice that Sathosa Motors is highlighted as the highest Return on Earnings (ROE) generating company in the sector by analysts. We are in the leading position in the Light Commercial Vehicle segment, being the exclusive distributor of Isuzu and Land Rover brands in Sri Lanka.

11

SATHOSA MOTORS PLC | Annual Report 2014/1512
current rate of 80 million units a year to well over 100 million by 2020. The global automotive industry
is currently witnessing a widespread adoption of advanced technologies to increase fuel efficiency,
reduce emission levels and to enhance the driving dynamics of the vehicle.
Local Trends
The number of new vehicles registered during 2014 increased by 31.5% to 429,556 following a decrease
of 18% in the previous year. The increment could be largely attributed to the favourable interest rates
on leasing facilities, the depreciation of the Japanese Yen against the Sri Lankan Rupee, the increased
importation of hybrid vehicles to the market and the increase in the registration of motor cycles. The
number of cars registered increased by 36.6% while the registration of three wheelers declined by 5.5%
during 2014.
Company Performance in 2014/15During the year, fluctuating tax increases had a severe negative impact on demand in the automobile
sector in the industry. Over the years, the organization has been traditionally dependent on revenue
from mid-range commercial vehicles. However, during the year under review, we witnessed larger
revenue contribution from two new main segments, the first being the Isuzu Bus segment and the
other, SUVs. It is also pertinent to note that Isuzu’s MU-X SUV is already performing well in Australia
andThailand.WesuccessfullylaunchedIsuzuSUVsinSriLankainOctober/November2014.Duringthe
year under review, we capitalized on the fluctuations of the Japanese Yen to enhance our profitability
through forward exchange contracts.
Future OutlookThe strong backing of Access Engineering, which has increased its ownership stake in the company to
over 84%, played a vital role in our strong performance. The all-new Land Rover ‘Discovery Sport’ has
been made available to the brand’s ever-growing customer base across the island and we believe this
model will become the industry leader in its class. Sathosa Motors PLC has a 50% stake in SML Frontier
AutomotivePvtLtd,whichwillenhanceourprofitabilityfurther.Weexpecttheupcomingfinancialyear
to be a definitive one for the Group as we position ourselves to become a leading luxury brand with a
new showroom at Colombo 7. Sathosa Motors PLC is looking to expand its business in partnership with
suchsuperluxuryautomobilebrandsaspartofitslongtermgrowthstrategy.Weremaincommitted
to consolidate our after sales and dealer network while investing in expanding our product range to
strengthen our market position and to offer local consumers wider choices across the pricing spectrum.
Chairman’s Review

13
AcknowledgementsI wish to extend my sincere thanks to my colleagues on the board for their continued support and also take this opportunity to thank the former Chairman Mr. Ajita de Zoysa, who is a veteran in the Sri Lankan automobile industry and who steered the Group astutely during his tenure. My appreciation also goes to our Managing Director, Deshamanya Tilak Dias Gunasekera, and to the management team and members of staff for their valuable contribution during the year. Finally, I would also like to thank our shareholders for placing their trust in the company.
Sumal PereraChairman
SATHOSA MOTORS PLC | Annual Report 2014/1514Managing Director Review
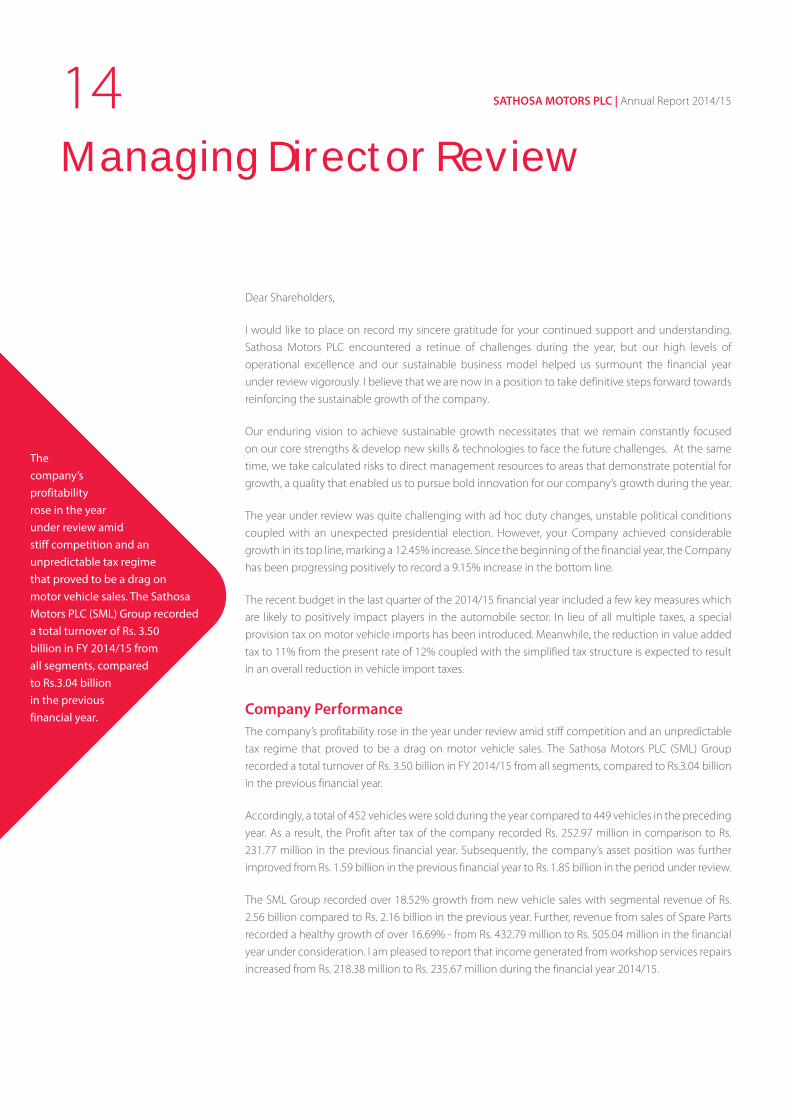
Dear Shareholders,
I would like to place on record my sincere gratitude for your continued support and understanding.
Sathosa Motors PLC encountered a retinue of challenges during the year, but our high levels of
operational excellence and our sustainable business model helped us surmount the financial year
under review vigorously. I believe that we are now in a position to take definitive steps forward towards
reinforcing the sustainable growth of the company.
Our enduring vision to achieve sustainable growth necessitates that we remain constantly focused
on our core strengths & develop new skills & technologies to face the future challenges. At the same
time, we take calculated risks to direct management resources to areas that demonstrate potential for
growth, a quality that enabled us to pursue bold innovation for our company’s growth during the year.
The year under review was quite challenging with ad hoc duty changes, unstable political conditions
coupled with an unexpected presidential election. However, your Company achieved considerable
growth in its top line, marking a 12.45% increase. Since the beginning of the financial year, the Company
has been progressing positively to record a 9.15% increase in the bottom line.
The recent budget in the last quarter of the 2014/15 financial year included a few key measures which
are likely to positively impact players in the automobile sector. In lieu of all multiple taxes, a special
provision tax on motor vehicle imports has been introduced. Meanwhile, the reduction in value added
tax to 11% from the present rate of 12% coupled with the simplified tax structure is expected to result
in an overall reduction in vehicle import taxes.
Company PerformanceThe company’s profitability rose in the year under review amid stiff competition and an unpredictable
tax regime that proved to be a drag on motor vehicle sales. The Sathosa Motors PLC (SML) Group
recorded a total turnover of Rs. 3.50 billion in FY 2014/15 from all segments, compared to Rs.3.04 billion
in the previous financial year.
Accordingly, a total of 452 vehicles were sold during the year compared to 449 vehicles in the preceding
year. As a result, the Profit after tax of the company recorded Rs. 252.97 million in comparison to Rs.
231.77 million in the previous financial year. Subsequently, the company’s asset position was further
improved from Rs. 1.59 billion in the previous financial year to Rs. 1.85 billion in the period under review.
The SML Group recorded over 18.52% growth from new vehicle sales with segmental revenue of Rs.
2.56 billion compared to Rs. 2.16 billion in the previous year. Further, revenue from sales of Spare Parts
recorded a healthy growth of over 16.69% - from Rs. 432.79 million to Rs. 505.04 million in the financial
year under consideration. I am pleased to report that income generated from workshop services repairs
increased from Rs. 218.38 million to Rs. 235.67 million during the financial year 2014/15.
The company’s profitability rose in the year under review amid stiff competition and an unpredictable tax regime that proved to be a drag on motor vehicle sales. The Sathosa Motors PLC (SML) Group recorded a total turnover of Rs. 3.50 billion in FY 2014/15 from all segments, compared to Rs.3.04 billion in the previous financial year.

15

SATHOSA MOTORS PLC | Annual Report 2014/1516
During the year, a number of steps were taken to improve Spare Parts sales as a result of lower price
demands from fleet-owning customers, who have proved to be loyal clients and the main contributors
to our sales growth. In due recognition of their loyalty and support, we offered discounted services,
sacrificing our profit margins in the Spare Parts segment sales to retain our loyal client base.
Although Isuzu has garnered a lion’s share of the Trucks segment in the country for years, we have
been facing a challenging period in Spare Parts sales, amidst growing spurious Spare Parts sellers. It is
also important to stress that currently there is no proper governance or tax policy implemented for the
segment by authorities.
During the year under review, we established a new workshop for Isuzu MU-X SUVs with an investment
of Rs. 30 Mn at Vauxhall Street, Colombo 02. Our subsidiary, SML Frontier Automotive (Pvt) Ltd, is in
the process of constructing a modern showroom at international standards at an upscale location in
Colombo 07. Also, a state-of-the-art workshop was established at Boralesgamuwa to offer repairs and
lubrication services for Land Rovers.
Despite severely competitive market conditions, our Isuzu truck range has been able to hold its
leadership position, evincing a higher demand despite competition from Japanese, Chinese and Indian
brands that are presently operating in the country. Our excellent performance during the year under
review was achieved as a result of maintaining a loyal client base along with new product launches,
including a 46-seater luxury bus that was launched during the second quarter of the financial year,
which witnessed record sales. Furthermore, as a result of the prudent financial management strategies
adopted by us in the year under review, our treasury department was able to post Interest Income of
Rs. 17.65 million.
The depreciation of the Japanese Yen against USD has benefited your Company in the exchange gains
during the year under review.
Future OutlookThe automobile sector has become an extremely challenging marketplace, but despite this we were
abletorecordexcellentprofitability.Webelievewewouldhaverecordedevenhigherrevenuesifnot
for ad hoc duty fluctuations, an unstable political climate and prevailing sluggish economic climate.
Maintaining adequate liquidity is essential to the implementation of forward-looking investment
aimed at enhancing product appeal along with development of next generation technologies and the
necessaryinfrastructure.Wewillcontinuetopursueimprovementsincapitalefficiencyandcashflow
of the company to deliver adequate returns for our shareholders. Our performance is indicative of our
ability to respond quickly to macro challenges and we will continue to seize emerging opportunities
as they unfold.
The Group leverages on its pillars of integrity, honesty, transparency, responsibility and ethical behaviour
in all its dealings and transactions. Our passion for delivering the highest levels of service quality to all
our stakeholders drives our growth.
Managing Director Review

17
AppreciationI take this opportunity to express my sincere appreciation to the Chairman, Board of Directors, the Audit
Committee, our trading partners, M/s ITOCHU Corporation & Isuzu Motors, the management team, and
all employees of Sathosa Motors for their tremendous support during a particularly challenging year. I
would also like to thank all our stakeholders, including our customers, auditors, banks, secretaries and
lawyers for their cooperation and support, as we forge ahead to lead Sri Lanka’s automobile industry
into the future.
Deshamanya Tilak Dias GunasekeraManaging Director

18Board of Directors
1
3
4
2
SATHOSA MOTORS PLC | Annual Report 2014/15

19
1. Mr. Sumal PereraChairman
2. Deshamanya Tilak Dias GunasekeraManaging Director
3. Mr. Shevantha MendisNon-Executive Director
4. Mr. Dharshana MunasingheNon-Executive Director
5. Mr. Joseph Christopher JoshuaNon-Executive Director
6. Mr. Rohana FernandoNon Executive Director
7. Mr. Ranjan John Suriyakumar GomezNon- Executive Director
8. Mr. M M Nelson De SilvaIndependent Non-Executive Director
9. Mr. Chiran WijesingheIndependent Non-Executive Director
5
6
9
8
7
SATHOSA MOTORS PLC | Annual Report 2014/1520
Mr. Sumal PereraChairman
Mr. Sumal Perera was appointed to the Board of Sathosa Motors PLC on 12th June 1998. He is the Founder Chairman
of the Access Group of Companies founded in 1989. He is a Fellow Member of the Chartered Institute of Management
Accountants – UK (FCMA).
Deshamanya Tilak Dias GunasekeraManaging Director
Mr. Gunasekera joined Sathosa Motors PLC as Senior Deputy General Manager (Marketing) in 2003. He was promoted to
the Deputy CEO position in 2005. In the year 2007 he was further promoted to the Board of Sathosa Motors PLC as the
Executive Director.
He counts over 30 years of experience in the fields of Marketing Management and Administrative Management in well
established Companies. He is a fellow of the Institute of Administrative Management, United Kingdom. He also holds
qualifications in Marketing. He has been the Chairman of Ceylon Motor Trading Association (CMTA), which is an umbrella
organization of Ceylon Chamber of Commerce (CCC) since 2010.
He is also a Director at SML Frontier Automotive (Pvt) Limited.
Mr. Shevantha MendisNon-Executive Director
Mr. Shevantha Mendis was appointed to the Board of Sathosa Motors PLC in April 2012. Mr. Mendis has been attached
to the Access Group since 1994 holding several positions over the years. He currently holds the position of Director
Business Development at Access Engineering PLC and is a Director of Access International (Pvt) Ltd and SML Frontier
Automotive (Pvt) Limited.
Mr. Dharshana MunasingheNon-Executive Director
Mr. Dharshana Munasinghe was appointed to the Board of Sathosa Motors PLC in April 2012. He has been attached to the
Access Group since 1996. Having held several positions in the Group, he now functions as Director – Business Development
at Access Engineering PLC and as a Director of Access International (Pvt) Ltd and SML Frontier Automotive (Pvt) Limited.
Mr. Joseph Christopher JoshuaNon-Executive Director
Mr. Christopher Joshua was appointed to the Board of Sathosa Motors PLC in April 2012. He is one of the Founder Directors
and Shareholders of Access Group of Companies and currently serves as the Managing Director of Access Engineering PLC.
He is also the Joint Managing Director of the Access Group of Companies. He was instrumental in heading some of the
most successful business units within the Access Group.
Board of Directors

21
Mr. Rohana FernandoNon Executive Director
Mr. Rohana Fernando joined the Board of Sathosa Motors PLC in September 2012. He is an Engineer by profession and has
been attached to the Access Group since 1998. He currently holds the position of Director / COO of Access Engineering PLC
and serves as a Director of Access International (Pvt) Ltd and SML Frontier Automotive (Pvt) Limited.
He is a Corporate Member of the Institution of Engineers, Sri Lanka (IESL) and has a BSc Degree in Civil Engineering from
the University of Peradeniya.
Mr. Ranjan John Suriyakumar GomezNon- Executive Director
Mr. Ranjan Gomez was appointed to the Board of Sathosa Motors PLC in April 2012. He is also one of the Founder Directors
and Shareholders of the Access Group of Companies and has functioned as the Joint Managing Director of the Access
Group and CEO of many businesses units within the Access Group.
Mr. M M Nelson De SilvaIndependent Non-Executive Director
Mr. Nelson De Silva who joined the Board of Sathosa Motors PLC on 11th February 2009, is an Associate Member of the
Institute of Chartered Accountants of Sri Lanka. Graduated with a B.Sc in Public Administration from Sri Jayawardenapura
University.
He serves as the Managing Director of Ned Management Consultants (Pvt) Ltd and he is the sole Proprietor of M M N De
Silva & Company.
He has been the Group Accountant of Tisara Group, Senior Accountant of John Keells Group, Finance Manager of Finlay
Chemicals & Dyes (Pvt) Ltd, Director of PE Management Consultants (Pvt) Ltd and Partner of HLB Edirisinghe & Company.
Mr. Chiran WijesingheIndependent Non-Executive Director
Mr.Wijesinghehasapproximately07yearsofexperienceinSeniorManagementpositionsindifferentorganizationsinSri
Lanka. Manager in Risk Advisory Services of KPMG Sri Lanka, Group Internal Auditor of Oman Hotels & Tourism Co. SAGO
(OHTC) managed by Aitken Spence Hotels (Pvt) Ltd.
Work Experience Current: Chief Risk Officer of Hirdaramani Group of Companies
Professional and Academic Qualifications
• Master of Business Administration (MBA) from the University of Southern Queensland (USQ)
• Associate Member of Institute of Chartered Accountants of Sri Lanka (ICASL)
• BSc. Business Administration (Special) – University of Sri Jayewardenepura
• Member of Institute of Internal Auditors (IIA) USA


Management Information
SATHOSA MOTORS PLC | Annual Report 2014/1524Management Discussion and Analysis
Sathosa Motors PLC is the franchise holder for Isuzu vehicles and spare parts manufactured by M/s Isuzu
Motors Ltd. Our Organization’s vision is to be the trusted leader in the Sri Lankan Automobile Industry
by ensuring that we deliver only the best quality to our valued customers.
Isuzu range of vehicles
• Double Cab Pickup Trucks
• Light, Medium & Heavy Duty Commercial Vehicles
• Luxury Passenger Coaches
• MU-X SUVs
• SpecialPurposeVehicles:FireTrucks,LoggingTrucks,DumpTrucks,Water&FuelBowsersand
various other types of vehicles required in building construction, distribution of goods etc.
HistoryA premier organization in Sri Lanka’s automobile sector, Sathosa Motors PLC’s humble beginning dates
backto1962,whenSriLanka’sIsuzuAgencywassecuredbytheCo-operativeWholesaleEstablishment
in 1962. The first agreement was signed between M/s Isuzu Motors Limited, Tokyo, Japan (Manufacturer);
M/sC Itoch&Co.Ltd., (Distributor);andtheCo-operativeWholesaleEstablishmentC.W.E. (Franchise
holder). Soon, with the liberalization of imports in 1978 and the open economic policy, Isuzu became
the most sought-after brand by fleet owners, the government sector and so on.
As a consequence of tremendous demand for Isuzu products in the Sri Lanka market, The Ministry of
TradeandCommerce(underwhosepurviewC.W.E.operated),decidedtoconverttheNewVehicles&
MachineryDepartmentasafully-ownedsubsidiarycompanyoftheC.W.Eandthusestablished‘Sathosa
Motors Limited’ on 1st January 1985, in order to provide more freedom to carry on efficient business
operations.
The company commenced operations with an issued capital of Rs 15,000,007 in 1985. In keeping with
government policy, the Company was people-ised on 26th August 1992 and 60% of issued capital
was acquired by M/s C Itoch & Co., Limited (ITOCHU Corporation) Tokyo, Japan, one of the largest
trading organizations in Japan. Of the remainder, 10% was gifted to employees and 30% was issued
to the general public. In order to comply with the new Companies Act No. 7 of 2007, the company
was re-registered as Sathosa Motors PLC. Soon after, Access Engineering Company Ltd (AEL), which
went public, acquired a major controlling stake in Sathosa Motors PLC (SML) on 29th February 2012.
Land Rover, the Sri Lankan military’s ‘vehicle of choice’ and a top European luxury brand in the country
received a new lease of life with the brand being exclusively distributed under SML Frontier Automotive
Pvt Ltd , in which Sathosa Motors PLC holds a 50% ownership.
Domestic Automobile MarketThe year 2014 was one of recovery for the domestic automobile sector - with motor vehicle registrations
recording a 31.5% increase over the preceding year to reach 429,556. In 2011, motor vehicle registration
reached 525,421, which is said to be the highest-ever in the sector’s history. Subsequently, 2012 and
2013 reflected a decline down to 397,295 and 326,651 respectively. Fortunately, in the financial year

25
under review, the recent budgetary measures which proposed lower taxes for specific categories of
motor vehicles has reversed the fortunes of Sri Lanka’s automobile sector, with rising vehicle registrations
putting the industry on a strong growth trajectory.
According to statistics, brand new four-wheel vehicles performed well in 2014, the numbers growing
to 45,112 in total, marking an increase by 9,048 vehicles or 25% over that of the previous year. Indian,
Korean and Chinese vehicles also recorded significant increases in vehicles volumes in 2014 in line with
growth over the last few years. The expenditure on vehicles imports in 2014 was US$897 million, which
reflects an increase of US$315 million or a 54% increase over the year 2013. The automobile industry
is currently witnessing a widespread adoption of advanced technologies to increase fuel efficiency,
reduce emission levels and enhance the performance dynamics of the vehicle.
Analysts project new vehicle registrations to grow at a Cumulative Annual Growth Rate (CAGR) of 6%
over the 2014-2016 period, resulting in the total vehicle numbers in the country surpassing 6.5 million,
led by simplified taxes and improved consumer confidence.
Operational ReviewDuring the year under review, a total of 452 vehicles were sold, compared to 449 vehicles in the previous
year. Isuzu heavy vehicles have helped drive Sri Lanka’s economic growth over years by facilitating the
mobility of people and goods for over a half-a-century. The brand enjoys over a market leadership of
35% due to high performance trucks repaying multi-fold. The company currently has two distributors
at Kandana and Vavuniya.
Spare parts dealerships were increased to 123 during the period from 78 in the previous year. The
objective is to increase dealerships to 175 in the upcoming financial year in tandem with growth in the
company’s capacity and financial strength. The company also has 2 mobile Lorries to cater to customer
demand, with 2 branches operating at Panchikawatta and Peliyagoda.
In an attempt to diversify the product portfolio to propel the company’s growth, a new workshop
for Isuzu MU-X SUVs with an investment of Rs. 30 Mn at Vauxhall Street, Colombo 02 was established.
SML Frontier Automotive (Pvt) Ltd, a subsidiary of SML laid the ground work to construct a modern
showroom at international standards at an upscale location in Colombo 07. Also, a state-of-the-art
workshop was established at Boralesgamuwa to offer repairs and lubrication services for Land Rovers.
The company introduced various dealer incentive schemes to motivate sales and will continue to focus
on expanding its ‘Supply Ratio’, which is the availability of spare parts for each dealer location in order to
secure more market share from the spare parts sales.
The company aims to expand its sales via expansion of its franchise holders in four major cities including
Ampara , Matara, Kandy and Kurunegala within the next two years. Plans have also been drawn up to
upgrade 10 to 25 franchise dealer points to 3S (Sales, Services, Spare parts) category in the coming year,
with dealerships already covering all provinces and districts in the country.

SATHOSA MOTORS PLC | Annual Report 2014/1526
Engaging Customers
As part of customer care and awareness raising programme, during the current year the company
continued the Service Clinic concept in the regions, where SML provides free service advice to fleet
owners. This process involves Japanese engineers from Isuzu, which allows local customers to gain a
high level of technical exposure regarding the maintenance of their Isuzu vehicles.
During the year, the SML team worked tirelessly to achieve excellence in customer satisfaction by
cultivating a dynamic and productive organizational culture with highly motivated staff. The focus on
providing the best quality vehicles at competitive and affordable prices was sustained throughout the
year, thereby generating the maximum benefit for all stakeholders of the company.
Participation at the World Grand Prix Isuzu Technical Competition
In order to offer more efficient services parallel with Japanese Isuzu technology, delegates including
SML Managing Director, Assistant General Manager - Spare Parts, and selected workshop staff members
tookpartintheWorldGrandPrixIsuzuTechnicalCompetition,heldduringtheyear.
Future Outlook
Given the market uncertainty, we continue to adopt a strategy of product diversification, targeting a
range of suitable market segments for expansion.
The luxury motor vehicle industry of Sri Lanka and for that matter, the entire automobile industry is
currently facing challenging times mainly due to the unstable political environment and the fluctuations
in the duty structure that exists for various vehicle product ranges.
The company is optimistic of a more favourable political environment after the general elections in
the new financial year which is hoped would pave the way for a more stable economy and political
environment in the country. The commencement of infrastructure development once more will
fuel the construction industry and in turn create more demand for vehicles. Future concessions and
measures adopted by the government to improve the agriculture sector are expected to drive the
demand for commercial vehicles.
IT ReviewDuring the financial year 2014/15, SML continued its focus on connecting and networking all Sathosa
Motors branches and offices, with main supporting systems functioning effectively to provide seamless
operationsacrosstheorganization.Withthis,alloperational/servicedepartmentswillbefullyintegrated
duringthenextfinancialyear.Wealsointendtorevampourcorporatewebsiteinthecomingyear.Our
IT staff alsounderwent aMicrosoftWindowsServerAdministrationTrainingprogrammeduring the
year.
HR ReviewEmployeeengagementisasalientpriorityatSML.Webelievethatemployeeengagementbringsout
the best of innovation, productivity and bottom line performance, while reducing costs related to
hiring and retention in highly competitive talent markets. Our group’s employment policy ensures that
we recruit the candidates best suited for the relevant positions. Our recruitment procedures are marked
by fair, objective and accepted evaluation methods.
Management Discussion and Analysis

27
Generating Employment Opportunities
Our employees are always made aware of the company’s shared vision, mission, objectives, policies,
procedures, rules, regulations and day to day business practices through various programmes and
initiatives. During the year under review, our group provided employment opportunities to 212
applicants compared to 202 in the previous financial year. Apart from the group, SML as a company has
created employment opportunities for 122 staff. There were no major large scale recruitments carried
outtoincreasethestaffduringthefinancialyear.Weintendtoincreaseourstaffstrengthby15%during
the coming financial year.
The majority of our staff is in the permanent cadre and over 62% are in the age group of 30-50 years,
whilst 20 % are below 30 years. Staff members above 50 years account for about 18%. Out of the total
staff strength, 76.2% are males and 23.8% are female employees, whilst nearly 15.5% are Executives and
79.5% among them are Non-Executives. The Casual Staff only accounts for 5%.
Training and development
During the 2014/15 financial year, selected staff members participated in foreign training programmes
and annual training programmes conducted by Isuzu in Japan and Thailand. All our employees are
encouraged to actively participate in idea generation and problem solving in the organization.
Unique Corporate Culture
SML has engendered a unique corporate culture, which encourages employees and management
to work together towards achieving corporate goals. Employees are continually encouraged to
pursue professional development via various training and career guidance programmes. During the
year under review, we carried out 3 Sales Effectiveness Training programmes in which a total of 48
members participated. Further, a Secretarial Excellence Training program was also conducted in which
2 employees participated, whilst another employee was given an opportunity to follow a Sales Territory
Training programme. Further, executive and non-executive staff members were given an opportunity to
participate in a training programme entitled ‘Be a Brand’, which was conducted by famous Motivational
Speaker and Trainer Mr. Mohan Palliyaguru, the founder of the ‘Turning Point’ programme series.
Employee Welfare
Wecontinuedtoenhanceourhumancapitalbase,theircapacityandpotentialwithperformancebased
motivational compensation rewards such as a bonus scheme that pays two months’ salary equivalent
to each employee on April and December each year, and a profit bonus of two months during the
month of August for the year under review. Our staff and their family members took part at the social
events including the Christmas Carnival, Six a Side Cricket Tournament, Netball Tournament and the
Art Competition organized by our parent company Access Engineering PLC (AEL). The annual staff and
their families ‘Day-Out’ was a trip to Anantaya Resort & Spa at Chilaw.
Corporate Social Responsibility ReportEducation and Learning
In keeping with our Corporate Social Responsibility (CSR) vision, SML continued its in-house scholarship
scheme for children of employees, who qualify for Advanced Level education under ‘Sisu Nena’ scheme

SATHOSA MOTORS PLC | Annual Report 2014/1528
and for students who qualify for university education under ‘Vishwa Pravesha’ scheme. Our employees
and their family members are also included in a comprehensive insurance scheme.
During the year, we continued to train personnel from the Defence Forces, free of charge, at our
workshops, to enhance their skills and capabilities.
Weabsorbednearly15 individualsunder the‘ApprenticeTrainingProgramme’ intoourorganization
from various educational and vocational training institutes partnered with us, including International
College of Business and Technology (ICBT), German Technical Training Institute (GTTI) and National
Apprentice and Industrial Training Authority (NAITA).
Community Welfare
During the year under review, we took steps to distribute dry rations pack for employees in April, for the
Sinhala and Tamil New year.
Extending beyond the company, we participated at a blood donation campaign organized by our
parent company, Access Engineering PLC (AEL), which was held at the Foundation Institute of Colombo.
Wealsoextendeddonationstoreligiousorganizations,GangaramayaTemple’s‘NawamPerahera’,the
armed forces and government entities, to support their welfare activities.
The Company sponsored the refurbishment of RMV reception during the year under review.
All night pirith chanting ceremony was held at the company premises during February 2015.
Financial ReviewGross Revenue
Sathosa Motors PLC’s group revenue rose by over 15.13% during the Financial Year 2014/15 from Rs.3.04
billion in the previous year to Rs.3.50 billion, while the company revenue rose by 12.34% from Rs.2.43
billion to Rs.2.73 billion.
The group’s other income also significantly surged from Rs. 25.74 million to Rs. 42.66 million recording
over 65.73% increase during the financial year 2014/15.
Profit After Tax
During the financial year 2014/15 Sathosa Motors PLC group recorded a 6.39% drop in group Profit After
Tax (PAT) amounting to Rs. 269.80 million compared to Rs. 288.23 million in the previous year. However,
the company alone recorded a 9.14% increase in PAT from Rs. 231.77 million to Rs. 252.96 million in
the year under review. The group profit attributable to Non-Controlling interest dipped from Rs. 28.23
million in the previous year to Rs. 8.42 million during the financial year 2014/15 due to ownership
structural changes that took place.
Profit Before Tax
There was a slight drop in Sathosa Motors PLC group Profit Before Tax (PBT) by 7.92% from Rs. 415.07
million in the previous year to Rs. 382.17 million in the year under review. The company’s PBT rose by
Management Discussion and Analysis

29
8.47% to Rs. 349.65 million from Rs. 322.32 million in the previous year. As a result, the profit attributable
to the owners or the ordinary shareholders of the Sathosa Motors group rose from Rs. 260.00 million to
Rs. 261.38 million during the year under review.
Sales Earnings
During the financial year 2014/15 Group’s Spare Parts sales rose from Rs. 432.79 million to Rs. 505.04
million with over a 16.69% rise and the Group’s new vehicle sales topped Rs. 2.56 billion compared to a
Rs.2.16billionyearago.Group’sWorkshoprepairscontributedRs.235.67milliontotheincomeduring
the year compared to Rs.218.38 million in the previous year.
Cost of Sales and Gross Profit Margins
The cost of sales of the group rose to Rs. 2.65 billion during the year under review against Rs. 2.19 billion
in the previous year whilst the gross profit marginally increased from Rs. 846.51 million to Rs. 848.88
million in the financial year 2014/15.
Assets
During the year, the group’s asset value increased from Rs. 2.01 billion to Rs. 2.48 billion, rising by 23.38%.
The company’s asset value increased from Rs. 1.59 billion to Rs. 1.85 billion, which is an increase of over
16.35%. The Stated Capital of the group stood at Rs. 115.92 million, whilst retained earnings rose from
Rs. 884.20 million to Rs. 1,115.04 million in the financial year under consideration.
Administration & Other Expenses
During the financial year our group administration expenses rose 22.46% from Rs. 314.02 million to Rs.
384.54 million. However, Selling and Distribution expenses of the group slightly dipped by 6.01% to Rs.
105.72 million compared to Rs. 112.49 million in the previous year. Consequently, results from operating
activities of the group also dipped by over 5.51% from Rs. 424.27 million in the previous year to Rs.
400.88 million in the financial year 2014/15.
Meanwhile, the company’s earnings from operating activities rose from Rs. 329.66 million in the previous
year to Rs. 349.66 million in the year under review.
Our group’s finance cost doubled, increasing by over 103.15% from Rs. 9.21 million in the previous
financial year to Rs. 18.71 million in the year under review. This was mainly because of an Import Loan
and Overdraft Interest that amounted to over Rs. 18.69 million.
Income Tax Expenses
Our group Income Tax expenses were reduced by 11.41% to Rs. 112.36 million compared to Rs. 126.83
million in the preceding year. However, the company’s Income Tax expenses rose by 6.76% from Rs.
90.55 million to Rs. 96.68 million during the year under review.
Earning per Share
Sathosa Motors PLC has 6,033,622 (Numbers) ordinary voting shares in issue and accordingly group
Earnings per Share (EPS) increased from Rs. 43.09 to Rs. 43.32 during the year under review. The
company’s EPS increased from Rs. 38.41 to Rs. 41.93.
SATHOSA MOTORS PLC | Annual Report 2014/1530Corporate Governance
IntroductionCorporate Governance deals with the role of the Board of Directors, the framework of internal controls
and the manner in which Companies are led and managed. The Board is committed to reviewing and
updating the Company’s corporate governance structure, taking into consideration current market
practice and the best practice guidelines issued by the Institute of Chartered Accountants of Sri Lanka.
The following sections explain how the Company has applied these principles.
Board of DirectorsThe Board of Directors is responsible for the corporate governance of the Company. The main function
of the Board is to oversee the business and the affairs of the Company. It is also responsible for the
formulation of strategic objectives, policy framework, the approval of annual budgets (including major
capital expenditure), regular reviews of financial performance compared to budgets, the appointment
and evaluation of the performance of the Executive Director, and the periodic and timely reporting to
shareholders.
It also has the task of ensuring that the Senior Management team has the necessary skills and experience
to perform the functions effectively in the best interest of the company and that there are sufficient
parameters in place for monitoring the performance of the management.
The Board comprises of Nine Directors including the Chairman. All the Directors are non-executive
DirectorsexcepttheChairmanandtheManagingDirector.Whendecisionshavetobetakenonurgent
matters, Board decisions are taken by circulation.
TheBoardhasdeterminedthatMr.MMNdeSilvaandMr.ChiranWijesingheareindependentasper
the criteria set out in the Listing Rules of the Colombo Stock Exchange, and the said Directors have
submitted signed declarations in this regard.
Board MeetingsThe Board has met on 4 occasions during the last financial year. All directors receive a comprehensive
package of information prior to each Board Meeting thus ensuring that they are well informed in
advance.
PWCorporate Secretarial (Pvt) Ltd,who act as Secretaries to the Company, are qualified to act as
Secretaries as per the provisions of the Companies Act No.7 of 2007. Directors have access to the advice
and services of the Company Secretaries, who are responsible to the Board for ensuring that Company
Secretarial procedures are followed and that applicable rules and regulations are complied with.
Audit CommitteeThe Audit Committee consists of two non-executive Directors, one of whom is independent. The
Audit Committee is chaired by Mr. M M N de Silva who is a Chartered Accountant. There were 4 Audit
Committee meetings during the year.
Mr.ChiranWijesinghewasappointedtotheAuditCommitteeon15thJuly2015.
The Managing Director and the Head of Finance attend meetings of the Audit Committee by invitation.
31
Remuneration CommitteeThe Remuneration Committee consists of two non-executive Directors, one of whom is independent.
Mr. A de Zoysa served as the Chairman of the Remuneration Committee until 31st March 2015.
Remuneration PolicyWiththeprimaryobjectiveoftheGroup’sremunerationpolicybeingeffectiveenoughtoattractand
retain the best human capital to sustain operations while rewarding performance, the Remuneration
Committee is tasked with recommending the remuneration payable to the Chairman and Managing
Director of the Company and/or equivalent position thereof. This recommendation is made to the
Board, which is responsible for the final determination upon consideration of such recommendations.
Refer Note 13 to the Financial Statements for a disclosure of the aggregate remuneration paid to the
Directors.
Financial Disclosures and TransparencyThe Company’s financial statements are prepared in accordance with the Sri Lanka Accounting
Standards IFRS guidelines and Companies Act, No. 07 of 2007. The financial statements are published
quarterly and annually on time in compliance with the disclosure requirements of the Colombo Stock
Exchange.
The Statement of Directors Responsibilities for the Financial Statements is given on page 29
of this Report.
Internal ControlsThe Board acknowledges overall responsibility and ensures that a sound internal control system is
maintained to safeguard shareholders’ investments and company assets.
Going ConcernThe Board is satisfied that the Company has adequate resources to continue in business for the
foreseeable future. For this reason it continues to adopt the going concern basis when preparing a
presenting financial statements.
By Order of the Board
Sathosa Motors PLC
Deshamanya Tilak Dias GunasekeraManaging Director
15th July 2015
SATHOSA MOTORS PLC | Annual Report 2014/1532Risk Management Review
The Risk Management Review aims to provide an inclusive view of the Risk Management Systems,
procedures and protocols that operate throughout the group. The Risk Management Review also seeks
to provide assurance that activities undertaken by the business contributes towards an organization
which constantly works towards the better understanding and efficient mitigation of various risk factors
that may affect the group.
SML group defines the pivotal area of Risk Management as the organized application of
management Policies, procedures and practices for the establishment of relevant context,
identification,analysis,mitigation,monitoringandtherebyandcommunicationofallrisks.While
the Group’s Risk Management framework is efficiently incorporated into the planning process,
itself focuses on the effective achievement of objectives through mitigation, monitoring and
therebyandcommunicationofallrisks.Whilethegroup’sriskManagementframeworkisefficiently
incorporated into the planning process, the planning process itself focuses on the effective
achievement of objectives through mitigation of relevant and related risks. Through a dynamic
process, risks are identified and evaluated at appropriate levels throughout the parent company
and the subsidiary . This process is regularly reviewed by the Management Committee as a part of
the group’s organizational and operational approach to Risk Management.
The group’s Risk Management Process ensures comprehensive identification and understanding of the
risks, and enables the design and implementation of an effective plan to prevent losses or minimize the
impact of any loss in the event that it occurs. The timely recognition and appropriate handling of these
operational threats is incorporated into the group’s Risk Management process.
Substantial strategic controls of operational risks which require efficient management is enabled
through policies and procedures which are covered by the group’s internal audit process. This
includes the strict financial controls, and processes and systems which focus on monitoring
and reporting matters related to the continued effectiveness of the system of internal controls.
Having an accurate understanding of all possible risks enables the group to mitigate risks by
implementation of timely decisions.
In addition to the above the group’s Risk Management process would cover curbing the loss of
valuable resources including time, assets, income, property and people, protecting the reputation
and public image of the organization, preventing or reducing legal liabilities and enhancing the
Company’s smooth operations.
SML considers Risk Management process within the Company as an integral part of good management
practice which makes it an intimate part of its business planning and continuity.
33
The principal risks associated with the Group’s activities and their mitigation strategies are as follows.
Risk Factor Risk Mitigating Strategies
Credit Risk
This refers to risk of financial losses arising due
to the unwillingness or inability of counter-
parties to meet their financial or contralactual
obligations in time and in full.
The group has introduced different discount slabs
for it’s dealers who settle dues at different Intervals.
The group has introduced different targets for
different customers. If the set targets are exceeded
then based on same the dealers are rewarded.
The group’s Finance and Sales divisions closely
monitor credit sales to ensure repayment on due
dates and tie future sales based on outstanding
value and customer performance.
Bank guarantees are obtained from dealers who
purchase on credit terms.
The group conduct Credit Risk Management
meetings every month in order to review the
credit policies and adherence to them.
Credit ceilings are introduced to dealers who
purchase on credit terms.
Discounts are offered to dealers having carefully
evaluated the performance during a particular
period.

SATHOSA MOTORS PLC | Annual Report 2014/1534
Risk Factor Risk Mitigating Strategies
Human Capital and Labour Risk
This is associated with losing experienced
employees and experiencing an environment of
unpleasant labour relations.
The group use a series of strategies in motivating,
developing and retaining it’s human capital.
The group has a continuous provision for a
comprehensive career development program
for its staff, which focuses on helping employees
to achieve their optimum potential and thereby
improve job performance and satisfaction.
Wherebytechnical staff is sent to IsuzuJapanon
training and to face the technical competitions
organized by Isuzu Japan.
Group strives to maintain healthy relationships
with all employees through regular dialogues
and discussions. The Company also ensures
compliance with all regulatory requirements with
regard to benefits applicable to employees.
SML provides attractive financial and performance
based incentives.
The Group carefully monitors that all decisions
taken with respect to employees are within the
purview of the “Shop and Office Employees Act”.
Information Technology Risk
IT Risk is the risk associated with computer
Security, hardware, software and other
information technology systems failing and
causing disruption to business operations.
A well designed and secured Information
Technology security infrastructure has been
implemented throughout the organization. The
security infrastructure includes: recovery strategies,
data back –ups stored at off- site locations, virus
scanners, proxy servers. Compliance of security
infrastructure is regularly monitored.
The company carries out regular meetings with
the IT service provider to identify the requirement
to upgrade the present system.
Risk Management Review

35
Risk Factor Risk Mitigating Strategies
Regulatory and Compliance Risk
This risk is associated with changes in
Government policies, laws, regulations and
statutes. Compliance Risk relates to a company
being able to comply with all the laws,
regulations and statutes applicable to a country.
Both Regulatory and Compliance Risk factors
can affect the business activities of the Company.
The Company constantly keeps abreast of changes
to the Regulatory framework to mitigate the risk
associated therein.
Competitive Risk
This relates to customers will buy competitor
products due to variances in the product
offering. The management maintains a good
relationship with it’s customers.
Availability of non genuine spare parts in the
market where prices are very low.
The group offers free service clinics in different
locations with the presence of Japanese engineers
and offering a warranty period , free of charge
services during the warranty period
Our dedicated sales team explains to the customers
the advantage of using genuine spare parts.
Wehavea24houroncallmobileclinicattending
to break downs at a request of a customer.Risk of Environmental issues
Refers to environmental issues which can take
place due to disposal of solid waste.
The group releases waste water after purifying in
3 under ground treatment plants. Purified water is
released to the Municipal Council Storage System.Depreciation of the Rupee The adverse impact through depreciation of the
Rupee against the other currencies is mitigated
by pre agreeing upon the rate with the Bank. The
main currencies through which the company
transacts are THB, USD and JPY.
The subsidiary transacts through GBP. Sales takes
place on indenting basis and through TT’s.Interest Rate Fluctuations The adverse impact is mitigated by pre agreed
rates entered into through with the Banks. All
such transactions are backed by offer letters.
Such transactions are processed after obtaining
the approval of the Managing Director. The
transactions are under direct purview of the
Managing Director. All negotiations are channeled
through the Managing Director who directly
supervises the financing of the company, s
requirements.


Financial Information

SATHOSA MOTORS PLC | Annual Report 2014/1538Annual Report of the Board of Directors on the Affairs of the CompanyThe Directors of Sathosa Motors PLC have pleasure in presenting
their Annual Report together with the Audited Financial Statements
of the Company for the year ended 31st March 2015.
This Report contains the information required in terms of the
Companies Act, No. 7 of 2007, the Listing Rules of the Colombo Stock
Exchange and guided by the recommended best practices.
GeneralSathosa Motors PLC is a public limited liability Company which was
incorporated under the Companies Ordinance (Cap.145) as a public
limited liability company on 11th March 1982 and re-registered as
per the Companies Act, No.7 of 2007 on 13th December 2007 with
PQ 105 as the new number assigned to the Company.
Principal activities of the Company and review of performance during the yearThe Company’s principal activity is the import and sale of Motor
Vehicles and spare parts together with the repair and maintenance
of such Motor Vehicles.
The Company made an investment of Rs.65mn constituting 50% of
the shares in issue of a Company named SML Frontier Automotive
(Pvt) Ltd for the purpose of managing the Land Rover and Range
Rover Agency in Sri Lanka.
A review of the business of the Company, its performance during the
year and its future prospects are contained in the Chairman’s Review,
which forms an integral part of this Report.
This Report and the Financial Statements, therefore reflect the state
of affairs of the Company.
Financial StatementsThe complete Financial Statements of the Company, prepared in line
with applicable accounting standards and regulatory requirements,
inclusive of specific disclosures, duly signed by two Directors on
behalf of the Board of Directors and the Auditors are given on pages
41 to 88.
Property, Plant & EquipmentThe Company expenditure on the acquisition of property, plant
& equipment during the year amounted to Rs. 58.49 Mn and
information relating to movements in fixed assets is given in Note
16.2 of the accounts.
InvestmentsDetails of the Company’s quoted and unquoted investments as at
31st March 2015 are given in Note 38.1 to the Financial Statements
on pages 81 to 83.
ReservesThe reserves of the Company with the movements during the year
are explained under the “Statement of Changes In Equity.”
Accounting PoliciesThe Financial Statements of the Company have been prepared in
accordance with the revised Sri Lanka Financial Reporting Standards
(SLFRS / LKAS) and the policies adopted thereof are given on pages
47 to 59. Figures pertaining to the previous periods have been re-
stated where necessary to conform to the presentation for the year
under review.
Interests RegisterThe Company maintains an Interests Register in terms of the
Companies Act No.7 of 2007, which is deemed to form part and
parcel of this Annual Report and available for inspection upon
request.
All related party transactions, which encompasses the transactions
of Directors who were directly or indirectly interested in a contract or
a related party transaction with the Company during the accounting
period, are recorded in the Interests Register, in due compliance
with the applicable rules and regulations of the relevant Regulatory
Authorities.
The relevant interests of Directors in the shares of the Company as at
31st March 2015 as recorded in the Interests Register are given in this
report under the caption of “Directors’ Shareholding”.
DirectorsThe names of the Directors who held office as at the end of the
accounting period are given below, with their brief profiles appearing
on page 20.
Executive DirectorsMr. S J S Perera Managing Director – Appointed
Chairman w.e.f. 1st April 2015
Deshamanya Tilak Dias Gunasekera Executive Director – Appointed
Managing Director w.e.f. 1st April
2015
39
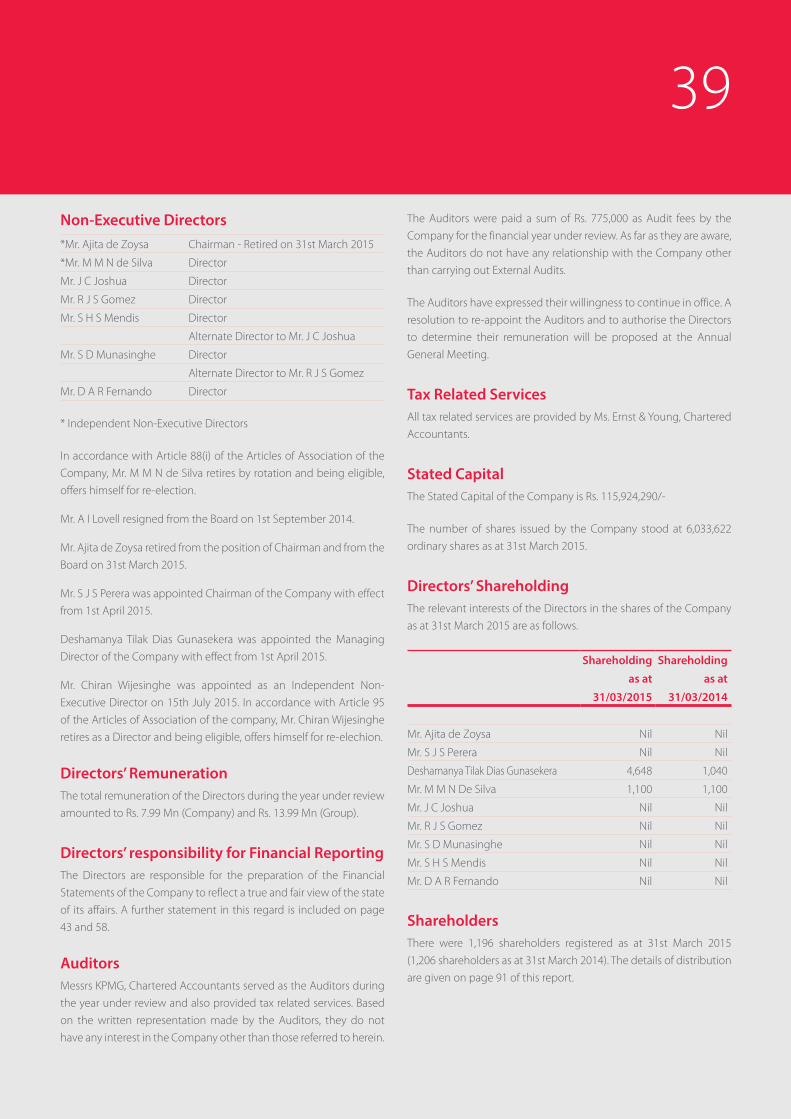
Non-Executive Directors*Mr. Ajita de Zoysa Chairman - Retired on 31st March 2015
*Mr. M M N de Silva Director
Mr. J C Joshua Director
Mr. R J S Gomez Director
Mr. S H S Mendis Director
Alternate Director to Mr. J C Joshua
Mr. S D Munasinghe Director
Alternate Director to Mr. R J S Gomez
Mr. D A R Fernando Director
* Independent Non-Executive Directors
In accordance with Article 88(i) of the Articles of Association of the
Company, Mr. M M N de Silva retires by rotation and being eligible,
offers himself for re-election.
Mr. A I Lovell resigned from the Board on 1st September 2014.
Mr. Ajita de Zoysa retired from the position of Chairman and from the
Board on 31st March 2015.
Mr. S J S Perera was appointed Chairman of the Company with effect
from 1st April 2015.
Deshamanya Tilak Dias Gunasekera was appointed the Managing
Director of the Company with effect from 1st April 2015.
Mr. Chiran Wijesinghe was appointed as an Independent Non-
Executive Director on 15th July 2015. In accordance with Article 95
oftheArticlesofAssociationofthecompany,Mr.ChiranWijesinghe
retires as a Director and being eligible, offers himself for re-elechion.
Directors’ RemunerationThe total remuneration of the Directors during the year under review
amounted to Rs. 7.99 Mn (Company) and Rs. 13.99 Mn (Group).
Directors’ responsibility for Financial ReportingThe Directors are responsible for the preparation of the Financial
Statements of the Company to reflect a true and fair view of the state
of its affairs. A further statement in this regard is included on page
43 and 58.
AuditorsMessrs KPMG, Chartered Accountants served as the Auditors during
the year under review and also provided tax related services. Based
on the written representation made by the Auditors, they do not
have any interest in the Company other than those referred to herein.
The Auditors were paid a sum of Rs. 775,000 as Audit fees by the
Company for the financial year under review. As far as they are aware,
the Auditors do not have any relationship with the Company other
than carrying out External Audits.
The Auditors have expressed their willingness to continue in office. A
resolution to re-appoint the Auditors and to authorise the Directors
to determine their remuneration will be proposed at the Annual
General Meeting.
Tax Related ServicesAll tax related services are provided by Ms. Ernst & Young, Chartered
Accountants.
Stated CapitalThe Stated Capital of the Company is Rs. 115,924,290/-
The number of shares issued by the Company stood at 6,033,622
ordinary shares as at 31st March 2015.
Directors’ ShareholdingThe relevant interests of the Directors in the shares of the Company
as at 31st March 2015 are as follows.
Shareholding Shareholding
as at as at
31/03/2015 31/03/2014
Mr. Ajita de Zoysa Nil Nil
Mr. S J S Perera Nil Nil
Deshamanya Tilak Dias Gunasekera 4,648 1,040
Mr. M M N De Silva 1,100 1,100
Mr. J C Joshua Nil Nil
Mr. R J S Gomez Nil Nil
Mr. S D Munasinghe Nil Nil
Mr. S H S Mendis Nil Nil
Mr. D A R Fernando Nil Nil
ShareholdersThere were 1,196 shareholders registered as at 31st March 2015
(1,206 shareholders as at 31st March 2014). The details of distribution
are given on page 91 of this report.

SATHOSA MOTORS PLC | Annual Report 2014/1540
Major Shareholders, Distribution Schedule and other informationInformation on the distribution of shareholding, analysis of
shareholders, market values per share, earnings, dividends, net
assets per share, the twenty largest shareholders of the Company,
percentage of shares held by the public as per the Listing Rules
of the Colombo Stock Exchange are given on page 91 under the
caption “Information to Investors”.
DonationsThe Company did not make any donations during the year under
review and the previous year.
DividendThe Company declared a final dividend of Rs. 7/- per share amounting
to Rs. 42,235,354/-, which will be paid on 05th August 2015.
Statutory PaymentsThe Directors confirm that, to the best of their knowledge, all taxes,
duties and levies payable by the Company, all contributions, levies
and taxes payable on behalf of and in respect of the employees of
the Company and all other known statutory dues as were due and
payable by the Company as at the Balance Sheet date have been
paid or, where relevant provided for.
Contingent LiabilitiesThere were no material Contingent Liabilities as at the Balance Sheet
date, except as disclosed in Note No. 32 to the Financial Statement
on page 74.
Events occurring after the Reporting PeriodNo events have occurred since the balance sheet date which would
require adjustment to, or disclosure in the Financial Statements, other
than what is disclosed in Note No. 33 to the Financial Statements on
page 75.
Corporate GovernanceThe Board of Directors are responsible for the governance of
the Company. The Board has placed considerable emphasis on
developing rules, structures and processes to ensure integrity
and transparency in all the dealings of the Company and its best
effort in achieving performance and quality profits, adopting good
governance in managing the affairs of the Company. The Directors
confirm that the Company is in compliance with the Rules on
Corporate Governance contained in the Listing Rules of the Colombo
Stock Exchange.
An Audit Committee and a Remuneration Committee function as
Sub-Committees of the Board and the members of these Committees
posses the requisite qualifications and experience. The composition
of the said Committees are as follows;
Audit CommitteeMr. M M N de Silva - Chairman
Mr. J C Joshua
Mr.ChiranWijesnghe-appointedon15thJuly2015
Remuneration CommitteeMr. A de Zoysa - Chairman - resigned on 31st March 2015
Mr. M M N de Silva
Mr. A I Lovell - resigned on 1st September 2014
Going ConcernThe Board of Directors is satisfied that the Company has adequate
resources to continue its operations in the foreseeable future.
Accordingly, the Financial Statements are prepared based on the
going concern concept.
Annual General MeetingThe Notice of the Thirty First (31st) Annual General Meeting appears
on page 94.
This Annual Report is signed for and on behalf of the Board of
Directors by
S J S Perera Deshamanya Tilak Dias GunasekeraChairman Managing Director
P W Corporate Secretarial (Pvt) LtdSecretaries
15th July 2015
Colombo
Annual Report of the Board of Directors on the Affairs of the Company

41Independent Auditors’ Report
To the Shareholders of SATHOSA MOTORS PLCReport on the Financial Statements
WehaveauditedtheaccompanyingfinancialstatementsofSathosa
Motors PLC, (“the Company”), and the consolidated financial
statements of the Company and its Subsidiary (“the Group”), which
comprise the statement of financial position as at March 31, 2015, and
the statements of profit or loss and other comprehensive income,
changes in equity and, cash flows for the year then ended, and a
summary of significant accounting policies and other explanatory
information set out on pages 42 to 88 of the annual report.
Board’s Responsibility for the Financial Statements
The Board of Directors (“Board”) is responsible for the preparation of
these financial statements that give a true and fair view in accordance
with Sri Lanka Accounting Standards, and for such internal control as
Board determines is necessary to enable the preparation of financial
statements that are free from material misstatement, whether due
to fraud or error.
Auditors’ Responsibility
Our responsibility is to express an opinion on these financial
statements based on our audit. We conducted our audit in
accordance with Sri Lanka Auditing Standards. Those standards
require that we comply with ethical requirements and plan and
perform the audit to obtain reasonable assurance about whether
the financial statements are free from material misstatement.
An audit involves performing procedures to obtain audit evidence
about the amounts and disclosures in the financial statements. The
procedures selected depend on the auditors’ judgment, including
the assessment of the risks of material misstatement of the financial
statements, whether due to fraud or error. In making those risk
assessments, the auditor considers internal control relevant to the
entity’s preparation of the financial statements that give a true and
fair view in order to design audit procedures that are appropriate in
the circumstances, but not for the purpose of expressing an opinion
on the effectiveness of the entity’s internal control. An audit also
includes evaluating the appropriateness of accounting policies used
and the reasonableness of accounting estimates made by Board, as
well as evaluating the overall presentation of the financial statements.
Webelieve that theaudit evidencewehaveobtained is sufficient
and appropriate to provide a basis for our audit opinion.
Opinion
In our opinion, the consolidated financial statements give a true and
fair view of the financial position of the Group as at March 31, 2015,
and of its financial performance and cash flows for the year then
ended in accordance with Sri Lanka Accounting Standards.
Report on Other Legal and Regulatory Requirements
As required by section 163 (2) of the Companies Act No. 07 of 2007,
we state the following:
a) The basis of opinion and scope and limitations of the audit
are as stated above.
b) In our opinion:
- Wehaveobtainedalltheinformationandexplanations
that were required for the audit and, as far as appears
from our examination, proper accounting records have
been kept by the Company,
- The financial statements of the Company, give a true and
fair view of its financial position as at March 31, 2015, and
of its financial performance and cash flows for the year
then ended in accordance with Sri Lanka Accounting
Standards.
- The financial statements of the Company, and the Group
comply with the requirements of sections 151 and 153 of
the Companies Act No. 7 of 2007.
CHARTERED ACCOUNTANTSColombo
15th July 2015

SATHOSA MOTORS PLC | Annual Report 2014/1542Statement of Profit or Loss and Other Comprehensive Income
Group Company
For the year ended 31 March, 2015 2014 2015 2014
Note Rs. Rs. Rs. Rs.
Restated
Revenue 9 3,502,513,626 3,040,851,595 2,737,582,357 2,434,315,262
Cost of Sales (2,653,631,498) (2,194,346,263) (2,163,156,898) (1,910,733,894)
Gross Profit 848,882,128 846,505,332 574,425,459 523,581,368
Other Income 10 42,667,566 25,740,765 38,997,239 18,974,257
Administrative Expenses (384,544,473) (314,026,523) (218,073,145) (182,717,833)
Selling and Distribution Expenses (105,719,627) (112,496,745) (45,680,899) (30,172,956)
Other Operating Expenses 11 (403,493) (21,442,877) - -
Results from Operating Activities 400,882,101 424,279,952 349,668,654 329,664,836
Finance Cost 12 (18,710,118) (9,213,012) (16,367) (7,337,648)
Profit before Tax 13 382,171,983 415,066,940 349,652,287 322,327,188
Income Tax Expense 14 (112,367,176) (126,833,983) (96,684,257) (90,556,045)
Profit for the Year 269,804,807 288,232,957 252,968,030 231,771,143
Other Comprehensive Income
Actuarial Losses on Employee Benefits (633,424) (738,676) (434,885) (738,676)
Tax on Other Comprehensive Income 177,359 206,829 121,768 206,829
Other Comprehensive Income for the Year, Net of Tax (456,065) (531,847) (313,117) (531,847)
Total Comprehensive Income for the Year 269,348,742 287,701,110 252,654,913 231,239,296
Profit attributable to:
Owners of the Company 261,386,419 260,002,050 252,968,030 231,771,143
Non-Controlling Interest 8,418,388 28,230,907 - -
Profit for the Year 269,804,807 288,232,957 252,968,030 231,771,143
Total Comprehensive Income attributable to;
Owners of the Company 261,001,828 259,470,203 252,654,913 231,239,296
Non-Controlling Interest 8,346,914 28,230,907 - -
Total Comprehensive Income for the Year 269,348,742 287,701,110 252,654,913 231,239,296
Earnings Per Share 15.1 43.32 43.09 41.93 38.41
Figures in brackets indicate deductions.
The accounting policies and notes from 47 to 88 form an integral part of these financial statements.

43Statement of Financial Position
Group Company
As at 31 March, 2015 2014 2015 2014
Note Rs. Rs. Rs. Rs.
Restated
ASSETSNon - Current AssetsProperty, Plant and Equipment 16 332,489,269 173,264,434 112,640,230 68,950,341Intangible Assets 17 4,495,734 5,736,942 - -Prepaid Lease Payments 18 5,438,809 5,515,076 5,438,809 5,515,076Investment Property 19 24,191,513 24,191,513 24,191,513 24,191,513Investment in Subsidiary Company 20 - - 65,000,020 65,000,000Investment in Debentures 84,113,507 38,485,323 84,113,507 38,485,323Total Non Current Assets 450,728,832 247,193,288 291,384,079 202,142,253
Current AssetsInventories 21 1,027,412,149 746,821,801 848,623,101 622,399,932Trade and Other Receivables 22 847,395,487 968,476,597 627,649,379 742,338,242Amounts due from Related Parties 23 72,925,958 26,429,821 - -Cash and Cash Equivalents 24.1 86,892,429 24,872,486 83,374,701 23,441,196Total Current Assets 2,034,626,023 1,766,600,705 1,559,647,181 1,388,179,370Total Assets 2,485,354,855 2,013,793,993 1,851,031,260 1,590,321,623
EQUITYStated Capital 25 115,924,290 115,924,290 115,924,290 115,924,290Retained Earnings 1,115,041,617 884,207,899 1,078,463,795 855,976,992Total Equity attributable to Owners of the Company 1,230,965,907 1,000,132,189 1,194,388,085 971,901,282Non -Controlling Interest 101,577,841 93,230,927 - -Total Equity 1,332,543,748 1,093,363,116 1,194,388,085 971,901,282
Non - Current LiabilitiesInterest Bearing Borrowings 26 74,300,000 - - - Assets Related Grants 27 6,581,652 6,801,041 6,581,652 6,801,041Employee Benefits 28 26,026,219 21,227,139 22,638,976 19,999,428Deferred Tax Liabilities 29 6,019,604 3,615,883 3,294,927 1,880,350Total Non Current Liabilities 112,927,475 31,644,063 32,515,555 28,680,819
Current LiabilitiesTrade and Other Payables 30 792,270,482 750,583,860 593,767,592 558,729,265Amounts due to Related Parties 31 1,034,343 431,513 - -Interest Bearing Borrowings 26 139,021,939 58,876,643 - -Dividend Payable 1,227,902 1,336,729 1,227,902 1,336,729Current Tax Liabilities 64,495,719 58,909,735 29,132,126 29,673,528Bank Overdraft 24.2 41,833,247 18,648,334 - -Total Current Liabilities 1,039,883,632 888,786,814 624,127,620 589,739,522Total Liabilities 1,152,811,107 920,430,877 656,643,175 618,420,341Total Equity and Liabilities 2,485,354,855 2,013,793,993 1,851,031,260 1,590,321,623
The accounting policies and notes from 47 to 88 form an integral part of these financial statements.
It is certified that the Financial statement have been prepared in compliance with the requirements of the Companies Act. No. 07 of 2007.
Thejani KodithuwakkuFinance Controller
The Board of Directors is responsible for the preparation and presentation of these financial statements. Approved for and on behalf of the
Board of Directors :
Deshamanya Tilak Dias Gunasekera Sumal PereraManaging Director Chairman
15th July 2015,Colombo
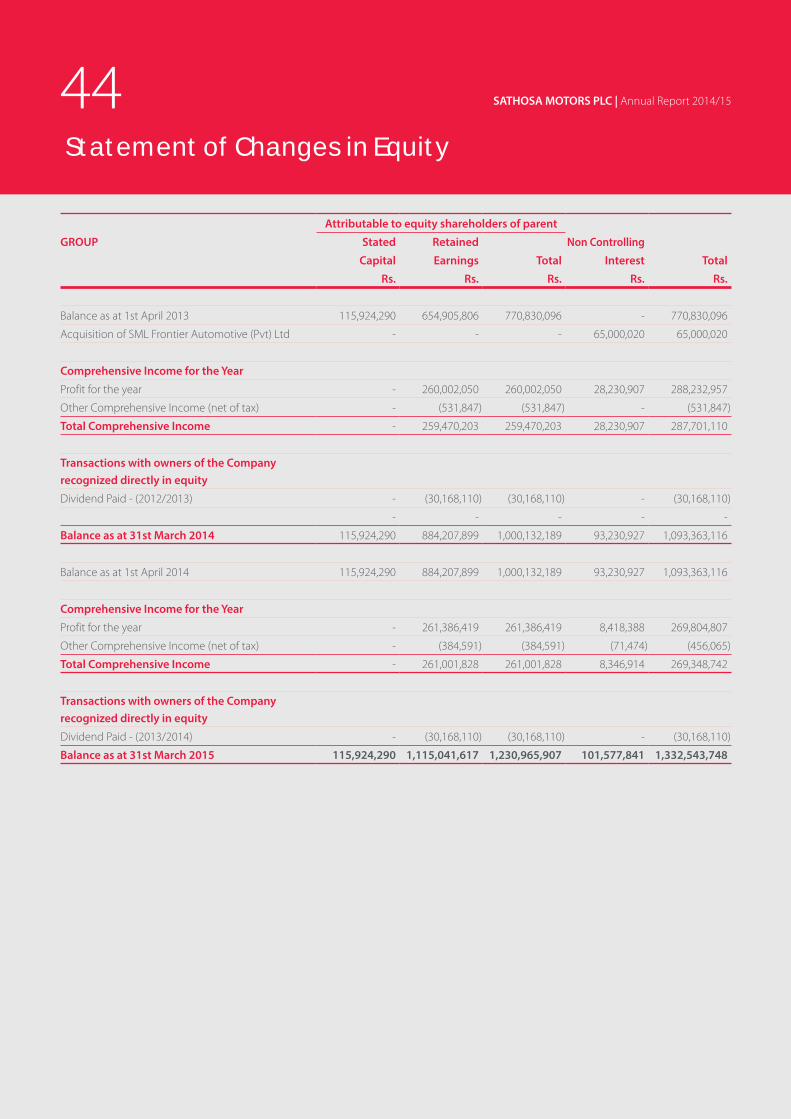
SATHOSA MOTORS PLC | Annual Report 2014/1544 Statement of Changes in Equity
Attributable to equity shareholders of parent
GROUP Stated Retained Non Controlling
Capital Earnings Total Interest Total
Rs. Rs. Rs. Rs. Rs.
Balance as at 1st April 2013 115,924,290 654,905,806 770,830,096 - 770,830,096
Acquisition of SML Frontier Automotive (Pvt) Ltd - - - 65,000,020 65,000,020
Comprehensive Income for the Year
Profit for the year - 260,002,050 260,002,050 28,230,907 288,232,957
Other Comprehensive Income (net of tax) - (531,847) (531,847) - (531,847)
Total Comprehensive Income - 259,470,203 259,470,203 28,230,907 287,701,110
Transactions with owners of the Company recognized directly in equity
Dividend Paid - (2012/2013) - (30,168,110) (30,168,110) - (30,168,110)
- - - - -
Balance as at 31st March 2014 115,924,290 884,207,899 1,000,132,189 93,230,927 1,093,363,116
Balance as at 1st April 2014 115,924,290 884,207,899 1,000,132,189 93,230,927 1,093,363,116
Comprehensive Income for the Year
Profit for the year - 261,386,419 261,386,419 8,418,388 269,804,807
Other Comprehensive Income (net of tax) - (384,591) (384,591) (71,474) (456,065)
Total Comprehensive Income - 261,001,828 261,001,828 8,346,914 269,348,742
Transactions with owners of the Company recognized directly in equity
Dividend Paid - (2013/2014) - (30,168,110) (30,168,110) - (30,168,110)
Balance as at 31st March 2015 115,924,290 1,115,041,617 1,230,965,907 101,577,841 1,332,543,748

45
COMPANY Stated Retained Total
Capital Earnings
Rs. Rs. Rs.
Balance as at 1st April 2013 115,924,290 654,905,806 770,830,096
Comprehensive Income for the Year
Profit for the year - 231,771,143 231,771,143
Other Comprehensive Income (net of tax) - (531,847) (531,847)
Total Comprehensive income - 231,239,296 231,239,296
Transactions with owners of the Company recognized directly in equity
Dividend Paid - (2012/2013) - (30,168,110) (30,168,110)
Balance as at 31st March 2014 115,924,290 855,976,992 971,901,282
Balance as at 1st April 2014 115,924,290 855,976,992 971,901,282
Comprehensive Income for the Year
Profit for the year - 252,968,030 252,968,030
Other Comprehensive Income (net of tax) - (313,117) (313,117)
Total Comprehensive Income - 252,654,913 252,654,913
Transactions with owners of the Company recognized directly in equity
Dividend Paid - (2013/2014) - (30,168,110) (30,168,110)
Transfer to Retained Earnings - - -
Balance as at 31st March 2015 115,924,290 1,078,463,795 1,194,388,085
Figures in brackets indicate deductions.
The accounting policies and notes from 47 to 88 form an integral part of these financial statements.

SATHOSA MOTORS PLC | Annual Report 2014/1546Statement of Cash Flow
Group Company
For the year ended 31 March, 2015 2014 2015 2014
Note Rs. Rs. Rs. Rs.
Restated
CASH FLOWS FROM OPERATING ACTIVITIESProfit before Tax 382,171,983 415,066,940 349,652,287 322,327,188
Adjustments for:Depreciation & Amortisation 32,497,274 24,552,609 14,874,139 13,397,463Provision for Gratuity 5,683,847 4,810,154 3,722,854 3,582,443Amortisation of Grants Received (219,389) (219,389) (219,389) (219,389)(Provision)/ Reversal for Bad and Doubtful Debts & Inventories 1,889,762 1,182,086 1,889,762 1,182,086Impairment Provisions made for Trade Receivable - (1,622,969) - -Interest Expense 18,710,118 9,213,012 16,367 7,337,648Profit on Sale of Property, Plant and Equipment (10,032,544) (4,550,939) (10,032,544) (4,550,939)Interest Income (17,834,664) (2,473,384) (17,834,664) (2,473,384)Writebackofunclaimeddividend (295,137) - (295,137) -Writebackofoverprovisionsforexpenses (1,000,000) (6,000,000) (1,000,000) (6,000,000)Writebackofwarrantyclaimandother (5,749,138) (2,653,449) (5,749,138) (2,653,449)Operating profit before working capital changes 405,822,112 437,304,671 335,024,537 331,929,667
Changes in working capitalInventories (282,480,110) 148,981,215 (228,112,931) 273,403,084Trade and Other Receivables 123,242,764 (587,581,240) 116,850,517 (363,065,854)Amount Due to Related Parties 602,830 431,513 - -Amount Due From Related Parties (46,496,137) (26,429,821) - -Trade and Other Payables 46,569,263 140,352,980 39,920,948 (51,501,599)Cash generated from/(used) in operation 247,260,722 113,059,318 263,683,071 190,765,298
Income Tax Paid (104,200,136) (92,066,178) (95,689,318) (86,759,996)Gratuity Paid (1,518,191) (3,714,900) (1,518,191) (3,714,900)Net Cash flows from/(used in) Operating Activities 141,542,395 17,278,240 166,475,563 100,290,402
Cash Flows From Investment ActivitiesAcquisition of Property, Plant & Equipment (190,404,635) (157,965,409) (58,487,761) (42,965,267)Acquisition of Intangible Assets - (6,206,040) - -Proceeds from Sale of Property, Plant & Equipment 10,032,544 4,550,939 10,032,544 4,550,939Acquisition of Investment Property - (2,508,112) - (2,508,112)Investment in Subsidiary company - - (20) (65,000,000)Investment in Debentures (45,628,183) (37,290,000) (45,628,183) (37,290,000)Interest Received 17,834,664 2,473,386 17,834,664 2,473,386Net Cash Flows from/(used) in Investing Activities (208,165,606) (196,945,236) (76,248,753) (140,739,054)
Cash Flows From Financing ActivitiesInterest Paid (18,710,118) (9,213,012) (16,367) (7,337,648)Proceed From Issued Shares to Non-Controlling Interest - 65,000,020 - -Proceed From Borrowings 359,262,243 58,876,643 - -Loan Repayment (204,816,946) - - -Dividends Paid (30,276,938) (30,168,559) (30,276,938) (30,168,559)Net Cash Flows used in Financing Activities 105,458,241 84,495,092 (30,293,305) (37,506,207)
Net Increase/ (Decrease) in Cash and Cash Equivalents 38,835,030 (95,171,903) 59,933,505 (77,954,859)Cash and Cash Equivalents as at 1st April 6,224,152 101,396,055 23,441,196 101,396,055Cash and Cash Equivalents as at 31st March 24 45,059,182 6,224,152 83,374,701 23,441,196
Figures in brackets indicate deductions.
The accounting policies and notes from 47 to 88 form an integral part of these financial statements.

47Notes to the Financial Statements
1 CORPORATE INFORMATION
1.1 Reporting Entity
Sathosa Motors PLC is a public limited liability company
incorporated and domiciled in Sri Lanka and is listed on
the Colombo Stock Exchange. The registered office and
principal place of business of the Company is situated at
No. 25, Vauxhall Street,Colombo 02.
The consolidated Financial Statements of Sathosa Motors
PLC as at and for the year ended 31st March 2015 comprise
the Company and its Subsidiary, SML Frontier Automotive
(Pvt) Ltd. (together referred to as the ‘Group’). Sathosa
Motors PLC holds 50% of SML Frontier Automotive (Pvt) Ltd.
The Financial Statements of the Company and its subsidiary
have a common financial year which ends on 31st March.
1.1.2 Total number of employees
Company -122 (2014: 122)
Group - 212 (2014: 202)
1.2 Principal Activities and Nature of Operations
The principal activity of the Company is importing and
distribution of Isuzu new vehicles and spare parts and
operating workshops for vehicle repairs.
SML Frontier Automotive (Pvt) Ltd (SMLF) is the subsidiary of
Sathosa Motors PLC. SMLF is in the business of importation
and sale of Land Rover vehicles, the Subsidiary Company
operates workshops and sale of Land Rover spare parts too.
1.3 Parent Company
The Parent Company of Sathosa Motors PLC is Access
Engineering PLC ( AEL). AEL is primarily involved in the
business of construction activities.
2 BASIS OF PREPARATION
2.1 Statement of Compliance
The Financial Statements of the Company and those
consolidated comprise the Statement of Financial Position,
the Statement of Profit or Loss and other Comprehensive
Income, Statement of Changes in Equity, and Cash Flow
Statement together with the Accounting Policies and
Notes to the Financial Statements.
These Financial Statements have been prepared in
accordance with Sri Lanka Accounting Standards (SLFRSs /
LKASs) as issued by the Institute of Chartered Accountants
of Sri Lanka (CA Sri Lanka) and with the requirements of the
Companies Act No. 7 of 2007.
The consolidated and separate Financial Statements were
authorized for issue by the Board of Directors in accordance
with the resolution passed by the Board of Directors on
15th July 2015.
2.2 Basis of Measurement
The consolidated Financial Statements have been prepared
on the historical cost basis except for the following material
items in the Statement of Financial Position.
• Financial Assets and Financial Liabilities that have
been measured at fair value
• Employee benefit liability recognized based on the
actuarial valuation (LKAS 19)
• Land and building stated at revalued amounts -
(revaluation has not been carried out during the
current financial year)
• Investment property measured at fair value
The Directors have made an assessment of Group’s ability
to continue as a going concern in the foreseeable future
and they do not foresee a need for liquidation or cessation
of business.
2.3 Functional and Presentation Currency
The financial statements are presented in Sri Lankan Rupees
(Rs.), which is the Group’s functional currency.
2.4 Use of Estimates & Judgments
The preparation of the Financial Statements in conformity
with Sri Lanka Accounting Standards (SLFRSs / LKASs)
requires management to make judgments, estimates and
assumptions that affect the application of accounting
policies and the reported amounts of assets, liabilities,
income and expenses. Actual results may differ from these
estimates.
The estimates and underlying assumptions are reviewed
on an ongoing basis. Revisions to accounting estimates are
recognized in the period in which the estimates are revised
and in any future periods affected.

SATHOSA MOTORS PLC | Annual Report 2014/1548
Information about assumptions and estimate uncertainties
that have a significant risk of resulting in a material
adjustment in the financial statements are stated below.
Note 28 - Employee Benefits
Note 29 - Deferred Taxation
Note 32 - Contingent Liabilities
3 SIGNIFICANT ACCOUNTING POLICIES
The accounting policies set out below have been applied
consistently to all periods presented in these financial
statements, unless otherwise stated.
The accounting policies have been applied consistently by
its Group entities.
3.1 Basis of Consolidation
3.1.1 Business Combination
Business combinations are accounted for using the
acquisition method as at the acquisition date - i.e. when
control is transferred to the Group. Control is the power to
govern the financial and operating policies of an entity so
as to obtain benefits from its activities. In assessing control,
the Group also takes into consideration potential voting
rights that are currently exercisable.
The Group measures goodwill at the acquisition date as
• The fair value of the consideration transferred plus
• The recognized amount of any non-controlling
interests in the acquiree plus
• If the business combination is achieved in stages, the
fair value of the pre-existing equity interest in the
acquiree less
• The net recognized amount (generally fair value) of
the identifiable assets acquired and liabilities assumed.
When the excess is negative, a bargain purchase gain is
recognized immediately in profit or loss.
The consideration transferred does not include amounts
related to the settlement of pre-existing relationships,
such amounts are generally recognized in profit or loss.
Transactions costs, other than those associated with the
issue of debt or equity securities, that the Group incurs in
connection with a business combination are expensed as
incurred.
3.1.2 Non-Controlling Interests
The total profit or loss for the year of the Company and
its subsidiary included in consolidation are shown in
the consolidated Statement of Profit or Loss and other
Comprehensive income with the proportion of profit or
loss after taxation pertaining to minority shareholders of
subsidiary being deducted as “Non controlling interest”. All
assets and liabilities of the Company and of its subsidiary
included in consolidation are shown in the consolidated
Statement of Financial Position. The interest of minority
shareholders of subsidiary in the fair value of net assets
of the Group is indicated separately in the consolidated
Statement of Financial Position under the heading “Non-
controlling interest”. Changes in the Group’s interest in
a subsidiary that do not result in a loss of control are
accounted for as, equity transactions. Adjustments to non-
controlling interests are based on a proportionate amount
of the net assets of the subsidiary. No adjustments are
made to goodwill and no gain or loss is recognized in profit
or loss.
3.1.3 Subsidiary
Subsidiary entity is controlled by the Parent. The financial
statements of subsidiary is included in the consolidated
financial statements from the date that control commences,
until the date that control ceases. In separate financial
statements, investment in subsidiary is stated at cost.
3.1.4 Transactions Eliminated on Consolidation
Intra-group balances and transactions, and any unrealized
income and expenses arising from intra group transactions,
are eliminated in preparing the consolidated financial
statements. Unrealized losses are eliminated in the same
way as unrealized gains, but only to the extent that there is
no evidence of impairment.
Notes to the Financial Statements

49
3.2 Foreign Currency
3.2.1 Foreign Currency Transactions
All foreign exchange transactions are converted to
functional currency, at the rates of exchange prevailing at
the time the transactions are effected.
Monetary assets and liabilities denominated in foreign
currency are re-translated to functional currency
equivalents at the spot exchange rate prevailing at the
reporting date.
Non-monetary items that are measured in terms of
historical cost in a foreign currency are translated using the
exchange rates as at the dates of the initial transactions.
Non-monetary assets and liabilities are translated using
exchange rates that existed when the values were
determined. The gain or loss arising on translation of non-
monetary items are recognized in line with the gain or loss
of the item that gave rise to the translation difference.
3.3 Assets and Bases of their Valuation
Assets classified as current assets in the Statement of
Financial Position are cash and bank balances and those,
which are expected to be realized in cash during the
normal operating cycle, or within one year from the
Statement of Financial Position, whichever is shorter. Assets
other than current assets are those, which the Company
intends to hold beyond a one year period calculated from
the reporting date.
3.3.1 Property, Plant & Equipment
3.3.1.1 Recognition and Measurement
Property, Plant and Equipment are stated at cost/
revaluation less accumulated depreciation and
accumulated impairment losses.
3.3.1.2 Owned Assets
The cost of an item of property, plant and equipment
comprise its purchase price and any directly attributable
costs of bringing the asset to working condition for its
intended use. The cost of self-constructed assets includes
the cost of materials, direct labor, and any other costs
directly attributable to bringing the asset to the working
condition for its intended use. This also includes cost of
dismantling and removing the items and restoring in the
site on which they are located and borrowing costs on
qualifying assets.
Purchased software that is integrated to the functionality of
the related equipment is capitalized as part of equipment.
WhenpartsofanitemofProperty,PlantandEquipment
have different useful lives, they are accounted for as
separate items (major component) of Property, Plant
and Equipment.
3.3.1.3 Leased Assets
Leases in terms of which the Group assumes substantially
all the risk and rewards of ownership are classified as
finance leases. Upon initial recognition the leased asset is
measured and capitalized at an amount equal to the lower
of its fair value and the present value of minimum lease
payments. Subsequent to initial recognition, the asset is
accounted for in accordance with the accounting policy
applicable to that asset.
Other leases are operating leases and, except for
investment property, the leased assets are not recognized
in the Group’s Statement of Financial Position.
3.3.1.4 Subsequent Costs
The cost of replacing part of an item of Property, Plant
and Equipment is recognized in the carrying amount of
the item if it is probable that the future economic benefits
embodied within the part will flow to the Group and its
cost can be measured reliably. The carrying amount of the
replaced part is de-recognized.
The costs of the day to day servicing of Property, Plant and
Equipment are recognized in profit or loss as incurred.
3.3.1.5 De-Recognition
The carrying amount of an item of Property, Plant and
Equipment is de-recognized on disposal or when no future
economic benefits are expected from its use or disposal.
Gains or losses on de-recognition are recognized within
other income in profit or loss.
3.3.1.6 Revaluation
Revaluation Model is applied for freehold land and building
by professionally qualified valuers using the open market
value at least once in every three to five years. The valuation

SATHOSA MOTORS PLC | Annual Report 2014/1550
surplus is recognized on the net carrying value of the asset
and is transferred to a revaluation reserve after restating
the asset at the revalued amount. The revaluation reserve
is transferred to retained earnings at the point of de-
recognition.
3.3.1.7 Depreciation
Depreciation is recognized in Statement of Profit or Loss
and other Comprehensive Income on the straight-line
basis over the estimated useful lives of each part of item
of Property, Plant and Equipment. Leased assets are
depreciated over the shorter of the lease term and their
useful lives unless it is reasonably certain that the Group
will obtain ownership by the end of the lease term.
Depreciation of an asset begins when it is available for use
whereas depreciation of an asset ceases at the earlier of the
date that the asset is classified as held for sale (or included
in a disposal group that is classified as held for sale) and
the date that the asset is de-recognized. Depreciation is not
chargedonFreeholdLandandCapitalWorkinProgress.
The estimated useful lives are as follows:
Asset Category Useful Lives Years
Building–Peliyagoda -SML 50
LeaseholdBuilding–Welisara-SMLF 15
Plant & Machinery 8
Motor Vehicles 5
Office Equipment 5
Furniture & Fittings 5
Tools-Workshop 5-8
Computers 5
99 years Lease Agreement of SML Peliyagoda land would
continue until 2086.
15 years Lease Agreement of SMLF Welisara workshop
would continue until 2021. This lease agreement is between
SMLFWelisaraworkshopandCEY-NORFoundationLTD.
Depreciation methods, useful lives, and residual
values are reviewed at each reporting date and
adjusted if appropriate.
3.3.1.7.1 Leasehold Right – Land
Leasehold property comprise of land use rights and is
amortized on a straight line basis over the period of the
lease in accordance with the pattern of benefits expected
to be derived from the lease. Leasehold property is tested
for impairment annually and is written down where
applicable. The impairment loss if any is recognized in the
Profit or Loss.
The estimated useful life for the current periods is as follows:
Item Useful Life
Leasehold rights 71 Years (Remaining Lease Period)
3.3.1.8 Capital Work in Progress
The cost of self constructed assets includes the cost of
materials, direct labour , and any other costs directly
attributable to bringing the asset to the working condition
for its intended use. This also includes cost of dismantling
and removing the items and restoring in the site on which
they are located and borrowing costs on qualifying assets.
3.3.2. Intangible Assets
Intangible Assets are recognized if it is probable that
economic benefits are attributable to the assets will flow to
the entity and cost of the assets can be measured reliably.
Intangible assets that are acquired by the Group/Company
are measured at cost less accumulated amortization and
accumulated impairment losses.
3.3.2.1. Software
All computer software cost incurred, which are not
internally related to associate hardware, which can be
clearly identified, reliably measured and its probable that
they will lead to future economic benefits, are included in
the Statement of Financial Position under the category of
intangible assets.
3.3.2.2. Subsequent Expenditure
Subsequent expenditure is capitalized only when it
increases the future economic benefits embodied in the
specific asset to which it relates. All other expenditure is
recognized in profit or loss as incurred.
Notes to the Financial Statements

51
3.3.2.3. Amortisation
Amortisation is calculated over the cost of the asset, or
other amount substituted for cost, less its residual value.
Amortisation is recognized in the profit or loss on a straight
line basis over the estimated useful lives of intangible assets,
other than goodwill, from the date that they are available
for use, since this most closely reflects the expected pattern
of consumption of the future economic benefits embodied
in the asset. The estimated useful lives and amortization
rates are as follows:
Asset Category Useful Life (Years)
Depreciation Rate (%)
Computer Software 05 20%
Amortisation methods, useful lives and residual values
are reviewed at each financial year end and adjusted
prospectively, if appropriate.
3.3.3 Investment Properties
Investment property is property held either to earn rental
income or for capital appreciation or for both, but not for sale
in the ordinary course of business, use in the production or
supply of goods or services or for administrative purposes.
3.3.3.1 Recognition and Measurement
Investment properties are measured initially at cost. The
carrying amount includes the cost of replacing part of
an existing investment property at the time that cost is
incurred if the recognition criteria are met and exclude the
costs of day-to-day servicing of an investment property.
Subsequently, investment properties are stated at fair
value, which reflects market conditions at the reporting
date. Gains or losses arising from changes in the fair values
of investment properties are included in the Statement of
Profit or Loss and other Comprehensive Income in the year
in which they arise. Fair values are evaluated at least every
three years by an accredited external, independent valuer.
3.3.3.2 De-recognition
Investment properties are de-recognized either when
they have been disposed of or when the investment
property is permanently withdrawn from use and no
future economic benefits are expected from its disposal.
Any gains or losses on the retirement or disposal of an
investment property are recognized in the Profit or Loss
in the event of retirement or disposal.
Transfers are made from investment property only when
there is a change in use. For a transfer from investment
property to owner occupied property, the deemed cost
for subsequent accounting is the fair value at the date of
change in use.
WhereGroup companies occupy a significant portion of
the investment property of a subsidiary, such investment
properties are treated as property, plant and equipment
in the consolidated financial statements, and accounted
using Group accounting policy for property, plant and
equipment.
3.3.4 Investment in Subsidiary
Investment in Subsidiary is treated as long - term investment
and valued at cost in separate financial statements of the
Company.
3.3.5 Inventories
Inventories are stated at the lower of cost and net realizable
value, after making due allowance for obsolete and slow
moving items.
The cost of inventories is comprised of all costs of purchase,
costs of conversion and other costs incurred in bringing
the inventories to their present location and condition.
Net realizable value is the estimated selling price in the
normal course of business less estimated cost of realization
and/or cost of conversion from their existing state to
saleable condition.
Inventory movement, mainly with respect to spare
parts is reviewed at the end of reporting period by
an experienced staff member ( head of the division)
who has a fair knowledge / expertise to assess the
recoverability of inventory and the items that are
identified as irrecoverable are written off during the
year. For this purpose the Company gets the support of
the workshop manager who possesses a fair amount of
technical expertise, which helps to identify the technical
obsolescence of the inventory items.

SATHOSA MOTORS PLC | Annual Report 2014/1552
The cost of each category of Inventory of the Group /
Company is determined on the following basis:
Spare Parts - At actual cost on a weighted average basis
New Vehicles - At actual cost
Goods in transit - At Actual cost
Work-in-Progress - Includesonlythecostofmaterialandlabour
3.3.6 Cash and Cash Equivalents
Cash and cash equivalents are defined as cash in hand,
demand deposits and short term highly liquid investments,
readily convertible to known amounts of cash and subject
to insignificant risk of changes in value.
For the purpose of cash flow statement, cash and cash
equivalents consist of cash in hand and deposits in banks
net of outstanding bank overdrafts. Investments with
short maturities i.e. three months or less from the date of
acquisition are also treated as cash equivalents.
3.3.7 Impairment of Non-Financial Assets
The Group assesses at each reporting date, whether
there is an indication that an asset may be impaired. If
any indication exists, the Company estimates the asset’s
recoverable amount. An asset’s recoverable amount is the
higher of an asset’s or cash-generating unit’s (CGU) fair value
less costs to sell and its value in use and is determined for
an individual asset, unless the asset does not generate cash
inflows that are largely independent of those from other
assetsorgroupsofassets.Wherethecarryingamountofan
asset or CGU exceeds its recoverable amount, the asset is
considered impaired and is written down to its recoverable
amount. In assessing value in use, the estimated future cash
flows are discounted to their present value using a pre-tax
discount rate that reflects current market assessments of
the time value of money and the risks specific to the asset.
In determining fair value less costs to sell, recent market
transactions are taken into account, if available. If no such
transactions can be identified, an appropriate valuation
model is used. These calculations are corroborated by
valuation multiples, quoted share prices for publicly traded
Companies or other available fair value indicators.
Impairment losses of continuing operations are recognized
in the Profit or Loss in those expense categories consistent
with the function of the impaired asset, except for a
property previously revalued where the revaluation was
taken to other comprehensive income. In this case, the
impairment is also recognized in other comprehensive
income up to the amount of any previous revaluation.
For assets excluding goodwill, an assessment is made at
each reporting date as to whether there is any indication
that previously recognized impairment losses may no
longer exist or may have decreased. If such indication
exists, the Group estimates the asset’s or cash-generating
unit’s recoverable amount. A previously recognized
impairment loss is reversed only if there has been a
change in the assumptions used to determine the asset’s
recoverable amount since the last impairment loss was
recognized. The reversal is limited so that the carrying
amount of the asset does not exceed its recoverable
amount, nor exceed the carrying amount that would have
been determined, net of depreciation, had no impairment
loss been recognized for the asset in prior years. Such
reversal is recognized in the Profit or Loss unless the asset
is carried at a revalued amount, in which case the reversal
is treated as a revaluation increase.
3.3.8 Financial Assets
3.3.8.1 Initial Recognition and Measurement
Financial assets within the scope of LKAS 39 are classified as financial assets at fair value through profit or loss, loans and receivables, held-to-maturity investments, available-for-sale financial assets, or as derivatives designated as hedging instruments in an effective hedge, as appropriate. The Group determines the classification of its financial assets at initial recognition.
All financial assets are recognized initially at fair value plus, in the case of assets not at fair value through profit or loss, directly attributable transaction costs.
Purchase or sale of financial assets that require delivery of assets within a time frame established by regulation or convention in the marketplace (regular way trades) are recognized on the trade date, i.e., the date that the Group commits to purchase or sell the asset.
The Group’s financial assets include cash and cash
equivalents, short term deposits, trade and other
receivables, loans, and related party receivables.
The subsidiary company has obtained long term loans for
capital expenditure ( showroom and a workshop) and short
term loans during the current financial year.
Notes to the Financial Statements

53
3.3.8.2 Subsequent Measurement
The subsequent measurement of financial assets depends
on their classification as described below:
3.3.8.3 Loans and Receivables
Loans and receivables are non-derivative financial assets
with fixed or determinable payments that are not quoted in
an active market. After initial measurement, such financial
assets are subsequently measured at amortized cost using
the effective interest rate method (EIR), less impairment.
Amortized cost is calculated by taking into account any
discount or premium on acquisition and fees or costs
that are an integral part of the EIR. The EIR amortization is
included in finance income in the Statement of Profit or
Loss and other Comprehensive Income. The losses arising
from impairment are recognized in the profit or loss in
finance cost.
3.3.8.4 Held-to-Maturity Investments
Non-derivative financial assets with fixed or determinable
payments and fixed maturities are classified as held-to-
maturity when the Group has the positive intention and
ability to hold them to maturity. After initial measurement,
held-to-maturity investments are measured at amortized
cost using the effective interest method, less impairment.
Amortized cost is calculated by taking into account any
discount or premium on acquisition and fees or costs
that are an integral part of the EIR. The EIR amortization is
included in finance income in the Profit or Loss. The losses
arising from impairment are recognized in profit or loss in
finance costs.
3.3.8.5 Available-for-Sale Financial Investments
Available-for-sale financial investments include equity and
debt securities. Equity investments classified as available-
for-sale are those, which are neither classified as held
for trading nor designated at fair value through profit or
loss. Debt securities in this category are those which are
intended to be held for an indefinite period of time and
which may be sold in response to needs for liquidity or in
response to changes in the market conditions.
After initial measurement, available-for-sale financial
investments are subsequently measured at fair value
with unrealized gains or losses recognized as other
comprehensive income in the available-for-sale reserve
until the investment is de-recognized, at which time the
cumulative gain or loss is recognized in other operating
income, or determined to be impaired, at which time
the cumulative loss is reclassified to the finance costs in
statement of Profit or Loss and removed from the available-
for-sale reserve. Interest income on available-for-sale debt
securities is calculated using the effective interest method
and is recognized in profit or loss.
The Group evaluates its available-for-sale financial assets to determine whether the ability and intention to sell them in theneartermisstillappropriate.WhentheGroupisunableto trade these financial assets due to inactive markets and management’s intention to do so significantly changes in the foreseeable future, the Group may elect to reclassify these financial assets in rare circumstances. Reclassification to loans and receivables is permitted when the financial assets meet the definition of loans and receivables and the Group has the intention and ability to hold these assets for the foreseeable future or until maturity. Reclassification to the held-to-maturity category is permitted only when the entity has the ability and intention to hold the financial asset accordingly.
For a financial asset reclassified out of the available-for-sale
category, any previous gain or loss on that asset that has
been recognized in equity is amortized to profit or loss
over the remaining life of the investment using the EIR.
Any difference between the new amortized cost and the
expected cash flows is also amortized over the remaining
life of the asset using the EIR. If the asset is subsequently
determined to be impaired, then the amount recorded in
equity is reclassified to the profit or loss.
3.3.8.6 De recognition
A financial asset (or, where applicable a part of a financial
asset or part of a group of similar financial assets) is de
recognized when:
• The rights to receive cash flows from the asset have
expired,
• The Group has transferred its rights to receive cash
flows from the asset or has assumed an obligation
to pay the received cash flows in full without
material delay to a third party under a ‘pass-through’
arrangement; and either (a) the Group has transferred
substantially all the risks and rewards of the asset, or
(b) the Group has neither transferred nor retained
substantially all the risks and rewards of the asset, but
has transferred control of the asset.

SATHOSA MOTORS PLC | Annual Report 2014/1554
WhentheGrouphastransferred its rightstoreceivecash
flows from an asset or has entered into a pass-through
arrangement, and has neither transferred nor retained
substantially all of the risks and rewards of the asset nor
transferred control of it, the asset is recognized to the
extent of the Group’s continuing involvement in it.
In that case, the Group also recognizes an associated
liability. The transferred asset and the associated liability are
measured on a basis that reflects the rights and obligations
that the Group has retained.
Continuing involvement that takes the form of a guarantee
over the transferred asset is measured at the lower of the
original carrying amount of the asset and the maximum
amount of consideration that the Group could be required
to repay.
3.3.8.7 Impairment of Financial Assets
The Group assesses at each reporting date whether there
is any objective evidence that a financial asset or a group
of financial assets is impaired. A financial asset or a group
of financial assets is deemed to be impaired if, and only
if, there is objective evidence of impairment as a result
of one or more events that has occurred after the initial
recognition of the asset (an incurred ‘loss event’) and that
loss event has an impact on the estimated future cash
flows of the financial asset or the group of financial assets
that can be reliably estimated.
Evidence of impairment may include indications that the
debtors or a group of debtors is experiencing significant
financial difficulty, default or delinquency in interest or
principal payments, the probability that they will enter
bankruptcy or other financial reorganization and where
observable data indicate that there is a measurable
decrease in the estimated future cash flows, such as
changes in arrears or economic conditions that correlate
with defaults.
3.3.8.8 Financial Assets Carried at Amortized Cost
For financial assets carried at amortized cost, the Group
first assesses whether objective evidence of impairment
exists individually for financial assets that are individually
significant, or collectively for financial assets that are not
individually significant. If the Group determines that no
objective evidence of impairment exists for an individually
assessed financial asset, whether significant or not, it
includes the asset in a group of financial assets with
similar credit risk characteristics and collectively assesses
them for impairment. Assets that are individually assessed
for impairment and for which an impairment loss is, or
continues to be, recognized are not included in a collective
assessment of impairment.
If there is objective evidence that an impairment loss
has been incurred, the amount of the loss is measured
as the difference between the assets carrying amount
and the present value of estimated future cash flows
(excluding future expected credit losses that have not yet
been incurred). The present value of the estimated future
cash flows is discounted at the financial asset’s original
effective interest rate. If a loan has a variable interest rate,
the discount rate for measuring any impairment loss is the
current effective interest rate.
The carrying amount of the asset is reduced through
the use of an allowance account and the amount of the
loss is recognized in the profit or loss. Interest income
continues to be accrued on the reduced carrying amount
and is accrued using the rate of interest used to discount
the future cash flows for the purpose of measuring the
impairment loss. The interest income is recorded as part of
finance income in the Profit or Loss. Loans together with
the associated allowance are written off when there is no
realistic prospect of future recovery and all collateral has
been realized. If, in a subsequent year, the amount of the
estimated impairment loss increases or decreases because
of an event occurring after the impairment was recognized,
the previously recognized impairment loss is increased or
reduced by adjusting the allowance account. If a future
write-off is later recovered, the recovery is credited to
finance costs in the profit or loss.
3.3.9 Financial Liabilities
3.3.9.1 Initial Recognition and Measurement
Financial liabilities within the scope of LKAS 39 are classified
as financial liabilities at fair value through profit or loss,
loans and borrowings, or as derivatives designated as
hedging instruments in an effective hedge, as appropriate.
The Group determines the classification of its financial
liabilities at initial recognition.
All financial liabilities are recognized initially at fair value and,
in the case of loans and borrowings, carried at amortized
cost. This includes directly attributable transaction costs.
Notes to the Financial Statements

55
The Group’s financial liabilities include trade and other
payables, bank overdrafts, loans and borrowings and
related party payables.
3.3.9.2 Subsequent Measurement
The measurement of financial liabilities depends on their
classification as follows:
3.3.9.3 Loans and Borrowings
After initial recognition, interest bearing loans and
borrowings are subsequently measured at amortized cost
using the effective interest rate method. Gains and losses
are recognized in the Profit or Loss when the liabilities are
de-recognized as well as through the effective interest rate
method (EIR) amortization process.
Amortized cost is calculated by taking into account any
discount or premium on acquisition and fees or costs
that is an integral part of the EIR. The EIR amortization is
included in finance costs in the income statement.
3.3.9.4 De-recognition
A financial liability is de-recognized when the obligation
under the liability is discharged or cancelled or expires.
Whenanexisting financial liability is replacedbyanother
from the same lender on substantially different terms, or
the terms of an existing liability are substantially modified,
such an exchange or modification is treated as a de-
recognition of the original liability and the recognition of
a new liability, and the difference in the respective carrying
amounts is recognized in profit or loss.
3.3.10 Off setting of Financial Instruments
Financial assets and financial liabilities are offset with the
net amount reported in the Statement of Financial Position
only if there is a current enforceable legal right to offset the
recognized amounts and intent to settle on a net basis, or
to realize the assets and settle the liabilities simultaneously.
Income and expense will not be offset in the statement
of profit or loss and other comprehensive income unless
required or permitted by any accounting standard or
interpretation, as specifically disclosed in the accounting
policies of the Group.
3.3.11 Fair Value of Financial Instruments
The fair value of financial instruments that are traded
in active markets at each reporting date is determined
by reference to quoted market prices or dealer price
quotations (bid price for long positions and ask
price for short positions), without any deduction for
transaction costs.
For financial instruments not traded in an active market,
the fair value is determined using appropriate valuation
techniques. Such techniques may include:
• Using recent arm’s length market transactions;
• Reference to the current fair value of another
instrument that is substantially the same;
• A discounted cash flow analysis or other valuation
models.
An analysis of fair values of financial instruments and
further details as to how they are measured are provided
in Note 38.
3.4 Provision, Contingent Liabilities, Contingent Assets
Provisions are recognized when the Group has a present
obligation (legal or constructive) as a result of a past
event, where it is probable that an outflow of resources
embodying economic benefits will be required to settle
the obligation and a reliable estimate can be made of the
amount of the obligation.
All contingent liabilities are disclosed as a note
to the financial statements unless the outflow of
resources is remote.
Contingent assets are disclosed, where inflow of economic
benefit is probable.
3.5 Employment Benefits
3.5.1 Defined Benefit Plans
The liability recognized in the Statement of Financial
Position in respect of defined benefit plan is the present
value of defined benefit obligation at the reporting date.
The defined benefit obligation is calculated annually
by independent actuary using Project Unit Credit (PUC)
method as recommended by LKAS 19 - ‘Employee Benefits.

SATHOSA MOTORS PLC | Annual Report 2014/1556
Actuarial gains and losses for the defined benefit plans
are recognized in full in the period in which they occur in
Other Comprehensive Income.
However, according to the Payment of Gratuity Act
No. 12 of 1983, the liability for gratuity payment to an
employee arises only after the completion of 5 years of
continued service.
3.5.2 Defined Contribution Plans- Employees’ Provident Fund and Employees’ Trust Fund
A defined contribution plan is a post-employment benefit
plan under which an entity pays a fixed contribution into
a separate entity and will have no legal or constructive
obligation to pay further amounts.
All employees who are eligible for Employees’ Provident
Fund Contributions and Employees’ Trust Fund
Contributions are covered by relevant contributions funds
in line with the relevant statutes. Employer’s contributions
to the defined contribution plans are recognized as an
expense in profit or loss when incurred.
4 STATEMENT OF PROFIT OR LOSS AND OTHER COMPREHENSIVE INCOME
4.1 Revenue
Revenue represents the amounts derived from the
provision of services, which fall within the Group’s ordinary
activities net of trade discounts and turnover related taxes.
4.2 Revenue Recognition
Revenue is recognized to the extent that it is probable
that the economic benefits will flow to the Group and the
revenue and the associated costs incurred or to be incurred
can be reliably measured. Revenue is measured at the fair
value of the consideration received or receivable, net of
trade discounts and sales taxes, and after eliminating sales
within the Group. The following specific criteria are used for
the purpose of recognition of revenue.
4.2.1 Rental Income
Rental income from investment property is recognized
in profit or loss on a straight-line basis over the term
of the lease.
4.2.2 Goods Sold
Revenue from the sale of goods in the course of ordinary
activities is measured at the fair value of the consideration
received or receivable, net of returns, trade discounts and
volume rebates. Revenue is recognized when persuasive
evidence exists, usually in the form of an executed sales
agreement, that the significant risks and rewards of
ownership have been transferred to the buyer, recovery
of the consideration is probable, the associated costs and
possible return of goods can be estimated reliably, there is
no continuing management involvement with the goods,
and the amount of revenue can be measured reliably.
4.2.3 Services Rendered
Revenue for services rendered is recognized in the
Statement of Profit or Loss and other Comprehensive
Income once all significant performance obligations have
been provided.
4.2.4 Agency Commissions and Hire Income
Agency Commissions are recognized in the Statement
of Profit or Loss and other Comprehensive Income on an
accrual basis.
4.2.5 Interest Income
For all financial instruments measured at amortized cost
and interest bearing financial assets classified as available
for sale, interest income or expense is recorded using the
effective interest rate (EIR), which is the rate that exactly
discounts the estimated future cash payments or receipts
through the expected life of the financial instrument or
a shorter period, where appropriate, to the net carrying
amount of the financial asset or liability. Interest income is
included in finance income in the profit or loss.
4.2.6 Dividend Income
Dividend income is accounted when the shareholders’
right to receive payment is established.
4.2.7 Other Income
Profits or losses from disposal of property, plant and
equipments recognized having deducted from proceeds
on disposal, the carrying value of the assets and the related
expenses.
Notes to the Financial Statements

57
Foreign currency gains and losses are reported on a
net basis.
4.3 Expenditure Recognition
Other Expenses
All expenditure incurred in the running of the business and
in maintaining the Property, Plant and Equipment in a state
of efficiency has been charged to revenue in arriving at the
profit for the year.
For the purpose of presentation of Statement of Profit or
Loss and other Comprehensive Income the directors are
of the opinion that function of expenses method presents
fairly the elements of the enterprises performance, hence
such presentation method is adopted.
Borrowing Costs
Borrowing costs are recognized as an expense in the
period in which they are incurred except those that are
directly attributable to the construction or development of
Property, Plant & Equipments which are capitalized as part
of the cost of those assets during the period of construction
or development.
4.4 Income Tax Expense
4.4.1 Current Taxes
Current Income tax liabilities for the current and prior
periods are measured at the amount expected to be
recovered from or paid to the Commissioner General of
Inland Revenue. The tax rates and tax laws used to compute
the amount are those that are enacted or substantively
enacted by the reporting date.
The provision for income tax is based on the elements
of income and expenditures reported in the Financial
Statements and computed with in accordance with the
provisions of the Inland Revenue Act.
The relevant details are disclosed in the respective notes to
the Financial Statements.
4.4.2 Deferred Taxation
Deferred tax is provided, using liability method, providing
for tax effect of temporary differences between the carrying
amounts of assets and liabilities for financial reporting
purposes and the amounts used for taxation purposes.
Deferred tax is measured at the tax rates that are expected
to apply in the year when the asset is realized or the liability
is settled, based on tax rates (and tax laws) that have been
enacted or substantively enacted at the reporting date.
Deferred tax assets and deferred tax liabilities are offset
if a legally enforceable right exists to set off current tax
assets against current income tax liabilities and the
deferred taxes relate to the same taxable entity and the
same taxation authority.
Sales Tax
Revenues, expenses and assets are recognized net of the
amount of sales tax, except, where the sales tax incurred
on a purchase of assets or service is not recoverable from
the taxation authorities, in which case, the sales tax is
recognized as a part of the cost of the asset or part of the
expense items, as applicable and receivable and payable
that are stated with the amount of sales tax included. The
net amount of sales tax recoverable from or payable to the
taxation authorities is included as a part of receivables or
payables in the Statement of Financial Position.
5 SEGMENTAL REPORTING
The Segment is a distinguishable component of the Group
that is engaged either in providing related products or
services (business segment), or in providing Products
or Services within a particular Economic Environment
(Geographical Segment), which is subject to risks and
returns that are different from those of the Segments.
Spare parts
New Vehicles
Repairs & Services
6 RECOGNITION OF ASSETS RELATED GRANTS
Government Grants are recognized initially as deferred
income at fair value when there is a reasonable assurance
that they will be received and the Group will comply with
the conditions associated with the Grant, and are then
recognized in the Statement of Comprehensive income
as other income on a systematic basis over the useful
life of the asset. Grants that compensate the Group for

SATHOSA MOTORS PLC | Annual Report 2014/1558
expenses incurred are recognized in the Statement of
Comprehensive income as other income on a systematic
basis in the periods in which the expenses are recognized.
7 OTHER GENERAL ACCOUNTING POLICIES
7.1 Related Party Transactions
Disclosure has been made in respect of the transactions
in which one party has the ability to control or exercise
significant influence over the financial and operating
policies/decisions of the other, irrespective of whether a
price is being charged.
The relevant details are disclosed in the Note 34 to the
Financial Statements.
7.2 Earnings per Share
Basic EPS is calculated by dividing the profit or loss
attributable to ordinary share holders of the Company
by the weighted average number of ordinary shares
outstanding during the period.
7.3 Events Occurring after the Reporting Period
Events after the reporting period are those events
favourable and unfavourable that occur between the end
of the reporting period and the date when the Financial
Statements are authorized for issue.
The materiality of the events occurring after the reporting
period is considered and appropriate adjustments to or
disclosures are made in the Financial Statements, where
necessary. (Note 33)
7.4 Comparative Information
The comparative information is re-classified wherever
necessary to conform with the current year’s presentation
in order to provide a better presentation.
7.5 Statement of Directors’ Responsibility
The Board of Directors of the Company is responsible for the
preparation and presentation of these financial statements.
7.6 Statement of Cash Flow
The statement of cash flows has been prepared using the
‘indirect method’ in accordance with Sri Lanka Accounting
Standard - LKAS7 on ‘Statement of Cash Flows’. Cash and
cash equivalent comprise of cash in hand, cash at bank
and short term investments that are readily convertible to
known amount of cash and subject to an insignificant risk
of change in value.
Interest received and dividends received are classified as
investing cash flows, while dividend paid is classified as
financing cash flow and interest paid is classified under the
operating cash flows for the purpose of presentation of
Statement of Cash Flows.
Bank overdrafts and short term borrowings that are re
payable on demand and forming an integral part of the
Group’s cash management are included as a component of
cash and cash equivalent for the purpose of the Statement
of Cash Flow.
8 SRI LANKA ACCOUNTING STANDARDS ISSUED BUT NOT YET EFFECTIVE
The institute of Chartered Accountants of Sri Lanka has
issued the following standards which become effective
for annual periods beginning on or after 1st January 2016.
Accordingly these standards have not been applied in
preparing these financial statements.
The extent of the impact of the above standards to the
financial statements has not been determined as at 31st
March 2015.
SLFRS 9 - Financial Instruments:
Classification and Measurement
SLFRS 9, as issued, reflects the first phase of work on
replacement of LKAS 39 and applies to classification and
measurement of financial assets and liabilities as defined
in LKAS 39.
SLFRS 9 was issued in 2012 and effective date of this
standard has been deferred until 1st January 2018 until
further notice.
Notes to the Financial Statements
59
SLFRS 14 - Regulatory Deferral Accounts
The scope of this standard is to specify the financial
reporting requirements for regulatory deferral account
balances that arise when an entity provides goods or
services to customers at a price or rate that is subject to
rate regulation.
SLFRS 14 will become effective on 1st January 2016.
SLFRS 15 - Revenue from contracts with customers
The objective of this standard is to establish the principles
that an entity shall apply to report useful information to
users of financial statements about the nature, amount,
timing and uncertainty of revenue and cash flows arising
from a contract with a customer.
SLFRS 15 will become effective on 1st January 2018.

SATHOSA MOTORS PLC | Annual Report 2014/1560
Group Company
For the year ended 31 March, 2015 2014 2015 2014
Rs. Rs. Rs. Rs.
Restated
9 REVENUE
Spare Parts 505,041,092 432,796,213 174,910,967 155,984,547
New Vehicles 2,560,935,285 2,160,105,291 2,367,465,952 2,141,125,291
WorkShopRepairs 235,676,552 218,384,964 160,396,871 153,445,718
Machinery 45,039,262 - 45,039,262 -
Vehicles Local Charges 176,338,679 255,359,105 - -
Agency Commission 4,209,022 8,934,389 4,209,022 8,934,389
3,527,239,892 3,075,579,962 2,752,022,074 2,459,489,945
NBT (24,726,266) (34,728,367) (14,439,717) (25,174,683)
Net Revenue 3,502,513,626 3,040,851,595 2,737,582,357 2,434,315,262
10 OTHER INCOME
Interest Income on Reverse Repurchase Agreements and Fixed
Deposits
17,653,234 3,808,571 17,653,234 2,259,403
Interest on Loans to Employees 181,430 213,981 181,430 213,981
Valuation and Fitness Certificates 148,354 136,607 148,354 136,607
Profit on Disposal of Property, Plant and Equipment 10,032,544 4,550,939 10,032,544 4,550,939
Fines and Surcharges 9,404 7,000 9,404 7,000
Sundry Income 4,925,436 5,887,329 1,255,109 669,989
Rent Income 2,400,000 2,200,000 2,400,000 2,200,000
Amortisation of Asset Related Grants 219,389 219,389 219,389 219,389
Non Refundable Tender Deposits 53,500 63,500 53,500 63,500
WritebackofUnclaimedDividend 295,137 - 295,137 -
WritebackofOverProvisionsofExpenses 1,000,000 6,000,000 1,000,000 6,000,000
WritebackofWarrantyClaimandOther 5,749,138 2,653,449 5,749,138 2,653,449
42,667,566 25,740,765 38,997,239 18,974,257
Exchange gain / (loss) pertaining to import of vehicles has been included in the cost of sales.
11 OTHER OPERATING EXPENSES
Pre Operational Expenses - 17,783,772 - -
InventoryWriteoff - 2,449,187 - -
Research Expenses 403,493 - - -
Unrecoverable Taxes - 1,209,918 - -
403,493 21,442,877 - -
12 FINANCE COST
Import Loan and Overdraft Interest 18,710,118 9,213,012 16,367 7,337,648
18,710,118 9,213,012 16,367 7,337,648
Notes to the Financial Statements

61
Group Company
For the year ended 31 March, 2015 2014 2015 2014
Rs. Rs. Rs. Rs.
Restated
13 PROFIT BEFORE TAX
Is stated after charging all expenses including the following,
Directors’ Emoluments and Fees 13,992,800 8,692,800 7,992,800 8,692,800
Auditor’s remuneration - Statutory Audit 1,620,000 2,477,000 775,000 737,000
- Non Audit services 2,491,520 2,285,015 203,990 85,015
Legal Expenses 924,276 92,066 924,276 92,066
Depreciation on Property, Plant & Equipment 31,179,800 24,007,245 14,797,872 13,321,196
Amortisation 1,317,474 545,364 76,267 76,267
Personnel Costs ( Note 13.1) 164,170,836 131,116,568 78,722,957 70,845,105
Bad debt written off 141,433 500,000 141,433 -
Impairment of Trade Receivable - 1,622,969 - -
13.1 Personnel Cost
Salaries,WagesandOtherrelatedcosts 143,221,042 113,998,795 67,735,359 60,830,388
Defined Benefit Plan Cost - Retirement Gratuity 5,683,847 4,810,154 3,722,854 3,582,443
Defined Contribution Plan - EPF & ETF 15,265,947 12,307,619 7,264,744 6,432,274
164,170,836 131,116,568 78,722,957 70,845,105
14 INCOME TAX EXPENSE
14.1 Current Tax
In accordance with the provisions of the Inland Revenue Act No. 10 of 2006 and amendments there to, the Company and its Subsidiary
is liable for Income Tax at 28% on its taxable profit.
14.2 Current Income Tax
Taxation on current year profits (Note 14.4) 109,786,096 124,270,181 95,147,912 89,727,776
Under provision of previous year - 49,297 - 49,297
Origination of deferred tax assets / liabilities (14.7) 2,581,080 2,514,505 1,536,345 778,972
Income Tax Expenses charged to Profit or Loss 112,367,176 126,833,983 96,684,257 90,556,045
Tax on Other Comprehensive Income (177,359) (206,829) (121,768) (206,829)
Net Tax Expenses Charged to Statement of Profit or Loss and Other
Comprehensive Income 112,189,817 126,627,154 96,562,489 90,349,216
14.2.1 Net Tax Expense charged to Statement of Profit or Loss and other Comprehensive Income
Income Tax Expense 112,367,176 126,833,983 96,684,257 90,556,045
Tax on Other Comprehensive Income (177,359) (206,829) (121,768) (206,829)
112,189,817 126,627,154 96,562,489 90,349,216

SATHOSA MOTORS PLC | Annual Report 2014/1562
Group Company
For the year ended 31 March, 2015 2014 2015 2014
Rs. Rs. Rs. Rs.
Restated
14.3 Deferred Tax charged to
Profit and Loss 2,581,080 2,514,505 1,536,345 778,972
Other Comprehensive Income (177,359) (206,829) (121,768) (206,829)
2,403,721 2,307,676 1,414,577 572,143
14.4 Reconciliation between Accounting Profit and Taxable Profit
Accounting Profit Before Income Tax Expense 382,171,983 415,066,940 349,652,287 322,327,188
Aggregated Disallowable Items 71,633,885 81,088,641 37,548,002 38,166,198
Aggregated Allowable Items (55,892,410) (50,965,524) (41,566,060) (38,669,062)
Aggregated Disallowable Income (17,834,664) (2,473,384) (17,834,664) (2,473,384)
Income from Other Sources 12,014,410 1,105,403 12,014,410 1,105,403
Total statutory Income 392,093,204 443,822,076 339,813,975 320,456,343
Statutory Tax Rate 28% 28% 28% 28%
- - - -
Current Tax Expense 109,786,096 124,270,181 95,147,912 89,727,776
Notes to the Financial Statements

6314
.5Re
conc
iliat
ion
of e
ffec
tive
tax
rate
Gro
up
Com
pany
For t
he y
ear e
nded
31
Mar
ch,
2015
2014
2015
2014
Rs.
Rs.
Rs.
Rs.
Res
tate
d
Prof
it fo
r the
yea
r 2
69,8
04,8
07
288
,232
,957
2
52,9
68,0
30
231
,771
,143
Tota
l tax
exp
ense
s 1
12,3
67,1
76
126
,833
,983
9
6,68
4,25
7 9
0,55
6,04
5
Prof
it ex
clud
ing
tax
382
,171
,983
4
15,0
66,9
40
349
,652
,287
3
22,3
27,1
88
Tax
usin
g co
mpa
ny's
dom
estic
tax
rate
28.0
0% 1
07,0
08,1
55
28.0
0% 1
16,2
18,7
43
28.0
0% 9
7,90
2,64
0 28
.00%
90,
251,
613
Non
ded
uctib
le e
xpen
ses
5.25
% 2
0,05
7,48
7 5.
47%
22,
704,
819
3.01
% 1
0,51
3,44
1 3.
32%
10,
686,
535
Ded
uctib
le e
xpen
ses
-4.0
9% (1
5,64
9,87
5)-3
.44%
(14,
270,
347)
-3.3
3% (1
1,63
8,49
7)-3
.36%
(10,
827,
337)
Tax
exem
pt in
com
e-1
.31%
(4,9
93,7
06)
-0.1
7% (6
92,5
48)
-1.4
3% (4
,993
,707
)-0
.21%
(692
,548
)
Inco
me
from
oth
er s
ourc
es0.
88%
3,3
64,0
35
0.07
% 3
09,5
13
0.96
% 3
,364
,035
0.
10%
309
,513
Cha
nge
in re
cogn
ized
ded
uctib
le te
mpo
rary
diff
eren
ces
0.68
% 2
,581
,080
0.
61%
2,5
14,5
05
0.44
% 1
,536
,345
0.
24%
778
,972
Ove
r pro
visi
on in
resp
ect o
f pre
viou
s ye
ar0.
00%
-
0.01
% 4
9,29
7 0.
00%
-
0.02
% 4
9,29
7
29.4
1% 1
12,3
67,1
76
30.5
5% 1
26,8
33,9
83
27.6
5% 9
6,68
4,25
7 28
.11%
90,
556,
045
G
roup
Com
pany
For t
he y
ear e
nded
31
Mar
ch,
2015
2014
2015
2014
Rs.
Rs.
Rs.
Rs.
Res
tate
d
14.6
Def
erre
d Ta
x Li
abili
ties
Bala
nce
at th
e be
ginn
ing
of th
e ye
ar 3
,615
,883
1
,308
,207
1
,880
,350
1
,308
,207
Cha
rge
/ (R
ever
sal)f
or th
e ye
ar 2
,403
,721
2
,307
,676
1
,414
,577
5
72,1
43
Bala
nce
at th
e en
d of
the
year
6,0
19,6
04
3,6
15,8
83
3,2
94,9
27
1,8
80,3
50
Def
erre
d Ta
x (a
sset
)/lia
bilit
y as
at t
he y
ear e
nd is
mad
e up
of t
he fo
llow
ing
Prop
erty
,Pla
nt a
nd E
quip
men
t 1
3,30
6,94
6 9
,559
,482
9
,633
,840
7
,480
,190
Retir
emen
t Ben
efit
Obl
igat
ions
(7,2
87,3
42)
(5,9
43,5
99)
(6,3
38,9
13)
(5,5
99,8
40)
Prov
isio
n fo
r Bad
Deb
tors
-
-
-
-
6,0
19,6
04
3,6
15,8
83
3,2
94,9
27
1,8
80,3
50

SATHOSA MOTORS PLC | Annual Report 2014/156414
.7M
ovem
ent o
n D
efer
red
tax
(Ass
et)/
Lia
bilit
ies
Rest
ated
GRO
UP
Bala
nce
as a
t 01
.04.
20 1
4Re
cogn
ized
in
Prof
it or
Loss
Reco
gniz
ed
in O
ther
co
mpr
ehen
sive
inco
me
Bala
nce
as a
t 31
.03.
2014
Reco
gniz
ed in
Pr
ofit
or Lo
ss
Reco
gniz
ed
in O
ther
co
mpr
ehen
sive
inco
me
Bala
nce
as a
t 31
.03.
2015
Rs.
Rs.
Rs.
Rs.
Rs.
Rs.
Rs.
Prop
erty
Pla
nt a
nd e
quip
men
t/ In
vest
men
t pro
pert
y 6
,738
,305
2,8
21,1
77 -
9,5
59,4
82 3
,747
,463
- 1
3,30
6,94
6
Retir
emen
t Ben
efit
Obl
igat
ions
(5,4
30,0
98)
(306
,672
) (2
06,8
29)
(5,9
43,5
99)
(1,1
66,3
83)
(177
,359
) (7
,287
,342
)
1,3
08,2
07 2
,514
,505
(206
,829
) 3
,615
,883
2,5
81,0
80 (1
77,3
59)
6,0
19,6
04
COM
PAN
YBa
lanc
e as
at
31.0
3.20
14Re
cogn
ized
in
Prof
it or
Loss
Reco
gniz
ed
in O
ther
co
mpr
ehen
sive
inco
me
Bala
nce
as a
t 31
.03.
2014
Reco
gniz
ed in
Pr
ofit
or Lo
ss
Reco
gniz
ed
in O
ther
co
mpr
ehen
sive
inco
me
Bala
nce
as a
t 31
.03.
2015
Rs.
Rs.
Rs.
Rs.
Rs.
Rs.
Prop
erty
Pla
nt a
nd e
quip
men
t/ In
vest
men
t pro
pert
y 6
,738
,305
741
,885
- 7
,480
,190
2,1
53,6
50 -
9,6
33,8
40
Retir
emen
t Ben
efit
Obl
igat
ions
(5,4
30,0
98)
37,
087
(206
,829
) (5
,599
,840
) (6
17,3
05)
(121
,768
) (6
,338
,913
)
1,3
08,2
07 7
78,9
72 (2
06,8
29)
1,8
80,3
50 1
,536
,345
(121
,768
) 3
,294
,927
15EA
RNIN
GS
PER
SHA
RE A
ND
DIV
IDEN
D P
ER S
HA
RE
Basi
c Ea
rnin
gs p
er S
hare
Basi
c Ea
rnin
gs p
er S
hare
has
bee
n ca
lcul
ated
by
divi
ding
pro
fit a
ttrib
utab
le t
o eq
uity
hol
ders
of
Sath
osa
Mot
ors
PLC
, by
wei
ghte
d av
erag
e nu
mbe
r of
ord
inar
y sh
ares
outs
tand
ing
durin
g th
e ye
ar.
Dilu
ted
Earn
ings
per
Sha
re
Dilu
ted
Earn
ings
per
Sha
re is
det
erm
ined
by
adju
stin
g th
e pr
ofit
or lo
ss a
ttrib
utab
le t
o or
dina
ry s
hare
hol
ders
and
the
wei
ghte
d av
erag
e nu
mbe
r of
ord
inar
y sh
ares
outs
tand
ing
for t
he e
ffect
s of
all
dilu
tive
pote
ntia
l ord
inar
y sh
ares
.
As
ther
e w
ere
no p
oten
tial D
ilutiv
e O
rdin
ary
Shar
es o
utst
andi
ng a
s at
the
year
end
, Dilu
ted
Earn
ings
per
Sha
re is
equ
al to
Bas
ic E
arni
ngs
per S
hare
.
Notes to the Financial Statements
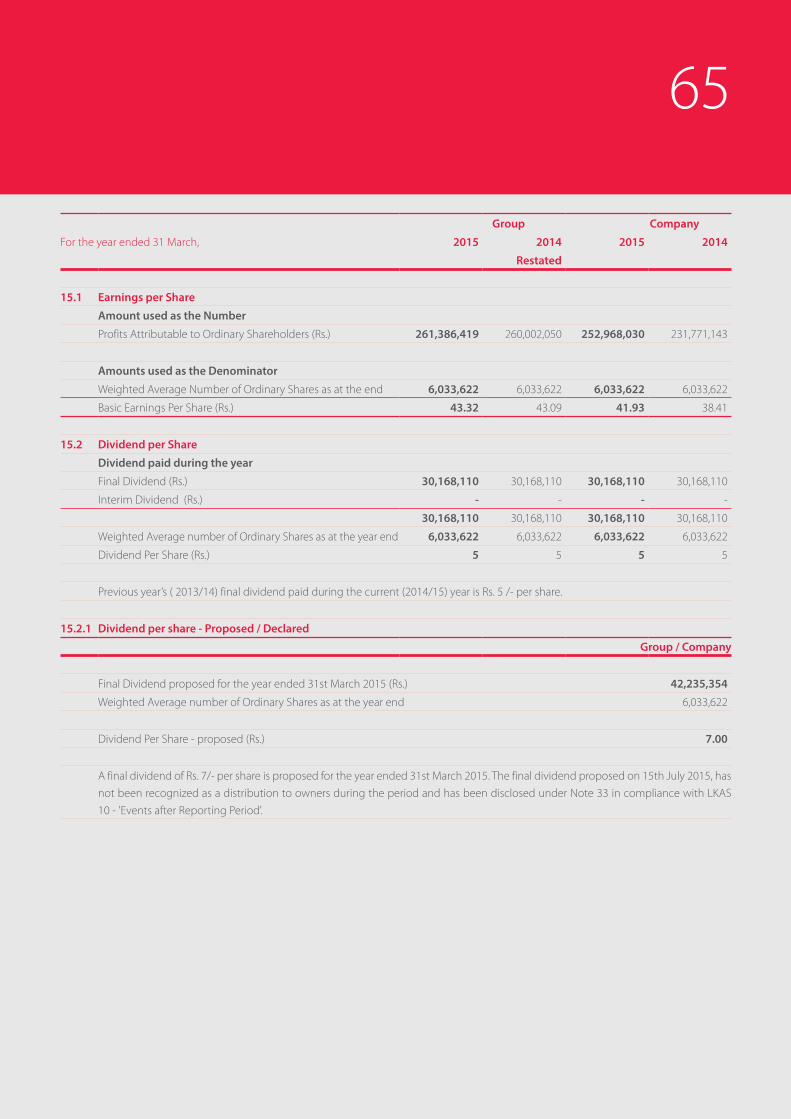
65
Group Company
For the year ended 31 March, 2015 2014 2015 2014
Restated
15.1 Earnings per Share
Amount used as the Number
Profits Attributable to Ordinary Shareholders (Rs.) 261,386,419 260,002,050 252,968,030 231,771,143
Amounts used as the Denominator
WeightedAverageNumberofOrdinarySharesasattheend 6,033,622 6,033,622 6,033,622 6,033,622
Basic Earnings Per Share (Rs.) 43.32 43.09 41.93 38.41
15.2 Dividend per Share
Dividend paid during the year
Final Dividend (Rs.) 30,168,110 30,168,110 30,168,110 30,168,110
Interim Dividend (Rs.) - - - -
30,168,110 30,168,110 30,168,110 30,168,110
WeightedAveragenumberofOrdinarySharesasattheyearend 6,033,622 6,033,622 6,033,622 6,033,622
Dividend Per Share (Rs.) 5 5 5 5
Previous year’s ( 2013/14) final dividend paid during the current (2014/15) year is Rs. 5 /- per share.
15.2.1 Dividend per share - Proposed / Declared
Group / Company
Final Dividend proposed for the year ended 31st March 2015 (Rs.) 42,235,354
WeightedAveragenumberofOrdinarySharesasattheyearend 6,033,622
Dividend Per Share - proposed (Rs.) 7.00
A final dividend of Rs. 7/- per share is proposed for the year ended 31st March 2015. The final dividend proposed on 15th July 2015, has
not been recognized as a distribution to owners during the period and has been disclosed under Note 33 in compliance with LKAS
10 - 'Events after Reporting Period'.

SATHOSA MOTORS PLC | Annual Report 2014/156616
PRO
PERT
Y PL
AN
T &
EQ
UIP
MEN
TS
16.1
GRO
UP
Rest
ated
Cost
Build
ing
onM
achi
nery
Wor
ksho
pM
otor
Furn
iture
Off
ice
Com
pute
rCa
pita
l Wor
kTo
tal
Leas
ehol
dan
dH
and
Vehi
cles
and
Equi
pmen
tsIn
Pro
gres
s
Land
Oth
ers
Tool
sFi
ttin
gs
Rs.
Rs.
Rs.
Rs.
Rs.
Rs.
Rs.
Rs.
Rs.
Free
hold
Ass
ets
Bala
nce
as a
t 01
Apr
il 20
14 5
5,44
8,41
4 3
5,90
7,43
2 6
,998
,593
119
,635
,828
22,
476,
142
10,
645,
860
23,
583,
992
25,
775,
000
300
,471
,261
Add
ition
s du
ring
the
year
- 2
,990
,878
190
,148
31,
122,
000
1,6
86,3
18 2
,842
,555
1,4
30,1
60 1
50,1
42,5
76 1
90,4
04,6
35
Dis
posa
ls d
urin
g th
e ye
ar -
- -
(22,
501,
270)
- -
- -
(22,
501,
270)
Bala
nce
as a
t 31
Mar
ch 2
015
55,
448,
414
38,
898,
310
7,1
88,7
41 1
28,2
56,5
58 2
4,16
2,46
0 1
3,48
8,41
5 2
5,01
4,15
2 1
75,9
17,5
76 4
68,3
74,6
26
Free
hold
Ass
ets
Acc
umul
ated
Dep
reci
atio
n
Bala
nce
as a
t 01
Apr
il 20
14 3
5,28
6,76
6 1
2,20
3,74
6 3
,633
,668
40,
216,
731
8,0
22,8
87 8
,899
,259
18,
943,
770
- 1
27,2
06,8
27
Cha
rge
for t
he y
ear
595
,003
4,0
99,9
96 1
46,2
10 2
0,62
0,94
9 3
,456
,194
777
,413
1,4
84,0
35 -
31,
179,
800
Dis
posa
ls d
urin
g th
e ye
ar -
- -
(22,
501,
270)
- -
- -
(22,
501,
270)
Bala
nce
as a
t 31
Mar
ch 2
015
35,
881,
769
16,
303,
742
3,7
79,8
78 3
8,33
6,41
0 1
1,47
9,08
1 9
,676
,672
20,
427,
805
- 1
35,8
85,3
57
Carr
ying
Val
ue
Bala
nce
as a
t 31
Mar
ch 2
015
19,
566,
645
22,
594,
568
3,4
08,8
63 8
9,92
0,14
8 1
2,68
3,37
9 3
,811
,743
4,5
86,3
47 1
75,9
17,5
76 3
32,4
89,2
69
Bala
nce
as a
t 31
Mar
ch 2
014
20,
161,
648
23,
703,
686
3,3
64,9
25 7
9,41
9,09
7 1
4,45
3,25
5 1
,746
,601
4,6
40,2
22 2
5,77
5,00
0 1
73,2
64,4
34
Notes to the Financial Statements
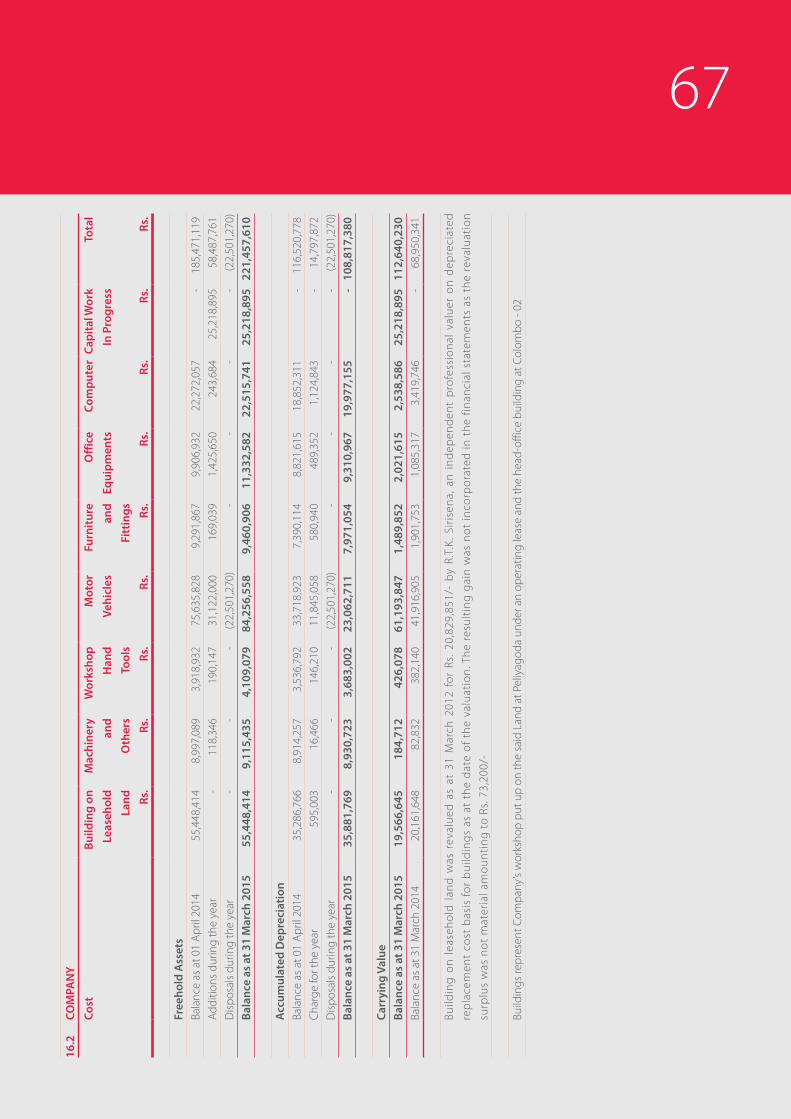
6716
.2CO
MPA
NY
Cost
Build
ing
onM
achi
nery
Wor
ksho
pM
otor
Furn
iture
Off
ice
Com
pute
rCa
pita
l Wor
kTo
tal
Leas
ehol
dan
dH
and
Vehi
cles
and
Equi
pmen
tsIn
Pro
gres
s
Land
Oth
ers
Tool
sFi
ttin
gs
Rs.
Rs.
Rs.
Rs.
Rs.
Rs.
Rs.
Rs.
Rs.
Free
hold
Ass
ets
Bala
nce
as a
t 01
Apr
il 20
14 5
5,44
8,41
4 8
,997
,089
3,9
18,9
32 7
5,63
5,82
8 9
,291
,867
9,9
06,9
32 2
2,27
2,05
7 -
185
,471
,119
Add
ition
s du
ring
the
year
- 1
18,3
46 1
90,1
47 3
1,12
2,00
0 1
69,0
39 1
,425
,650
243
,684
25,
218,
895
58,
487,
761
Dis
posa
ls d
urin
g th
e ye
ar -
- -
(22,
501,
270)
- -
- -
(22,
501,
270)
Bala
nce
as a
t 31
Mar
ch 2
015
55,
448,
414
9,1
15,4
35 4
,109
,079
84,
256,
558
9,4
60,9
06 1
1,33
2,58
2 2
2,51
5,74
1 2
5,21
8,89
5 2
21,4
57,6
10
Acc
umul
ated
Dep
reci
atio
nBa
lanc
e as
at 0
1 A
pril
2014
35,
286,
766
8,9
14,2
57 3
,536
,792
33,
718,
923
7,3
90,1
14 8
,821
,615
18,
852,
311
- 1
16,5
20,7
78C
harg
e fo
r the
yea
r 5
95,0
03 1
6,46
6 1
46,2
10 1
1,84
5,05
8 5
80,9
40 4
89,3
52 1
,124
,843
- 1
4,79
7,87
2D
ispo
sals
dur
ing
the
year
- -
-(2
2,50
1,27
0) -
- -
-(2
2,50
1,27
0)Ba
lanc
e as
at 3
1 M
arch
201
5 3
5,88
1,76
9 8
,930
,723
3,6
83,0
02 2
3,06
2,71
1 7
,971
,054
9,3
10,9
67 1
9,97
7,15
5 -
108
,817
,380
Carr
ying
Val
ueBa
lanc
e as
at 3
1 M
arch
201
5 1
9,56
6,64
5 1
84,7
12 4
26,0
78 6
1,19
3,84
7 1
,489
,852
2,0
21,6
15 2
,538
,586
25,
218,
895
112
,640
,230
Bala
nce
as a
t 31
Mar
ch 2
014
20,
161,
648
82,
832
382
,140
41,
916,
905
1,9
01,7
53 1
,085
,317
3,4
19,7
46 -
68,
950,
341
Build
ing
on
lea
seh
old
lan
d w
as r
eval
ued
as
at 3
1 M
arch
201
2 fo
r Rs
. 20
,829
,851
/- b
y R.
T.K.
Sir
isen
a, a
n i
nd
epen
den
t p
rofe
ssio
nal
val
uer
on
dep
reci
ated
rep
lace
men
t co
st b
asis
fo
r b
uild
ing
s as
at
the
dat
e o
f th
e va
luat
ion
. Th
e re
sult
ing
gai
n w
as n
ot
inco
rpo
rate
d in
th
e fin
anci
al s
tate
men
ts a
s th
e re
valu
atio
n
surp
lus
was
no
t m
ater
ial a
mo
un
tin
g t
o R
s. 7
3,20
0/-
Build
ings
repr
esen
t Com
pany
’s w
orks
hop
put u
p on
the
said
Lan
d at
Pel
iyag
oda
unde
r an
oper
atin
g le
ase
and
the
head
-offi
ce b
uild
ing
at C
olom
bo -
02

SATHOSA MOTORS PLC | Annual Report 2014/1568
Group
As at 31 March, 2015 2014
Rs. Rs.
Restated
17 INTANGIBLE ASSETSCostAs at 1st April 6,206,040 -Addition during the year - 6,206,040As at 31st March 6,206,040 6,206,040
Accumulated AmortizationAs at 1st April 469,098 -Amortization during the year 1,241,208 469,098As at 31st March 1,710,306 469,098Carrying Value as at 31st March 4,495,734 5,736,942
18 PREPAID LEASE PAYMENTS
Group Company
2015 2014 2015 2014
Rs. Rs. Rs. Rs.
CostAs at 1st April 7,550,366 7,550,366 7,550,366 7,550,366Closing Balance as at 31st March 7,550,366 7,550,366 7,550,366 7,550,366
Accumulated AmortizationAs at 1st April 2,035,290 1,959,023 2,035,290 1,959,023Charge for the year 76,267 76,267 76,267 76,267As at 31st March 2,111,557 2,035,290 2,111,557 2,035,290Carrying Value 5,438,809 5,515,076 5,438,809 5,515,076
Prepaid Lease Payments disclosed above relate to the land at Peliyagoda acquired on a 99 years operating lease commencing from
1987. Remaining lease period as at 31st March 2015 is 71 years.
Group Company
2015 2014 2015 2014
Rs. Rs. Rs. Rs.
19 INVESTMENT PROPERTYBalance at 1st April 24,191,513 21,683,401 24,191,513 21,683,401Acquisitions - 2,508,112 - 2,508,112Depreciation - - - -Balance at 31st March 24,191,513 24,191,513 24,191,513 24,191,513
Investment Property comprises building leased to Avonsmart Engineering (Pvt) Ltd, with effect from 1st May 2013. During the year
Directors' valuation was carried out for the Investment Property and the Directors are of the view that no significant change has
occurred on the value of the property as at the reporting date.The total land extent is 343.93 perches. There are 2 buildings for which the description is stated below.1. SML workshop - 1 building - owner/user2. Rented out - 1 building - Investment property
Notes to the Financial Statements

69
Company
2015 2014
% Holding No.of shares Cost (Rs.) No.of shares Cost (Rs.)
20 INVESTMENT IN SUBSIDIARY COMPANY
SML Frontier Automotive (Pvt) Ltd. 50% 6,500,002 65,000,020 6,500,002 65,000,000
6,500,002 65,000,020 6,500,002 65,000,000
21 INVENTORIES
Group Company
As at 31 March, 2015 2014 2015 2014
Rs. Rs. Rs. Rs.
Restated
New Vehicles 679,614,547 337,459,681 658,114,547 326,459,681
Spare Parts 182,897,693 156,520,745 81,476,513 95,534,881
WorkinProgress 18,966,553 23,841,074 3,496,600 3,955,073
Goods in Transit 120,332,661 154,126,573 105,605,438 140,835,263
General Stores 28,672,543 19,839,365 3,001,851 580,671
Machinery - 56,216,449 - 56,216,449
1,030,483,997 748,003,887 851,694,949 623,582,018
Provision for Inventories (3,071,848) (1,182,086) (3,071,848) (1,182,086)
1,027,412,149 746,821,801 848,623,101 622,399,932
22 TRADE AND OTHER RECEIVABLES
Trade Receivables - New Vehicles 652,434,096 655,319,646 542,619,469 655,319,646
- Spare Parts 29,265,367 114,649,646 29,265,367 22,697,901
-WorkShop 21,839,959 23,097,665 21,839,959 23,097,665
703,539,422 793,066,957 593,724,795 701,115,212
Provision for Bad and Doubtful Debts (2,463,882) (2,463,882) (840,913) (840,913)
701,075,540 790,603,075 592,883,882 700,274,299
Loans to Employees (Note 22.1) 1,575,535 1,718,208 1,406,034 1,361,208
Other Debtors 71,457,473 77,840,762 19,150,432 20,086,266
Deposits and Prepayments 2,715,946 6,232,946 2,715,946 6,219,946
WithholdingTaxRecoverable 2,591,958 1,594,675 2,591,958 1,456,121
VAT Receivable 8,901,127 12,940,402 8,901,127 12,940,402
Advances 48,079,248 56,531,772 - -
Advances to suppliers 10,998,660 16,837,239 - -
ESC Receivable - 1,372,244 - -
Bank Guarantee - 2,805,274 - -
847,395,487 968,476,597 627,649,379 742,338,242

SATHOSA MOTORS PLC | Annual Report 2014/1570
22.1 Loans to Employees
Group Company
As at 31 March, 2015 2014 2015 2014
Rs. Rs. Rs. Rs.
Restated
Balance at the beginning of the year 1,718,208 1,815,744 1,361,208 1,815,744
Loans Granted during the year 651,500 657,000 651,500 300,000
2,369,708 2,472,744 2,012,708 2,115,744
Repayments during the year (794,174) (754,536) (606,674) (754,536)
Balance at the end of the year 1,575,534 1,718,208 1,406,034 1,361,208
23 AMOUNT DUE FROM RELATED PARTIES
Group
As at 31 March, 2015 2014
Rs. Rs.
Restated
Frontier Automotive (Pvt) Ltd. 72,860,056 26,320,201
Mr. Sheran Fernando 65,902 109,620
72,925,958 26,429,821
24 CASH AND CASH EQUIVALENTS
Group Company
As at 31 March, 2015 2014 2015 2014
Rs. Rs. Rs. Rs.
Restated
24.1 Favourable Balance
Overnight Repos and Short Term Fixed Deposits 57,682,634 1,559,819 57,682,634 1,559,819
Cash in hand 1,395,416 1,389,807 - -
Cash at Bank 27,814,379 21,922,860 25,692,067 21,881,377
86,892,429 24,872,486 83,374,701 23,441,196
24.2 Unfavourable Balance
Bank Overdraft (41,833,247) (18,648,334) - -
Cash and Cash Equivalents for the purpose of Cash Flow Statement 45,059,182 6,224,152 83,374,701 23,441,196
25 STATED CAPITAL
6,033,622 Ordinary Shares 115,924,290 115,924,290 115,924,290 115,924,290
Notes to the Financial Statements

71
The holders of Ordinary Shares are entitled to receive dividends as declared from time to time and are entitled to one vote per share at
meetings of the Company. All shares rank equally with regard to the Company's residual assets.
26 INTEREST-BEARING BORROWINGS
Group
2015 2014
Rs. Rs.
Restated
Payable within One Year
Term Loan 11,900,000 -
Import Loan 63,900,000 -
Import Demand Loan 63,221,939 58,876,643
139,021,939 58,876,643
Payable after One Year
Term Loan 74,300,000 -
Details of all loans and facilities outstanding together with the related securities offered as at the reporting date are set out below;
Institution and Facility Principal Amount (Rs.) Repayment terms & Interest Rate
Security offered
NDB
Bank Overdraft 25,000,000 Interest rate of 13.5%Corporate Guarantee from
Sathosa Motors PLC for
Rs. 200,000,000/-
Bank Loan 63,900,000 Interest rate 12.5%
Import Loan 150,000,000 Interest rate 13%
Guarantee 50,000,000 Interest rate 1.5%
HNB
Bank Loan 100,000,000 AWPLR+2%(Renewmonthly) Corporate Guarantee from
Sathosa Motors PLC
Rs. 100,000,000/-
27 ASSETS RELATED GRANTS
Group Company
2015 2014 2015 2014
Rs. Rs. Rs. Rs.
Balance at the beginning of the year 6,801,041 7,020,430 6,801,041 7,020,430
Amortisation for the year (219,389) (219,389) (219,389) (219,389)
Balance at the end of the year 6,581,652 6,801,041 6,581,652 6,801,041
The above represents the grants received for the construction of workshop at Peliyagoda and are amortised over a period of fifty (50)
years.

SATHOSA MOTORS PLC | Annual Report 2014/1572
28 EMPLOYEE BENEFITS
Group Company
As at 31 March, 2015 2014 2015 2014
Rs. Rs. Rs. Rs.
Restated
28.1 Net Liability Recognised in the Statement of Financial Position
Balance at the beginning of the year 21,227,139 19,393,209 19,999,428 19,393,209
Charge for the year 6,317,271 5,548,830 4,157,739 4,321,119
Payments during the year (1,518,191) (3,714,900) (1,518,191) (3,714,900)
Balance at the end of the year 26,026,219 21,227,139 22,638,976 19,999,428
28.2 The amount Recognised in the Profit or Loss
Service Cost 3,568,640 2,676,901 1,722,911 1,449,190
Net interest on the net defined benefit liability 2,115,207 2,133,253 1,999,943 2,133,253
5,683,847 4,810,154 3,722,854 3,582,443
28.3 The amount Recognised in Other Comprehensive Income
Actuarial Losses 633,424 738,676 434,885 738,676
28.4 Employee Benefits Obligation Reconciliation
Balance at the beginning of the year 21,227,139 19,393,209 19,999,428 19,393,209
Current service cost 3,568,640 2,676,901 1,722,911 1,449,190
Interest cost 2,115,207 2,133,253 1,999,943 2,133,253
Actuarial Losses 633,424 738,676 434,885 738,676
Benefits paid during the year (1,518,191) (3,714,900) (1,518,191) (3,714,900)
Balance at the end of the year 26,026,219 21,227,139 22,638,976 19,999,428
An actuarial valuation of the provision for employee benefits was carried out as at 31st March 2015 by Mr. Munisamy
Poopalannathan, Messrs Actuarial & Management Consultants (Pvt) Limited - a firm of professional actuaries. The valuation
method used by the actuaries to value the employee benefits obligation is the ''Projected Unit Credit (PUC) method'', the
method recommended by the Sri Lanka Accounting Standard (LKAS 19) '' Employee Benefits''.
28.5 Principal assumptions used
a) Discount Rate 10% 10% 10% 10%
b) Salary Increase 10% 10% 10% 10%
c) Retirement Age 55 Years 55 Years 55 Years 55 Years
Notes to the Financial Statements

73
Sensitivity Analysis
Sensitivity to a reasonably possible change in the key assumptions employed with all other variables held constant in the Employee
Benefit Liability measurement.
Group Company
As at 31 March, 2015 2014 2015 2014
Rs. Rs. Rs. Rs.
Discount Rate Present Value of Defined Benefit Obligation
Rs.
Present Value of Defined Benefit Obligation
Rs.
1% less 27,211,221 20,994,974 23,557,349 20,994,9741% More 22,582,015 19,092,828 21,796,208 19,092,828
Salary Escalation Rate1% less 22,415,382 19,023,612 21,740,484 19,023,6121% More 27,258,068 21,053,784 23,604,196 21,053,784
Group Company
As at 31 March, 2015 2014 2015 2014
Rs. Rs. Rs. Rs.
Restated
29 DEFERRED TAX LIABILITYBalance at the beginning of the year 3,615,883 1,308,207 1,880,350 1,308,207Charge/(Reversal) for the year 2,403,721 2,307,676 1,414,577 572,143Balance at the end of the year 6,019,604 3,615,883 3,294,927 1,880,350
29.1 (Reversal) / Origination during the year(Reversal) / origination to income tax expenses 2,581,080 2,514,505 1,536,345 778,972(Reversal) / origination to other comprehensive income (177,359) (206,829) (121,768) (206,829)
2,403,721 2,307,676 1,414,577 572,143
30 TRADE AND OTHER PAYABLESAccrued Expenses 22,036,309 27,047,196 18,130,088 17,811,658Trade and Sundry Creditors 34,101,071 5,869,163 10,190,661 5,869,163Trade Payable - ITOCHU Corporation 550,613,162 542,429,300 550,613,162 520,013,369Advances and Retentions 14,833,681 15,035,075 14,833,681 15,035,075VAT Payable 6,795,971 6,640,846 - -Advance Received for Vehicles 97,421,877 87,443,407 - -Advance Received for Parts 10,093,919 8,460,244 - -NBT Payable 4,971,110 3,265,106 - -ESC Payable - 1,372,244 - -Provision for warranty 12,672,989 15,634,000 - -Payable to Guava International 38,730,393 33,753,024 - -Other Payable - 3,634,255 - -
792,270,482 750,583,860 593,767,592 558,729,265

SATHOSA MOTORS PLC | Annual Report 2014/1574
31 AMOUNT DUE TO RELATED PARTIES
Group
As at 31 March, 2015 2014
Rs. Rs.
Restated
Reprographics (Pvt) Ltd. 17,760 128,800
Mr. Sheran Fernando - 163,251
Mrs. Roshini Fernando - 139,462
Access Engineering PLC 977,620 -
AccessNaturalWater(Pvt)Ltd. 38,963 -
1,034,343 431,513
32 CONTINGENT LIABILITIES
Outcome of the current / pending litigation cases are as follows;
32.1 Labour Tribunal cases against the Company
W.A.SiriwardanevsSathosaMotorsPLC(Ref-Ct.78(25))
TheaboveapplicationwasfiledintheLabourTribunalbyanex-employeeMr.WASiriwardenawhowasadriveroftheCompanyfor
terminating his services. He seeks reinstatement in service, monthly salary inclusive of the relevant allowances pending reinstatement
in service. The Company filed answer on 25th June 2009. The Company is vehemently resisting the claim. The further trial is fixed for
29th May 2012. The trial is now concluded. The Tribunal has granted 6th May 2013 for filing of written submissions of both parties.
As the new judge was sitting the tribunal on the 6th May 2013 the Court reserved the date of delivering the Order. The Order was
deliveredon25thAugust2013andtheapplicationofMr.WA.Siriwardanewasdismissed.Thelawyershavenotbeennotifiedofany
appeal. As regards any gratuity dues, these would be payable according to law.
Mr.W.A.SiriwardenaappealedtotheHighCourtofColomboandtheargumentoftheappealisfixedfor27.07.2015.
Notes to the Financial Statements

75
32.2 Other Litigation cases against the Company
Consumer Affairs Authority Vs. Sathosa Motors PLC (Ref - Cg.78(36))
The above application was filed by Ms. C N Thilakarathne , Directress of the consumer Affairs and information complaining that the
company had published an advertisement in Lankadeepa Newspaper dated 02nd October 2013 in violation of Gazette Extraordinary
No. 1687/45 of 07th January 2011 by omitting to mention the retail prices of the vehicles when advertising. The Court issued summons
to appear in Court on 29th April 2014. On 29th April 2014 the Company pleaded not guilty and the trial has now been fixed.
However subsequent to the reporting date this case was dismissed.
32.3 Corporate Guarantee
Sathosa Motors PLC has issued Corporate Guarantees on behalf of its Subsidiary amounting to Rs. 300,000,000/- as at the reporting date.
Name of the Company Relationship Performance Rs.
RefundRs.
Miscellaneous Rs.
TotalRs.
SML Frontier Automotive (Private) Limited Subsidiary - - 300,000,000 300,000,000
- - 300,000,000 300,000,000
33 EVENTS OCCURRING AFTER THE REPORTING DATE
Pursuant to a resolution adopted on 15th July 2015, the Board of Directors of the Company approved the payment of a final dividend
of Rs. 7/- per share for the year ended 31st March 2015 (2014 Rs. 5/- per share).
As required by Section 56 (2) of the Companies Act No. 07 of 2007, the Board of Directors has confirmed that the Company satisfies the
solvency test in accordance with Section 57 of the Companies Act No. 07 of 2007, and has obtained concurrence from auditors, prior
to declaration of dividends.
In accordance with LKAS 10 “Events occurring after the Reporting Date”, this proposed dividend has not been recognised as a liability
as at the date of Statement of Financial Position.
Except for the above there were no material events occurring after the reporting date that require adjustments to or disclosure in the
Financial Statements.

SATHOSA MOTORS PLC | Annual Report 2014/1576
34 RELATED PARTY TRANSACTIONS
The Company carries out transactions in the ordinary course of its business with parties who are defined as related parties in LKAS 24
"Related Party Disclosures". The details of related party transactions are reported below.
34.1 Transactions between Related Companies
Name of the company Description
Amount 2014/2015
Rs.
Amount 2013/2014
Rs.
AccessNaturalWater(Pvt)Ltd. Purchase of Mineral water 144,022 119,167
SupplyofWorkshoprepairservices - 101,523
Access International (Pvt) Ltd. SupplyofWorkshoprepairsandsaleofnewvehicles 4,491,781 8,613,526
Access Engineering PLC SupplyofWorkshoprepairsandsaleofMachinery(SANNY),
repair charges of mobile crane 45,010,247 11,996
Reprographics (Pvt) Ltd. Purchase of Photocopy machine & Toners for the Printers 120,855 -
ATSL International (Pvt) Ltd. Construction of the workshop at No.25, Vauxhall Street 23,965,000 -
SML Frontier Automotive (Pvt) Ltd. Vehicle service Charge 32,403 111,532
34.2 Transactions with Key Management Personnel
According to LKAS 24 “Related Party Disclosures”, Key Management Personnel are those having authority and responsibility for planning,
directing and controlling the activities of the entity. Accordingly Board of Directors (including executive and non - executive Directors)
have been classified as Key Management Personnel of the Group.
Fees, emoluments and other benefits paid to Key Management Personnel amounted to Rs. 7.99 Mn (2013/14 Rs.8.69 Mn) for Company
and Rs. 13.99 Mn (2013/2014 Rs. 8.69 Mn) for Group.
There were no material related party transactions other than those disclosed above and in Notes 23 and 31 to the Financial Statements.
Notes to the Financial Statements

7735
Segm
ent R
epor
ting
Rs.0
00
Gro
upSp
are
Part
sVe
hicl
esM
achi
nery
Repa
irs
& S
ervi
ces
Tota
l
Year
End
ed 3
1st M
arch
2014
/201
520
13/2
014
2014
/201
520
13/2
014
2014
/201
520
13/2
014
2014
/201
520
13/2
014
2014
/201
520
13/2
014
In R
s. 0
00In
Rs.
000
In R
s. 0
00In
Rs.
000
In R
s. 0
00In
Rs.
000
In R
s. 0
00In
Rs.
000
In R
s. 0
00In
Rs.
000
Rest
ated
Rest
ated
Rest
ated
Rest
ated
Rest
ated
Reve
nue
499
,990
428
,413
2,5
49,0
98 2
,138
,785
44,
588
- 1
88,3
41 1
85,5
09 3
,282
,017
2,7
52,7
07
Age
ncy
Com
mis
sion
- -
177
,003
259
,128
--
- -
177
,003
259
,128
Tota
l Rev
enue
from
Ext
erna
l 4
99,9
90 4
28,4
13 2
,726
,101
2,3
97,9
13 4
4,58
8 -
188
,341
185
,509
3,4
59,0
20 3
,011
,835
Inte
rnal
-Sal
es-
--
--
- 4
3,49
3 2
9,01
6 4
3,49
3 2
9,01
6
Tota
l Rev
enue
499
,990
428
,413
2,7
26,1
01 2
,397
,913
44,
588
- 2
31,8
34 2
14,5
25 3
,502
,513
3,0
40,8
51
Segm
ent R
esul
ts 1
99,8
44 2
30,2
13 5
45,9
23 4
98,6
48 (1
1,69
8)-
114
,813
117
,644
848
,882
846
,505
Una
lloca
ted
Inco
me
- -
42,
668
25,
741
Una
lloca
ted
Expe
nses
- -
(490
,668
) (4
47,9
66)
Prof
it fr
om O
pera
tion
befo
re F
inan
cing
Cos
t 4
00,8
82 4
24,2
79
Net
Fin
anci
ng C
ost
- -
(18,
710)
(9,2
13)
Prof
it fr
om O
pera
tions
382
,172
415
,066
Inco
me
Tax
Expe
nses
(112
,367
) (1
26,8
34)
Prof
it fr
om O
rdin
ary
Activ
ities
269
,804
288
,232
Capi
tal E
xpen
ditu
re19
0,40
415
7,86
5
Dep
reci
atio
n an
d A
mor
tizat
ion
32,4
9724
,552

SATHOSA MOTORS PLC | Annual Report 2014/157835
.1 S
egm
ent R
epor
ting
Rs.0
00
Com
pany
Spar
e Pa
rts
Vehi
cles
Mac
hine
ryRe
pair
s &
Ser
vice
sTo
tal
Year
End
ed 3
1st M
arch
2014
/201
520
13/2
014
2014
/201
520
13/2
014
2014
/201
520
13/2
014
2014
/201
520
13/2
014
2014
/201
520
13/2
014
In R
s. 0
00In
Rs.
000
In R
s. 0
00In
Rs.
000
In R
s. 0
00In
Rs.
000
In R
s. 0
00In
Rs.
000
In R
s. 0
00In
Rs.
000
Reve
nue
173
,162
154
,425
2,3
57,5
64 2
,119
,999
44,
588
- 1
14,5
66 1
21,9
41 2
,689
,880
2,3
96,3
65
Age
ncy
Com
mis
sion
4,2
09 8
,934
4,2
09 8
,934
Tota
l Rev
enue
from
Ext
erna
l 1
73,1
62 1
54,4
25 2
,361
,773
2,1
28,9
33 4
4,58
8 -
114
,566
121
,941
2,6
94,0
89 2
,405
,299
Inte
rnal
-Sal
es 4
3,49
3 2
9,01
6 4
3,49
3 2
9,01
6
Tota
l Rev
enue
173
,162
154
,425
2,3
61,7
73 2
,128
,933
44,
588
- 1
58,0
59 1
50,9
57 2
,737
,582
2,4
34,3
15
Segm
ent R
esul
ts 8
2,57
8 8
4,34
0 4
15,2
02 3
55,4
41 (1
1,69
8) 8
8,34
3 8
3,80
0 5
74,4
25 5
23,5
81
Una
lloca
ted
Inco
me
38,
997
18,
974
Una
lloca
ted
Expe
nses
(263
,754
) (2
12,8
91)
Prof
it fr
om O
pera
tion
befo
re F
inan
cing
Cos
t 3
49,6
69 3
29,6
64
Net
Fin
anci
ng C
ost
(16)
(7,3
37)
Prof
it fr
om O
pera
tions
349
,652
322
,327
Inco
me
Tax
Expe
nses
(96,
684)
(90,
556)
Prof
it fr
om O
rdin
ary
Activ
ities
252
,968
231
,771
Capi
tal E
xpen
ditu
re 5
8,48
8 4
2,96
5
Dep
reci
atio
n an
d A
mor
tizat
ion
14,
874
13,
397
Notes to the Financial Statements

79
36 NON-CONTROLLING INTEREST (NCI)
Ownership interest held by NCI
Principal place of business
Operating segment 2014/2015 2013/2014
SML Frontier Automotive (Pvt) Ltd Sri Lanka Trading agent 50% 50%
The following is summarised financial information of SML Frontier Automotive (Private) Limited. The information is before inter-
company eliminations.
As at 31st March, 2015 2014
Rs. Rs.
Statement of Profit or Loss and Other Comprehensive Income
Revenue 764,931,269 606,536,333
Profit for the year 16,836,776 56,461,814
Profit attributable to NCI 8,418,388 28,230,907
Other Comprehensive Income (142,948) -
Total Comprehensive Income 16,693,828 56,461,814
Total Comprehensive Income attributable to NCI 8,346,914 28,230,907
Statement of Financial Position
Current assets 474,978,842 378,421,335
Non-current assets 224,344,773 110,051,035
Current liability 415,756,013 299,047,272
Non-current liability 80,411,920 2,963,244
Net asset 203,155,682 186,461,854
Net asset attributable to NCI 101,577,841 93,230,927
Statement of Cash Flows
Cash flow used in operating activities (43,626,899) (84,887,545)
Cash flow used in investing activities (131,916,873) (121,206,182)
Cash flow from financing activities 154,445,297 188,876,683
Net decrease in cash and cash equivalents (21,098,475) (17,217,044)

SATHOSA MOTORS PLC | Annual Report 2014/1580
37 PRIOR YEAR ADJUSTMENTS
The consolidated financial statements for the year ended 31st March 2014 were prepared by amalgamating the Financial statements
of the Company and its Subsidiary, SML Frontier Automotive (Pvt) Ltd (SMLF). However the Financial Statements of SMLF which were
taken for the consolidation purpose was unaudited for the year ended 31st March 2014. The prior year adjustments represent the
effects of the adjustments made to the audited financial statements of SMLF.
Statement of Financial Position Group
As at 31.03.2014
As previously reported Adjustments As Re-stated
Rs. Rs. Rs.
Property, Plant and Equipment 132,796,154 40,468,280 173,264,434
Intangible Assets - 5,736,942 5,736,942
Investment in Debentures 37,290,000 1,195,323 38,485,323
Overall impact on Total Non-current Assets 170,086,154 47,400,545 217,486,699
Inventories 759,443,354 (12,621,553) 746,821,801
Trade and Other Receivables 1,005,369,672 (36,893,074) 968,476,599
Amounts due from Related Parties - 26,429,821 26,429,821
Cash and Cash Equivalents 25,292,092 (419,606) 24,872,486
Overall impact on Total Current Assets 1,790,105,118 (23,504,412) 1,766,600,707
Overall impact on Total Assets 1,989,897,860 23,896,133 2,013,793,993
Retained Earnings 883,008,235 1,199,664 884,207,899
Non-Controlling Interest 92,031,263 1,199,664 93,230,927
Overall impact on Total Equity 975,039,498 2,399,328 977,438,826
Employee Benefits 19,999,428 1,227,711 21,227,139
Deferred Tax Liabilities 1,880,350 1,735,533 3,615,883
Overall impact on Total Non-current Liabilities 21,879,778 2,963,244 24,843,022
Trade and Other Payables 778,524,392 (27,940,532) 750,583,860
Interest Bearing Borrowings - 58,876,643 58,876,643
Amount due to Related Company - 431,513 431,513
Income Tax Payable 74,103,817 (15,194,082) 58,909,735
Bank Overdraft 16,288,335 2,359,999 18,648,334
Overall impact on Total Current Liabilities 868,916,545 18,533,540 887,450,085
Overall impact on Total Equity and Liabilities 1,989,897,860 23,896,133 2,013,793,993
Notes to the Financial Statements

81
Statement of Profit or Loss other Comprehensive Income Group
For the year ended 31.03.2014
As previously reported Adjustments As Re-stated
Rs. Rs. Rs.
Revenue 3,054,001,703 (13,150,108) 3,040,851,595
Cost of Sales (2,209,729,384) 15,383,121 (2,194,346,263)
Overall impact on Gross Profits 844,272,319 2,233,013 846,505,332
Other Income 20,384,871 5,355,894 25,740,765
Expenses (431,142,880) (16,823,265) (447,966,145)
Overall impact on Operating Profits 433,514,310 (9,234,358) 424,279,952
Net Finance Cost (7,388,150) (1,824,862) (9,213,012)
Overall impact on Profit before Tax 426,126,161 (11,059,221) 415,066,940
Income Tax Expense (140,292,531) 13,458,548 (126,833,983)
Overall impact on Profit for the year 285,833,629 2,399,328 288,232,957
Other Comprehensive income, net of tax (531,847) - (531,847)
Total Comprehensive Income for the year, net of tax 285,301,782 2,399,328 287,701,110
38 FINANCIAL INSTRUMENTS
38.1 Financial Assets and Liabilities by categories
Financial Assets and Liabilities in the tables below are split into categories in accordance with LKAS 39
Group
Financial assets by categories Loans & Receivables (L&R) Held to Maturity (HTM)Available for Sale
Financial Assets (AFS)
As at 31st March, 2015 2014 2015 2014 2015 2014
Rs. Rs. Rs. Rs. Rs. Rs.
Financial Instruments in Non current assets
Investment in Debentures 84,113,507 38,485,323
Financial Instruments in current assets
Trade and other receivables 847,395,487 968,476,597
Amounts due from Related Parties 72,925,958 26,429,821
Cash and cash equivalents 29,209,795 23,312,667 57,682,634 1,559,819
Total 949,531,240 1,018,219,085 84,113,507 38,485,323 57,682,634 1,559,819

SATHOSA MOTORS PLC | Annual Report 2014/1582
Group
Financial liabilities by categoriesFinancial Liabilities measured
at Amortised Cost
2015 2014
As at 31st March, Rs. Rs.
Financial Instruments in Non - current liabilitiesInterest Bearing Borrowings 74,300,000 -
Financial Instruments in current liabilitiesTrade and other payables 792,270,482 750,583,860Interest Bearing Borrowings 139,021,939 58,876,643
Amounts due from Related Parties 1,034,343 431,513
Bank Overdraft 41,833,247 18,648,334Total 1,047,425,668 828,540,350
Company
Financial assets by categories Loans & Receivables (L&R) Held to Maturity (HTM)Available for Sale
Financial Assets (AFS)
As at 31st March, 2015 2014 2015 2014 2015 2014
Rs. Rs. Rs. Rs. Rs. Rs.
Financial Instruments in Non current assetsInvestment in Debentures - - 84,113,507 38,485,323 - -
Financial Instruments in current assetsTrade and other receivables 627,649,379 742,338,241 - - - -Cash and cash equivalents 25,692,067 21,881,377 - - 57,682,634 1,559,819Total 653,341,446 764,219,618 84,113,507 38,485,323 57,682,634 1,559,819
Company
Financial liabilities by categoriesFinancial Liabilities
measured at Amortised Cost
2015 2014
As at 31st March, Rs. Rs.
Financial Instruments in Non- current liabilities
Interest Bearing Borrowings - -
Financial Instruments in current liabilities
Trade and other payables 593,767,592 558,729,265
Total 593,767,592 558,729,265
Notes to the Financial Statements

83
The Group has not disclosed the fair value for financial Instruments such as short-term trade receivables and payables, because their
carrying amounts are a reasonable approximation of the fair values.
The Company invested Rs. 84.11 Mn in quoted debentures at fixed interest rate , for which the details are stated below.
Investee TenorInterest Rate PA
Number of stocks Value Maturity in
Years % Rs.
NDB 5 13 372900 38,485,323 2018People's Leasing Co 4 9.625 25600 2,620,757 2018HNB 3 7 422900 43,007,427 2017
84,113,507
Currently the Company has no reason to dispose them in the foreseeable future and the Company's intention is to hold them until
maturity.
38.2 Fair Value Hierarchy
The table below analyses financial instruments carried at fair value, by valuation method.
The different levels have been defined as follows:
Level 1 : quoted prices (unadjusted) in active markets for identical assets or liabilities
Level 2 : inputs other than quoted prices included, within Level 1 that are observable for the asset or liability, either directly (i.e. as
prices) or indirectly (i.e. derived from prices)
Level 3 : inputs other than quoted prices included within Level 1 that are observable for the asset or liability, either directly (i.e. as
prices) or indirectly (i.e. derived from prices)
Group Level 1 Level 2 Level 3 Total
Rs. Rs. Rs. Rs.
As at 31/3/2015Financial investments available for sale Government of Sri
Lanka Treasury Bills - 57,682,634 - 57,682,634
As at 31/3/2014Financial investments available for sale Government of Sri
Lanka Treasury Bills - 1,559,819 - 1,559,819
Company Level 1 Level 2 Level 3 Total
Rs. Rs. Rs. Rs.
As at 31/3/2015Financial investments available for sale Government of Sri
Lanka Treasury Bills - 57,682,634 - 57,682,634
As at 31/3/2014Financial investments available for sale Government of Sri
Lanka Treasury Bills - 1,559,819 - 1,559,819

SATHOSA MOTORS PLC | Annual Report 2014/1584
39 Financial Risk ManagementOverviewThe Group has exposure to the following risks arising from financial instruments:- Credit risk- Liquidity risk- Market risk
This note represents information about the Group’s exposure to each of the above risks, the Group’s objectives policies and processes
for measuring and managing risk.
39.1 Credit Risk
Credit risk is the risk of financial loss to the Group if a customer or counter-party to a financial instrument fails to meet its obligations,and
arises principally from the Group’s receivables from customers and investment securities.
Exposure to Credit Risk
The carrying amount of financial assets represents the maximum credit exposure. The maximum exposure to credit risk at the reporting
date was as follows;
Group Group Company Company
2015 2014 2015 2014
Rs. Rs. Rs. Rs.
Investment in Debentures 84,113,507 38,485,323 84,113,507 38,485,323Trade receivables 703,539,422 793,066,957 593,724,795 701,115,212Other receivables 146,319,947 177,873,522 34,765,497 42,063,943Amounts due from Related Parties 72,925,958 26,429,821 - -Cash and cash equivalents 86,892,429 24,872,486 83,374,701 23,441,196
Age analysis of trade debts as at 31/3/2015 is as follows;
Group Less than 60 daysRs.
61 - 90 daysRs.
91- 180 daysRs.
181- 365 daysRs.
Over 365 daysRs.
TotalRs.
New vehicles 418,463,469 54,700,000 87,968,634 - 1,000,000 562,132,103Spareparts&Workshop 53,737,366 13,920,886 29,269,870 23,265,027 21,214,170 141,407,319Total 472,200,835 68,620,886 117,238,504 23,265,027 22,214,170 703,539,422
Company Less than 60 daysRs.
61 - 90 daysRs.
91- 180 daysRs.
181- 365 daysRs.
Over 365 daysRs.
TotalRs.
New vehicles 418,463,469 54,700,000 69,456,000 - - 542,619,469Spare parts 24,446,697 3,097,478 993,053 601,647 126,491 29,265,367Workshop 15,681,330 2,398,173 1,940,604 1,799,902 19,949 21,839,959Total 458,591,497 60,195,651 72,389,657 2,401,550 146,439 593,724,795
The Group believes that the unimpaired amounts that are past due by more than 30 days are still collectible, based on historic payment
pattern and extensive analysis and follow up procedures implemented on the customer credit risk.
Notes to the Financial Statements

85
39.2 Liquidity risk
The risk that the Group will encounter difficulty in meeting the obligations associated with its financial liabilities that are settled by
delivering cash or another financial asset. The Group’s approach to managing liquidity is to ensure , as far as possible, that it will always
have sufficient liquidity to meet its liabilities when due, under both normal and stressed conditions, without incurring unacceptable
losses or risking damage to the Group’s reputation. The maximum exposure to liquidity risk as at reporting date was as follows;
Group Within Within Within Within Within More than Total
1 year 1-2 years 2-3 years 3-4 years 4-5 years 5 years
Rs. Rs. Rs. Rs. Rs. Rs. Rs.
Non- Derivative Financial Liabilities
Interest bearing borrowings 139,021,939 14,280,000 14,280,000 14,280,000 31,460,000 - 213,321,939
Trade and other payables 792,270,482 - - - - - 792,270,482
Amounts due to related Parties 1,034,343 - - - - - 1,034,343
Bank Overdraft 41,833,247 - - - - - 41,833,247
974,160,011 14,280,000 14,280,000 14,280,000 31,460,000 - 1,048,460,011
Company Within Within Within Within Within More than Total
1 year 1-2 years 2-3 years 3-4 years 4-5 years 5 years
Rs. Rs. Rs. Rs. Rs. Rs. Rs.
Non- Derivative Financial Liabilities
Trade and other payables 593,767,592 - - - - - 593,767,592
593,767,592 - - - - - 593,767,592
Trade and other payables are settled during the availability of the credit terms.
Dividend payable is settled at the time they are claimed as the Company deposits the funds required for the purpose of the dividend
distribution in advance in a separate account.
39.3 Market risk
This has an impact on the market prices , such as forex rates, interest rates and equity prices that will affect the Group's income or the
value of its holdings of financial instruments.
The objective of market risk management is to manage and control market risk exposures within acceptable parameters, while
optimising the Return.
(a.) Interest rate risk
Interest rate risk is the risk that the fair value or future cash flows of a financial instrument fluctuate because of changes in the market
interest rates. The Group's exposure to the risk of changes in market interest rates relates primarily to the Group's long term debt
obligation. The Group utilises various financial instruments to manage exposures to interest rate risks.

SATHOSA MOTORS PLC | Annual Report 2014/1586
At the reporting date, the Group's interest - bearing financial instruments were as follows:
Group Company
Carrying Amount Carrying Amount
As at 31 March 2015 2014 2015 2014
Rs. Rs. Rs. Rs.
Fixed Rate Instruments
Financial Assets
Debentures 84,113,507 38,485,323 84,113,507 38,485,323
Overnight Repos and short term fixed deposits 57,682,634 1,559,819 57,682,634 1,559,819
141,796,141 40,045,142 141,796,141 40,045,142
Variable Rate Instruments
Financial Liabilities
Term Loan (86,200,000) - -
Import demand loans (127,121,939) (58,876,643) - -
Bank Overdraft (41,833,247) (18,648,334) - -
(255,155,186) (77,524,977) - -
(b) Currency Risk
Exposure to Currency Risk Company Company Company Company Company Company
As at 31st March 2015 2015 2015 2014 2014 2014
USD THB JPY USD THB JPY
Trade Payables - Foreign
Creditors 715,280 - 394,395,035 474,000 2,045,861 325,086,023
Gross Statement of Financial
Position Exposure 715,280 - 394,395,035 474,000 2,045,861 325,086,023
Group Group Group Group Group Group
2015 2015 2015 2014 2014 2014
USD THB JPY USD THB JPY
Trade Payables - Foreign
Creditors 715,280 - 394,395,035 474,000 2,045,861 325,086,023
Gross Statement of Financial
Position Exposure 715,280 - 394,395,035 474,000 2,045,861 325,086,023
Notes to the Financial Statements

87
The following significant exchange rates were applicable during the year
Group Average Rate Reporting Date Spot Rate
As at 31st March 2015 2014 2015 2014
Rs. Rs. Rs. Rs.
USD 130.91 130.09 132.90 130.09THB 4.03 4.15 4.11 4.02JPY 1.20 1.30 1.11 1.29
Company Average Rate Reporting Date Spot Rate
As at 31st March 2015 2014 2015 2014
Rs. Rs. Rs. Rs.
USD 130.91 130.08 132.90 130.09THB 4.027 4.15 4.10 4.01JPY 1.19 1.30 1.10 1.29
Sensitivity Analysis
A strengthening of the Rupee as indicated below, against the USD,THB, JPY at 31st March 2015 would have increased/ (decreased)
the equity and profit or loss by the amounts shown below. This analysis is based on foreign currency exchange rate variances that
the Group considered to be reasonably possible at the end of the reporting period. The analysis assumes that all other variables, in
particular interest rates, remain constant.
Strengthening Weakening Strengthening Weakening
Profit or LossRs.
Profit or LossRs.
Profit or LossRs.
Profit or LossRs.
Company Company Group Group
31st March 2015USD (10% movement) (9,506,071) 9,506,071 (9,506,071) - THB (10% movement) - - - - JPY (10% movement) (43,730,521) 43,730,521 (43,730,521) 43,730,521
31st March 2014USD (10% movement) 6,166,357 - - (6,166,357)THB (10% movement) (821,597) 821,597 (821,597) 821,597 JPY (10% movement) (41,942,599) 41,942,599 (4,194,260) 41,942,599
(b) Interest rate riskInterest rate risk is the risk that the fair value or future cash flows of a financial instrument fluctuate because of changes in market
interest rates. The groups exposure to the risk of changes in market interest rates relates primarily to the Group's long term debt
obligation .The Group utilises various financial instruments to manage exposures to interest rate risks .

SATHOSA MOTORS PLC | Annual Report 2014/1588
39.5 Capital management
The Board’s policy is to maintain a strong capital base so as to maintain share holder, creditor and market confidence and to
sustain future development of the business. The Board of Directors monitors the return on capital and level of dividends to
ordinary shareholders.
The Group’s Net Debt to adjusted Equity ratio at the end of the reporting period was as follows:
Carrying amount
Group Company
As at 31st March 2015 2014 2015 2014
Rs. Rs. Rs. Rs.
Total Liabilities 1,147,278,439 898,934,092 656,643,175 618,420,341
Less: Cash and Cash Equivalents (86,892,429) (25,292,091) (83,374,701) (23,441,196)
Net Debt 1,060,386,010 873,642,001 573,268,474 594,979,145
Total Equity 1,893,711,697 1,090,963,768 1,194,388,082 971,901,283
Net Debt to Equity Ratio 56% 80% 48% 61%
There were no changes in the Group’s approach to capital management during the year and the Group is not subject to externally
imposed capital requirements.
40 Operating leases
Non cancellate operating lease rentals are payable as follows:
2015 2014 2015 2014
Group Group Company Company
Rs. Rs. Rs. Rs.
Withinoneyear 528,000 528,000 528,000 528,800
1-5 years 792,000 792,000 792,000 1,320,000
Total 1,320,000 1,320,000 1,320,000 1,848,800
The above rentals are payable with respect to Panchikawatte operating lease.
Lease rental per month amounts to Rs. 44,000/- net of taxes. This payment is considered as an expense in the Profit or Loss. This is a five
year lease. Commencement October 2012.
( Rent per month - 40,000 recoverable from the advance whilst Rs. 44,000 is paid in cash terms)
Notes to the Financial Statements
89Report of the Audit Committee
CompositionThe Board appointed Audit Committee of Sathosa Motors PLC
comprised three members till 1st Sept. 2014 and out of which two
were independent. Mr. A.I Lovell who was an independent director
resigned from the Board on 1st Sept. 2014. Accordingly, since 1st
Sept. 2014 to 31st March 2015, members of the committee remained
as two with one independent director.
Mr. Chiran Wijesinghe was appointed as an independent Non-
Executive Director to the Board and Audit Committee on 15th July
2015.
Role of the CommitteeThe committee operates within the “Terms of Reference”
formally approved by the Board, which defines its objectives and
responsibilities and it is further regulated by the Listing Rules
of the Colombo Stock Exchange. In addition to such objectives,
the Committee is entrusted with ensuring that the regulatory
compliance and reporting requirements are met. The Committee has
the responsibility in evaluating and monitoring risk management
function of the Company and adherence to accounting policies. The
Committee is also to assist the Board of Directors in discharging its
responsibilities towards all stakeholders and to ensure that sound
Corporate Governance practices are upheld within the Company.
The Committee is empowered among other things to examine any
matters relating to the financial affairs of the Company and review any
activity within the Company. The objectivity and the independence
of external and internal auditors are also reviewed.
Meetings and AttendanceThe Committee meets at least once a quarter and conduct its
meeting according to a formal agenda. It had four sittings during
the year. The attendance of the members at these meetings is given
below. The Executive Director / Managing Director, Head of Finance
and Internal Auditors attend audit committee meetings by invitation.
As and when required other senior officers of the Company are
invited to attend the meetings.
Financial ReportingManagement has the primary responsibility for the preparation
of Financial Statements and the reporting process. The Audit
Committee reviews the Monthly Management Accounts, Interim
Financial Statements, Annual Report and formal announcements
made to the Colombo Stock Exchange.
Statutory and Regulatory ComplianceA procedure has been laid down for reporting on quarterly basis by
Internal Auditors with regard to statutory and regulatory compliance
and internal control procedures. Instances of non compliances if any,
are reported thru Internal Audit Report on quarterly basis and review
of such report is taken up at the Audit Committee meetings together
with appropriate corrective actions.
Due to the consolidation of unaudited financial statements of
Subsidiary, the AGM held on 26th Sep. 2014 was adjourned without
adopting Financial Statements. Subsequently, an Extra Ordinary
General meeting was held on 16th Feb. 2015 after publishing audited
consolidated financial statements of the subsidiary and the accounts
were duly adopted.
Internal AuditThe Audit Committee monitors the internal auditors’ functions by
approving annual internal audit program and reviewing quarterly
Internal Auditor Reports and recommendations made for system and
procedural improvements in the Company. The implementations of
such recommendations were made after obtaining responses from
the divisional heads.
Internal Auditors have not been appointed for the subsidiary, but
advisory services have been obtained from independent parties.
The reports made available by such parties have been reviewed by a
Committee headed by the Chairman of Audit Committee, Managing
Director and Head of Finance of the subsidiary.
Good GovernanceThe Committee also reviews the level of compliance with Corporate
Governance rules as per Sec. 7.10 of the Listing Rules of the Colombo
Stock Exchange. The Committee is satisfied that the Company has
complied with all mandatory requirements of this code.
The Company’s whistle blowing policy is intended to serve as a
channel of managing corporate fraud risk and staff is encouraged to
raise their concerns on existing or potential wrong doings by other
employees.
External AuditIn regard to the external audit functions of the Company the role
played by the Committee is as follows:
• Assisting the Board of Directors to implement the process of
engaging External Auditors for audit services in compliance
with the provisions and the directions and agree on their
remuneration.

SATHOSA MOTORS PLC | Annual Report 2014/1590
• Monitor and assess the independence of the External Auditors.
• Reviewing non-audit services provided by the Auditors with
a view to safeguard and to support the independence and
objectivity of the external auditors.
• Discussing with the Auditors their audit plan, scope and the
methodology proposed to be adopted in conducting the audit
prior to commencement of the Annual Audit.
• Approve the financial statements.
• Reviewing the External Auditors Management Letter and the
management responds thereto.
The audit Committee has recommended to the Board that KPMG
be re-appointed as statutory auditors for the financial year ending
31st March 2016 subject to the approval by the Shareholders at the
forthcoming Annual General Meeting.
ConclusionThe Committee is satisfied that the internal controls and procedures
in operation are adequate and operating effectively to provide
reasonable assurance that the Company’s assets are safeguarded
and steps are being taken continuously to improve the systems
and controls as per the reports made available by the External
and Internal Auditors and the review processed adopted by the
Committee. The Company has adopted appropriate accounting
policies in preparation and presentation of Financial Statements.
Mr. M.M. Nelson De SilvaChairman – Audit Committee
15th July 2015
Attendance at the Committee Meetings
Meeting Held on Director Attendance
10-07-2014
Mr. M.M.N. De Silva Present
Mr. J.C. Joshua Present
Mr. A. I. Lovell Excused
03-09-2014
Mr. M.M.N. De Silva Present
Mr. J.C. Joshua Present
Mr. A. I. Lovell Excused
04-11-2014Mr. M.M.N. De Silva Present
Mr. J.C. Joshua Excused
10-03-2015Mr. M.M.N. De Silva Present
Mr. J.C. Joshua Present
Report of the Audit Committee

91Information to Investor
(I) TOP 20 SHAREHOLDER LIST AS AT 31ST MARCH 2015NAME OF SHAREHOLDER NO OF SHARES %
1 ACCESS ENGINEERING PLC 5,093,745 84.423
2 LAKSHMANS HOUSING AND CONSTRUCTION CO (PVT) LTD 610,850 10.124
3 BANK OF CEYLON NO. 1 ACCOUNT 16,000 0.265
4 MR B P OBEYSEKERE 10,000 0.166
5 MR M MAHIBALAN 6,927 0.115
6 MR S G N HERATH, MRS A N HERATH AND MS N E HERATH 5,442 0.090
7 MR U I SURIYABANDARA 5,338 0.088
8 MR R N HETTIARACHCHI 5,043 0.084
9 DESHAMANYA TILAK DIAS GUNASEKERA 4,648 0.077
10 MR N A N D D GUNASEKARA 4,500 0.075
11 MR G C GOONETILLEKE 4,050 0.067
12 MR R D LEELARTNA 4,028 0.067
13 MR R D U A RANAMUKA 4,000 0.066
14 MR A H MUNASINGHE 3,598 0.060
15 MR K C VIGNARAJAH 3,370 0.056
16 MRSGOWRISANGAR 3,300 0.055
17 TEA CEYLON INVESTMENTS (PVT) LTD 2,850 0.047
18 MRS S A KALEEL 2,400 0.040
19 MR N L DIAS 2,400 0.040
20 MRS N G A P RATNASEKERA 2,300 0.038
5,794,789 96.043
OTHERS 238,833 3.957
6,033,622 100.00
(ii) DIRECTORS’ HOLDING AS AT 31-03-2015Name of Shareholder No of Shares %
Deshamanya Tilak Dias Gunasekera 4,648 0.077
Mr. M M N De Silva 1,100 0.018
(iii) The percentage of shares held by the public as at 31st March 2015 is 15.482%
(iv) Total no of shareholders who hold the public holding is 1196

SATHOSA MOTORS PLC | Annual Report 2014/1592
Stock Market Information - Company
Year 2014/2015 2013/2014
Market value per share
Market price ( as at 31st March) Rs. 275.10 240.00
Highest market price during the year Rs. 299.00 279.40
Lowest market price during the year Rs. 235.00 202.00
Net asset value per share Rs. 197.96 161.08
Earning per share Rs. 41.93 38.41
Dividend per share ( gross) Rs. 7.00 5.00
Public holding % 15.48 15.54
Dividend pay out ratio % 16.69 13.02
Dividend cover (Times) Times 5.99 7.68
Debt/ Equity ratio & interest cover
This is not applicable as there are no borrowings by the Company as at the reporting date.
Information to Investor

93Statement of Value Added
Group Company
For the year ended 31st March 2015 2014 2015 2014
Rs.000 % Rs.000 % Rs.000 % Rs.000 %
Value added
Revenue 3,502,514 3,040,852 2,737,582 2,434,315
Other Income 42,668 25,741 38,997 18,974
3,545,182 3,066,593 2,776,579 2,453,290
Cost of material & Services (3,002,753) (2,491,622) (2,325,397) (2,030,765)
542,429 574,971 451,182 422,525
Distribution of value added
To employees
as salaries, Incentive & other benefits 118,786 21.90 154,915 26.94 86,716 19.22 79,538 18.82
To government Revenue
as taxes 112,367 20.72 126,834 22.06 96,684 21.43 90,556 21.43
To providers of Capital
as dividend 42,235 7.79 30,168 5.25 42,235 9.36 30,168 7.14
To maintain operations
Depreciation 31,179 5.75 24,007 4.18 14,798 3.28 13,321 3.15
Financing Expenses 18,710 3.45 9,213 1.60 16 0.00 7,338 1.74
To Expansion & Growth
Reserves 219,151 40.70 229,834 39.97 210,733 46.71 201,603 47.71
542,429 100.00 574,971 100.00 451,182 100.00 422,525 100.00
To Employees To Government Revenue To Providers Of Capital To Maintain Operations To Expansion & Growth
17.20%
21.96%
9.59%3.37%
47.87%18.82%
47.71%
21.43%
7.14%4.89% 9.20% 7.80%
20.70%
21.90% 39.97% 26.94%
22.06%
5.25%5.78%
40.40%
GROUP2015
GROUP2014
COMPANY2015
COMPANY2014

SATHOSA MOTORS PLC | Annual Report 2014/1594Notice of Annual General Meeting
NOTICE IS HEREBY GIVEN that the Thirty First ( 31st) Annual General
Meeting of the Shareholders of Sathosa Motors PLC will be held at
the Institute of Chartered Accountants of Sri Lanka, 30A, Malasekera
Mawatha, Colombo 7, on 25th August 2015, at 03.00 p.m. for the
following purposes.
1. To receive and consider the Annual Report of the Board of
Directors on the affairs of the Company and the Statement of
Accounts for the year ended 31st March 2015 with the Report of
the Auditors thereon.
2. To re-elect Mr. M N M de Silva who retires by rotation in terms of
Article 88(i) of the Articles of Association of the Company.
3. ToelectMr.ChiranWijesinghewhoretiresasaDirectorinterms
of Article 95 of the Articles of Association of the Company.
4. To re-appoint M/s KPMG, Chartered Accountants as Auditors for
the year ending 31st March 2016, and to authorise the Board of
Directors to determine their remuneration.
5. To authorize the Directors to determine contributions to charities
and other donations for the year 2015/2016.
By order of the Board
SATHOSA MOTORS PLC
P W CORPORATE SECRETARIAL (PVT) LTDDirector / Secretaries
15th July 2015
Colombo
Notes
1. Any member of the Company unable to attend the meeting may
appoint another person (whether a member or not) as a proxy to
attend and vote for him/her
2. A proxy need not be a member of the Company. A proxy form
is attached for your use. The completed form of proxy should
belodgedwiththeSecretariesoftheCompanyPWCorporate
Secretarial (Pvt) Ltd, No. 3/17, Kynsey Road, Colombo 08 not less
than 36 hours before theholding of the Annual General Meeting.
3. Shareholders appointing proxies (other than Directors of the
Company) to attend the meeting are requested to indicate the
number of the National Identity Card of the Proxy holder on the
form or proxy.
4. Only registered Proxy holders will be permitted to attend the
Annual General Meeting. Shareholders/Proxy holders attending
the Annual General Meeting are kindly requested to bring with
them their National Identity Card or any other form of valid
identification.

95
I/We..………………………………………………………………………………………………………………(NICNo.……………………)
of .………………………………………………………………………………………………………………………………………………
being a member/members of SATHOSA MOTORS PLC hereby appoint;
…………………………………………………………………………………………………………………………………………….of
……………………………………………………………………………………………………………………………………(orfailinghim).
Mr. Sumal Joseph Sanjiva Perera of Colombo or failing him*Deshamanya Tilak Dias Gunasekera of Colombo or failing him*Mr. Muthu Muni Nelson de Silva of Colombo or failing him*Mr. Joseph Christopher Joshua of Colombo or failing him*Mr. Ranjan John Suriyakumar Gomez of Colombo or failing him*Mr. Saumaya Darshana Munasinghe of Colombo or failing him*Mr. Shevantha Harindra Sudharaka Mendis of Colombo or failing him*
Mr. Dalpadoruge Anton Rohana Fernando of Colombo or failing him*
Mr. Chiran wijesinghe of Colombo or failing him*
………………………………………………………………………………………………………………..………………………………of
……………………………………………………………….holderofNICNo……………….…………………………………………………
as my/our* proxy represent me/us and vote for me/us* and on my/our* behalf at the Thirty First (31st) Annual General Meeting of the Company
to be held on 25th August 2015 at 3.00 p.m. and at any adjournment thereof and every poll which may be taken in consequence thereof.
Please indicate your preference by placing a P against the following
For Against1. To receive and consider the Annual Report of the Board of Directors and the Statements of Accounts
for the year ended 31st March 2015 together with the Report of the Auditors thereon
2. To re-elect Mr. M N M de Silva who retires in terms of Article 88(i) of the Articles of Association of
the Company.
3. ToelectMr.ChiranWijesinghewhoretiresintermsofArticle95oftheArticlesofAssociationofthe
Company.
4. To re-appoint M/s KPMG Chartered Accountants as Auditors for the year ending 31st March 2016
and to authorise the Board of Directors to determine their Remuneration.
5. To authorise the Directors to determine contributions to charities and other donations for the year
2015/2016.
Aswitnessmy/our*handsthis…………….dayof…………….TwoThousandandFifteen.
*Please delete as appropriate
. . . . . . . . . . . . . . . . . . . . . . . . . . . . . . . . . . . . . . . . . . . . . . . . . . . . . . . . . . . . . . . . . . . . . . . . . . . . . . . . . . . . . . . . . . . . . . . . . .
NIC/REG.No. Signature of Member/s
Notes: 1. A proxy need not be a member of the Company.
2. Instructions as to completion appear overleaf.
Form of Proxy

SATHOSA MOTORS PLC | Annual Report 2014/1596
INSTRUCTIONS FOR THE COMPLETION OF PROXY
1. Please perfect the Form of Proxy overleaf by filling in legibly your full name address and the National Identity Card number and signing in
the space provided and filling in the date of signature.
2. Please return the completed Form of Proxy after deleting one or other of the alternative words indicated by asterisk in the body of the form.
3. TobevalidthecompletedFormofProxyshouldbedepositedwiththeCom[anySecretaries,PWCorporateSecretarial(Pvt)Ltd.,No.3/17,
Kynsey Road, Colombo 08 not less than 36 hours before the time appointed for the holding of the meeting
4. If the Form of proxy has been signed by an attorney, the relative Power of Attorney should also accompany the completed form of Proxy
for registration, If such Power of Attorney has not already been registered with the Company.
5. If the shareholder is a Company or a Corporate body, the Proxy should be executed under its common seal in accordance with its Articles
of Association or Constitution.
6. A shareholder appointing a proxy (other than a Director of the Company) to attend the meeting should indicate the proxy holder’s National
Identity Card (NIC) number on the Form of Proxy and request the proxy holder to bring his/her National Identity Card with him/her.
Form of Proxy

Corporate Information
NAME OF THE COMPANYSathosa Motors PLC
LEGAL FORM
A public Limited Liability Company incorporated in Sri Lanka on
11th March 1982 under the Companies Ordinance No: 51 of 1938
and re-registered under the Companies Act No.7 of 2007. Listed on
the Colombo Stock Exchange on 07th November 1993.
REGISTRATION NUMBERPQ 105
BOARD OF DIRECTORSMr. Sumal Joseph Sanjeewa Perera Chairman
Deshamanya Tilak Dias Gunasekera Managing Director
Mr. J C Joshua Director(Alternate Director Mr. S H S Mendis)
Mr. D A R Fernando Director
Mr. S H S Mendis Director
Mr. S D Munasinghe Director
Mr. R J S Gomez Director(Alternate Director Mr. S D Munasinghe)
Mr. M M N De Silva Director
Mr. Chiran Wijesinghe Director
Senior Management TeamNeomal Fernando Assistant General Manager – New Vehicle
Nilantha Nanayakkara Assistant General Manager – Spare Parts
Deepal Dissanayake Service Manager – Workshop
Thejani Kodithuwakku Financial Controller
Lalith Jayathunga Finance Manager
Inoka Jayawickrama Accountant
Duminda Munasinghe Manager IT
Nilanga Silva Manager HR & Administration
Sujani Jayasuriya Sales Manager - Vehicle Sales
Harsha Withana Sales Manager - Services
Upul Ranasinghe Assistant Manager - Services
Eranga Dias Assistnt Manager
BANKERSHatton National Bank
NDB Bank
Commercial Bank of Ceylon PLC
Bank of Ceylon
Sampath Bank PLC
Peoples Bank
AUDITORSKPMG
Chartered Accountant,
32 A, Sir Mohomad Macan Marker Mawatha,
Colombo 03.
SECRETARIES & REGISTRARSP W Corporate Secretarial (Pvt) Ltd
No: 3/17, Kynsey Road,
Colombo 08.
LAWYERSNithi Murugesu & Associate
Attorneys – At – Law – Notaries Public
28 (level 2) W A D Ramanayake Mawatha,
Colombo 02.
ACTUARIAL CONSULTANTSActuarial & Management Consultants (Pvt) Ltd
1st Floor,
No: 434, R A de Mel Mawatha,
Colombo 03.
REGISTERED OFFICENo: 25, Vauxhall Street,
Colombo 02.
GENERAL OFFICE / BUSINESS ADDRESSNo: 25, Vauxhall Street,
Colombo 02.
Tel : 011-2432858, 011-2431568, 011- 2331621
Fax : 011-2446129
Web : www.sathosamotorsplc.com
Designed & produced by REDWORKS
Photography by Studio Times
Digital plates & Printed by Printage (Pvt) Ltd

Recommended