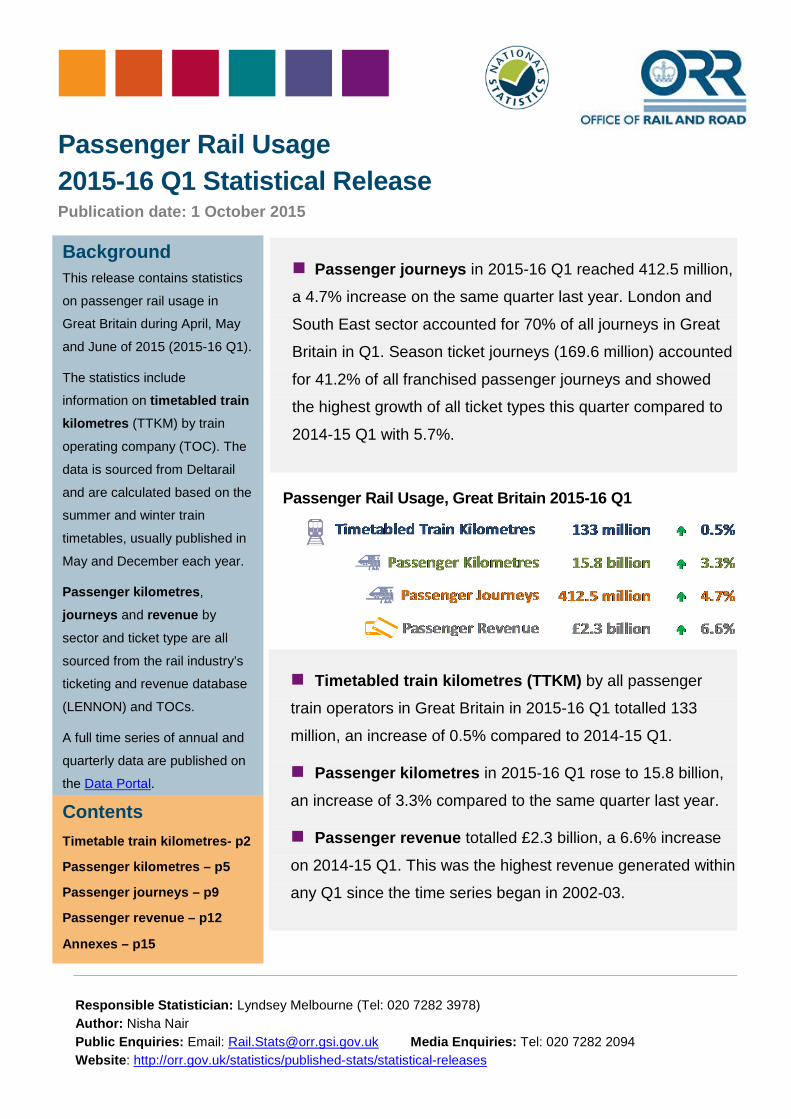
Passenger journeys in 2015-16 Q1 reached 412.5 million,
a 4.7% increase on the same quarter last year. London and
South East sector accounted for 70% of all journeys in Great
Britain in Q1. Season ticket journeys (169.6 million) accounted
for 41.2% of all franchised passenger journeys and showed
the highest growth of all ticket types this quarter compared to
2014-15 Q1 with 5.7%.
Passenger Rail Usage, Great Britain 2015-16 Q1
Timetabled train kilometres (TTKM) by all passenger
train operators in Great Britain in 2015-16 Q1 totalled 133
million, an increase of 0.5% compared to 2014-15 Q1.
Passenger kilometres in 2015-16 Q1 rose to 15.8 billion,
an increase of 3.3% compared to the same quarter last year.
Passenger revenue totalled £2.3 billion, a 6.6% increase
on 2014-15 Q1. This was the highest revenue generated within
any Q1 since the time series began in 2002-03.
Background This release contains statistics
on passenger rail usage in
Great Britain during April, May
and June of 2015 (2015-16 Q1).
The statistics include
information on timetabled train kilometres (TTKM) by train
operating company (TOC). The
data is sourced from Deltarail
and are calculated based on the
summer and winter train
timetables, usually published in
May and December each year.
Passenger kilometres,
journeys and revenue by
sector and ticket type are all
sourced from the rail industry’s
ticketing and revenue database
(LENNON) and TOCs.
A full time series of annual and
quarterly data are published on
the Data Portal.
Passenger Rail Usage 2015-16 Q1 Statistical Release Publication date: 1 October 2015
Contents Timetable train kilometres- p2
Passenger kilometres – p5
Passenger journeys – p9
Passenger revenue – p12
Annexes – p15
Responsible Statistician: Lyndsey Melbourne (Tel: 020 7282 3978) Author: Nisha Nair Public Enquiries: Email: [email protected] Media Enquiries: Tel: 020 7282 2094 Website: http://orr.gov.uk/statistics/published-stats/statistical-releases

Timetabled train kilometres (TTKM) refers
to the number of train
kilometres (million) each
train operator would
achieve if they operated
100% of their timetable.
The data are calculated
from the summer and
winter train timetables,
operational from May and
December each year.
Measures of train
kilometres are used by the
rail industry to show the
volume of service
provision.
1. Timetabled Train Kilometres (TTKM) Annual 2014-15 The annual data has been updated from the previous quarter as we have now been
supplied with the data for Caledonian Sleeper services.
Timetabled train kilometres have increased every year since
the time series began in 2003-04 to meet the increasing
demand for rail travel. The largest annual increase in TTKM
was in 2009-10 when TTKM rose by 4.1% to reach 502.5
million kilometres; mainly as a result of the upgrade to the
West Coast Mainline being completed which increased the
volume of services operated by Virgin Trains and London
Midland.
In 2014-15, TTKM for all passenger operators in Great
Britain was 532.4 million kilometres. This was up 1.0% on
the 527.3 million kilometres recorded in 2013-14 and up
18.1% since the annual time series began in 2003-04 when
there was 450.9 million timetabled train kilometres. The
main driver of the increase in 2014-15 is First Transpennine
Express, who added additional services between Leeds and
Manchester in May 2014.
Office of Rail and Road 1 October 2015 2015-16 Q1 Statistical Release – Passenger Rail Usage 2
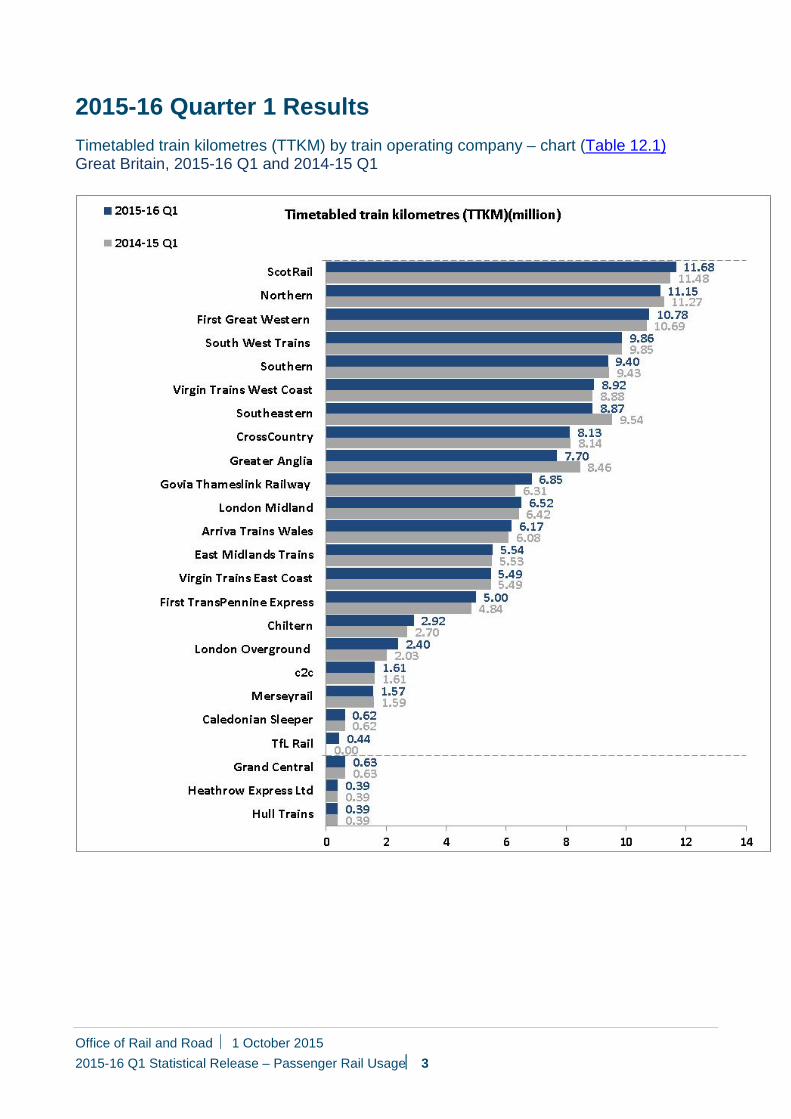
2015-16 Quarter 1 Results Timetabled train kilometres (TTKM) by train operating company – chart (Table 12.1) Great Britain, 2015-16 Q1 and 2014-15 Q1
Office of Rail and Road 1 October 2015 2015-16 Q1 Statistical Release – Passenger Rail Usage 3
The total number of TTKM across all operators in 2015-16 Q1 increased by 0.5%
compared to 2014-15 Q1, recording a total of 133 million kilometres. London
Overground recorded the largest increase in its TTKM of 18.7% this quarter. This is
due to a transfer of some of the local services out of Liverpool Street Station to
North East London from the Greater Anglia franchise1 in May 2015.
Greater Anglia has seen the biggest drop in its TTKM compared to the same
quarter last year, falling by 9.1%. This was due to the transfer of some of its
services to London Overground and also a new franchise (TfL Rail) beginning
operating services into and out of London Liverpool Street that were transferred
from Greater Anglia.
Govia Thameslink Railway recorded the second highest quarter on quarter increase
for all operators with an increase of 8.6%. This increase was due to the introduction
of additional services in the December 2014 timetable2 and through taking over
some Southeastern routes.
ScotRail continues to have the highest TTKM of all operators in 2015-16 Q1
recording 11.68 million kilometres. At the beginning of 2015-16, the ScotRail
franchise transferred from FirstGroup to Abellio. At the same time the sleeper
services which had been operated as part of ScotRail transferred to a separate
franchise known as Caledonian Sleeper. (The TTKM data in table 12.1 for
Caledonian Sleeper are presented for the first time. They were previously not
included in either ScotRail totals or separately.)
The number of TTKM for the non-franchised operators (First Hull Trains, Grand
Central and Heathrow Express) saw a marginal increase of 0.2% in 2015-16 Q1
compared to 2014-15 Q1.
TTKM by quarter data are available on the data portal in: Table 12.1
1 https://tfl.gov.uk/info-for/media/press-releases/2014/may/tfl-appoints-london-overground-operator-to-run-additional-services 2 http://www.thameslinkrailway.com/your-journey/timetables/more-seats
Office of Rail and Road 1 October 2015 2015-16 Q1 Statistical Release – Passenger Rail Usage 4

Passenger kilometres are
the number of kilometres
travelled by passengers on
the rail network. Passenger
kilometres are calculated by
multiplying the number of
passenger journeys on a
particular flow by the number
of track kilometres between
the two required stations. The
track kilometres data are built
into the LENNON system.
2. Passenger Kilometres Annual 2014-15 The annual data has not been updated from the previous quarter but has been retained for
completeness and to aid understanding of trends in the quarterly data.
In 2014-15 passenger kilometres in Great Britain
totalled 62.9 billion. Of which, 62.4 billion kilometres
were by franchised operators, the highest recorded
figure since the series began in 2002-03. This was an
increase of 4.5% on the 59.7 billion passenger
kilometres recorded in 2013-14 and an increase of
57.2% on the 39.7 billion passenger kilometres
recorded in 2002-03.
Passenger kilometres for the London and South East,
Long distance and Regional (including Scotland)
sectors3 all experienced an increase in passenger
kilometres between 2013-14 and 2014-15 of between 3.4% and 5.5%.
Growth in franchised passenger kilometres in the Long distance and Regional
sectors outstripped growth in London and South East sector, with the franchised
Long Distance passenger kilometres increasing by 5.5% to20.8 billion kilometres in
2014-15. This was the first time since 2011-12 that the London and South East
sector did not record the highest growth.
For non-franchised operators (First Hull Trains, Grand Central and Heathrow
Express) the number of passenger kilometres increased by 13% in 2014-15
compared to 2013-14, reaching 541 million.
3 The rail network is divided into 3 sectors – London and South East, Long distance and Regional (including Scotland). A list of services in each sector is available in the Quality Report
Office of Rail and Road 1 October 2015 2015-16 Q1 Statistical Release – Passenger Rail Usage 5
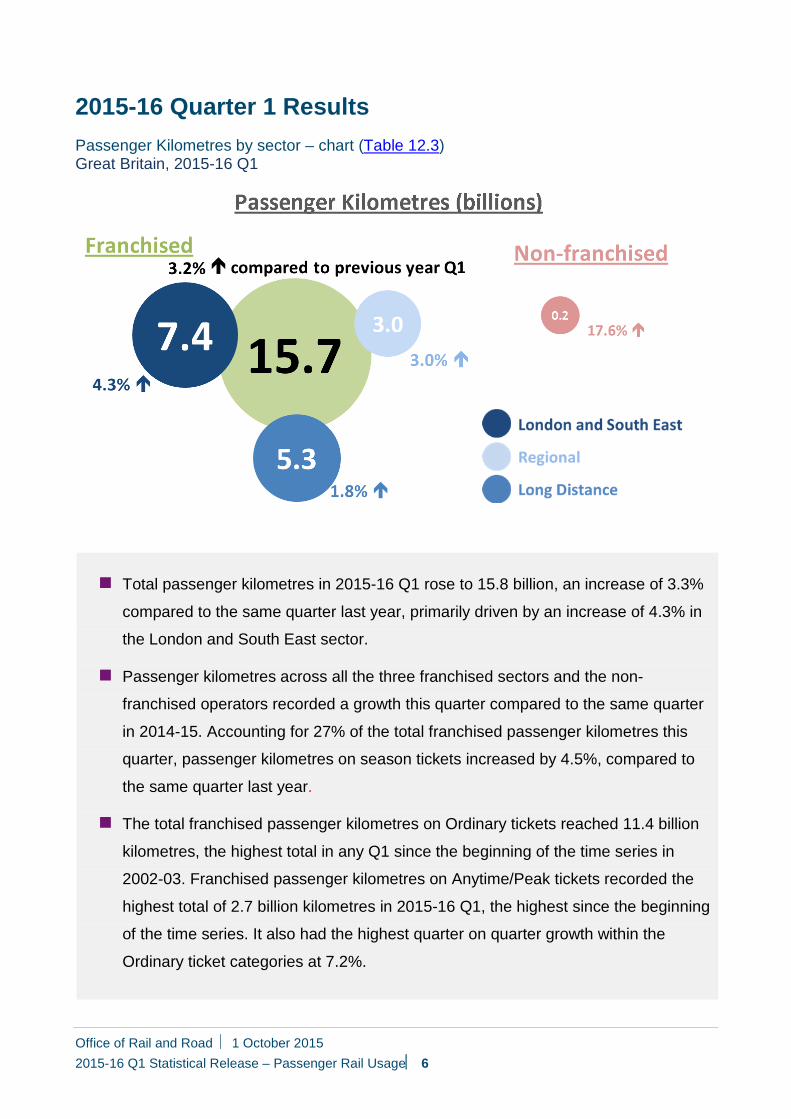
2015-16 Quarter 1 Results Passenger Kilometres by sector – chart (Table 12.3) Great Britain, 2015-16 Q1
Total passenger kilometres in 2015-16 Q1 rose to 15.8 billion, an increase of 3.3%
compared to the same quarter last year, primarily driven by an increase of 4.3% in
the London and South East sector.
Passenger kilometres across all the three franchised sectors and the non-
franchised operators recorded a growth this quarter compared to the same quarter
in 2014-15. Accounting for 27% of the total franchised passenger kilometres this
quarter, passenger kilometres on season tickets increased by 4.5%, compared to
the same quarter last year.
The total franchised passenger kilometres on Ordinary tickets reached 11.4 billion
kilometres, the highest total in any Q1 since the beginning of the time series in
2002-03. Franchised passenger kilometres on Anytime/Peak tickets recorded the
highest total of 2.7 billion kilometres in 2015-16 Q1, the highest since the beginning
of the time series. It also had the highest quarter on quarter growth within the
Ordinary ticket categories at 7.2%.
Office of Rail and Road 1 October 2015 2015-16 Q1 Statistical Release – Passenger Rail Usage 6
London and South East franchised operators totalled 7.4 billion passenger
kilometres during 2015-16 Q1, up by 4.3% on Q1 last year. This sector accounted
for 47% of all passenger kilometres in Great Britain in Q1. Compared to operators in
the other sectors, franchised operators in the London and South East are typically
associated with a high proportion of commuters and thus usually have the highest
proportion of passenger kilometres on season tickets compared to the other
sectors. This quarter 43.8% of the franchised passenger kilometres in this sector
were attributed to Season ticket travel compared to 7.1% in Long Distance and
20.5% in Regional sector.
In 2015-16 Q1, the passenger kilometres on Long Distance franchised operators
increased by 1.8% compared to the same quarter last year to 5.3 billion. This is, the
highest recorded passenger kilometres in this sector in any Q1 since the beginning
of the time series, although it has consistently accounted for a third of the national
total. The journeys in this sector mainly cover longer distance, inter-city travel,
thereby contributing to high passenger kilometres. In this sector, passenger
kilometres on Ordinary ticket travel, especially Advance and Off-Peak tickets which
account for 81.9% of passenger kilometres, have continued to show growth
implying an increase in leisure travel, with people making the most of the travel
incentives offered by the operators.
There were 3 billion passenger kilometres by franchised Regional operators
(including Scotland) in 2015-16 Q1, an increase of 3% compared to Q1 last year. In
2015-16 Q1, 79.5% of the passenger kilometres in this sector were attributed to
Ordinary tickets, with the Ordinary Off-Peak tickets accounting for the largest share
of the total franchised passenger kilometres in this sector.
Passenger kilometres by non-franchised operators accounted for 0.15 billion
kilometres in 2015-16 Q1, an increase of 17.6% compared to Q1 last year. The
introduction of extra services, cheaper fares on advance tickets and other appealing
promotions and offers, have contributed to the growth in passenger kilometres in
the non-franchised sector.
Office of Rail and Road 1 October 2015 2015-16 Q1 Statistical Release – Passenger Rail Usage 7
Passenger kilometres quarterly data are available on the Data Portal
European comparison
In 20134 there were 62.0 billion passenger kilometres in the UK5. This is the third
highest number of passenger kilometres of the countries in the European Union that
have reported data to Eurostat; France and Germany were the countries with the
highest number of passenger kilometres with figures of 90.5 billion and 89.5 billion
respectively. Since 2008 the UK has seen a 17.0% growth in passenger kilometres,
this is the second highest percentage increase in the EU behind Austria which has
experienced an 18.0% increase. The size of the rail network in Austria is smaller
than that of the UK; in absolute numbers the UK has seen the biggest increase in
passenger kilometres since 2008.
4 European data is submitted to Eurostat based on calendar years 5 This data includes figures for Northern Ireland
Office of Rail and Road 1 October 2015 2015-16 Q1 Statistical Release – Passenger Rail Usage 8
The number of passenger journeys made on the rail
network.
A journey is based on travel
from an origin station to a
destination station. A train
journey may include one or
more changes of train, and
one journey is generated for
each train used.
3. Passenger Journeys Annual 2014-15 The annual data has not been updated from the previous quarter but has
been retained for completeness and to aid understanding of trends in the
quarterly data.
In 2014-15, 1.66 billion passenger journeys were made
in Great Britain, the highest recorded figure since the
series began. The vast majority were franchised
passenger journeys, with 1.65 billion recorded
compared to 2.1 million non-franchised operator
journeys. Franchised passenger journeys saw an
increase of 4.2% on the 1.59 billion recorded in 2013-
14 and an increase of 69.5% over 2002-03 which
recorded 975.5 million journeys.
Franchised operators across all sectors experienced an
increase in passenger journeys between 2013-14 and 2014-15. With London and
South East sector accounting for 69.8% of the total franchised passenger journeys,
the total passenger journeys in this sector totalled 1.15 billion this year.
Office of Rail and Road 1 October 2015 2015-16 Q1 Statistical Release – Passenger Rail Usage 9
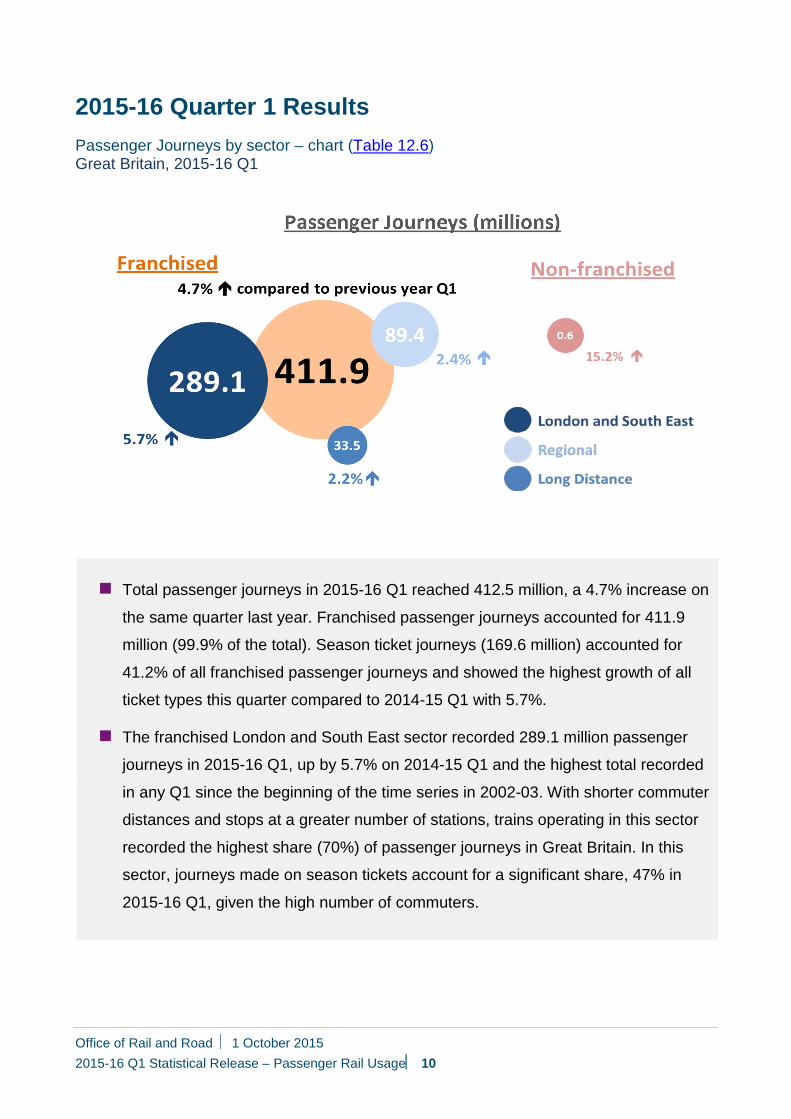
2015-16 Quarter 1 Results Passenger Journeys by sector – chart (Table 12.6) Great Britain, 2015-16 Q1
Total passenger journeys in 2015-16 Q1 reached 412.5 million, a 4.7% increase on
the same quarter last year. Franchised passenger journeys accounted for 411.9
million (99.9% of the total). Season ticket journeys (169.6 million) accounted for
41.2% of all franchised passenger journeys and showed the highest growth of all
ticket types this quarter compared to 2014-15 Q1 with 5.7%.
The franchised London and South East sector recorded 289.1 million passenger
journeys in 2015-16 Q1, up by 5.7% on 2014-15 Q1 and the highest total recorded
in any Q1 since the beginning of the time series in 2002-03. With shorter commuter
distances and stops at a greater number of stations, trains operating in this sector
recorded the highest share (70%) of passenger journeys in Great Britain. In this
sector, journeys made on season tickets account for a significant share, 47% in
2015-16 Q1, given the high number of commuters.
Office of Rail and Road 1 October 2015 2015-16 Q1 Statistical Release – Passenger Rail Usage 10
The franchised Long Distance sector had 33.5 million journeys in 2015-16 Q1, a
2.2% increase on the same quarter last year. This is the highest total recorded in
any Q1 for this sector since the beginning of the time series. Journeys made on
Ordinary tickets account for the majority of the passenger journeys in this sector,
the key drivers being the Ordinary Advance and Off-Peak ticket journeys.
The franchised Regional sector recorded 89.4 million journeys in 2015-16 Q1, an
increase of 2.4% compared to the same quarter last year and the highest recorded
total in any Q1 since the beginning of the time series. For the second quarter in a
row within Ordinary tickets, journeys made on Anytime/Peak tickets had the largest
market share ahead of Off- Peak tickets.
The non-franchised sector had 0.59 million passenger journeys in 2015-16 Q1, an
increase of 15.2% compared to the same quarter last year. As seen with passenger
kilometres, the introduction of extra train services, cheaper fares on advance tickets
and other appealing promotions and offers have fuelled the growth in the number of
passenger journeys in this sector.
Passenger journeys quarterly data are available on the Data Portal
European comparison
In 2013 there were 1.6 billion passenger journeys in the UK. This is the second
highest number of rail passenger journeys of the countries in the European Union
that have reported data to Eurostat; Germany was the only country to record more
passenger journeys with 2.6 billion journeys. Since 2008 the number of passenger
journeys on the UK rail network has increased by 23.0%; this is the biggest increase
in journeys of any EU country that reports to Eurostat.
Office of Rail and Road 1 October 2015 2015-16 Q1 Statistical Release – Passenger Rail Usage 11
Passenger revenue
statistics show all ticket
revenue and miscellaneous
charges associated with
passenger travel on national
railways, but not including
government support or
grants.
An increase in passenger
revenue is generally a direct
consequence of increased
passenger journeys. The
percentage change in
passenger revenue can
often outstrip the equivalent
passenger journeys and
passenger kilometres
measures as a result of the
fare increases usually
announced in January each
year.
4. Passenger Revenue Annual 2014-15 The annual data has not been updated from the previous quarter but has
been retained for completeness and to aid understanding of trends in the
quarterly data.
In 2014-15, £8.9 billion was raised from passenger
journeys made in Great Britain on passenger operators,
the highest recorded figure since the series began in
2002-03. This was split between £8.8 billion by
franchised operators and £63 million by non-franchised
operators. Overall passenger revenue increased by
7.4% compared to the £8.3 billion collected in 2013-14,
the highest revenue growth rate recorded since 2011-12
when it was 9.2%.
All three franchised sectors experienced an increase in
revenue between 2013-14 and 2014-15, with the
revenue from the Regional sector seeing the highest
growth of 7.8%.
Office of Rail and Road 1 October 2015 2015-16 Q1 Statistical Release – Passenger Rail Usage 12
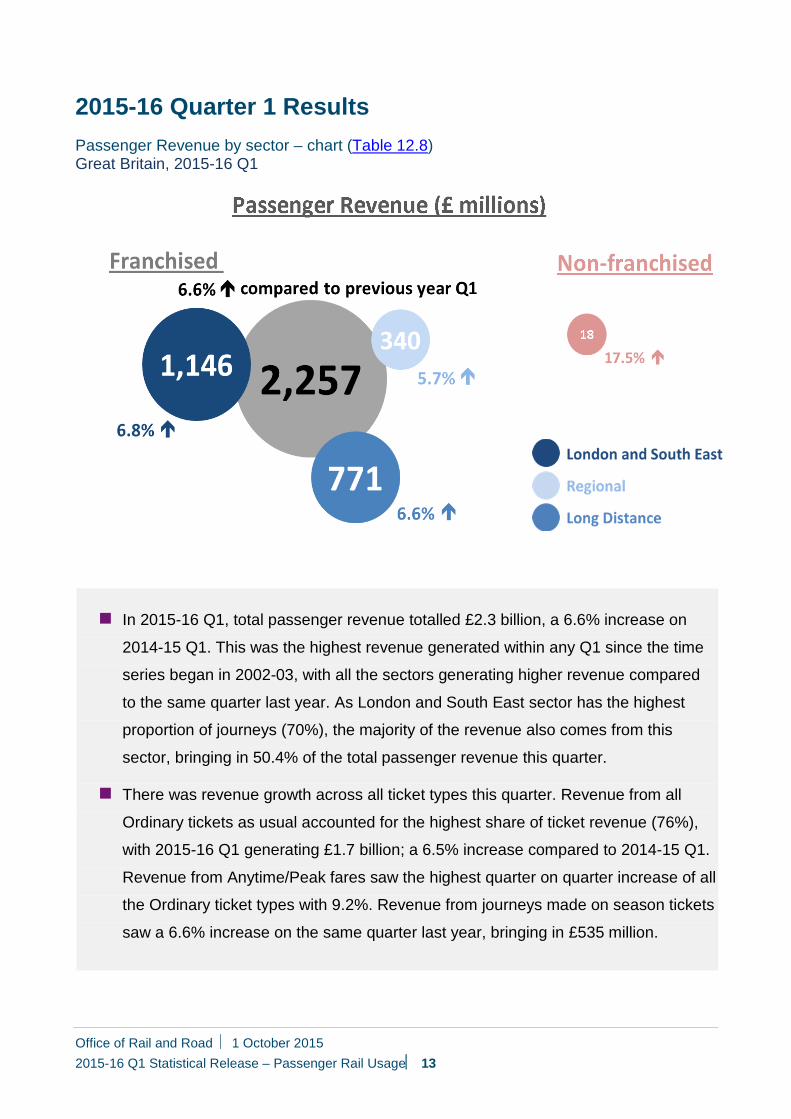
2015-16 Quarter 1 Results Passenger Revenue by sector – chart (Table 12.8) Great Britain, 2015-16 Q1
In 2015-16 Q1, total passenger revenue totalled £2.3 billion, a 6.6% increase on
2014-15 Q1. This was the highest revenue generated within any Q1 since the time
series began in 2002-03, with all the sectors generating higher revenue compared
to the same quarter last year. As London and South East sector has the highest
proportion of journeys (70%), the majority of the revenue also comes from this
sector, bringing in 50.4% of the total passenger revenue this quarter.
There was revenue growth across all ticket types this quarter. Revenue from all
Ordinary tickets as usual accounted for the highest share of ticket revenue (76%),
with 2015-16 Q1 generating £1.7 billion; a 6.5% increase compared to 2014-15 Q1.
Revenue from Anytime/Peak fares saw the highest quarter on quarter increase of all
the Ordinary ticket types with 9.2%. Revenue from journeys made on season tickets
saw a 6.6% increase on the same quarter last year, bringing in £535 million.
Office of Rail and Road 1 October 2015 2015-16 Q1 Statistical Release – Passenger Rail Usage 13
Revenue for franchised operators within the London and South East sector
exceeded £1.1 billion during 2015-16 Q1, an increase of 6.8% when compared to
the same quarter last year. Of the three franchised sectors, London and South East
sector brings in the most revenue from Season ticket sales, mostly due to the high
proportion of commuters. Revenue from sales across all ticket types recorded an
increase, with revenue from Anytime/Peak ticket sales recording the highest growth
for this sector in 2015-16 Q1 compared to 2014-15 Q1.
Passenger revenue for franchised Long Distance services increased by 6.6% in
2015-16 Q1 reaching £771.3 million, the highest revenue for this sector since the
beginning of the time series in 2002-03. Revenue from Anytime/Peak tickets sales
recorded the highest growth this quarter with 11.4% compared to 2014-15 Q1.
During 2015-16 Q1 franchised Regional operators generated £339.6 million, a 5.7%
increase on the same quarter last year. This is the highest revenue generated in
any Q1 for the Regional sector since the beginning of the time series, mainly driven
by the revenue from Anytime/Peak ticket sales in this sector, which account for
37.9% of revenue and increased by 10.5% compared to 2014-15 Q1.
Revenue generated by non-franchised operators increased by 17.5% this quarter
compared to 2014-15 Q1, recording a total revenue of £17.6 million, the highest
revenue recorded since the beginning of the time series in 2009-10. This is likely to
be as a direct result of the increasing passenger journeys and kilometres the non-
franchised sector has seen over time.
Franchised operators revenue equated to 14.38 pence per passenger kilometre or
£5.48 per journey in 2015-15 Q1; increases of 3.3% and 1.8% respectively
compared to 2014-15 Q1.
Passenger revenue quarterly data are available on the Data Portal
Office of Rail and Road 1 October 2015 2015-16 Q1 Statistical Release – Passenger Rail Usage 14
Annex 1 – List of pre-created reports available on the ORR Data Portal All data tables can be accessed on the data portal free of charge. The ORR data portal
provides on screen data reports, as well as the facility to download data in Excel format
and print the report. We can provide data in csv format on request.
Timetabled Train Kilometres
Timetabled Train Kilometres by train operating company and quarter – Table 12.1
Passenger Kilometres
Passenger Kilometres – Table 12.2 (franchised only)
Passenger Kilometres by sector – Table 12.3
Passenger Kilometres by ticket type – Table 12.4
Passenger Journeys
Passenger Journeys – Table 12.5
Passenger Journeys by sector – Table 12.6
Passenger Journeys by ticket type – Table 12.7
Passenger Revenue
Passenger Revenue by sector – Table 12.8
Passenger Revenue by ticket type – Table 12.9
Revenue per passenger kilometre and per passenger journey – Table 12.10 (franchised only)
Revisions: There have been revisions to the previously published tables associated with
this statistical release. Further details can be found at: Revisions Log
Office of Rail and Road 1 October 2015 2015-16 Q1 Statistical Release – Passenger Rail Usage 15
Annex 2 Statistical Releases This publication is part of the statistical releases which cover the majority of reports that
were previously released through the Data Portal. The statistical releases consist of four
annual and four quarterly themed releases:
Annual:
Rail Finance;
Rail Safety Statistics;
Rail Infrastructure, Assets and Environmental;
Regional Rail Usage.
Quarterly:
Passenger and Freight Rail Performance;
Freight Rail Usage;
Passenger Rail Usage;
Passenger Rail Service Satisfaction.
A full list of publication dates for the next twelve months can be found in the release
schedule on the ORR website.
For more information on data collection and the methodology used to calculate the
statistics in this release please see the accompanying Quality Report.
Office of Rail and Road 1 October 2015 2015-16 Q1 Statistical Release – Passenger Rail Usage 16
National Statistics The United Kingdom Statistics Authority designated these statistics as National Statistics,
in accordance with the Statistics and Registration Service Act 2007 and signifying
compliance with the Code of Practice for Official Statistics.
Designation can be broadly interpreted to mean that the statistics:
meet identified user needs;
are well explained and readily accessible;
are produced according to sound methods; and
are managed impartially and objectively in the public interest.
Once statistics have been designated as National Statistics it is a statutory requirement
that the Code of Practice shall continue to be observed.
For more details please contact the Statistics Head of Profession Lyndsey Melbourne on
020 7282 3978 or contact [email protected].
The Department for Transport (DfT) also publishes a range of rail statistics which can be
found at DfT Rail Statistics
We publish, where possible, rail statistics comparing Great Britain with other EU member
states. For rail usage comparable statistics are available from Eurostat6 for passenger
journeys and passenger kilometres; these have been discussed in the relevant sections.
6 http://epp.eurostat.ec.europa.eu/portal/page/portal/eurostat/home/
Office of Rail and Road 1 October 2015 2015-16 Q1 Statistical Release – Passenger Rail Usage 17
© Crown copyright 2015
This publication is licensed under the terms of the Open Government Licence v3.0 except where otherwise stated. To view this licence, visit nationalarchives.gov.uk/doc/open-government-licence/version/3 or write to the Information Policy Team, The National Archives, Kew, London TW9 4DU, or email: [email protected].
Where we have identified any third party copyright information you will need to obtain permission from the copyright holders concerned.
This publication is available at orr.gov.uk
Any enquiries regarding this publication should be sent to us at orr.gov.uk
Office of Rail and Road 1 October 2015 2015-16 Q1 Statistical Release – Passenger Rail Usage 18
Recommended