Parameter estimation
Invariance to transforms ?
xTx~ Txx~ Hxx x~H
~x~
TH~
TH 1-?
TxH~
xT TxH~
Tx -1
will result change? for which algorithms? for which transformations?
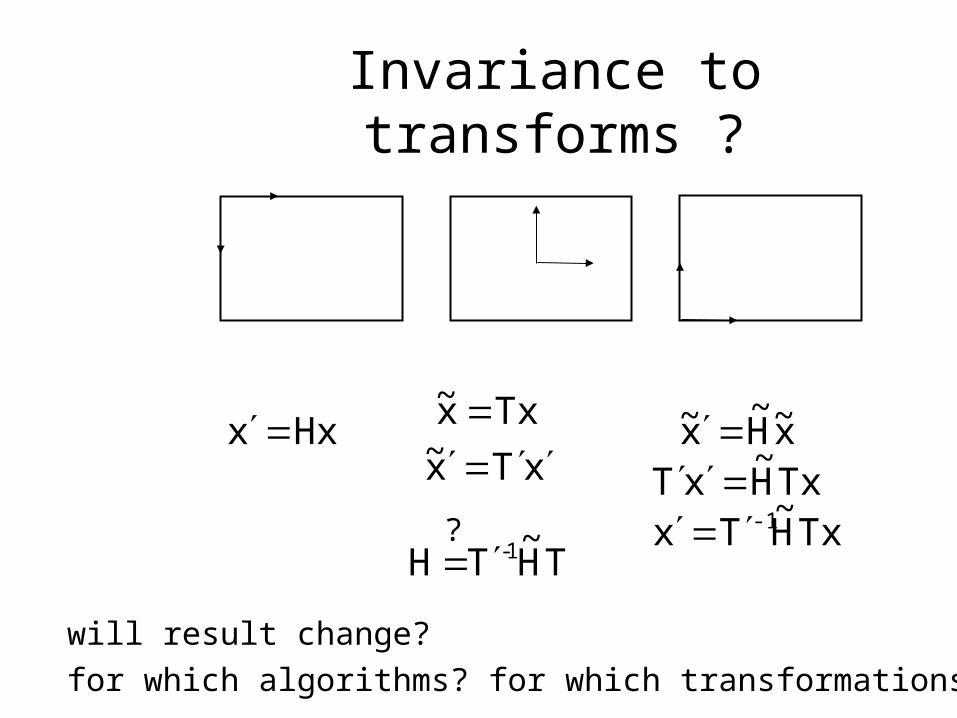
Non-invariance of DLT
Given and H computed by DLT,
and
Does the DLT algorithm applied to yield ?
Answer is too hard for general T and T’
But for similarity transform we can state NO Conclusion: DLT is NOT invariant to Similarity But can show that Geometric Error is Invariant to Similarity
iiii xTx~,Txx~ ii xx
ii x~x~
-1HTTH~

Normalizing transformations
• Since DLT is not invariant,what is a good choice of coordinates?e.g.• Translate centroid to origin• Scale to a average distance to the
origin• Independently on both images
2
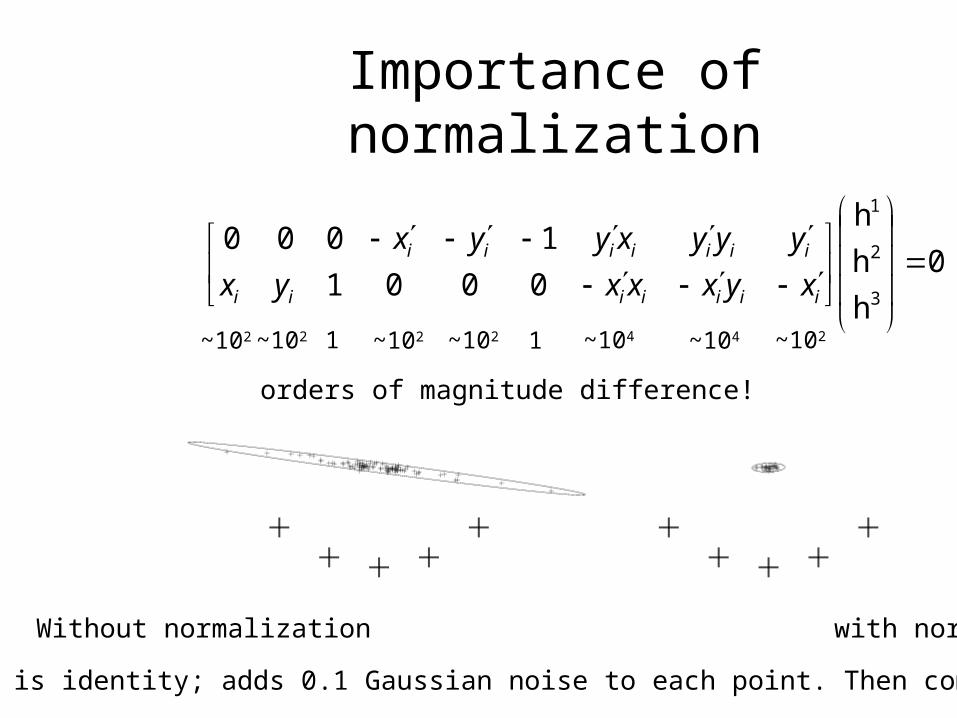
Importance of normalization
0
h
h
h
0001
1000
3
2
1
iiiiiii
iiiiiii
xyxxxyx
yyyxyyx
~102 ~102 ~102 ~102 ~104 ~104 ~10211
orders of magnitude difference!
Assumes H is identity; adds 0.1 Gaussian noise to each point. Then computes H:
Without normalization with normalization
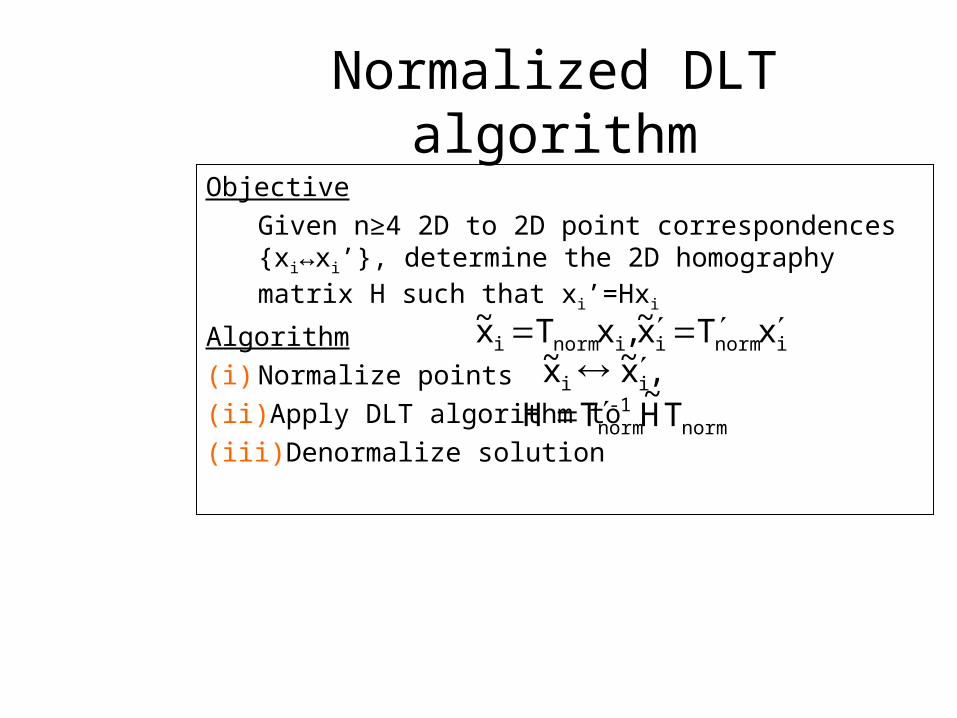
Normalized DLT algorithmObjective
Given n≥4 2D to 2D point correspondences {xi↔xi’}, determine the 2D homography matrix H such that xi’=Hxi
Algorithm
(i) Normalize points
(ii) Apply DLT algorithm to
(iii) Denormalize solution
,x~x~ ii inormiinormi xTx~,xTx~
norm-1norm TH~
TH
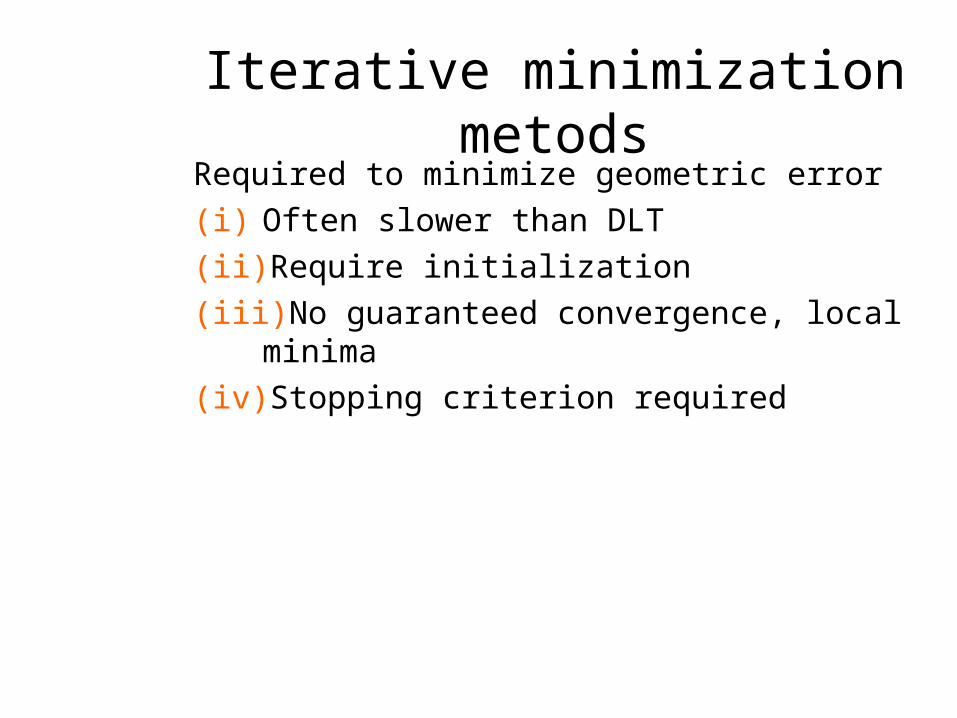
Iterative minimization metods
Required to minimize geometric error (i) Often slower than DLT(ii) Require initialization(iii) No guaranteed convergence, local minima(iv) Stopping criterion required
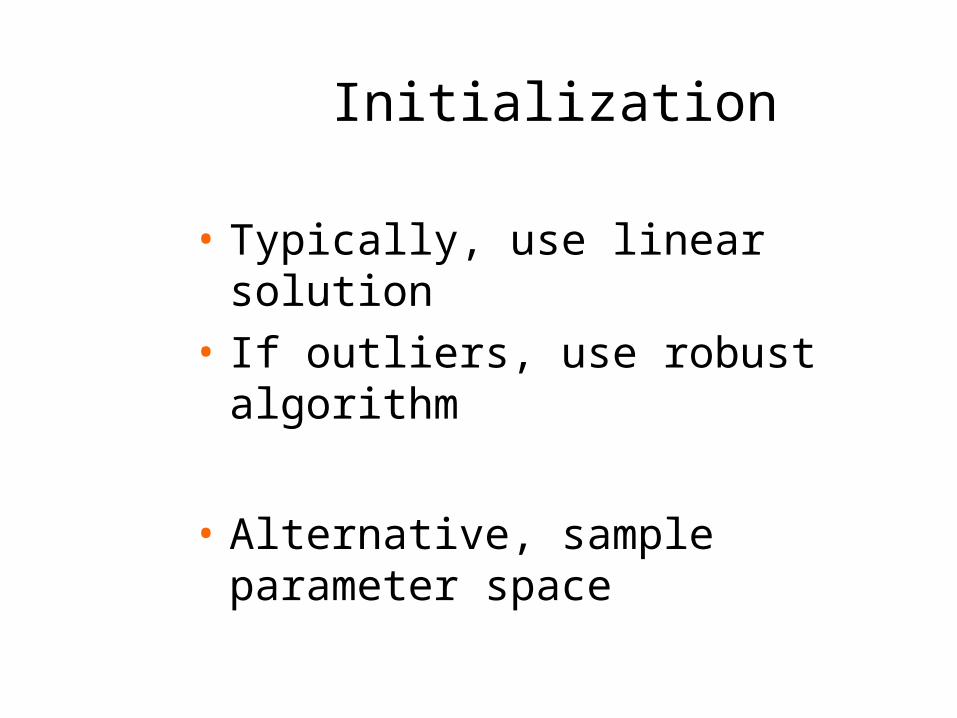
Initialization
• Typically, use linear solution• If outliers, use robust algorithm
• Alternative, sample parameter space

Iterative methods
Many algorithms exist• Newton’s method• Levenberg-Marquardt
• Powell’s method• Simplex method

Robust estimation
• What if set of matches contains gross outliers?
ransac least squares
Filled black circles inliersEmpty circles outliers
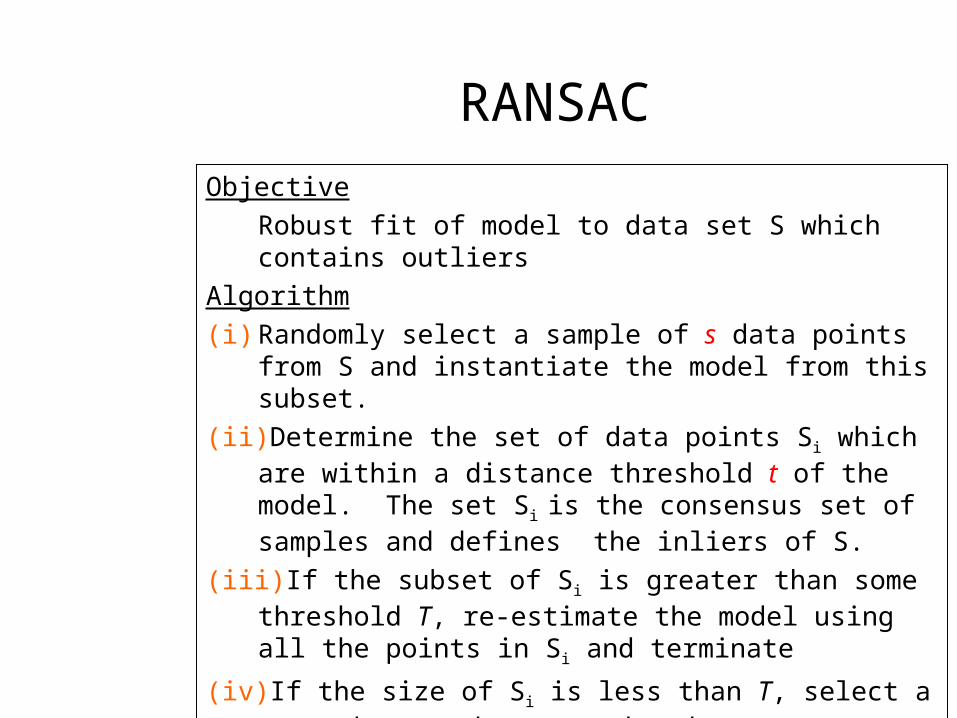
RANSACObjective
Robust fit of model to data set S which contains outliers
Algorithm
(i) Randomly select a sample of s data points from S and instantiate the model from this subset.
(ii) Determine the set of data points Si which are within a distance threshold t of the model. The set Si is the consensus set of samples and defines the inliers of S.
(iii) If the subset of Si is greater than some threshold T, re-estimate the model using all the points in Si and terminate
(iv) If the size of Si is less than T, select a new subset and repeat the above.
(v) After N trials the largest consensus set Si is selected, and the model is re-estimated using all the points in the subset Si
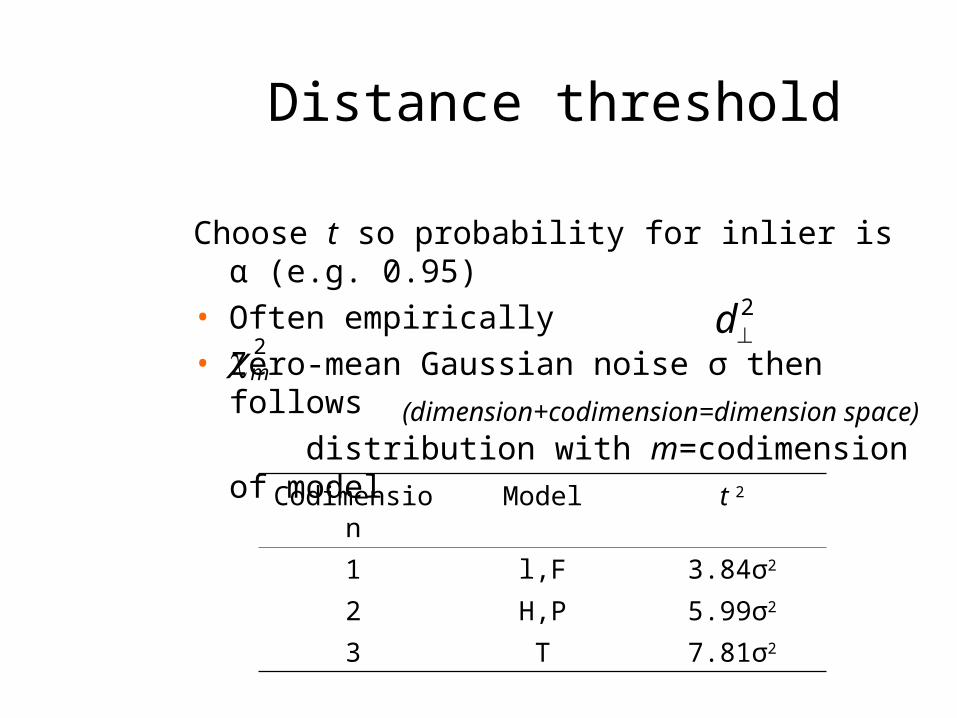
Distance threshold
Choose t so probability for inlier is α (e.g. 0.95)
• Often empirically• Zero-mean Gaussian noise σ then
follows distribution with m=codimension of model
2d2
m(dimension+codimension=dimension space)
Codimension
Model t 2
1 l,F 3.84σ2
2 H,P 5.99σ2
3 T 7.81σ2
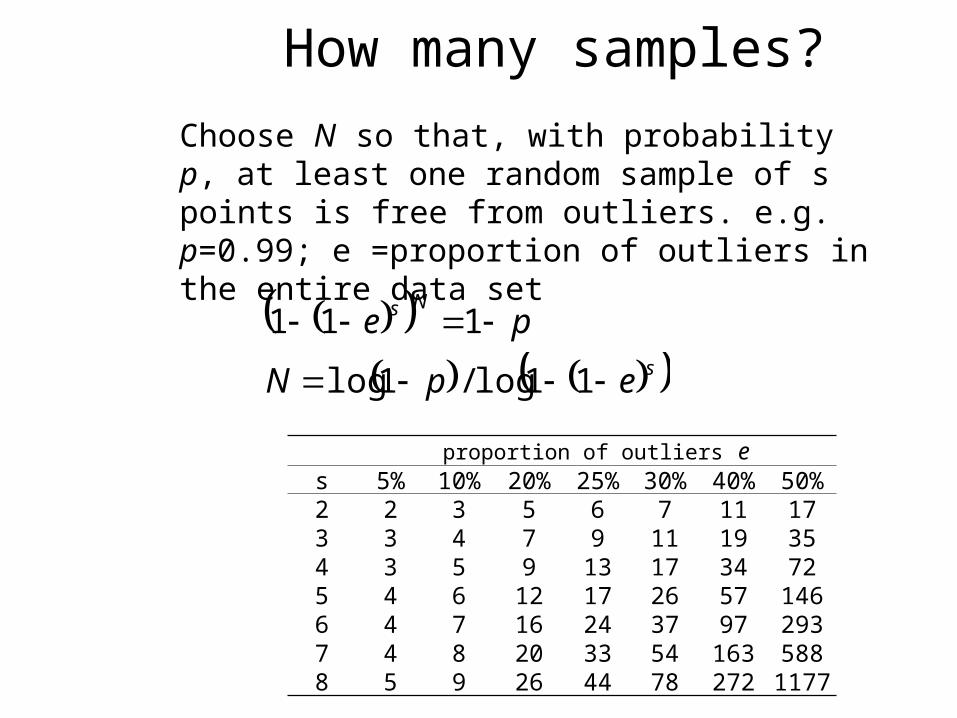
How many samples?
Choose N so that, with probability p, at least one random sample of s points is free from outliers. e.g. p=0.99; e =proportion of outliers in the entire data set
sepN 11log/1log
peNs 111
proportion of outliers es 5% 10% 20% 25% 30% 40% 50%2 2 3 5 6 7 11 173 3 4 7 9 11 19 354 3 5 9 13 17 34 725 4 6 12 17 26 57 1466 4 7 16 24 37 97 2937 4 8 20 33 54 163 5888 5 9 26 44 78 272 117
7

Acceptable consensus set?
• Typically, terminate when inlier ratio reaches expected ratio of inliers; n = size of data set;
e = expected percentage of outliers
neT 1

Adaptively determining the number of samples
e is often unknown a priori, so pick worst case, e.g. 50%, and adapt if more inliers are found, e.g. 80% would yield e=0.2
• N=∞, sample_count =0• While N >sample_count repeat
• Choose a sample and count the number of inliers• Set e=1-(number of inliers)/(total number of
points)• Recompute N from e• Increment the sample_count by 1
• Terminate
sepN 11log/1log

Automatic computation of HObjective
Compute homography between two imagesAlgorithm
(i) Interest points: Compute interest points in each image
(ii) Putative correspondences: Compute a set of interest point matches based on some similarity measure
(iii) RANSAC robust estimation: Repeat for N samples
(a) Select 4 correspondences and compute H
(b) Calculate the distance d for each putative match
(c) Compute the number of inliers consistent with H (d<t)
Choose H with most inliers
(iv) Optimal estimation: re-estimate H from all inliers by minimizing ML cost function with Levenberg-Marquardt
(v) Guided matching: Determine more matches using prediction by computed H
Optionally iterate last two steps until convergence

Example: robust computation
Interest points(500/image)
Left: Putative correspondences (268)
Right: Outliers (117)
Left: Inliers (151) after RansacRight: Final inliers (262)After MLE and guided matching
Recommended