P A G E N U M B E R
RESULTS HIGHLIGHTS AND LATEST BUSINESS DEVELOPMENTS
NET REVENUE REVIEW AND KPIs
Q&A

P A G E N U M B E R
1Q 2017 net revenues of €515 million, +19.1% organic1
(+15.4% reported2), compared with net revenues of €446
million in 1Q 2016
Strong Organic growth driven by positive performance across
all business lines and key markets:
Acceleration of In-Season net revenues
US and APAC the fastest growing regions, Italy back to
double digit growth
Strong set of KPIs:
Excellent customer acquisition
AOV growth across Multi-brand business lines
1. Organic net revenue growth is calculated at constant exchange rates and at comparable perimeter by including net revenues of all online stores active at the end of each period, which were also active at the beginning of the same period of the previous year2. Reported growth calculated at current exchange rates and at actual business perimeterNote: Figures as absolute values and in percentages are calculated using precise financial data. Some of the differences found in this presentation are due to rounding of the values expressed in millions of Euro

P A G E N U M B E R
MULTI-BRAND IN-SEASON
Further enrichment of brand portfolio
– Alaïa ready-to-wear on NET-A-PORTER since January; Stella McCartney’s first-ever menswear collection on
MR PORTER since February
– MR PORTER X GUCCI exclusive capsule collection, debuting in May
Key developments in the new Fine Jewellery & Watches category
– NET-A-PORTER’s exclusive collaboration with Tiffany extended in January; Buccellati and Piaget launched
on NET-A-PORTER in March and April; Montblanc’s first-ever smartwatch and Cartier Panthère watch
collection to be unveiled exclusively on MR PORTER and NET-A-PORTER respectively in May
Continued service enhancements
– New Personal Shopping team in Los Angeles; intensified Client Relations activities in Middle East, Europe
and Asia Pacific
– Innovative personal shopping services dedicated to EIPs: “You try, we wait” same-day delivery service and
“NET-A-PORTER at home” and “MR PORTER at home” shopping consultations
Further assortment enrichment
– Seletti shop-in-shop on YOOX; Altuzarra and Tabitha Simmons on THE OUTNET.COM
– Activewear launched on THE OUTNET in January
Pick-up and drop-off points rolled out in Italy, UK, Germany and Benelux for YOOX
MULTI-BRAND OFF-SEASON
A|X Armani Exchange - previously active in North America - extended to the UK; other key European countries
to launch by end of year
Partnership with Valentino to unveil YNAP’s new omni-channel partnership model, NEXT ERA, in early 2018
Ongoing work to roll out existing omni-channel features to more of Group’s online stores
ONLINE FLAGSHIP STORES
New photo studios at Interporto (Bologna); works to expand capacity ahead of THE OUTNET migration on track
PLATFORM

P A G E N U M B E R
RESULTS HIGHLIGHTS AND LATEST BUSINESS DEVELOPMENTS
NET REVENUE REVIEW AND KPIs
Q&A

P A G E N U M B E R
Reported Growth
0.6%
3.1%
Reported Constant Organic
FX Impact
1. Organic net revenue growth is calculated at constant exchange rates and at comparable perimeter by including net revenues of all online stores active at the end of each period, which were also active at the beginning of the same period of theprevious year.
+15.4%+16.0%
+19.1%
Constant FX Growth Organic Growth1
Perimeter Effect
P A G E N U M B E R
€46.4m €56.0m
€162.1m€192.1m
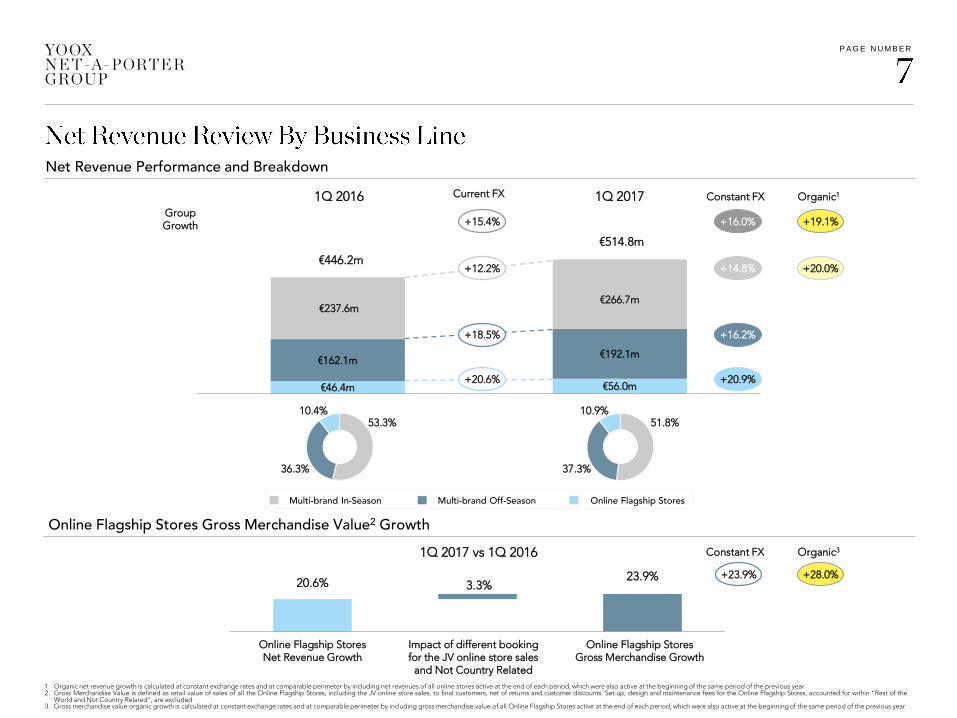
€237.6m€266.7m
Net Revenue Performance and Breakdown
Constant FX1Q 2017GroupGrowth
53.3%10.4%
51.8%
37.3%
20.6% 3.3%23.9%
Online Flagship StoresNet Revenue Growth
Impact of different bookingfor the JV online store sales
and Not Country Related
Online Flagship StoresGross Merchandise Growth
1. Organic net revenue growth is calculated at constant exchange rates and at comparable perimeter by including net revenues of all online stores active at the end of each period, which were also active at the beginning of the same period of the previous year2. Gross Merchandise Value is defined as retail value of sales of all the Online Flagship Stores, including the JV online store sales, to final customers, net of returns and customer discounts. Set-up, design and maintenance fees for the Online Flagship Stores, accounted for within “Rest of the
World and Not Country Related”, are excluded3. Gross merchandise value organic growth is calculated at constant exchange rates and at comparable perimeter by including gross merchandise value of all Online Flagship Stores active at the end of each period, which were also active at the beginning of the same period of the previous year
36.3%
10.9%
+20.9%
+14.8%
+16.2%
€514.8m
+18.5%
+15.4%
+20.6%
+12.2%
1Q 2016
1Q 2017 vs 1Q 2016
+16.0%
Constant FX
+23.9%
Organic1
+20.0%
+19.1%
Organic3
+28.0%
Current FX
€446.2m
Online Flagship Stores Gross Merchandise Value2 Growth
Multi-brand Off-SeasonMulti-brand In-Season Online Flagship Stores

P A G E N U M B E R
(€m )
Italy 28.3 31.3 10.9% 11.0%
UK 65.0 66.7 2.5% 14.3%
Rest of Europe 120.9 134.5 11.2% 7.9%
North America 133.0 161.3 21.2% 17.6%
APAC 69.2 91.1 31.5% 33.0%
Rest of the World + NCR 29.7 29.9 0.7% 9.9%
Group Net Revenues 446.2 514.8 15.4% 16.0%
1. Not Country Related
1Q 2016
15.5%
6.7%
14.6%
29.8%
6.3%
27.1%
1Q 2017
Net Revenue Performance
Net Revenue Breakdown
Italy UK Rest of Europe APACNorth America Rest of the World and NCR1
1Q 2016 1Q2017 % Growth% Growth
Constant FX
1
17.7%
5.8%
13.0%
31.3%
6.1%
26.1%

P A G E N U M B E R
1Q 2016 1Q 2017
+19.7%
2,495
2,987
# Orders (‘000) - Group
Average Order Value (€) - Group Active Customers3 (‘000) - Group4
1Q 2016 1Q 2017
+9.9%
1,990
2,186
1Q 2016 1Q 2017
+5.9%
324
343
1.Key performance indicators do not include the Joint Venture with Kering and jimmychoo.com2.Source: Adobe Analytics for NET-A-PORTER, MR PORTER and THE OUTNET; Google Analytics Premium for YOOX, THECORNER, SHOESCRIBE and the Online Flagship Stores "Powered by YOOX NET-A-PORTER GROUP“3.Active Customer is defined as a customer who placed at least one order in the 12 preceding months. The figure reported is calculated as the sum of the Active Customers of each online store for the reporting period4. Includes Active Customers of the Online Flagship Stores “Powered by YOOX NET-A-PORTER GROUP”
41.2 47.0
78.190.4
58.762.9
178.1200.3
+12.5%
Visits (m)2
Multi-brand In-Season Multi-brand Off-Season Online Flagship Stores
1Q 2016 1Q 2017
Constant FX
+6.6%
Organic
+16.7%+7.1%
+14.1%
+15.7%
GroupGrowth +15.7%

P A G E N U M B E R
RESULTS HIGHLIGHTS AND LATEST BUSINESS DEVELOPMENTS
NET REVENUE REVIEW AND KPIs
Q&A

P A G E N U M B E R
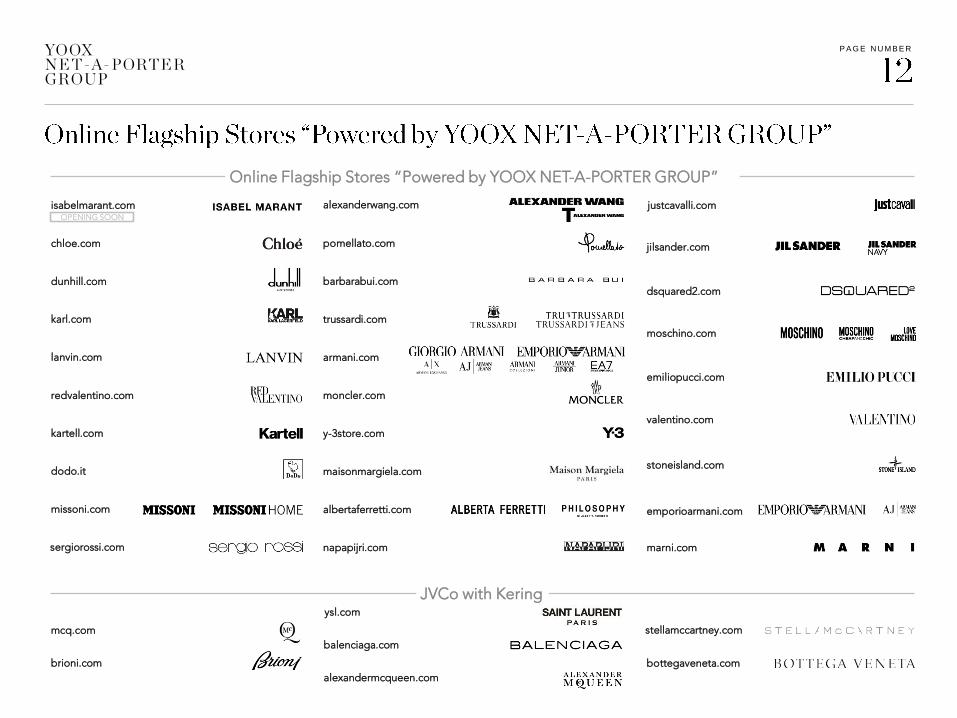
ONLINE FLAGSHIP STORES POWERED BY YOOX NET-A-PORTER GROUP
SHAREHOLDER STRUCTURE
EXCHANGE RATES
P A G E N U M B E R
Online Flagship Stores “Powered by YOOX NET-A-PORTER GROUP”
JVCo with Kering
alexanderwang.com
pomellato.com
barbarabui.com
moncler.com
trussardi.com
dodo.it
dsquared2.com
moschino.com
emiliopucci.com
stoneisland.com
marni.com
jilsander.com
valentino.com
emporioarmani.comalbertaferretti.com
justcavalli.com
y-3store.comkartell.com
ysl.com
mcq.com
bottegaveneta.com
sergiorossi.com
alexandermcqueen.com
stellamccartney.com
balenciaga.com
missoni.com
redvalentino.com
lanvin.com
brioni.com
chloe.com
dunhill.com
karl.com
maisonmargiela.com
napapijri.com
isabelmarant.comOPENING SOON
armani.com

P A G E N U M B E R
Feder ico Marchet t i 7 ,581,814 5.4% 5,164,667 3.9% 7,581,814 7.5% 5,164,667 5.7%
YNAP Managem ent team and other stock option holders 5,328,656 3.8% 5,328,656 5.3%
Sub-total 12,910,470 9.1% 5,164,667 3.9% 12,910,470 12.7% 5,164,667 5.7%
Richem ont 65,599,597 46.3% 65,599,597 49.0% 25,316,057 25.0% 22,693,459 25.0%
Renzo Rosso 5,186,321 3.7% 5,186,321 3.9% 5,186,321 5.1% 5,186,321 5.7%
Alabbar Enterprises 3,571,428 2.5% 3,571,428 2.7% 3,571,428 3.5% 3,571,428 3.9%
Capital Research and Managem ent Com pany 4,117,000 2.9% 4,117,000 3.1% 4,117,000 4.1% 4,117,000 4.5%
Fidelity International 2,897,225 2.0% 2,897,225 2.2% 2,897,225 2.9% 2,897,225 3.2%
Market 47,265,728 33.4% 47,265,728 35.3% 47,265,728 46.7% 47,265,728 52.0%
Tota l Outs tanding Shares 141,547,769 100.0% 133,801,966 100.0% 101,264,229 100.0% 90,895,828 100.0%
Treasury Shares 17,339 0.0% 17,339 0.0% 17,339 0.0% 17,339 0.0%
Tota l Issued Shares 141,565,108 100.0% 133,819,305 100.0% 101,281,568 100.0% 90,913,167 100.0%
3
2
Shareholders
Total Ordinary Capital (Voting)
Total Share Capital (Ordinary + Non-voting)
1 1Diluted Current Diluted Current
Updated as of 3 May 20171. Computed assuming that all of the 7,745,803 stock options granted under YOOX NET-A-PORTER GROUP S.p.A.’s stock option plans are exercised2. Excludes Federico Marchetti3. The number of ordinary shares is calculated assuming that Richemont converts 2,622,598 non-voting shares to ordinary shares (ratio of 1:1) in order to re-establish the maximum of 25% of shares with voting rights as stipulated by the New Bylaws

P A G E N U M B E R
EUR USD 1.102 1.065 1.054 1.069
% yoy appreciation / (depreciation) vs. EUR 3.5% 3.3% 6.5%
EUR GBP 0.770 0.8 60 0.8 56 0.8 56
% yoy appreciation / (depreciation) vs. EUR (10.4%) (14.3%) (7.5%)
EUR JPY 126.997 121.014 123 .400 119.550
% yoy appreciation / (depreciation) vs. EUR 4.9% 6.2% 7.0%
EUR CNY 7.210 7.3 3 5 7.3 20 7.3 64
% yoy appreciation / (depreciation) vs. EUR (1.7%) (3.5%) (0.2%)
EUR RUB 8 2.451 62.522 64.3 00 60.3 13
% yoy appreciation / (depreciation) vs. EUR 31.9% 25.5% 26.5%
EUR HKD 8 .568 8 .264 8 .175 8 .3 07
% yoy appreciation / (depreciation) vs. EUR 3.7% 3.2% 6.3%
EUR KRW 1,3 24.3 3 8 1,227.28 9 1,269.3 60 1,194.540
% yoy appreciation / (depreciation) vs. EUR 7.9% 0.9% 8.4%
EUR AUD 1.529 1.406 1.460 1.3 98
% yoy appreciation / (depreciation) vs. EUR 8.8% 2.1% 5.9%
EUR CAD 1.515 1.410 1.419 1.427
% yoy appreciation / (depreciation) vs. EUR 7.4% 6.5% 3.3%
Period Average End of Period
1Q 2016 1Q 2017 Mar 2017Dec 2016

T H I S D O C U ME N T I S P R O P R I E T A R Y A N D C O N F I D E N T I A L . N O P A R T O F T H I S D O C U ME N T MA Y B E D I S C L O S E D I N
A N Y MA N N E R T O A T H I R D P A R T Y W IT H O U T T H E P R I O R W R I TT E N C O N S E N T O F Y O O X N E T - A - P O R T E R G R O U P
@ynap
www.ynap.com
Follow us:
Recommended