Pacific Journal of Medical Sciences: Vol. 12, No 1, December 2013 ISSN: 2072 – 1625
0
PACIFIC JOURNAL OF MEDICAL SCIENCES
{Formerly: Medical Sciences Bulletin}
ISSN: 2072 – 1625
Pac. J. Med. Sci. (PJMS)
www.pacjmedsci.com. Email: [email protected].
DOCUMENTING CHALLENGES AND VIABLE STRATEGIES IN THE MEDICAL SUPPLY SYSTEM
OF THE CENTRAL PROVINCE, PAPUA NEW GUINEA
Geno Roalakona and Jackson A. K Lauwo
School of Medicine and Health Sciences, University of Papua New Guinea
Correspondence Author: J. A. K. Lauwo; Email: [email protected] & [email protected]

Pacific Journal of Medical Sciences: Vol. 12, No 1, December 2013 ISSN: 2072 – 1625
24
DOCUMENTING CHALLENGES AND VIABLE STRATEGIES IN THE MEDICAL SUPPLY SYSTEM
OF THE CENTRAL PROVINCE, PAPUA NEW GUINEA
Geno Roalakona and Jackson A. K Lauwo
School of Medicine and Health Sciences, University of Papua New Guinea
Correspondence Author: J. A. K. Lauwo; Email: [email protected] & [email protected]
ABSTRACT:
Central province is one of twenty two provinces that make up Papua New Guinea (PNG). With varied
vegetation from mountainous terrains to coastal plains, limited basic infrastructure, growing population
and lack of scheduled air services to remote areas make distribution of medical supplies a challenging
task for the province. Medical supply logistics studies have mostly been from government reports
which have deemed both the push and pull distribution systems as not fully functional. In addition, the
media has frequently pointed to shortage of medical supplies in Health centres (HCs), Health Sub-
Centres (HSCs) and provincial hospitals in PNG. There have been limited research reports in this area
of interest. Hence the need to study and document challenges facing the medical supplies procurement
and distribution system in the Central province as a typical setting area and suggest a viable
interventional system. This was a descriptive cross-sectional study designed to assess the extent of in-
province distribution of medical supplies and to identify viable strategies to improve the current system.
The study was conducted in Central province which is located along the south-east coast of mainland
PNG. Semi-structured questionnaires were used to carry out interviews with personnel‟s at HCs and
HSCs. In addition, two sets of structured questionnaires were developed to interview key informants
within the supply system and compare other distribution systems working within the province.
Furthermore, a tracking and monitoring form was used to assess the overall supply process of the
province. The findings indicated limited funding, non-availability of a reliable transport system,
inadequate storage space and limited adherence to standard operating procedures (SOPs) of inventory
control systems. In addition, fragmented communication and collaboration among the different parties
that use the system and the ill-defined roles and responsibilities of personnel along the pipeline
contributed to the current breakdown of the supply system in the province. There are medical supplies
reaching the rural HCs of Central province however, not as efficiently and effectively as anticipated.
Overall the whole medical supply distribution system lacked proper reporting and feedback
mechanisms to provide up-to-date logistics information from HCs to Area Medical Store (AMS) and vice
versa. The current pull distribution system should be maintained with viable strategies of introducing
„delivery teams‟ to provide the link between HCs and AMS; in doing so better advancements would be
seen in the medical supply distribution system.
KEYWORDS: Medical Supplies, Distribution, Supply System, Central Province, Papua New Guinea
Submitted: April 2013; Accepted: August 2013

Pacific Journal of Medical Sciences: Vol. 12, No 1, December 2013 ISSN: 2072 – 1625
25
INTRODUCTION:
Central province is one of the twenty-two
provinces that make up Papua New Guinea
(PNG). The province consists of four districts:
Abau, Rigo, Kairuku-Hiri and Goilala [1].
Vegetation varies from mountainous terrains to
coastal plains, limited basic infrastructure and a
population of about 237,016 with a growth rate
of 2.3% [2,3]. In addition there is lack of
scheduled air services to remote areas, which
makes distribution of medical supplies a
challenging task for the province. There are a
total of ten health centres (HCs); twenty-five
health sub-centres (HSCs) of which one was
closed down due to vandalism; two urban
clinics (UCs) and one hospital [2,4]. Over the
years the province rates poorly with respect to
the National Health Indicators; most HCs and
HSCs have deteriorated buildings over the
years that they rarely admit patients [2]. The
top five leading causes of morbidity and
mortality in the province are: pneumonia for
children < 5 years, malaria, accidents and
injuries, simple cough and other respiratory
tract problems [2, 5].
Logistics is defined as “the science (and art) of
getting the right amount of the right things to
the right places at the right times” [6] and
consists of four main components: selection,
procurement, distribution and utilisation. This
study will focus on the distribution aspect of
logistics; which begins when health
commodities are dispatched by the
manufacturer or supplier and ends when drug
consumption information is reported back to the
procurement unit [6]. Distribution of medical
supplies involves storage facilities and
transport links at various levels throughout the
supply system; there are two broad distribution
systems: pull and push systems. A distribution
system is considered a pull system when each
lower level of the system determines the types
and quantities required, hence determined by
the patient whilst a push system is when the
supply source at higher levels in the system
determine the types and quantities of health
commodities required for the patient. There
have been considerable number of studies
conducted worldwide varying from district,
state/province to national and multi-country
reports; recognising and finding ways of
improving accessibility and availability of
essential medicines at an affordable cost [7-
11]. In the Central province as well as in PNG
as a whole, information on medical supply
logistics have mostly been from government
reports which have deemed both push and pull
distribution systems as not fully functional [12-
14]. While media reports have emphasised
that health facilities around the country
experience chronic shortage of medical
supplies [15-19]. There are little or no
published reports on the scientific literature
about distribution of medical supplies in PNG
[20-23]. This apparent lack of scientific data
prompted this study to document challenges
with the current system in the Central province
and to suggest viable strategies for medical

Pacific Journal of Medical Sciences: Vol. 12, No 1, December 2013 ISSN: 2072 – 1625
26
supplies distribution system in the Central
province in order to eliminate the perennial
medicines shortages. The objectives of this
study were: to assess the current medical
supplies distribution activities in the Central
province with the aim of identifying the gaps
and the strengths of the system and to propose
viable strategies to improve the medical
supplies distribution system for the province.
MATERIALS AND METHODS:
Ethical clearance and approval to conduct the
study from the School of Medicine and Health
Science-University of Papua New Guinea,
Central Provincial Government and Medical
Research Advisory Committee-National
Department of Health were attained before
carrying out the study in Central province.
The semi-structured questionnaire from Jahre
et al [24] was modified and developed. The
questionnaire consisted of eight sections:
general information detailing interviewee and
health facility characteristics; human resource
and staff capacity; procedures for ordering
medicines and supplies; receiving procedures
and transportation links; storage checklist;
communication tools and recommendations.
Convenience sampling was used for selection
of HCs, HSCs and UCs in the province which at
the time of data collection was the most
applicable sampling method as bad weather
conditions, deteriorating road infrastructure and
safety mitigations prevented an initial
randomised sampling method. The inclusion
criteria required study units to be HCs, HSCs
and UCs and the facility had to exist and
operating, thus the hospital and a closed HSC
were excluded from the study. Interviews were
conducted using this health facility
questionnaire and a total of 23 health facilities
(HFs) out of 36 HFs were surveyed in the
province.
In addition, a HC requisition order tracking form
was developed to determine lead-times,
distribution costs incurred and modes of
transport used. Data were collected over a
period of eight months from 1st November
2011 to 30th June 2012. All completed HC
requisition order forms from Area Medical Store
(AMS) were collected, dates were used to
determine the ordering process from HCs to
AMS and back to HCs. Other data sources
included the supply section logbook and
transport logbook at the AMS. The content of
each HC requisition order form were collected
to determine order value and compare with
distribution costs incurred for each HC order
transported. Two other qualitative
questionnaires were developed. One set of
questionnaire focused at collecting data from
church agencies perspective. The other set of
qualitative questionnaire was used to interview
key informants in the private sector for
comparison with other distribution systems.
The data collected from the health facility
questionnaire were categorised under three
main variables: transportation, storage
conditions and inventory control. Analysis was
Pacific Journal of Medical Sciences: Vol. 12, No 1, December 2013 ISSN: 2072 – 1625
27
carried out using SPSS creating frequency
tables and cross-tabulating indicators. While
data gathered from the tracking of HC
requisition order form was analysed using MS
Excel 2007 application. The qualitative
questionnaires responses were categorised
according to key words prepared for each
question, then there were entered on to
separate master sheets.
Study strengths and limitations:
The study concentrates in providing current
issues of the distribution of medical supplies at
the provincial level. In doing so, provides viable
strategies that under current certain conditions,
these strategies if implemented can improve
the distribution of medical supplies in the
province. The results indicate at the provincial
and district levels, the current challenges faced
in providing an effective and efficient medical
supply distribution system. While the study as
attempted to include a holistic overview of the
medical supply distribution system, funding
limitations to travel to all surveyed health
facilities and verify storage conditions was
challenging. In addition, tracking of health
centre order forms by dates only gives relative
lead-times which would need to be verified
using other forms of tracking tools or devices.
RESULTS:
The results are structured according to the
three main variables: inventory control,
transportation and the storage conditions. It
begins with the overview of the distribution
activities and pathways found in the province.
In figure 1, sub-section 1, 1A and 1B illustrate
the pull system as the main source of medical
supplies to rural health facilities. The collection
of HC orders was seen to be the main method
of indicating distribution activities in the
province. The majority of medical supplies
were purchased by the government and
distributed by the AMS according to Medical
Stores Catalogue [25]. The church agencies
run their collection system independently from
the Provincial Health Office (PHO) with limited
liaison and collaboration.
All HC requisition orders forms need to be
approved by the PHO before been sent to
AMS. The vertical programs, such as, the
National TB program are managed at the
national level whereby overall coordination and
procurement are dealt with at this level
however, the distribution of these health
commodities utilise the pull system. Therefore
figure 1 shows that these vertical programs
come under PHO when been distributed in the
provinces.

Pacific Journal of Medical Sciences: Vol. 12, No 1, December 2013 ISSN: 2072 – 1625
28
PROVINCIAL HEALTH OFFICE
Transit storage for health commodities for the
province
HEALTH SUB-
CENTRE
AREA MEDICAL STORE
AID POST
HEALTH CENTRE
AID POST
TB Drugs
Mala-1
Treatment
HIV/AIDS
VACCINES
MEDICAL KITS
DISTRIBUTION
MINING COMPANY
PROCUREMENT
AND
DISTRIBUTION OF
MEDICAL
SUPPLIES
STORAGE SITES
National
Government
Funding
PHO/District
Distribution
funds
Development
Partner’s
Funding
Salvation Army,
Koki
Central Papua
Conference
SDA Health
services, Ela
Beach
Bereina Diocese
Catholic Health
Service, 6mile
East Papua
Circuit
United Church,
Kwikila station
PROCUREMENT
HEALTH CENTREHEALTH CENTRE
Door-to-Door DeliveryCollection at AMS
Place all orders
2/12
HC orders are
Collected at PHO
Collect orders
Deliver orders
Deliver to respective
Aidposts
1 2 3
KEY:
1A 1B
Pull system Push system
Church-runGovt-run
Figure 1: Diagram of distribution and procurement of medical supplies pathways in Central province, PNG
Pacific Journal of Medical Sciences: Vol. 12, No 1, December 2013 ISSN: 2072 – 1625
29
The push system designated as number 2 in
Figure 1 is a separate government sanctioned
program aimed at delivering essential
medicines directly to HCs, HSCs and aid posts.
At present, the medical kits are organised by
the Australian Agency for International
Development (AusAID) and distributed on a
door-to-door delivery schedule which is simply
considered as supplementary supplies by HCs
and HSCs. The third distribution system in
figure 1, designated as number 3 operates
completely independent of the other two
distribution systems. This system targets
health centre communities of immediate
interest to the mining sites and was therefore
not covered in this study.
Inventory Control:
Personnel in-charge of storeroom had
additional knowledge of medicines supply
management and or Standard Operating
Procedures (SOPs). The province showed that
slightly more than half (55%) of the officers had
SOP knowledge and drug supply management
against 45% who lacked this knowledge. With
adherence to SOPs a larger proportion of HC-
Dispensary workers with additional SOP
knowledge 7 (58.3%) usually used re-order
levels as opposed to 5 (41.7%) who did not
observe the rule. Over-ordering was seen to
be practiced at HCs and HSCs although SOP
knowledge was seen to be demonstrated in the
province, however only 11 (47.8%) indicated
this practice while 12 (52.1%) indicated
otherwise. Frequency of HC orders received
from AMS showed 9 (39.1%) HCs/HSCs
received 3 orders in a year, 7 HCs indicated
that orders were received 4 times in a year,
whilst only two HCs/HSCs showed that all 6
orders made to AMS were received in a year.
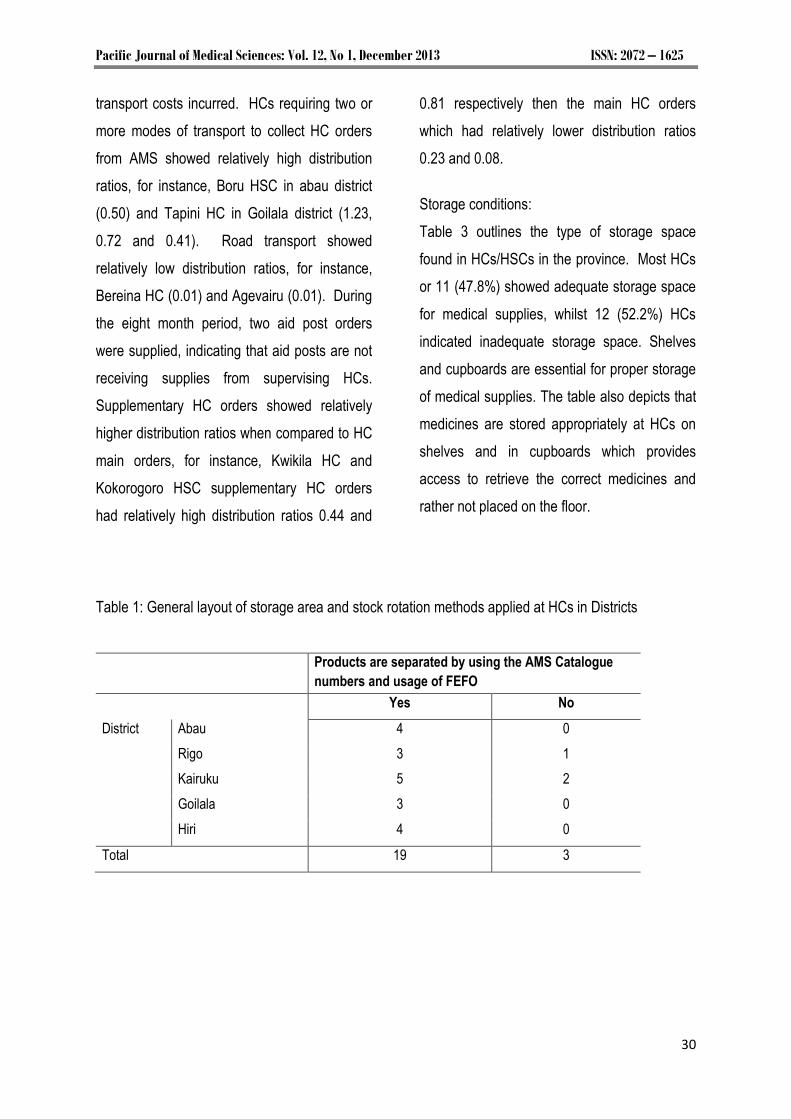
In proper management of stock and inventory
control, judicious stock rotation must be carried
out to ensure the usage of old stock first to
avoid losses due to premature expiry of
medicines. The data in Table 1 indicates that
almost all or 19 (86.4%) of the HCs/HSCs
stored and organised medicines in a manner
accessible for First-Expiry-First-Out (FEFO)
arrangement. Although only 3 (13.6%) deviated
from this practice and FEFO concept must
therefore be emphasised to the affected HCs.
Transportation:
The most used mode of transporting orders
was seen to be the usage of HC ambulances
(31%) followed by private transport (22%) and
mission vehicles (13%).
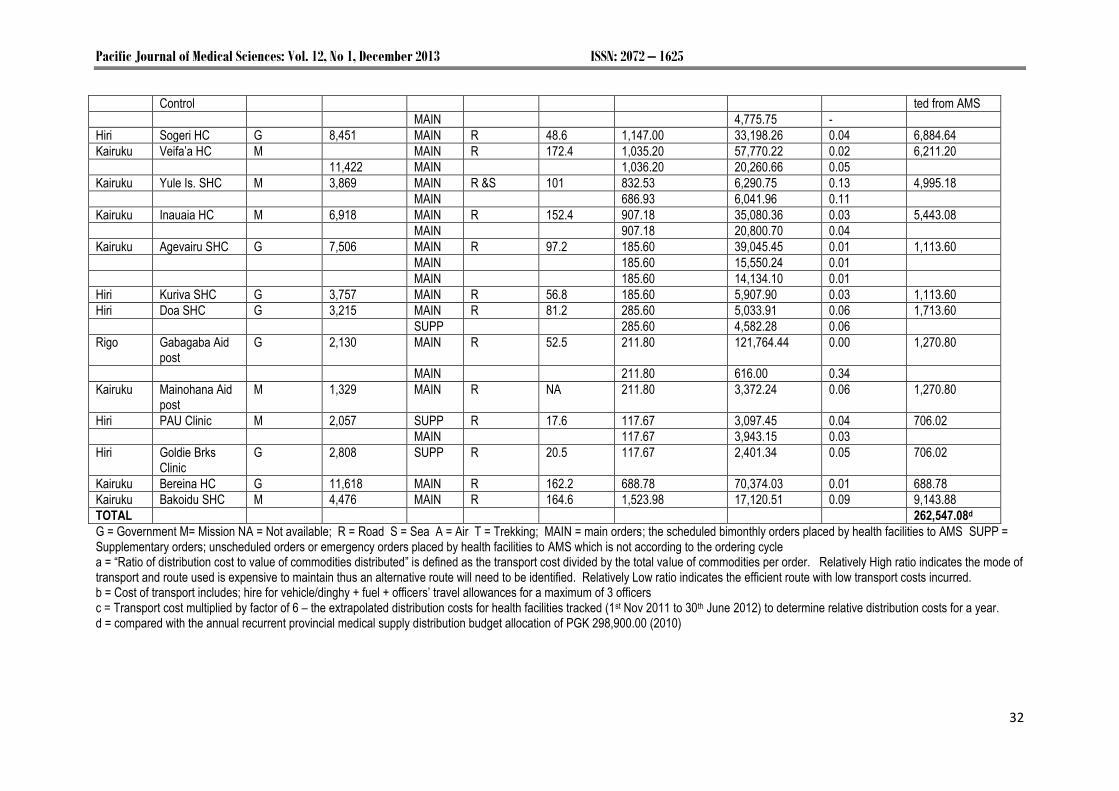
Table 2 depicts the comparison between
distribution cost ratio, mode of transport used,
costs incurred per order for all HC orders
obtained from the AMS between 1st November
2011 and 30th June 2012. The Relatively high
ratio indicates the mode of transport and route
used is expensive to maintain while a relatively
low ratio indicates the efficient route with low
Pacific Journal of Medical Sciences: Vol. 12, No 1, December 2013 ISSN: 2072 – 1625
30
transport costs incurred. HCs requiring two or
more modes of transport to collect HC orders
from AMS showed relatively high distribution
ratios, for instance, Boru HSC in abau district
(0.50) and Tapini HC in Goilala district (1.23,
0.72 and 0.41). Road transport showed
relatively low distribution ratios, for instance,
Bereina HC (0.01) and Agevairu (0.01). During
the eight month period, two aid post orders
were supplied, indicating that aid posts are not
receiving supplies from supervising HCs.
Supplementary HC orders showed relatively
higher distribution ratios when compared to HC
main orders, for instance, Kwikila HC and
Kokorogoro HSC supplementary HC orders
had relatively high distribution ratios 0.44 and
0.81 respectively then the main HC orders
which had relatively lower distribution ratios
0.23 and 0.08.
Storage conditions:
Table 3 outlines the type of storage space
found in HCs/HSCs in the province. Most HCs
or 11 (47.8%) showed adequate storage space
for medical supplies, whilst 12 (52.2%) HCs
indicated inadequate storage space. Shelves
and cupboards are essential for proper storage
of medical supplies. The table also depicts that
medicines are stored appropriately at HCs on
shelves and in cupboards which provides
access to retrieve the correct medicines and
rather not placed on the floor.
Table 1: General layout of storage area and stock rotation methods applied at HCs in Districts
Products are separated by using the AMS Catalogue
numbers and usage of FEFO
Yes No
District Abau 4 0
Rigo 3 1
Kairuku 5 2
Goilala 3 0
Hiri 4 0
Total 19 3

Pacific Journal of Medical Sciences: Vol. 12, No 1, December 2013 ISSN: 2072 – 1625
31
Table 2: Comparison between distribution ratio, mode of transport used, costs incurred per order for all health centres orders obtained from AMS during the period between 1st November 2011 to 30th June 2012 and the population it serves District Health facility Operating
Agency Population catchment (2012)
Order Type
Transport mode
Distance from AMS Km
Total cost of transporting commoditiesb
Kina (K)
Total value of commodities transported Kina (K)
Distribution Ratioa
Total Transport cost x 6c
Kina (K)
Abau Iruna HC M 10,640 MAIN R,S 328.1 5,555.68 22,004.78 0.25 33,334.08
Abau Boru SHC M 3,351 MAIN R,S 269.3 5,555.68 11,209.35 0.50 33,334.08
Abau Moreguina HC G 9,198 MAIN R 225.2 5,464.78 369,502.92 0.02 32,788.68
MAIN 5,464.78 18,248.19 0.30
Abau Kupiano HC G 25,141 MAIN R 193.9 2,959.18 23,322.95 0.13 17,755.08
MAIN 2,959.18 25,979.79 0.11
Abau Upulima SHC G 2,089 MAIN R 157.9 1,423.98 10,359.92 0.14 8,543.98
Rigo Kwikila HC G 29,350 MAIN R 85.8 1,155.15 42,987.98 0.03 17,755.08
MAIN 1,155.15 4,930.90 0.23
SUPP 1,155.15 2,648.40 0.44
MAIN 1,155.15 11,455.84 0.10
Rigo KAK SHC G 1,835 MAIN R 101.8 1,371.73 4,935.25 0.28 8,230.38
Rigo Hula SHC M 9,545 MAIN R 117.4 1,388.20 8,429.20 0.17 8,329.20
Rigo Boregaina SHC M 3,724 MAIN R 102.5 1,213.34 6,824.48 0.18 7,280.04
MAIN 1,213.34 1,364.50 0.89
Rigo Kokorogoro SHC
M 1,276 MAIN R 250 1,213.34 15,931.94 0.08 7,280.04
SUPP 1,213.34 1,492.00 0.81
Goilala Tapini HC G 6,894 MAIN R or A 123.4 2,659.18 2,156.61 1.23 15,955.08
MAIN 2,659.18 3,691.20 0.72
MAIN 2,659.18 6,483.78 0.41
MAIN 2,659.18 3,700.77 0.72
Goilala Tororo SHC M 1,443 MAIN A & T 138 2,449.27 19,742.70 0.12 14,695.62
Kairuku Akufa SHC M 2,827 MAIN R &S 205.2 2,667.44 10,398.79 0.26 16,004.64
MAIN 2,667.44 8,466.01 0.32
Hiri RMC UC G 20,300 MAIN R 4.1 24,320.38 - Delivered by AMS
MAIN 19,414.87 -
HQ PHO-Disease G SUPP R 4.1 14,063.70 - Delivered/collec
Pacific Journal of Medical Sciences: Vol. 12, No 1, December 2013 ISSN: 2072 – 1625
32
Control ted from AMS
MAIN 4,775.75 -
Hiri Sogeri HC G 8,451 MAIN R 48.6 1,147.00 33,198.26 0.04 6,884.64
Kairuku Veifa‟a HC M MAIN R 172.4 1,035.20 57,770.22 0.02 6,211.20
11,422 MAIN 1,036.20 20,260.66 0.05
Kairuku Yule Is. SHC M 3,869 MAIN R &S 101 832.53 6,290.75 0.13 4,995.18
MAIN 686.93 6,041.96 0.11
Kairuku Inauaia HC M 6,918 MAIN R 152.4 907.18 35,080.36 0.03 5,443.08
MAIN 907.18 20,800.70 0.04
Kairuku Agevairu SHC G 7,506 MAIN R 97.2 185.60 39,045.45 0.01 1,113.60
MAIN 185.60 15,550.24 0.01
MAIN 185.60 14,134.10 0.01
Hiri Kuriva SHC G 3,757 MAIN R 56.8 185.60 5,907.90 0.03 1,113.60
Hiri Doa SHC G 3,215 MAIN R 81.2 285.60 5,033.91 0.06 1,713.60
SUPP 285.60 4,582.28 0.06
Rigo Gabagaba Aid post
G 2,130 MAIN R 52.5 211.80 121,764.44 0.00 1,270.80
MAIN 211.80 616.00 0.34
Kairuku Mainohana Aid post
M 1,329 MAIN R NA 211.80 3,372.24 0.06 1,270.80
Hiri PAU Clinic M 2,057 SUPP R 17.6 117.67 3,097.45 0.04 706.02
MAIN 117.67 3,943.15 0.03
Hiri Goldie Brks Clinic
G 2,808 SUPP R 20.5 117.67 2,401.34 0.05 706.02
Kairuku Bereina HC G 11,618 MAIN R 162.2 688.78 70,374.03 0.01 688.78
Kairuku Bakoidu SHC M 4,476 MAIN R 164.6 1,523.98 17,120.51 0.09 9,143.88
TOTAL 262,547.08d
G = Government M= Mission NA = Not available; R = Road S = Sea A = Air T = Trekking; MAIN = main orders; the scheduled bimonthly orders placed by health facilities to AMS SUPP = Supplementary orders; unscheduled orders or emergency orders placed by health facilities to AMS which is not according to the ordering cycle a = “Ratio of distribution cost to value of commodities distributed” is defined as the transport cost divided by the total value of commodities per order. Relatively High ratio indicates the mode of transport and route used is expensive to maintain thus an alternative route will need to be identified. Relatively Low ratio indicates the efficient route with low transport costs incurred. b = Cost of transport includes; hire for vehicle/dinghy + fuel + officers‟ travel allowances for a maximum of 3 officers c = Transport cost multiplied by factor of 6 – the extrapolated distribution costs for health facilities tracked (1st Nov 2011 to 30th June 2012) to determine relative distribution costs for a year. d = compared with the annual recurrent provincial medical supply distribution budget allocation of PGK 298,900.00 (2010)

Pacific Journal of Medical Sciences: Vol. 12, No 1, December 2013 ISSN: 2072 – 1625
33
Table 3: The parameter of ample storage space with regards to the type of storage space used at
health centres
Adequate space Allocated storage space Presence of shelves and cupboards
Yes No dedicated building (stand-alone) Room
shared room Shelves
Cupboards Shelves + cupboards
Districts Abau 2 2 1 3 0 4 0 0
Rigo 2 2 1 2 1 3 0 1
Kairuku 2 5 6 1 6 1 0
Goilala 3 1 1 2 1 4 0 0
Hiri 2 2 0 4 0 3 0 1
Total 11 12 3 17 3 20 1 2
Percentage (%) 47.8 52.2 13.0 73.9 13.0 86.9 4.3 8.6
The organisations providing products and
services were assessed to evaluate their
supply systems in the province. The findings
showed that grocery items, fuel and other
products were the responsibility of the
consumer to determine their value and
necessity to their community and not their
distributor. Therefore the distribution systems
were pull systems for which customers
determined demand by travelling into the city to
access products and services. Warehousing
and storage were identified as the
organisations‟ own infrastructure, whilst
transportation was contracted out depending on
the mode of transport such as road, sea freight
and air freight. Nevertheless, health
commodities are products which are not
chosen by the customer but chosen for the
customer, and in this case, medicines are
chosen to treat the patients‟ illness. These
distribution systems have teams of logistics
officers coordinating distribution, this team work
feature lacks in the current medical supplies
distribution system in the province.
DISCUSSION:
Challenges and gaps in the current medical
supplies system in Central province
We found that medical supplies do reach the
HCs however not as effective and efficient as
anticipated even with the pull and push
systems operating concurrently in the province.
Medical supplies accounts for 3% of the total
PGK 3 million health budget and 18% of the
total recurrent budget of the province [26]. The
allocations include: funds for conducting SOP-
training in the province, conducting supervisory
visits, distributing medical supplies to rural
health facilities including aid posts and funds
for procuring medical equipments and
maintenance. This allocation is only for
government managed HCs and HSCs. Church

Pacific Journal of Medical Sciences: Vol. 12, No 1, December 2013 ISSN: 2072 – 1625
34
agencies receive health grants for overall
operational costs from the government – this
includes distribution costs. Comparing the
extrapolated relative distribution costs incurred
to the annual provincial health allocation (table
2) this apparently showed limited funds are
allocated for funding distribution in the
province. Therefore, PHO and respective
church agencies re-direct other funds towards
distribution costs. For instance, funds
earmarked for supervisory visits are re-directed
to transport charges. While for example in
Nigeria, it was found that there was a lack of
interest in funding the supply system which
contributed to low access to medicines and
supplies at health facilities [9].
The study showed that supervision along the
supply system was lacking thus logistics data
collection at health facilities contributed to lack
of reporting and feedback mechanisms. For
example, in Vanuatu, Brown and Gilbert found
similar issues of the lack of supervision among
actors in the distribution supply system [11].
They also observed that lack of supervision
was predominant amongst Pacific Island
Countries [11]. The findings suggest that there
was a lack of reporting and feedback
mechanism in the whole medical supplies
distribution system in the province. This
showed weakness in the proper distribution and
delivery planning, poor audit tracking and
monitoring of HC orders from AMS to HCs. For
instance, once a HC order leaves AMS
premises responsibility of the safe transporting
of HC orders were passed to PHO. Whether
the HC order was received in full or partial on a
timely manner to HCs was the responsibility of
PHO, which in turn was passed down to the
HCs. Logistics data gathered at HCs do not
reach the AMS. There were no processes or
procedures in place for lodging formal
complaints, feedbacks, dissatisfaction with
health commodity quality by HCs to the AMS.
In addition, all HC orders received from AMS
had 50% of items not available, frustrating HCs.
The findings showed that the bimonthly
ordering cycle for HCs favoured HCs with
closer proximity to the AMS while remote HCs
experienced difficulties in submitting and
collecting HC orders. There were relatively
long lead-times experienced (99 days ≈ 3
months) which was found to be longer than the
bimonthly ordering cycle. The relatively long
lead-time was influenced by: non-availability of
transport, slow submission of orders to AMS,
long picking and packing and slow collection of
orders by the HCs. The vertical programs such
as the National TB program also experienced
long lead-times between PHO to the HCs [27].
Although there were stock cards and stock
ledger books found at HCs, inventory was not
up-dated regularly: due to slackness of HC
dispensary worker, unavailability of stock cards
to be replenished and the lack of supervision
from PHO and AMS.
Viable strategies to improve the medical supply
distribution system in Central province

Pacific Journal of Medical Sciences: Vol. 12, No 1, December 2013 ISSN: 2072 – 1625
35
The medical supplies distribution system
should be simple with the purpose of obtaining
and moving medical supplies in a timely fashion
at a reasonable cost. An essential decision
must be made as to which levels of the
distribution system will order medicines and
supplies. Either a pull or push distribution
system are equally effective but to have both
systems run concurrently is seen has costly to
manage. However both push and pull
distribution systems can be mixed into one
supply system, the findings obtained would
suggest having both distribution systems mixed
into one supply system which would improve
accessibility of medicines and supplies to the
rural population. Whereby maintaining the
current pull system between AMS and HCs and
introducing the push system between HCs and
aid posts.
Centralising the medical supply distribution
system to the AMS, making AMS solely
responsible for distribution by placing reliable
ordering cycle schedules, tracking of HC orders
leaving AMS premises down to HCs, provide
good monitoring and surveillance practices with
strict adherence to SOPs. According to
Bossert et al, [28] a more centralised supply
system was found to be associated with better
performance in inventory control and
information systems.
One strategy is to create „delivery teams‟ that
would form an important aspect for
strengthening the medical supply system. This
„delivery teams‟ would consist of at least 3-4
trained officers; a driver and two assistants with
the roles to check stock status, make
adjustments and return expired stock to AMS,
provide training and supervision to HCs, and
ultimately deliver HC orders. This would
minimise over ordering incidences which were
observed, over stocking and re-distribution of
slow moving items, prevent losses through
expiration of stock, improve supervision, better
logistics information collected and increase
availability of medical supplies at HCs/HSCs.
This would successively provide quality
reporting and feedback information in the whole
medical supply system. The proposed
“Delivery teams” system in this study is similar
to a successful Delivery Team Topping-Up
(DUTT) system in Zimbabwe that saw effective
distribution of condoms for the prevention of
HIV/AIDS in the country. Since its introduction
in 2004 the DUTT system is still operating
effectively and has yielded positive results in
increasing the availability of products in difficult
environments by guaranteeing direct delivery to
health facilities and creating systematic
accountability at all points of procurement,
delivery and receipt of commodities [29,30].
We found that an unreliable transportation
system, lack of supervision from higher levels
of the supply system and limited adequate
storage space resulted in an inefficient and
ineffective medical supply distribution system in
the province. Therefore to improve the current
system, the establishment of delivery teams as
an important aspect which would provide the
Pacific Journal of Medical Sciences: Vol. 12, No 1, December 2013 ISSN: 2072 – 1625
36
link between HCs and AMS. This creates
supervised goods flow and information flow
along the supply system. Successively, this
would prompt adherence to SOPs, provide on-
the-job training for isolated officers and overall
better reporting and feedback mechanisms
along the supply system. This study has
greatly opened up opportunities for more
investigations in the other aspects of
pharmaceutical commodity logistics in the
country. Therefore, further research and
monitoring activities would be needed to further
investigate issues such as availability, rational
usage and other aspects of medical supplies
distribution systems in the country.
CONCLUSION:
There are medical supplies reaching the rural
HCs of Central province however, not as
efficiently and effectively as anticipated. There
are good operating procedures in place across
the province with a satisfactory level of drug
supply management knowledge however,
supervision from higher levels of the supply
system was lacking. Overall the whole medical
supply distribution system lacked proper
reporting and feedback mechanisms to provide
up-to-date logistics information from HCs to
AMs and vice versa. The current pull
distribution system should be maintained with
viable strategies of introducing „delivery teams‟
to provide the link between HCs and AMS; in
doing so better advancements would be seen
in the medical supply distribution system.
REFERENCES:
1. Papua New Guinea. National Research
Institute. Papua New Guinea district and
provincial profiles. Port Moresby, Papua New
Guinea: The Institute; 2010.
2. Central Province. Division of Health. Five year
strategic implementation plan. 1st draft. Port
Moresby, Papua New Guinea: 2011.
3. Papua New Guinea. National Statistical Office.
National population & housing census 2011:
preliminary figures. Port Moresby, PNG: The
Office; 2011.
4. List of health centres and aid posts in Papua
New Guinea. Port Moresby, PNG: Department
of Health; 2009. pp. 6-8.
5. Papua New Guinea. Department of Health.
National health plan 2010-2020: Volume 1.
Policies and strategies. Port Moresby, PNG:
The Department; 2010.
6. Foster SD. Logistics and supply. In: Halstead
JB, Walsh JA, editors; Rockefeller Foundation.
Why things work: case histories in
development: proceedings of a conference
held at the Bellagio Conference Center,
Bellagio, Italy, October 26-31, 1987. Boston,
MA: Adams Pub. Group; 1990. pp. 207
7. Banda M, Ombaka E, Logez S, Everard M.
Multi-country study of medicine supply and
distribution activities of faith-based
organizations in Sub-Saharan African countries
[Internet]. Geneva, Switzerland:
WHO/EPN,2006. WHO/PSM/PAR/2006.2.
[cited 2012 March 12].
http://www.who.int/medicines/areas/access/EN
_EPNstudy.pdf
8. Yusuff KB, Tayo F. Drug supply strategies,
constraints and prospects in Nigeria. Afr J
Med Med Sci.2004 Dec; 33(4):389-94.
9. Mohammed S, Magaji MG, Lawal GS, Masoud
MG. Medicine supply management in Nigeria:
a case study of Ministry of Health, Kaduna
State. Niger J Pharm Sci. 2007 [cited 2012
Sept 7]; 6(2):116-20.
www.abu.edu.ng/journals/njps/pdf/21.pdf
10. Roy C, Das JK, Jha HK, Bhattacharya V,
Shivdasani JP, Nandan D. Logistics and
supply management system of drugs at
different levels in Darbhanga District of Bihar.
Indian J Public Health [Internet]. 2009 [cited
2012 Feb 14]; 53(3):147-50.
Pacific Journal of Medical Sciences: Vol. 12, No 1, December 2013 ISSN: 2072 – 1625
37
11. Brown A, Gilbert B. The Vanuatu medical
supply system - documenting opportunities and
challenges to meet the Millennium
Development Goals. South Med Rev 2012
[cited 2012 Aug 20]; 5(1):14-21.
www.southernmedreview.org/index.php/smr/art
icle/view/1030
12. Medical Supplies Technical Review Mission:
report on key findings and recommendations.
Port Moresby, Papua New Guinea: Department
of Health; 2008.
13. Papua New Guinea. Department of Health.
Introducing a new medical kit to Papua New
Guinea. [Port Moresby, Papua New Guinea]:
The Department; 2009.
14. Papua New Guinea. Provincial and Local-level
Service Monitoring Authority. Case study of
district and facility funding report. Port
Moresby, Papua New Guinea: Department of
Health; 2009. pp. 79-82.
15. Pascoe N. Kimbe Hospital out of drugs. The
Post-Courier 201 Feb 14:5.
16. Medical scam is criminal [Editorial]. The Post-
Courier 2011 May 31:2.
17. Eroro S. Call to probe Health Department.
Post-Courier 2011 Apr 27:5.
18. Francis V. Zibe calls for improvement in health
services. National 2011 May 11:13.
19. Francis V. Staff: Malau must explain doubts.
The National 2011 Apr 29:10.
20. Wangumu K. Assessment of Medical Supplies
Distribution in Madang Province. Port
Moresby, Papua New Guinea: University of
Papua New Guinea; 2009.
21. Nipuega B. Assessment of Medical Supplies in
Milne Bay Province. Port Moresby, PNG:
University of Papua New Guinea; 2010.
22. Roalakona G. Assessment of Medical
Supplies Distribution in Abau District Central
Province. Port Moresby, Papua New Guinea:
University of Papua New Guinea; 2008.
23. Aruwafu HM, Amos A. HIV prevention in rural
economic enclaves: a health worker baseline
survey. [Port Moresby, PNG]: National
Research Institute; 2010 Dec. pp. 32-35.
Special publication no. 60.
24. Jahre M, Dumoulin L, Greenhalgh LB,
Hudspeth C, Limlim P, Spindler A. Improving
health in developing countries: reducing the
complexity of drug supply chains. Journal of
Humanitarian Logistics and Supply Chain
Management. 2012;[cited 2011 March 6];
2(1):54-84.
http://www.emeraldinsight.com/journals.htm?ar
ticleid=17031687
25. Papua New Guinea. Department of Health.
Medical and dental catalogue 2012. 10th ed.
[Port Moresby, Papua New Guinea]:
Department of Health & WHO; 2012.
26. Central Province. Division of Health. Annual
activity plan 2010. Port Moresby, Papua New
Guinea: The Division; 2010.
27. Wavimbukie G. Managing commodities for
tuberculosis: a vertical logistics approach.
Paper presented at: The Pharmaceutical
Society of Papua New Guinea Bi-annual
Conference; 2011 November 7-9; Port
Moresby, PNG.
28. Bossert TJ, Bowser DM, Amenyah JK. Is
decentralisation good for logistics systems?
Evidence on essential medicine logistics in
Ghana and Guatemala. Health Policy Plan.
2007; [cited 2012 August 7]; 22(2):73-82.
http://heapol.oxfordjournals.org/content/22/2/73
.full.pdf+html
29. Deliver. The Logistics handbook: a practical
guide for the supply chain management of
health commodities. 2nd ed. Arlington, VA:
DELIVER; 2011 [cited 2012 Apr 17].
http://deliver.jsi.com/dlvr_content/resources/all
pubs/guidelines/LogiHand.pdf
30. Deliver. Success Story: Delivery Team
Topping-Up: Bringing About Reliable
Distribution in Difficult Environments
[monograph online]. Arlington, VA: DELIVER;
2008 [cited 2013 Feb 15].
http://deliver.jsi.com/dlvr_content/resources/all
pubs/logisticsbriefs/ZW_DTTUBrin.pdf
Recommended


![Innovet project presentation kostelec en vesbe jkl 101010 [kompatibilitätsmodus]](https://img.pdfslide.us/doc/110x75/5462a0abaf7959f84e8b4f67/innovet-project-presentation-kostelec-en-vesbe-jkl-101010-kompatibilitaetsmodus.jpg)