PLYMOUTH PARK
C o n f i d e n t i a l M a r k e t S t u d y - 1 | P A G E
PROPERTY MANAGEMENT DEVELOPMENT AND INVESTMENT OF AN EXISTING
AND NEW COMMERCIAL, OFFICE, AND RESIDENTIAL COMPLEX |
PLYMOUTH PARK REGIONAL
CENTER (“PPRC”) MARKET STUDY
PLYMOUTH PARK
C o n f i d e n t i a l M a r k e t S t u d y - 2 | P A G E
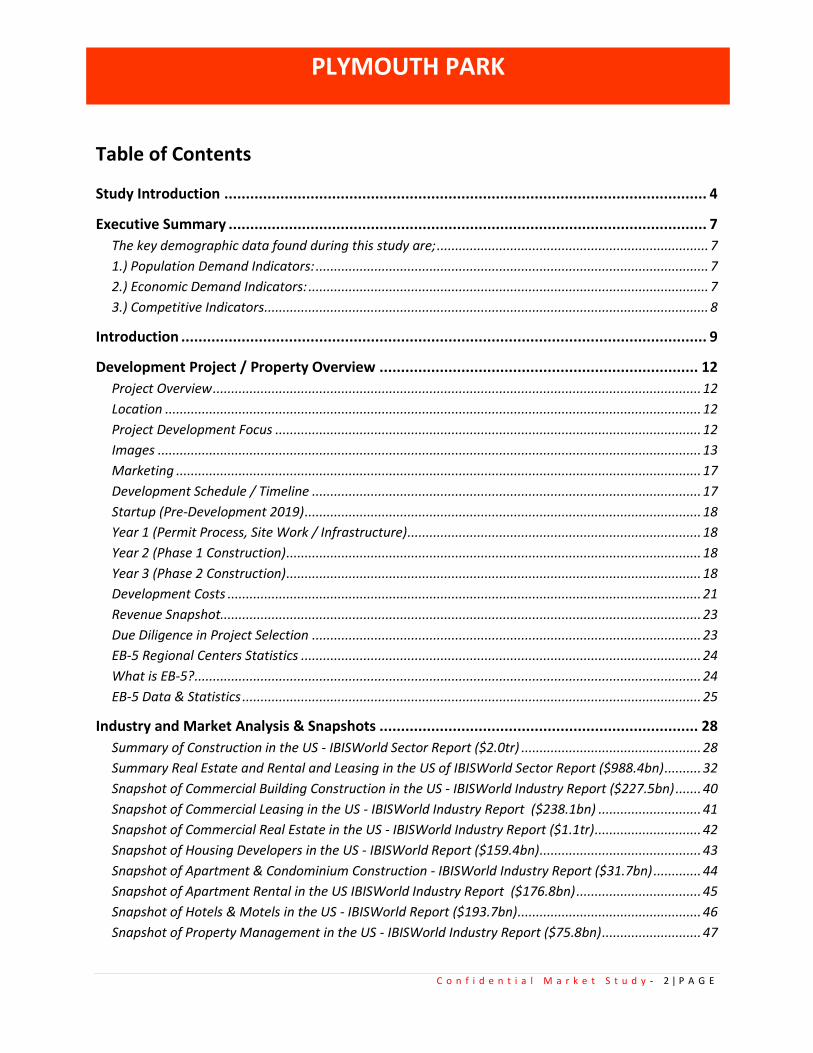
Table of Contents
Study Introduction ................................................................................................................ 4
Executive Summary ............................................................................................................... 7
The key demographic data found during this study are; .......................................................................... 7
1.) Population Demand Indicators: ........................................................................................................... 7
2.) Economic Demand Indicators: ............................................................................................................. 7
3.) Competitive Indicators ......................................................................................................................... 8
Introduction .......................................................................................................................... 9
Development Project / Property Overview .......................................................................... 12
Project Overview ..................................................................................................................................... 12
Location .................................................................................................................................................. 12
Project Development Focus .................................................................................................................... 12
Images .................................................................................................................................................... 13
Marketing ............................................................................................................................................... 17
Development Schedule / Timeline .......................................................................................................... 17
Startup (Pre-Development 2019) ............................................................................................................ 18
Year 1 (Permit Process, Site Work / Infrastructure) ................................................................................ 18
Year 2 (Phase 1 Construction) ................................................................................................................. 18
Year 3 (Phase 2 Construction) ................................................................................................................. 18
Development Costs ................................................................................................................................. 21
Revenue Snapshot................................................................................................................................... 23
Due Diligence in Project Selection .......................................................................................................... 23
EB-5 Regional Centers Statistics ............................................................................................................. 24
What is EB-5? .......................................................................................................................................... 24
EB-5 Data & Statistics ............................................................................................................................. 25
Industry and Market Analysis & Snapshots .......................................................................... 28
Summary of Construction in the US - IBISWorld Sector Report ($2.0tr) ................................................. 28
Summary Real Estate and Rental and Leasing in the US of IBISWorld Sector Report ($988.4bn) .......... 32
Snapshot of Commercial Building Construction in the US - IBISWorld Industry Report ($227.5bn) ....... 40
Snapshot of Commercial Leasing in the US - IBISWorld Industry Report ($238.1bn) ............................ 41
Snapshot of Commercial Real Estate in the US - IBISWorld Industry Report ($1.1tr) ............................. 42
Snapshot of Housing Developers in the US - IBISWorld Report ($159.4bn) ............................................ 43
Snapshot of Apartment & Condominium Construction - IBISWorld Industry Report ($31.7bn) ............. 44
Snapshot of Apartment Rental in the US IBISWorld Industry Report ($176.8bn) .................................. 45
Snapshot of Hotels & Motels in the US - IBISWorld Report ($193.7bn) .................................................. 46
Snapshot of Property Management in the US - IBISWorld Industry Report ($75.8bn) ........................... 47

PLYMOUTH PARK
C o n f i d e n t i a l M a r k e t S t u d y - 3 | P A G E
Snapshot of Shopping Mall Management in the US - IBISWorld Industry Report (Inc. developing and
managing regional & community shopping centers) IBISWorld Industry Report - ($23.2bn) ................ 48
Snapshot of Construction Project Management Services - IBISWorld Industry Report ($179.3bn) ....... 49
Retail Research Market Report - Dallas/Fort Worth Metro Area - Marcus & Millichap ........................ 50
CBRE & Other Report Snapshots ............................................................................................................. 53
Competitive and Other Alternatives ....................................................................................................... 60
Market Comparison ................................................................................................................................ 60
Target Market Profile .......................................................................................................... 61
PMA Full Census Demographics ............................................................................................................. 61
Population ............................................................................................................................................... 63
Income and Net Worth ........................................................................................................................... 65
Housing Profile ........................................................................................................................................ 73
Understanding Factors Making the Mixed-Use Development Popular .................................................. 76
Key Members of the Company ............................................................................................. 77
Elias Shokrian, Owner ............................................................................................................................. 77
Financial Analysis ................................................................................................................ 78
Ownership Structure/ Investment Structure ........................................................................................... 78
Assumptions............................................................................................................................................ 79
Exit Strategy ............................................................................................................................................ 81
5-Year Revenue Projections Summary Chart .......................................................................................... 81
Revenue & Rents Chart ........................................................................................................................... 82
Potential Impact Of Plymouth Park ........................................................................................................ 83
Conclusion ........................................................................................................................... 84

PLYMOUTH PARK
C o n f i d e n t i a l M a r k e t S t u d y - 4 | P A G E
Study Introduction
Introduction
A mixed-use development is a real estate project with
planned integration of some combination of retail, office,
residential, hotel, recreation or other functions. It is
pedestrian-oriented and contains elements of a live-work-
play environment. It maximizes space usage, has amenities
and architectural expression, and tends to mitigate traffic
and sprawl.1
Plymouth Park Regional Center, L.P. (PPRC) (also referred
to as “The Company”, "The Development", or "The
Project") is property management development and
investment of an existing and new commercial, office, and
residential complex business located in Irving, TX. The
geographic scope of PPRC’s operations will encompass four
contiguous counties of Dallas, Collin, Denton, and Tarrant
in the state of Texas.
PPRC will be responsible for the administration of all regional center operations, including
marketing, project selection and oversight, investor recruitment, and record-keeping. Annual
financial audits shall be performed by an outside third party accounting firm and compared and
balanced with the internal records.
Purpose
The purpose of this study is to provide the information necessary to evaluate the merits of the
value proposition and growth strategy of PPRC. The Company will demonstrate that there is a
large enough market to service; PPRC has the effective marketing strategies to grow and
expand the development. PPRC will also demonstrate that the Company has eliminated or
reduced as many variables of risk as possible.
1 This definition was presented at a recent conference on the topic sponsored byfour professional organizations in the real estate industry --
ICSC, NAIOP, NMHC &BOMA.
Plymouth Park
1735 N Story Rd,
Irving, TX 75061
Website: Pending
Contact
James Irving, CFO
Beverly Hills, CA 90211
310-550-1012 x 106
Legal Structure
Limited Partner (L.P.)
Ownership
Elias Shokrian: 100%
Founded
2019

PLYMOUTH PARK
C o n f i d e n t i a l M a r k e t S t u d y - 5 | P A G E
The primary goal of the study is to evaluate the demand in the Primary Market Area (“PMA”),
evaluate the feasibility of a mixed-use commercial, office, retail, and multi-family complex, and
to gather and present the data to support the Company plans for the City of Irving or financial
institutions.
Project Overview Plymouth Park Regional Center (“PPRC”) is wisely exploring the demand and impacts of the
existing and new commercial, office, and residential complex that should meet the overall
achievement of their objectives on the region as a whole.
The objective of the Plymouth Park development is to reestablish a mixed use environment
with a central role as a community center. Plymouth Park seeks to be familiar and comfortable
without being nostalgic or risk feeling fabricated. A Place where cultural diversity of work,
housing, retail, and socializing within an invested community brings a level of pride, belonging,
and shared success. This development area/park is to remain central in people’s daily lives and
form a collective identity around shared experiences, forming lasting memories, and
invigorating community pride.
Primary Market Area (“PMA”) The geographic scope of PPRC’s operations will encompass four contiguous counties of Dallas,
Collin, Denton, and Tarrant in the state of Texas. The Primary Market Area (“PMA”) is located at
Plymouth Park, 1735 N Story Rd, Irving, TX 75061 in Dallas County and surrounding counties
(see map below).

PLYMOUTH PARK
C o n f i d e n t i a l M a r k e t S t u d y - 6 | P A G E

PLYMOUTH PARK
C o n f i d e n t i a l M a r k e t S t u d y - 7 | P A G E
Executive Summary
After reviewing all of the available market demand and economic data points, the Company
finds strong market indicators for commercial, office, retail, and residential complexes to be
developed in the Primary Market Area (“PMA”). With a growing population, stable incomes,
and a fair cost of development and operations, the region needs developers/operator’s in the
PMA. The size, and scope of properties offered by the commercial, office, and residential
complex been determined by the Company and it is clear that market demand exists in the
area.
The key demographic data found during this study are;
1.) Population Demand Indicators:
There are currently over 4,867,729 residents age 18 and over, representing over 73% of the
total population.2
Fact Dallas County, TX
Collin County, TX
Denton County, TX
Tarrant County, TX
ALL (4) Counties
Population estimates, July 1, 2018 2,637,772 1,005,146 859,064 2,084,931 6,586,913
Population, percent change - April 1, 2010 (estimates base) to July 1, 2018
11.50% 28.50% 29.70% 15.10% 21.20%
2.) Economic Demand Indicators:
a.) Average income is strong at $71,643. The median household income in the US is $57,652.
Thus our PMA median household income is $13,991 higher than the national average.3
Income
Median household income (in 2017 dollars), 2013-2017 $71,643
Per capita income in past 12 months (in 2017 dollars), 2013-2017 $35,051
b.) The poverty rate is very low at 9.8% and is 2.45% lower than the national average in the
counties of Dallas, Collin, Denton, and Tarrant in the state of Texas.
2 https://www.census.gov/quickfacts/fact/table/dallascountytexas,collincountytexas,dentoncountytexas,tarrantcountytexas/PST045218 3 https://www.census.gov/quickfacts/fact/table/US,dallascountytexas,collincountytexas,dentoncountytexas,tarrantcountytexas/PST045218

PLYMOUTH PARK
C o n f i d e n t i a l M a r k e t S t u d y - 8 | P A G E
c.) With relatively narrow gaps between average and median home value, it is safe to assume
that home value in the region is stable, and not terribly price sensitive, with both median value
at $200,950; and medium gross rents of $1,076. 4
3.) Competitive Indicators
a.) While the market is not currently over-saturated, there are commercial, office, retail, and
residential complex choices that already exist in the state and region.
b.) Currently Planned development in the region is a positive indicator that demand is
outpacing supply.
c.) Scale is certainly going to be the core issue in differentiating from the current competitive
landscape. Most of the current locations are smaller operations, and a slightly larger multi
service approach could be well suited to the region.
Preliminary research into the availability of real estate has also been positive, with both lands
available for development, as well as other buildings that could potentially be converted. The
Company has selected a location already at in Plymouth Park, 1735 N Story Rd, Irving, TX 75061;
Dallas County.
It is also important to consider the cooperation and support the City of and PPRC already
demonstrated commitment to this project, and how that may ultimately help the four counties
populations.
Another primary concern for any operator is always the labor pool; however, the Company
found that the region has been providing highly qualified labor pools in the PMA for many
years. In the PMA, the civilian labor force, total, percent of population age 16 years or older is
at 70% plus. 5
Fact Dallas County, TX
Collin County, TX
Denton County, TX
Tarrant County, TX
ALL (4) Counties
In civilian labor force, total, percent of population age 16 years+
68.60% 71.10% 72.80% 68.20% 70.18%
In civilian labor force, female, percent of population age 16 years+
61.30% 63.20% 66.60% 61.40% 63.13%
Total employment 1,456,092 388,842 211,883 771,088 2,827,905
Total annual payroll 88,126,899 23,771,470 9,210,402 37,256,938 158,365,709
Total employment, percent change 3.10% 4.60% 4.50% 2.40% 3.65%
4 https://www.census.gov/quickfacts/fact/table/US,dallascountytexas,collincountytexas,dentoncountytexas,tarrantcountytexas/PST045218 5 https://www.census.gov/quickfacts/fact/table/US,dallascountytexas,collincountytexas,dentoncountytexas,tarrantcountytexas/PST045218

PLYMOUTH PARK
C o n f i d e n t i a l M a r k e t S t u d y - 9 | P A G E
Introduction
This Market Study provides information on identified community needs, commercial, office,
retail, and residential complex type and site location, combined with market, cost, and revenue
analysis information for project development. The Study is compatible with the industry
standards for mixed use developments, incorporates the needs of the community with
consideration given to the current options available to area residents due its growing
population and proximity to other developments.
Irving, TX, and the surrounding areas of four contiguous counties of Dallas, Collin, Denton, and
Tarrant constituting the PMA area are populous municipalities.
Irving6 is a principal city in Dallas County in the U.S. state of Texas and it is also an inner ring
suburb of the city of Dallas. According to a 2017 estimate from the United States Census
Bureau, the city population was 240,373[9] making it the thirteenth-most populous city in Texas
and 93rd most populous city in the U.S. The city of Irving is part of the Dallas–Fort Worth
metroplex.
Irving includes the Las Colinas community, one of the first master-planned developments in the
United States and once the largest mixed-use development in the Southwest with a land area of
more than 12,000 acres (4,856 ha). Las Colinas is home to the Mustangs at Las Colinas, which is
the largest equine sculpture in the world, as well as many Fortune 500 companies, such as
ExxonMobil, Kimberly-Clark and Fluor Corporation. In April 2019, the Westin Irving Convention
Center Hotel opened, signaling the completion of the city's special entertainment district that
includes the Irving Convention Center at Las Colinas and the Toyota Music Factory.[10]
Part of Dallas/Fort Worth International Airport lies inside the city limits of Irving.
In 2019, Irving completed its construction of an entertainment district in Las Colinas with the
opening of the Westin Irving Convention Center Hotel. [10] The entertainment district also
includes the Irving Convention Center at Las Colinas [14] and the Toyota Music Factory, an
entertainment complex with numerous restaurants, an Alamo Drafthouse Cinema, the Texas
Lottery Plaza open-air performance stage, and the Pavilion at the Toyota Music Factory concert
venue. [15]
6 https://en.wikipedia.org/wiki/Irving,_Texas

PLYMOUTH PARK
C o n f i d e n t i a l M a r k e t S t u d y - 10 | P A G E
According to the city's 2017-18 Comprehensive Annual Financial Report, [30] the city's top
employers are:
# Employer # of Employees
1 Citigroup, Inc. 7,500
2 Verizon Communications 3,260
3 Irving Mall 2,100
4 DFW International Airport 1,700
5 Allstate Insurance 1,650
6 Pioneer Natural Resources 1,400
7 Microsoft 1,351
8 Neiman Marcus Direct 1,339
9 Health Management Systems (HMS) 1,299
10 7-Eleven 800
Several large businesses have headquarters in Irving, including Caliber Home Loans, Chuck E.
Cheese's,[31] Cicis,[32] Commercial Metals,[33] Envoy Air (formerly American Eagle),[34]
ExxonMobil,[35] Gruma,[36] H.D. Vest,[37] Kimberly-Clark,[38] La Quinta Inns and Suites,[39] Michaels
Stores,[40] 7-Eleven,[41]Southern Star Concrete, Inc.,[42] Stellar,[43] a global contact center
provider, Zale Corporation,[44] Fluor Corporation,[45] NCH Corporation,[46] ITW Polymers Sealants
North America,[47] Celanese Corporation, a leading producer of specialty chemicals,[48] and LXI
Enterprise Storage.[49] The city is also home to the national headquarters of the Boy Scouts of
America.[50] The headquarters of Nokia America [51] and NEC Corporation of America [52] are in
Irving. The American headquarters of BlackBerry was in Irving.[53] Perhaps as a result of the
Nokia-Irving connection, Irving is twinned with Nokia's headquarters city, Espoo in Finland.
Irving is also the Headquarters of OSG USA INC., which is the North American Subsidiary of OSG
Corporation in Japan. OSG is a leading provider of high end cutting tools used in industries such
as automotive and aerospace.

PLYMOUTH PARK
C o n f i d e n t i a l M a r k e t S t u d y - 11 | P A G E
The city is the site of the University of Dallas[85] and North Lake College,[86] a campus of the
Dallas County Community College District. In addition, DeVry University [87] has a campus in
Irving.
Dallas County7 is a county in the U.S. state of Texas. As of the 2010 census, the population was
2,368,139.[2] It is Texas' second-most populous county and the ninth-most populous in the
United States. Its county seat is Dallas, [3] which is also Texas' third-largest city and the ninth-
largest city in the United States. The county was founded in 1846. Dallas County is included in
the Dallas–Fort Worth–Arlington, TX Metropolitan Statistical Area (colloquially referred to as
the Dallas-Fort Worth Metroplex).
Collin County8 is a county in the U.S. state of Texas. As of the 2010 United States Census, the
county's population was 782,341,[1] making it the seventh-most populous county in Texas and
the 63rd-largest county by population in the United States. The 2017 Census Bureau estimate
for Collin County's population is 969,603.[2] Its county seat is McKinney.[3] Collin County is part
of the Dallas-Fort Worth-Arlington, Texas Metropolitan Statistical Area. A small portion of the
city of Dallas is in the county.
Denton County9 is a county in the U.S. state of Texas. As of the 2010 census, its population was
662,614, [1] making it the ninth-most populous county in Texas. The county seat is Denton.[2]
The 2017 Census Bureau estimate for Denton County's population is 836,210.[3] The county,
which was named for John B. Denton, was established in 1846. Denton County is included in the
Dallas-Fort Worth-Arlington, TX Metropolitan Statistical Area. In 2007, it was one of the fastest-
growing counties in the United States.[4]
Tarrant County10 is a county in the U.S. state of Texas. As of 2010, it had a population of
2,054,475.[1] It is Texas' third-most populous county and the 16th-most populous in the United
States. Its county seat is Fort Worth.[2] Tarrant County, one of 26 counties created out of the
Peters Colony, was established in 1849 and organized the next year.[3] It was named in honor of
General Edward H. Tarrant of the Republic of Texas militia.[4] Tarrant County is part of the
Dallas–Fort Worth–Arlington, TX Metropolitan Statistical Area.
7 https://en.wikipedia.org/wiki/Dallas_County,_Texas 8 https://en.wikipedia.org/wiki/Collin_County,_Texas 9 https://en.wikipedia.org/wiki/Denton_County,_Texas 10 https://en.wikipedia.org/wiki/Tarrant_County,_Texas

PLYMOUTH PARK
C o n f i d e n t i a l M a r k e t S t u d y - 12 | P A G E
Development Project / Property Overview
Project Overview
Plymouth Park Regional Center (“PPRC”) is wisely exploring the demand and impacts of the
existing and new commercial, office, and residential complex that should meet the overall
achievement of their objectives on the region as a whole.
The objective of the Plymouth Park development is to reestablish a mixed use environment
with a central role as a community center. Plymouth Park seeks to be familiar and comfortable
without being nostalgic or risk feeling fabricated. A Place where cultural diversity of work,
housing, retail, and socializing within an invested community brings a level of pride, belonging,
and shared success. This development area/park is to remain central in people’s daily lives and
form a collective identity around shared experiences, forming lasting memories, and
invigorating community pride.
Location
The geographic scope of PPRC’s operations will encompass four contiguous counties of Dallas,
Collin, Denton, and Tarrant in the state of Texas. The Primary Market Area (“PMA”) is located at
Plymouth Park, 1735 N Story Rd, Irving, TX 75061 in Dallas County and surrounding counties.
Project Development Focus
• Community
• Comfort
• Cultural Diversity
• Pride
• Experience

PLYMOUTH PARK
C o n f i d e n t i a l M a r k e t S t u d y - 13 | P A G E
Images

PLYMOUTH PARK
C o n f i d e n t i a l M a r k e t S t u d y - 14 | P A G E

PLYMOUTH PARK
C o n f i d e n t i a l M a r k e t S t u d y - 15 | P A G E

PLYMOUTH PARK
C o n f i d e n t i a l M a r k e t S t u d y - 16 | P A G E
Zoning Regarding the permit process PPRC has started that process with meetings with city leaders and
department heads that want this project to move forward. They have discussed zoning,
entitlements, etc.

PLYMOUTH PARK
C o n f i d e n t i a l M a r k e t S t u d y - 17 | P A G E
Marketing
PPRC’s projects will be promoted to investors through agents specializing in EB-5 promotions.
Specific marketing activities may include EB-5 and immigration seminars, search firms/finders,
direct marketing, internet marketing, and other traditional advertising in accordance with local
laws and regulations. PPRC will provide general open market advertising as well as background
information to the general public regarding the PPRC and its investment projects. Marketing
materials will be specifically tailored to the region of focus, with appropriate translation of
written promotional materials and other marketing information.
Marketing & Promotional Activities Upon confirmed approval of the I-924 application, PPRC will use the services of marketing firms
in various countries abroad to gain exposure in the market. PPRC plans to promote its available
projects using print and online media channels. Written promotional materials and other
marketing information will be translated in multiple languages. In addition, PPRC will approach
family members and friends overseas in search of investor interests. They will attend shows or
conferences both domestic and overseas that specialize in EB-5, to introduce the project to
potential investors. They will speak with government official overseas to find opportunity to
meet foreign investors of high net-worth, and will continue to work with brokers and agents
who specialize in finding foreign investors interested in investing into EB-5 projects.
Marketing & Promotional Budget PPRC understands the need for a strong marketing strategy in light of competition with other
regional centers projects. PPRC’s initial budget for marketing and promotional activities is
$23,718. In its marketing and promotional efforts, PPRC will utilize marketing materials all of
which will be printed in multiple languages to ensure maximum exposure to potential investors.
Development Schedule / Timeline
Zoom In.
PROJECT TIMELINE
YEARS 2019 2020 (Yr 1) 2021 (Yr 2) 2022 (Yr 3) 2023 (Yr 4) 2024 (Yr 5)
QUARTERS 1 2 3 4 1 2 3 4 1 2 3 4 1 2 3 4 1 2 3 4 1 2 3 4
Admin / Pre-Development
Permit Process
Site Work / Infrastructure
Phase One
Phase Two
Phase Three
Delivery / Closeout
Operations / Management

PLYMOUTH PARK
C o n f i d e n t i a l M a r k e t S t u d y - 18 | P A G E
Schedule: Year 1 will be 2020. 2019 = pre-development work in process and will be included in the Start-
up table of the pro forma.
Startup (Pre-Development 2019)
Startup (Pre-development 2019: $2M) added to startup table “expenses” shown on cash flow
Jan. Yr 1
Year 1 (Permit Process, Site Work / Infrastructure)
Existing rent (74,073 SF)@$16 SF average per annum, 25% vacancy
Expenses: $2/SF CAM
Year 2 (Phase 1 Construction)
Existing rent after demolition (74,073 SF)@$16 SF average per annum, 50% vacancy
Expenses: $2/SF CAM
Year 3 (Phase 2 Construction)
Phase 1 rent

PLYMOUTH PARK
C o n f i d e n t i a l M a r k e t S t u d y - 19 | P A G E
Existing and new tenant rent
Office (69,340 SF)@$25/annum plus $4 SF CAM after 20% vacancy
Retail (200,871 SF)@$25 SF/annum plus $4 SF CAM after 20% vacancy
Movie Theater (90,272 SF)@$20 SF/annum plus $4 SF CAM, 0% vacancy
Expenses for above: $4 CAM/SF
Apartments: use 20% vacancy
RESIDENTIAL RENTS
Unit Type # Units Mo. Rent Ann. Rent
Studio (600 SF) 90 900.00 972,000
One Bed (800 SF) 210 1,200.00 3,024,000
Two Bed (1000 SF) 210 1,500.00 3,780,000
Three Bed (1200 SF) 90 1,800.00 1,944,000
Rentable SF: 540,000
Total SF: 599,937
TOTAL 600 9,720,000
Expenses: 15% of gross rent
Year 4 (Phase 3 construction)
Phase 2 rent

PLYMOUTH PARK
C o n f i d e n t i a l M a r k e t S t u d y - 20 | P A G E
Office (69,340 SF)@$25/annum plus $4 SF CAM after 20% vacancy
Retail (214,821 SF)@$25 SF/annum plus $4 SF CAM after 20% vacancy
Movie Theater (90,272 SF)@$20 SF/annum plus $4 SF CAM, 0% vacancy
Expenses for above: $4 CAM/SF
Apartments: 10% vacancy (Previous year rent with 3% increase) Expenses: 15% of gross rent
Year 5 (Operations)
Phase 3 rent
Office (69,340 SF)@$28/annum plus $4 SF CAM after 10% vacancy
Retail (214,821 SF)@$28 SF/annum plus $4 SF CAM after 10% vacancy
Movie Theater (90,272 SF)@$20 SF/annum plus $4 SF CAM, 0% vacancy
Hotel (90,000 SF) @$28 SF/annum plus $4 SF CAM after 0% vacancy
Expenses for above: $4 CAM/SF

PLYMOUTH PARK
C o n f i d e n t i a l M a r k e t S t u d y - 21 | P A G E
Apartments: 5% vacancy (Previous year rent with 3% increase) Expenses: 15% of gross rent
Development Costs
Plymouth Park / Conceptual Cost Estimate The following is a high-level conceptual cost estimate using unit costs from a variety of sources.
It is recommended that prior to this project advancing that a detailed Opinion of Probable Cost
be prepared by a qualified Contractor familiar with projects of this nature.
Pre-Development (Soft Costs) – $25M
# Category Units Cost Total
1. Demolition - Site, gross land area (modified) 27.8 Acres $200,000/acre: $5,560,000
2. Demolition - Buildings 312,000 SF $7.50/sf: $2,340,000
3. Multi-family Units, includes wrap parking structures 600 Units $165,000/unit:
$99,000,000
4. Shell retail under MF 65,200 SF $110.00/sf: $7,172,000
5. Parking & Site Improvements 20.0 Acres $250,000/ac: $5,000,000
6. Freestanding Retail buildings (< 5,000 ea.) 42,000 SF $200.00/sf: $8,400,000
7. Grade Level shell Retail (office above) 80,000 SF $95.00/sf: $7,600,000
8. Two story shell Office over retail 150,000 SF $135.00/sf: $20,250,000
9. Structured Parking, above grade 980 Sp $14,500/sp: $14,210,000
10. Hotel, limited service 150 Keys $225,000/key: $33,750,000
11. 14 Screen movie theater (shell only) over structured parking 91,000 SF $150/sf:
$13,650,000
12. Pavilion Buildings (two open air structures, in central plaza) 10,000 SF $275/sf:
$2,750,000
13. Central Plaza Improvements (higher intensity LS, water features, paving, lighting)
128,750 SF $25.00/sf: $3,218,750

PLYMOUTH PARK
C o n f i d e n t i a l M a r k e t S t u d y - 22 | P A G E
Total: $222,900,750 (rounded to $223M) plus $25M soft cost
Pre-Development soft costs include:
Architectural and Design Fees
Inspection Fees
Land and Real Estate Costs
Construction Equipment, Rentals, and Tools
Loan Interest and Accounting Fees
Project Management
Construction Insurance and Professional Dues
Local and State Taxes
Advertising and Public Relations
Additional Works and Studies
Notes (these correspond to the #'s above)
1. Gross land area includes abandoned ROW that is assumed to be integrated into the
site along W. Irving Blvd
2. Demolition of buildings is based on survey data and current aerial photos, $2.50 for
buildings, $5 for foundations
3. MF price is inclusive from face of building inwards, including structured parking, pool
courtyards, etc. Surface parking is in line item 5.
4. Retail shell under the MF has been broken out separately from the other retail areas
so as to allow for a different cost / sf.
5. Parking and site improvements is for all paving (to be concrete), landscaping,
flatwork, lighting & wayfinding in keeping w/ a upscale suburban MU project.
6. Freestanding retail building has been separated as these are assumed to have more
architectural detail and elements, including trellis's and patios.

PLYMOUTH PARK
C o n f i d e n t i a l M a r k e t S t u d y - 23 | P A G E
7. Grade level retail shell is generally 60' deep, wrapping parking structures. Assume
primarily storefront facades with masonry retailing and canopies
8. Office space will wrap parking structures, and have grade level lobbies plus direct
access from the parking garages
9. Structured parking includes the two parking structures wrapped by retail and office.
Price excludes exterior skin just cable rail on exposed facades
10. Cost includes porte cache and pool terrace, but excludes FF&E and OSE
11. The movie theater will have a grade level lobby and escalators and elevators to the
4th floor. Assume 4 large sets of fire stairs down to grade.
Theater is a 14 screen multi-plex design. Price is shell only.
12. There are two open air pavilions in the central plaza. The small one is intended to be
used as a band shell, the other a multi-purpose building.
13. The central plans is intended to have a higher level of design and detailing and the
SF has been broken out to allow for a higher $/sf cost
Revenue Snapshot
Due Diligence in Project Selection
PPRC may manage all investment project(s) as general partner, member, affiliate, or Sponsor.
PPRC will be actively involved in the project in different capacities dependent on how the EB-5
Year 1 Year 2 Year 3 Year 4 Year 5
Revenue $840,880 $592,584 $16,427,592 $16,762,392 $21,810,795
$0
$5,000,000
$10,000,000
$15,000,000
$20,000,000
$25,000,000
Axi
s Ti
tle
Revenue

PLYMOUTH PARK
C o n f i d e n t i a l M a r k e t S t u d y - 24 | P A G E
capital investment will be structured and initially invested into the project. Based on the
business objectives and requirements of a project, PPRC will invest EB-5 capital pursuant to
equity or fund provider structure.
It will be important for PPRC to select each project with detailed analysis of the income to be
generated for each development. A project must meet several criteria (where applicable) such
as:
1. Must be able to sustain the type of development selected.
2. Must have a beneficial economic package and/or local assistance.
3. Must be located in areas that meet the construction needs for the project.
4. Must have the ability to create the amount of jobs to justify the investment by
immigrant investors pursuant to the Immigration Investor Program.
5. Must create sufficient revenue to sustain its operations and provide a profit for those
involved.
After completing the analysis and carrying out all necessary due diligence, PPRC will make the
final determination as to whether the project is suitable for association with PPRC. For each
selected project, it will be determined and clearly presented to investors how much will be
funded by foreign EB-5 investor capital.
EB-5 Regional Centers Statistics
There are current 325 USCIS-approved EB-5 Regional Centers in operation across the United
States, with more being approved regularly. This is a sharp increase from the 27 regional
centers that operated in 2008. Regional centers can receive funding from multiple EB-5
investors, so long as each investor's investment creates 10 fulltime jobs, which can enable them
to accumulate more capital for their projects. Regional centers are also permitted to operate
multiple EB-5 projects simultaneously.11
What is EB-5?
Many countries around the world have immigrant investment programs. The most successful of
these programs are located in Australia, the United Kingdom, and the United States. Canada
previously enjoyed success with attracting investment dollars; however, parts of its program
have recently been closed. The United States immigrant investor program is called the EB-5
program, which is short for Employment Based 5th Preference. Successful completion of this
program by foreign investors' results in a permanent United States visa (specifically, permanent
11 https://www.eb5investors.com/eb5-basics/eb-5-regional-center

PLYMOUTH PARK
C o n f i d e n t i a l M a r k e t S t u d y - 25 | P A G E
residence or a green card for themselves and qualified family members at the time of filing the
initial petition). The program requires immigrant investors to make an at-risk investment (one
million dollars or $500,000 depending on the target of investment) that creates no fewer than
10 new American jobs.
If a foreign national invests $1 million (or $500,000 within a Targeted Employment Area) in a
business that creates ten new American jobs, the immigrant investor is eligible to obtain a
green card (permanent visa) for themselves and their qualifying family members. The program
has many other conditions, such as maintaining the investment throughout the EB-5 conditional
permanent residency period, increasing regional productivity, and other legal requirements.
The program is divided into two distinct phases. In the first phase the immigrant investor is
granted a conditional visa. After two years, the conditions on the visa are removed if the
investor has proven the creation of 10 new American jobs, maintained the required amount of
investment, and met the residency time requirement. At this point, the conditions of the visa
are removed and residency status becomes permanent.
EB-5 Data & Statistics 12
12 https://iiusa.org/eb5-stats/

PLYMOUTH PARK
C o n f i d e n t i a l M a r k e t S t u d y - 26 | P A G E

PLYMOUTH PARK
C o n f i d e n t i a l M a r k e t S t u d y - 27 | P A G E
Zoom in.

PLYMOUTH PARK
C o n f i d e n t i a l M a r k e t S t u d y - 28 | P A G E
Industry and Market Analysis & Snapshots
Summary of Construction in the US - IBISWorld Sector Report ($2.0tr)

PLYMOUTH PARK
C o n f i d e n t i a l M a r k e t S t u d y - 29 | P A G E

PLYMOUTH PARK
C o n f i d e n t i a l M a r k e t S t u d y - 30 | P A G E

PLYMOUTH PARK
C o n f i d e n t i a l M a r k e t S t u d y - 31 | P A G E

PLYMOUTH PARK
C o n f i d e n t i a l M a r k e t S t u d y - 32 | P A G E
Summary Real Estate and Rental and Leasing in the US of IBISWorld Sector Report ($988.4bn)

PLYMOUTH PARK
C o n f i d e n t i a l M a r k e t S t u d y - 33 | P A G E

PLYMOUTH PARK
C o n f i d e n t i a l M a r k e t S t u d y - 34 | P A G E

PLYMOUTH PARK
C o n f i d e n t i a l M a r k e t S t u d y - 35 | P A G E

PLYMOUTH PARK
C o n f i d e n t i a l M a r k e t S t u d y - 36 | P A G E

PLYMOUTH PARK
C o n f i d e n t i a l M a r k e t S t u d y - 37 | P A G E

PLYMOUTH PARK
C o n f i d e n t i a l M a r k e t S t u d y - 38 | P A G E

PLYMOUTH PARK
C o n f i d e n t i a l M a r k e t S t u d y - 39 | P A G E

PLYMOUTH PARK
C o n f i d e n t i a l M a r k e t S t u d y - 40 | P A G E
Snapshot of Commercial Building Construction in the US - IBISWorld Industry Report ($227.5bn)

PLYMOUTH PARK
C o n f i d e n t i a l M a r k e t S t u d y - 41 | P A G E
Snapshot of Commercial Leasing in the US - IBISWorld Industry Report ($238.1bn)

PLYMOUTH PARK
C o n f i d e n t i a l M a r k e t S t u d y - 42 | P A G E
Snapshot of Commercial Real Estate in the US - IBISWorld Industry Report ($1.1tr)

PLYMOUTH PARK
C o n f i d e n t i a l M a r k e t S t u d y - 43 | P A G E
Snapshot of Housing Developers in the US - IBISWorld Report ($159.4bn)

PLYMOUTH PARK
C o n f i d e n t i a l M a r k e t S t u d y - 44 | P A G E
Snapshot of Apartment & Condominium Construction - IBISWorld Industry Report ($31.7bn)

PLYMOUTH PARK
C o n f i d e n t i a l M a r k e t S t u d y - 45 | P A G E
Snapshot of Apartment Rental in the US IBISWorld Industry Report ($176.8bn)

PLYMOUTH PARK
C o n f i d e n t i a l M a r k e t S t u d y - 46 | P A G E
Snapshot of Hotels & Motels in the US - IBISWorld Report ($193.7bn)

PLYMOUTH PARK
C o n f i d e n t i a l M a r k e t S t u d y - 47 | P A G E
Snapshot of Property Management in the US - IBISWorld Industry Report ($75.8bn)

PLYMOUTH PARK
C o n f i d e n t i a l M a r k e t S t u d y - 48 | P A G E
Snapshot of Shopping Mall Management in the US - IBISWorld Industry Report (Inc. developing and managing regional & community shopping centers) IBISWorld Industry Report - ($23.2bn)

PLYMOUTH PARK
C o n f i d e n t i a l M a r k e t S t u d y - 49 | P A G E
Snapshot of Construction Project Management Services - IBISWorld Industry Report ($179.3bn)

PLYMOUTH PARK
C o n f i d e n t i a l M a r k e t S t u d y - 50 | P A G E
Retail Research Market Report - Dallas/Fort Worth Metro Area -
Marcus & Millichap 13
Developers Shifting Focus to New Areas As Tenant Demand Strong
Developers struggle to meet demand for retail space as job growth attracts a flurry of new
residents, retailers. Averages of 75,000 individuals have moved to the metroplex in each of the
past five years, producing strong demand for retailers. Despite developers bringing more than
21 million square feet of new space online over the past five years, overall vacancy has
retreated near a decade low. Tenant expansions have been broad across the metroplex, but the
tightest rates are in submarkets where additions to supply have been limited. East Dallas and
Central Dallas boast vacancy rates below 4 percent, with combined additions to inventory
totaling under 1 million square feet. Retail development remains limited in these areas, and
projects underway have strong preleasing activity, suggesting that vacancy will remain low in
the months to come.
13 Sources: Marcus &
Millichap Research Services; Bureau of Labor Statistics; CoStar Group, Inc.; Economy.com; Real Capital Analytics; TWR/Dodge Pipeline; U.S. Census Bureau.

PLYMOUTH PARK
C o n f i d e n t i a l M a r k e t S t u d y - 51 | P A G E

PLYMOUTH PARK
C o n f i d e n t i a l M a r k e t S t u d y - 52 | P A G E

PLYMOUTH PARK
C o n f i d e n t i a l M a r k e t S t u d y - 53 | P A G E
CBRE & Other Report Snapshots
Retail

PLYMOUTH PARK
C o n f i d e n t i a l M a r k e t S t u d y - 54 | P A G E
Office

PLYMOUTH PARK
C o n f i d e n t i a l M a r k e t S t u d y - 55 | P A G E
Multifamily

PLYMOUTH PARK
C o n f i d e n t i a l M a r k e t S t u d y - 56 | P A G E
Moran & Company

PLYMOUTH PARK
C o n f i d e n t i a l M a r k e t S t u d y - 57 | P A G E

PLYMOUTH PARK
C o n f i d e n t i a l M a r k e t S t u d y - 58 | P A G E
Dallas-Fort Worth Multifamily Report - Berkadia

PLYMOUTH PARK
C o n f i d e n t i a l M a r k e t S t u d y - 59 | P A G E

PLYMOUTH PARK
C o n f i d e n t i a l M a r k e t S t u d y - 60 | P A G E
Competitive and Other Alternatives
Market Comparison
In addition to the demographics, a feasibility study would examine existing structures or
buildings in the near vicinity of the projected land development. Information would include:
• The location of a similar project • Development similarities and project description • Historical financials; if available • Proposed construction costs
Las Colinas Development
Located near DFW airport and supports targeted lease revenue.

PLYMOUTH PARK
C o n f i d e n t i a l M a r k e t S t u d y - 61 | P A G E
Target Market Profile
There are several components that must be looked at when compiling a comprehensive
target Profile for the PMA;
1. Population – Trends and Demographics
2. Household Income
3. Housing Profile
PMA Full Census Demographics Fact14 (Officially updates every 10 years and estimates in between)
Dallas County, TX
Collin County, TX
Denton County, TX
Tarrant County, TX
ALL (4) Counties
Population estimates, July 1, 2018 2,637,772 1,005,146 859,064 2,084,931 6,586,913
Population, percent change - April 1, 2010 (estimates base) to July 1, 2018
11.50% 28.50% 29.70% 15.10% 21.20%
Persons under 5 years, percent 7.50% 6.30% 6.50% 7.10% 6.85%
Persons under 18 years, percent 26.40% 26.30% 25.10% 26.60% 26.10%
Persons 65 years and over, percent 10.50% 10.70% 9.80% 11.00% 10.50%
Female persons, percent 50.70% 50.80% 50.80% 51.00% 50.83%
White alone, percent 66.90% 71.30% 77.20% 73.60% 72.25%
Black or African American alone, percent 23.40% 10.20% 10.30% 17.10% 15.25%
American Indian and Alaska Native alone, percent
1.10% 0.70% 0.90% 0.90% 0.90%
Asian alone, percent 6.50% 15.00% 9.00% 5.70% 9.05%
Native Hawaiian and Other Pacific Islander alone, percent
0.10% 0.10% 0.10% 0.20% 0.13%
Two or More Races, percent 1.90% 2.70% 2.60% 2.50% 2.43%
Hispanic or Latino, percent 40.20% 15.30% 19.40% 28.90% 25.95%
White alone, not Hispanic or Latino, percent 29.20% 57.30% 59.30% 46.80% 48.15%
Veterans, 2013-2017 95,114 41,379 40,774 108,552 285,819
Foreign born persons, percent, 2013-2017 24.00% 19.70% 15.00% 16.00% 18.68%
Housing units, July 1, 2017 1,012,992 363,568 309,325 766,952 2,452,837
Owner-occupied housing unit rate, 2013-2017 50.50% 65.60% 64.50% 60.70% 60.33%
Median value of owner-occupied housing units, 2013-2017
$148,300 $265,300 $232,000 $158,200 $200,950
Median selected monthly owner costs -with a mortgage, 2013-2017
$1,483 $1,979 $1,841 $1,531 $1,709
Median selected monthly owner costs -without a mortgage, 2013-2017
$549 $766 $703 $565 $646
Median gross rent, 2013-2017 $984 $1,225 $1,109 $987 $1,076
14 https://www.census.gov/quickfacts/fact/table/US,dallascountytexas,collincountytexas,dentoncountytexas,tarrantcountytexas/PST045218

PLYMOUTH PARK
C o n f i d e n t i a l M a r k e t S t u d y - 62 | P A G E
Building permits, 2017 19,428 14,772 8,285 13,252 55,737
Households, 2013-2017 906,179 323,905 275,164 689,921 2,195,169
Persons per household, 2013-2017 2.8 2.8 2.8 2.8 2.8
Living in same house 1 year ago, percent of persons age 1 year+, 2013-2017
83.50% 85.40% 80.90% 82.80% 83.15%
Language other than English % age 5 years+, 2013-2017
42.60% 26.80% 23.10% 28.40% 30.23%
Households with a computer, percent, 2013-2017
87.20% 96.60% 95.80% 91.70% 92.83%
Households with a broadband Internet subscription, percent, 2013-2017
76.50% 90.10% 88.80% 81.60% 84.25%
High school graduate or higher, percent of persons age 25 years+, 2013-2017
78.30% 93.60% 92.00% 85.40% 87.33%
Bachelor's degree or higher, percent of persons age 25 years+, 2013-2017
30.10% 50.90% 43.40% 31.10% 38.88%
With a disability, under age 65 years, percent, 2013-2017
6.80% 4.40% 5.50% 7.50% 6.05%
Persons without health insurance, under age 65 years, percent
23.00% 12.10% 12.90% 18.40% 16.60%
In civilian labor force, total, percent of population age 16 years+, 2013-2017
68.60% 71.10% 72.80% 68.20% 70.18%
In civilian labor force, female, percent of population age 16 years+, 2013-2017
61.30% 63.20% 66.60% 61.40% 63.13%
Total accommodation and food services sales, 2012 ($1,000)
6,753,112 1,892,304 1,138,787 4,483,569 14,267,772
Total health care and social assistance receipts/revenue, 2012 ($1,000)
19,683,164 4,766,299 2,473,817 11,276,184 38,199,464
Total manufacturers shipments, 2012 ($1,000) 37,035,625 8,652,862 6,886,892 45,771,009 98,346,388
Total merchant wholesaler sales, 2012 ($1,000)
80,604,971 18,366,839 16,900,016 30,173,253 146,045,079
Total retail sales, 2012 ($1,000) 35,957,895 14,623,924 8,273,978 28,908,781 87,764,578
Total retail sales per capita, 2012 $14,654 $17,521 $11,698 $15,376 $59,249
Mean travel time to work (minutes), workers age 16 years+, 2013-2017
27.2 28.7 28.9 27 27.95
Median household income (in 2017 dollars), 2013-2017
$53,626 $90,124 $80,290 $62,532 $71,643
Per capita income in past 12 months (in 2017 dollars), 2013-2017
$29,810 $41,609 $37,928 $30,857 $35,051
Persons in poverty, percent 14.80% 5.90% 7.10% 11.60% 9.85%
Total employer establishments, 2016 65,781 22,620 14,284 41,261 143,946
Total employment, 2016 1,456,092 388,842 211,883 771,088 2,827,905
Total annual payroll, 2016 ($1,000) 88,126,899 23,771,470 9,210,402 37,256,938 158,365,709
Total employment, percent change, 2015-2016 3.10% 4.60% 4.50% 2.40% 3.65%
Total nonemployer establishments, 2016 233,530 89,459 71,031 170,222 564,242
All firms, 2012 259,298 82,009 63,243 173,389 577,939
Men-owned firms, 2012 139,455 43,440 33,618 89,352 305,865
Women-owned firms, 2012 96,076 28,588 22,404 66,250 213,318
Minority-owned firms, 2012 127,961 24,828 18,305 71,133 242,227
Nonminority-owned firms, 2012 122,666 54,508 43,019 96,361 316,554
PLYMOUTH PARK
C o n f i d e n t i a l M a r k e t S t u d y - 63 | P A G E
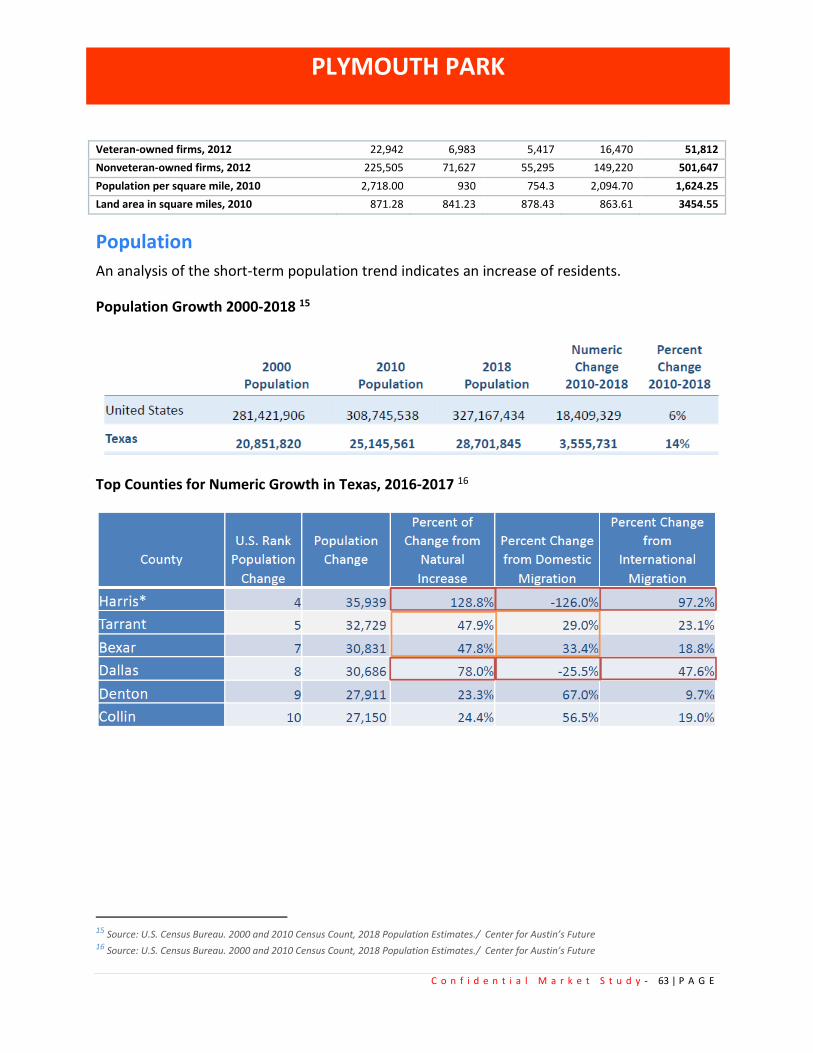
Veteran-owned firms, 2012 22,942 6,983 5,417 16,470 51,812
Nonveteran-owned firms, 2012 225,505 71,627 55,295 149,220 501,647
Population per square mile, 2010 2,718.00 930 754.3 2,094.70 1,624.25
Land area in square miles, 2010 871.28 841.23 878.43 863.61 3454.55
Population
An analysis of the short-term population trend indicates an increase of residents.
Population Growth 2000-2018 15
Top Counties for Numeric Growth in Texas, 2016‐2017 16
15 Source: U.S. Census Bureau. 2000 and 2010 Census Count, 2018 Population Estimates./ Center for Austin’s Future 16 Source: U.S. Census Bureau. 2000 and 2010 Census Count, 2018 Population Estimates./ Center for Austin’s Future

PLYMOUTH PARK
C o n f i d e n t i a l M a r k e t S t u d y - 64 | P A G E
County to County Migration Flows 17
Dallas/Fort Worth Metro Area Five-Year Population Growth 18
17 Source: U.S. Census Bureau. 2000 and 2010 Census Count, 2018 Population Estimates./ Center for Austin’s Future 18 Retail Research | Market Report DFW retail

PLYMOUTH PARK
C o n f i d e n t i a l M a r k e t S t u d y - 65 | P A G E
Income and Net Worth
Another key component of the Target Profile is the income of the various population sectors.
The population base served by the complex must have sufficient income to utilize the
commercial, office, and residential rents and be engaged to ensure the success of the project.
Please keep in mind the following definitions;
Average Household Income: The total income of an entire population grouping divided by the
number of households in the same population grouping.
Median Household Income: A mid-point between the income of the household(s) with the
lowest income range and the household(s) at the highest income range within the same
population grouping.
Average Net Worth: The total net worth of an entire population grouping divided by the
number of households in the same population grouping.

PLYMOUTH PARK
C o n f i d e n t i a l M a r k e t S t u d y - 66 | P A G E
Median Net Worth: A mid-point between the net worth of the household(s) with the lowest
range and the household(s) at the highest range within the same population grouping.
Average income is strong at $71,643. The median household income in the US is $57,652. Thus
our PMA median household income is $13,991 higher than the national average.19
Income
Median household income (in 2017 dollars), 2013-2017 $71,643
Dallas Area - CBRE
19 https://www.census.gov/quickfacts/fact/table/US,dallascountytexas,collincountytexas,dentoncountytexas,tarrantcountytexas/PST045218

PLYMOUTH PARK
C o n f i d e n t i a l M a r k e t S t u d y - 67 | P A G E

PLYMOUTH PARK
C o n f i d e n t i a l M a r k e t S t u d y - 68 | P A G E

PLYMOUTH PARK
C o n f i d e n t i a l M a r k e t S t u d y - 69 | P A G E

PLYMOUTH PARK
C o n f i d e n t i a l M a r k e t S t u d y - 70 | P A G E

PLYMOUTH PARK
C o n f i d e n t i a l M a r k e t S t u d y - 71 | P A G E

PLYMOUTH PARK
C o n f i d e n t i a l M a r k e t S t u d y - 72 | P A G E

PLYMOUTH PARK
C o n f i d e n t i a l M a r k e t S t u d y - 73 | P A G E
Housing Profile
Another component of the Target Profile is to identify the type of households where targets are
currently living.
Often, the sale or rental of a target-occupied dwelling provides the funds necessary to provide
for a target care commercial, office, and residential complex.
Fact20 (Officially updates every 10 years and estimates in between)
Dallas County, TX
Collin County, TX
Denton County, TX
Tarrant County, TX
ALL (4) Counties
Population estimates, July 1, 2018 2,637,772 1,005,146 859,064 2,084,931 6,586,913
Housing units, July 1, 2017 1,012,992 363,568 309,325 766,952 2,452,837
Owner-occupied housing unit rate, 2013-2017 50.50% 65.60% 64.50% 60.70% 60.33%
Median value of owner-occupied housing units, 2013-2017
$148,300 $265,300 $232,000 $158,200 $200,950
Median selected monthly owner costs -with a mortgage, 2013-2017
$1,483 $1,979 $1,841 $1,531 $1,709
Median selected monthly owner costs -without a mortgage, 2013-2017
$549 $766 $703 $565 $646
Median gross rent, 2013-2017 $984 $1,225 $1,109 $987 $1,076
Building permits, 2017 19,428 14,772 8,285 13,252 55,737
Households, 2013-2017 906,179 323,905 275,164 689,921 2,195,169
Persons per household, 2013-2017 2.8 2.8 2.8 2.8 2.8
Living in same house 1 year ago, percent of persons age 1 year+, 2013-2017
83.50% 85.40% 80.90% 82.80% 83.15%
Median household income (in 2017 dollars), 2013-2017
$53,626 $90,124 $80,290 $62,532 $71,643
Per capita income in past 12 months (in 2017 dollars), 2013-2017
$29,810 $41,609 $37,928 $30,857 $35,051
20 https://www.census.gov/quickfacts/fact/table/US,dallascountytexas,collincountytexas,dentoncountytexas,tarrantcountytexas/PST045218

PLYMOUTH PARK
C o n f i d e n t i a l M a r k e t S t u d y - 74 | P A G E
Texas Housing

PLYMOUTH PARK
C o n f i d e n t i a l M a r k e t S t u d y - 75 | P A G E

PLYMOUTH PARK
C o n f i d e n t i a l M a r k e t S t u d y - 76 | P A G E
Understanding Factors Making the Mixed-Use Development Popular
Factors Making the Mixed-Use Development Popular
From the developer’s perspective a mixed-use development is identified as being a popular
format because it is perceived as providing the following benefits:
• Convenience of live-work-play options in a single location
• Satisfying the desire to live in more of a small-town (e.g. "Main Street") environment.
This desire is brought about by changing demographics and psychographics favoring the
property type
• Reducing traffic congestion
Again from the developer’s perspective a mixed-use development is fostered by the following
occurrences:
• Rising land prices
• Encouragement by local public agencies (economic development, planning, zoning
board, etc.)
Finally, a developer’s “optimal land use plan” for a mixed-use development has been stated as:
• Highest land density
• Most rapid absorption of finished sites at the highest price
• Highest present value of the project
Factors Leading to the Financial Success of a Mixed-use Development
Factors leading to the financial success of a mixed-use development can be grouped in the
following categories:
• Economic and Market
• Financial
• Physical
• Design
• Public Issues

PLYMOUTH PARK
C o n f i d e n t i a l M a r k e t S t u d y - 77 | P A G E
Key Members of the Company
Elias Shokrian, Owner
Elias Shokrian managing partner of Calitex, LLC has been in real estate development,
investment and management since 1975. Under various partnerships, Mr. Shokrian has
invested and managed numerous apartments as well as many shopping center properties in
Southern California and Texas. Some cities include Beverly Hills, West LA, San Fernando, Los
Angeles, Santa Monica, Hollywood, West Hollywood, North Hollywood, Bell Gardens,
Hawthorne, Compton, Glendale, Paramount, Panorama City, Dallas TX, Desoto TX, Allen TX,
Lancaster TX, Dayton Ohio. He has completed ground-up construction on apartments, mix-use,
condos and strip retail centers. Currently Mr. Shokrian owns and operates over 2.5 million
square feet in California and Texas.
The followings are some of the projects developed by Mr. Shokrian:
1. High rise unit condo project on Wilshire Blvd. in West LA.
2. 16 unit town house project on Berkley St., Santa Monica
3. 7 unit town house project on West Knoll St., West Hollywood,
4. 30 unit condo project on Moorpark St., N. Hollywood
5. 10,000 SQFT retail strip center at Laurel Canyon Blvd and Terra Bella St., San Fernando Valley
6. 16,000 SQFT strip retail project at Rosecrans & Wilmington, Compton
7. 15,000 SQFT project on Eastern Ave., Bell Gardens
8. 22,000 SQFT retail project at Virgil St. & Silver Lake, Los Angeles
9. 16,000 SQFT retail project at Santa Monica Blvd. & Hancock Ave., W. Hollywood
10. 6,000 SQFT retail strip center at Van Nuys & Telfair. Pacoima
11. 40,000 SQFT 12 unit Townhome Uptown Dallas TX
12. 25,000 SQFT SFR in Hartford, Beverly Hills
13. 3,000 SQFT Oakhurst, Beverly Hills
14. 40,000 SQFT six storey mix use retail on Robertson Blvd., LA
15. 32 unit apartment building (Rehab) on Flores St. W. Hollywood and complete rehab
16. 62,000 SQFT public storage on Amar Rd., City of Industry
17. Facelift for 100,000 sqft Shopping Center, Dallas TX
18. 85,000 sqft of retail, facelift, Desoto, TX
19. 108 unit apartment building ground up construction in Hawthorne, CA
Currently in progress:
1. 40.000 SQFT two story retail, Starbucks on Roscoe Blvd. & Woodman St.
2. 12,000 SQFf SFR in Malibu

PLYMOUTH PARK
C o n f i d e n t i a l M a r k e t S t u d y - 78 | P A G E
Financial Analysis
Ownership Structure/ Investment Structure
SEJ ONE, L.P. (“SEJ ONE”), a new commercial enterprise (“NCE”), is a Limited Partnership
formed in the state of Texas. The NCE was formed to finance the development, construction,
management, and leasing of three mixed-use complex, which includes multifamily space, retail
space, office space, and parking space (the “Project”). The development of the Project will be
overseen by the job creating entity (“JCE”) SEJ Properties, L.P. (“SEJ Properties”).
The Project will be under Plymouth Park Regional Center (“PPRC”). PPRC is seeking approval as
a regional center by the U.S. Citizenship and Immigration Services (“USCIS”) to encompass the
four (4) counties of Dallas, Collin, Denton and Tarrant in the state of Texas.
Ownership of the proposed commercial, office, and residential complex has been discussed and
is as follows: Elias Shokrian, Owner, 100%.
For each capital investment project, investment capital will be contributed by individual alien
investors into a new commercial enterprise (“NCE”), either a corporation (“Inc.”), limited
partnership (“LP”) or a limited liability company (“LLC”), in exchange for shares, limited
partnership interests or membership interests. PPRC or its subsidiary will serve as general
partner, member, affiliate or sponsor for each new commercial enterprise. The number of
investors in the new commercial enterprise will be determined by the project costs and job
creation projection associated with the particular project.
Each new commercial enterprise may either undertake the job creating project directly (“equity
structure”) or may fund a job creating project either by making a direct equity investment or by
making a loan to the entity that will develop and/or operate the project (“fund provider
structure”). The type of investment structure selected will depend on business opportunities
and requirements on a project-by-project basis. Under all investment structure options, foreign
investors will make at-risk equity investments into a new commercial enterprise that will use
the capital investment funds to directly operate or direct funds into a project that will result in
job creation.

PLYMOUTH PARK
C o n f i d e n t i a l M a r k e t S t u d y - 79 | P A G E
Financing Needed / Use of Funds Total=$248,000,000
Pre-Development (Soft Costs) – $25M
# Category Units Cost Total
1. Demolition - Site, gross land area (modified) 27.8 Acres $200,000/acre: $5,560,000
2. Demolition - Buildings 312,000 SF $7.50/sf: $2,340,000
3. Multi-family Units, includes wrap parking structures 600 Units $165,000/unit:
$99,000,000
4. Shell retail under MF 65,200 SF $110.00/sf: $7,172,000
5. Parking & Site Improvements 20.0 Acres $250,000/ac: $5,000,000
6. Freestanding Retail buildings (< 5,000 ea.) 42,000 SF $200.00/sf: $8,400,000
7. Grade Level shell Retail (office above) 80,000 SF $95.00/sf: $7,600,000
8. Two story shell Office over retail 150,000 SF $135.00/sf: $20,250,000
9. Structured Parking, above grade 980 Sp $14,500/sp: $14,210,000
10. Hotel, limited service 150 Keys $225,000/key: $33,750,000
11. 14 Screen movie theater (shell only) over structured parking 91,000 SF $150/sf:
$13,650,000
12. Pavilion Buildings (two open air structures, in central plaza) 10,000 SF $275/sf:
$2,750,000
13. Central Plaza Improvements (higher intensity LS, water features, paving, lighting)
128,750 SF $25.00/sf: $3,218,750
Total: $222,900,750 (rounded to $223M) plus $25M soft cost = $248,000,000
Assumptions
• Year 1 will be 2020 etc. 2019 is pre-development work in process and will be included in
the Start-up table of the pro forma.
• Startup (Pre-development 2019: $2M) added to startup table “expenses” shown on cash
flow Jan. Yr 1
Year 1 (Permit Process, Site Work / Infrastructure)
• Existing rent (74,073 SF)@$16 SF average per annum, 25% vacancy
• Expenses: $2/SF CAM

PLYMOUTH PARK
C o n f i d e n t i a l M a r k e t S t u d y - 80 | P A G E
Year 2 (Phase 1 construction)
• Existing rent after demolition (74,073 SF)@$16 SF average per annum, 50% vacancy
• Expenses: $2/SF CAM
Year 3 (Phase 2 construction)
• Phase 1 rent
• Existing and new tenant rent
• Office (69,340 SF)@$25/annum plus $4 SF CAM after 20% vacancy
• Retail (200,871 SF)@$25 SF/annum plus $4 SF CAM after 20% vacancy
• Movie Theater (90,272 SF)@$20 SF/annum plus $4 SF CAM, 0% vacancy
• Expenses for above: $4 CAM/SF
• Apartments: use 20% vacancy
RESIDENTIAL RENTS
Unit Type # Units Mo. Rent Ann. Rent
Studio (600 SF) 90 900.00 972,000
One Bed (800 SF) 210 1,200.00 3,024,000
Two Bed (1000 SF) 210 1,500.00 3,780,000
Three Bed (1200 SF) 90 1,800.00 1,944,000
Rentable SF: 540,000
Total SF: 599,937
Ave
TOTAL 600 1,350 9,720,000
• Expenses: 15% of gross rent
• Asset Depreciation: $223,000,000 times 50%
Year 4 (Phase 3 construction)
• Phase 2 rent
• Office (69,340 SF)@$25/annum plus $4 SF CAM after 20% vacancy
• Retail (214,821 SF)@$25 SF/annum plus $4 SF CAM after 20% vacancy
• Movie Theater (90,272 SF)@$20 SF/annum plus $4 SF CAM, 0% vacancy
• Expenses for above: $4 CAM/SF
• Apartments: 10% vacancy (Previous year rent with 3% increase) Expenses: 15% of gross
rent
• Asset Depreciation: $223,000,000 times 75%
PLYMOUTH PARK
C o n f i d e n t i a l M a r k e t S t u d y - 81 | P A G E
Year 5 (Operations)
• Phase 3 rent
• Office (69,340 SF)@$28/annum plus $4 SF CAM after 10% vacancy
• Retail (214,821 SF)@$28 SF/annum plus $4 SF CAM after 10% vacancy
• Movie Theater (90,272 SF)@$20 SF/annum plus $4 SF CAM, 0% vacancy
• Hotel (90,000 SF) @$28 SF/annum plus $4 SF CAM after 0% vacancy
• Expenses for above: $4 CAM/SF
• Apartments: 5% vacancy (Previous year rent with 3% increase) Expenses: 15% of gross
rent
• Asset Depreciation: $223,000,000
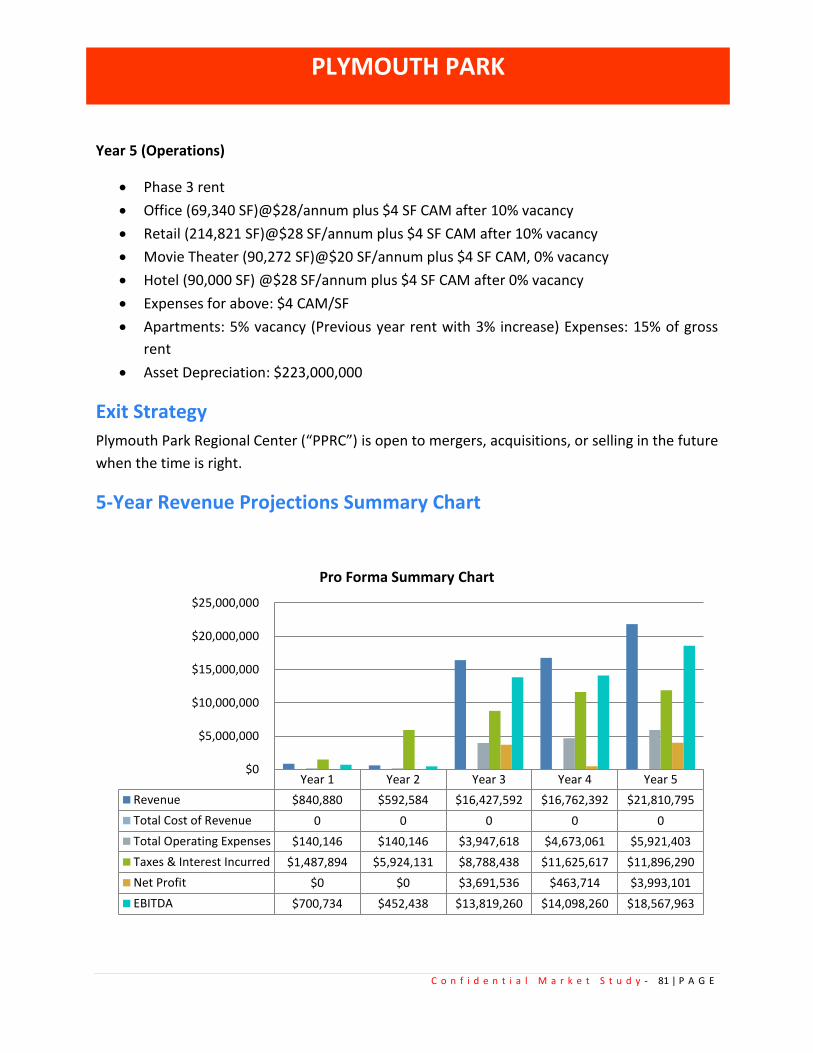
Exit Strategy
Plymouth Park Regional Center (“PPRC”) is open to mergers, acquisitions, or selling in the future
when the time is right.
5-Year Revenue Projections Summary Chart
Year 1 Year 2 Year 3 Year 4 Year 5
Revenue $840,880 $592,584 $16,427,592 $16,762,392 $21,810,795
Total Cost of Revenue 0 0 0 0 0
Total Operating Expenses $140,146 $140,146 $3,947,618 $4,673,061 $5,921,403
Taxes & Interest Incurred $1,487,894 $5,924,131 $8,788,438 $11,625,617 $11,896,290
Net Profit $0 $0 $3,691,536 $463,714 $3,993,101
EBITDA $700,734 $452,438 $13,819,260 $14,098,260 $18,567,963
$0
$5,000,000
$10,000,000
$15,000,000
$20,000,000
$25,000,000
Pro Forma Summary Chart

PLYMOUTH PARK
C o n f i d e n t i a l M a r k e t S t u d y - 82 | P A G E
Revenue & Rents Chart
Zoom in.
Year 1 Year 2 Year 3 Year 4 Year 5
2020 2021 2022 2023 2024SQFT/Ave Year 1 (Permit, Site/ Infrastructure) Year 2 (Phase 1 construction) Year 3 (Phase 2 construction) Year 4 (Phase 3 construction) Year 5 (Operations)
Existing Rents 70,073 74,073
Office 69,340 69,340 69,340Retail 200,871 214,821 214,821
Movie Theater 90,272 90,272 90,272
Hotel 90,000
Apartments 600 600 600
CAM 70,073 74,073 360,483 374,433 464,433
Total Usage
Existing Rents 52,555 37,037
Office 0 0 55,472 55,472 62,406
Retail 0 0 160,697 171,857 193,339
Movie Theater 0 0 90,272 90,272 90,272
Hotel 0 0 0 0 90,000
Apartments 0 0 480 480 570
CAM 70,073 74,073 360,483 374,433 464,433
Price
Existing Rents $16 $16 $0 $0 $0Office $25 $25 $25 $25 $25
Retail $25 $25 $25 $25 $25
Movie Theater $20 $20 $20 $20 $20
Hotel $28 $28 $28 $28 $28
Apartments $16,200 $16,200 $16,200 $16,200 $16,200
CAM $0 $0 $4 $4 $4
Revenue
Existing Rents $840,880 $592,584 $0 $0 $0
Office $0 $0 $1,386,800 $1,386,800 $1,560,150
Retail $0 $0 $4,017,420 $4,296,420 $4,833,473
Movie Theater $0 $0 $1,805,440 $1,805,440 $1,805,440
Hotel $0 $0 $0 $0 $2,520,000
Apartments $0 $0 $7,776,000 $7,776,000 $9,234,000
CAM $0 $0 $1,441,932 $1,497,732 $1,857,732
Total Revenue $840,880 $592,584 $16,427,592 $16,762,392 $21,810,795
Revenue Forecast

PLYMOUTH PARK
C o n f i d e n t i a l M a r k e t S t u d y - 83 | P A G E
Potential Impact Of Plymouth Park

PLYMOUTH PARK
C o n f i d e n t i a l M a r k e t S t u d y - 84 | P A G E
Conclusion
Plymouth Park Regional Center (“PPRC”) believes that its long-term prospects for establishing
and continuing a successful development are excellent. The Company believes that this
industry, and the strong foundation of experience that management brings to the Company,
lends itself to positive results over the long-term. With a market-sensitive team and excellent
systems in place to monitor competitive shifts or changes, Plymouth Park Regional Center
(“PPRC”) is ideally positioned [1] to implement this market study through the next five years [2]
to become a respected and recognized leader in the industry and [3] to continue growing on
through the next decade.
The Company’s shows a current demand in the PMA to support this property management
development and investment of an existing and new commercial, office, and residential
complex commercial, office, and residential complex.
In conclusion, the Company believes strongly in the feasibility and financial viability of a
commercial, office, and residential complex to be located in the PMA, and will continue to
become an developer to the PMA.
Recommended