OXIDATION OF BIOLOGICAL MOLECULES WITH BICARBONATE-
ACTIVATED HYDROGEN PEROXIDE AND THE DECOMPOSITION OF HYDROGEN PEROXIDE CATALYZED BY MANGANESE(II) AND
BICARBONATE
By
MICHAEL S. MITCHELL
A THESIS PRESENTED TO THE GRADUATE SCHOOL OF THE UNIVERSITY OF FLORIDA IN PARTIAL FULFILLMENT
OF THE REQUIREMENTS FOR THE DEGREE OF MASTER OF SCIENCE
UNIVERSITY OF FLORIDA
2004
Copyright 2004
by
Michael S. Mitchell
This document is dedicated to my fiancé and my family for all their help and support during the last few years.
TABLE OF CONTENTS Page LIST OF FIGURES .............................................................................................................v
ABSTRACT....................................................................................................................... vi
CHAPTER 1 INTRODUCTION ........................................................................................................1
2 RESULTS AND DISCUSSION.................................................................................10
3 CONCLUSION...........................................................................................................38
4 CHEMICALS AND EQUIPMENT ...........................................................................41
5 METHODS.................................................................................................................43
LIST OF REFERENCES...................................................................................................50
BIOGRAPHICAL SKETCH .............................................................................................53
4
LIST OF FIGURES
Figure page 2-1 Dependence of Phosphate on the disproportionation of hydrogen peroxide............12
2-2 Oxidation of HEPES ................................................................................................13
2-3 Dependence of Borate ..............................................................................................14
2-4 Fit of the Rate Law to the k1obs for the ionic strength data........................................15
2-5 Dependence of bicarbonate and manganese(II) .......................................................16
2-6 Comparison of the rate orders of reactions where peroxymonocarbonate was allotted time to form (squares) compared to reactions that did not (diamonds).......17
2-7 Continuous runs by the addition of hydrogen peroxide ...........................................19
2-8 Comparison of the obtained chromatograms: Regino and the ones obtained for the current study .................................................................................................22
2-9 Structures of guanosine monophosphate and guanosine..........................................23
2-10 Using a published method, the retention times for guanosine and 8-oxoguanosine are 23 and 25 min respectively.24...................................................24
2-11 Oxidation of histidine...............................................................................................27
2-12 Oxidation of Alanine................................................................................................30
2-13 Oxidation of leucine (buffered in carbon dioxide and bicarbonate)2 .......................32
2-14 Decarboxylation reaction .........................................................................................34
2-15 Reaction with isovaleraldehyde ...............................................................................35
2-16 Comparing oxidation of leucine in two different buffers.........................................37
v
Abstract of Thesis Presented to the Graduate School
of the University of Florida in Partial Fulfillment of the Requirements for the Degree of Master of Science
OXIDATION OF BIOLOGICAL MOLECULES WITH BICARBONATE-ACTIVATED HYDROGEN PEROXIDE AND THE DECOMPOSITION OF
HYDROGEN PEROXIDE CATALYZED BY MANGANESE(II) AND BICARBONATE
By
Michael S. Mitchell
May 2004
Chair: David E. Richardson Major Department: Chemistry
Most reactions involving hydrogen peroxide use catalysts. Manganese(II) can
catalyze both oxidation reactions involving bicarbonate-activated hydrogen peroxide and
the disproportionation of hydrogen peroxide in the presence of bicarbonate. The
oxidation of biological molecules, such as guanosine monophosphate and amino acids,
with bicarbonate–activated hydrogen peroxide is accelerated by addition of
manganese(II). In the oxidation of the amino acids, the peptide is oxidized by two
consecutive reactions, deamination followed by decarboxylation. Buffers have been
shown to affect the rate, and bicarbonate/carbon dioxide and phosphate buffer were used
to control pH.
To obtain information of the mechanism of the oxidation reactions, decomposition
of hydrogen peroxide in the presence of bicarbonate and manganese(II) has been
examined. Certain buffers, such as phosphate and HEPES, reduce the rate of the
vi
manganese(II)-catalyzed decomposition of hydrogen peroxide. No effect on the rate of
the decomposition of hydrogen peroxide has been detected with the borate buffer. Using
the borate buffer, the reactant orders for bicarbonate (second order at [HCO3-] < 0.4 M)
and manganese(II) (first order at [Mn2+] < 5 µM) have been determined for the catalyzed
peroxide disproportionation. The decomposition also showed no ionic strength effect.
The fate of the metal is still being examined.
vii
CHAPTER 1 INTRODUCTION
Hydrogen peroxide and other reactive oxygen species (ROS) oxidize biological
molecules, resulting in the cellular oxidize stress.1 In biological conditions, oxidation
reactions with hydrogen peroxide usually proceed slowly in the absence of a catalyst.
Manganese(II) can catalyze two reactions involving hydrogen peroxide in the presence of
bicarbonate. The decomposition of hydrogen peroxide and the oxidation reactions
involving hydrogen peroxide are both catalyzed by manganese(II)-bicarbonate
mixtures.2;3 Peroxymonocarbonate, a possibly biologically relevant ROS, forms by the
reaction of peroxide and bicarbonate.4;5 The study presented here examines both the
decomposition of hydrogen peroxide and the oxidation reactions of biological molecules
by hydrogen peroxide catalyzed by manganese(II) and bicarbonate.
Reactive oxygen species. ROS are oxygen-containing molecules capable of
oxidizing several classes of molecules. Superoxide radical anion, hydroxyl radical anion,
and hydrogen peroxide are examples of biologically relevant ROS molecules.1 These
ROS molecules may oxidize biological molecules in situ, increasing the oxidative stress
on cells. For example, the oxidation of an active site of an enzyme by hydrogen peroxide
can cause a decrease in its activity.6;7 However, certain enzymes also use the oxidation
potential of hydrogen peroxide to oxidize toxins, such as hydrocarbons. The solubility of
the resulting product is higher than that of the original hydrocarbon, so the oxidation
makes the removal of the toxin easier.
1
2
In cells, the formation of hydrogen peroxide primarly occurs in mitochondria.
Molecular oxygen is the initial reactant for this pathway. Oxygen is used in the
mitochondria for energy formation. In the normal process of oxidative phosphorylation,
oxygen gains four electrons, resulting in the formation of adenosine triphosphate and
water. However, incomplete reduction of oxygen occurs in a small fraction of oxygen
reduction. This pathway results in the formation of other ROS. Initially, the pathway for
the formation of hydrogen peroxide involves a one-electron reduction of molecular
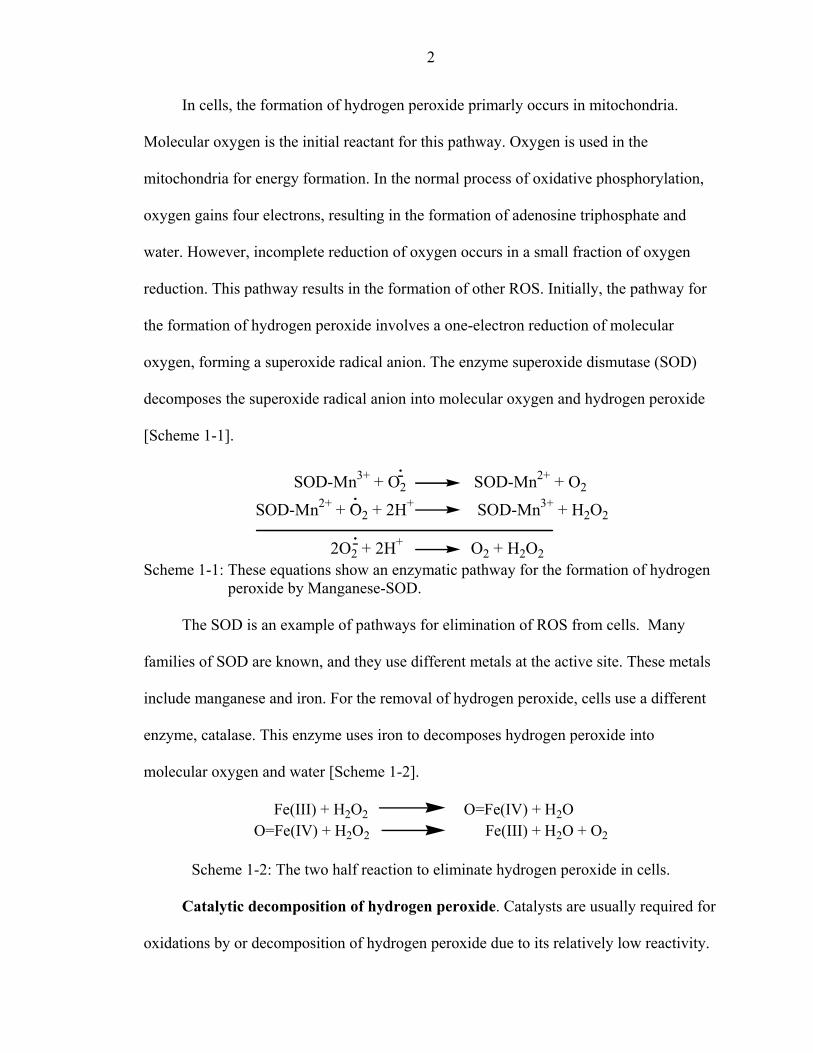
oxygen, forming a superoxide radical anion. The enzyme superoxide dismutase (SOD)
decomposes the superoxide radical anion into molecular oxygen and hydrogen peroxide
[Scheme 1-1].
SOD-Mn3+ + O2 SOD-Mn2+ + O2
SOD-Mn2+ + O2 + 2H+ SOD-Mn3+ + H2O2
2O2 + 2H+ O2 + H2O2 Scheme 1-1: These equations show an enzymatic pathway for the formation of hydrogen
peroxide by Manganese-SOD.
The SOD is an example of pathways for elimination of ROS from cells. Many
families of SOD are known, and they use different metals at the active site. These metals
include manganese and iron. For the removal of hydrogen peroxide, cells use a different
enzyme, catalase. This enzyme uses iron to decomposes hydrogen peroxide into
molecular oxygen and water [Scheme 1-2].
Fe(III) + H2O2 O=Fe(IV) + H2OO=Fe(IV) + H2O2 Fe(III) + H2O + O2
Scheme 1-2: The two half reaction to eliminate hydrogen peroxide in cells.
Catalytic decomposition of hydrogen peroxide. Catalysts are usually required for
oxidations by or decomposition of hydrogen peroxide due to its relatively low reactivity.
3
The function of a catalyst in any reaction is to reduce activation energy by one of two
different means. The first is to increase the energy level of the starting materials. The
second is to lower the energy requirements of the transition state.
Previous studies examined the catalytic ability of other transition metals to
decompose hydrogen peroxide as well.8 Manganese and copper have been studied in
detail. One study examined the rate of reaction at a variety of pH levels. There was a
decrease in the rate of reaction as pH levels increased with all of the transition metals
studied. The decrease in rate at high pH was due to the formation of insoluble metal
hydroxides. Different metal complexes were used to increase solubility and the rate of
decomposition.
A variation of the rate of reaction was obtained from decomposing hydrogen
peroxide studies with different transition metal complexes, such as with manganese(II).
The data demonstrate that as the environment around the metal changes, the rate of
reaction also changes. Many manganese(II) complexes have been studied, including
Mn(phen)22+, Mn(dipy)2
2+, Mn(acac)22+, Mn(EDTA)2
2+, Mn(his)22+, and Mn(TETA)2+
(ranked in order of increasing activity).9 For the reactions presented here, the formation
and effects of different metal complexes will be further examined in Chapter 2.
Oxidation reactions by hydrogen peroxide. The Richardson group have reported
experiments examining hydrogen peroxide oxidation reactions. One study demonstrated
sulfide oxidation by hydrogen peroxide.5 Methionine was also studied at the same time.10
Sulfides are oxidized to sulfoxide and sulfones. The oxidation of the protein α1-PI was
investigated. When this protein and hydrogen peroxide were mixed, a decrease in its
activity resulted. This was due to the oxidation of a crucial methionine in the a1-PI
4
sequence. When hydrogen peroxide oxidized α1-P1 in the presence of bicarbonate, the
rate of the oxidation reaction increased.
Chemistry of peroxymonocarbonate. The increase in the reaction rates described
above was explained by the formation of the peracid peroxymonocarbonate (HCO4-).10;11
This molecule was first described in the 1960s.12 Peroxymonocarbonate and hydrogen
peroxide have nearly identical potentials, 1.80 and 1.77, respectively.13
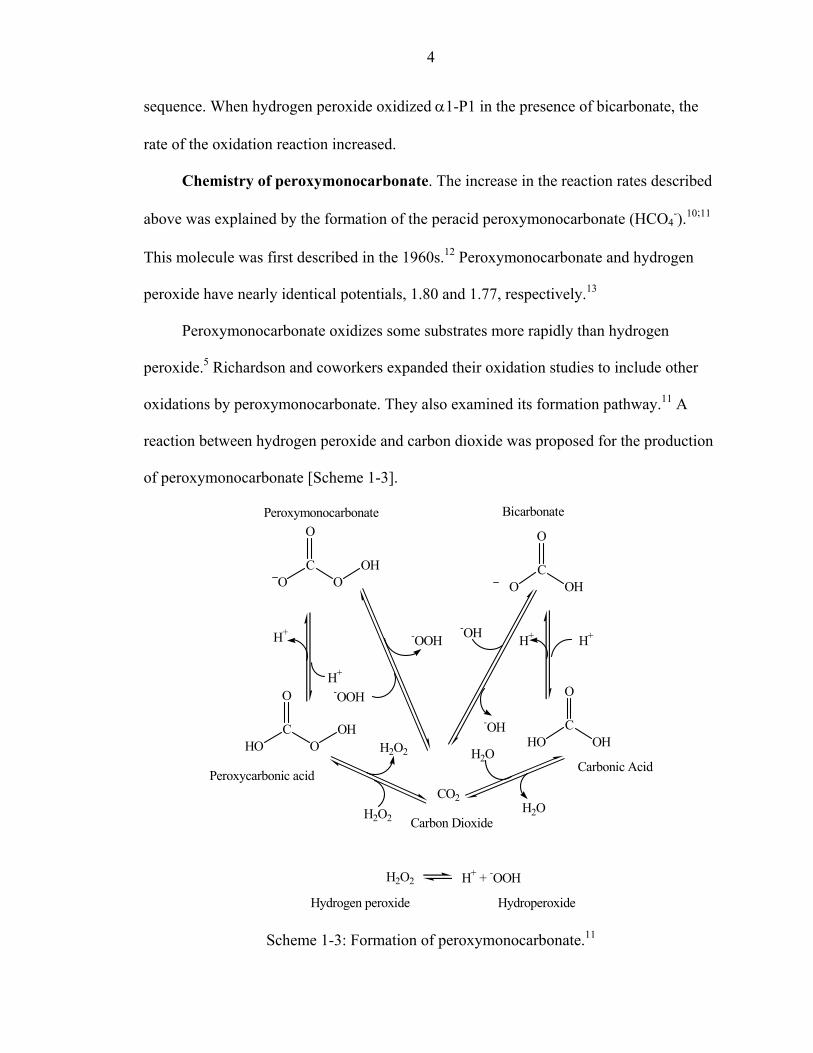
Peroxymonocarbonate oxidizes some substrates more rapidly than hydrogen
peroxide.5 Richardson and coworkers expanded their oxidation studies to include other
oxidations by peroxymonocarbonate. They also examined its formation pathway.11 A
reaction between hydrogen peroxide and carbon dioxide was proposed for the production
of peroxymonocarbonate [Scheme 1-3].
CO
OHO
O
CO
O
OH
CO2
CHO
O
OHC
OOH
HO
O
-OH H+
H2O
-OOH
H+
H2O2 H+ + -OOH
H+
-OH
H+
H2O
H2O2
H2O2
-OOH
Bicarbonate
Carbonic Acid
Carbon Dioxide
Hydrogen peroxide Hydroperoxide
Peroxymonocarbonate
Peroxycarbonic acid
Scheme 1-3: Formation of peroxymonocarbonate.11
5
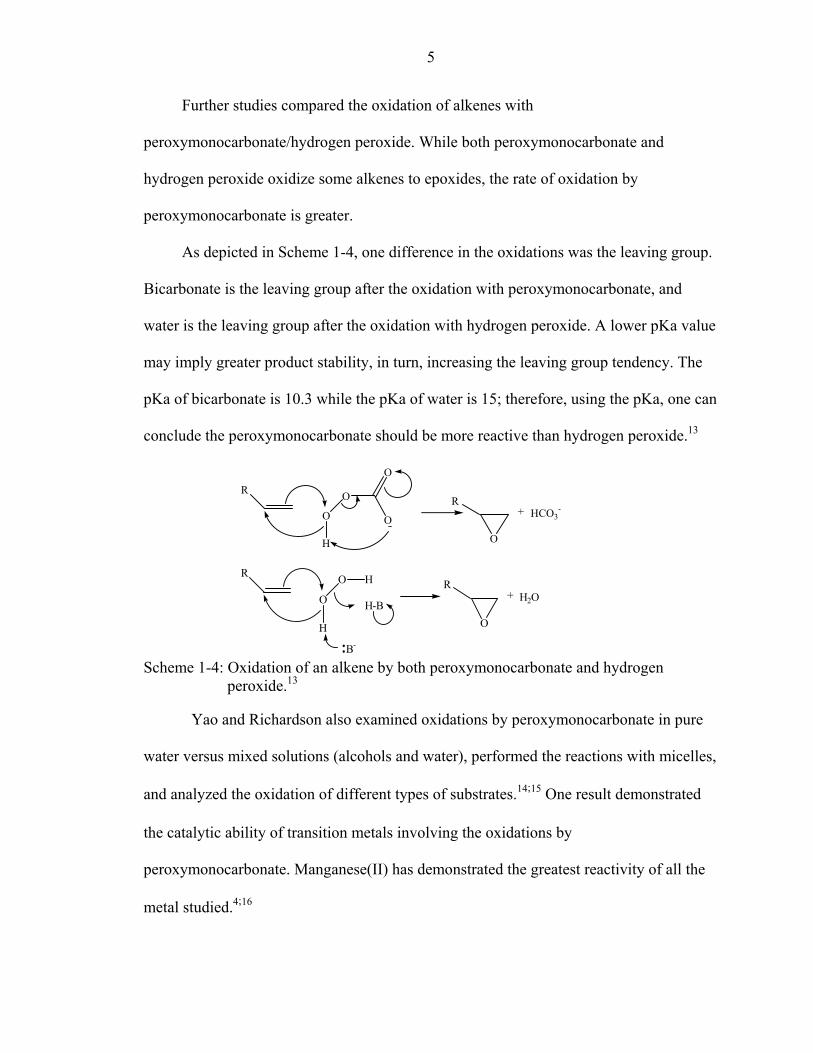
Further studies compared the oxidation of alkenes with
peroxymonocarbonate/hydrogen peroxide. While both peroxymonocarbonate and
hydrogen peroxide oxidize some alkenes to epoxides, the rate of oxidation by
peroxymonocarbonate is greater.
As depicted in Scheme 1-4, one difference in the oxidations was the leaving group.
Bicarbonate is the leaving group after the oxidation with peroxymonocarbonate, and
water is the leaving group after the oxidation with hydrogen peroxide. A lower pKa value
may imply greater product stability, in turn, increasing the leaving group tendency. The
pKa of bicarbonate is 10.3 while the pKa of water is 15; therefore, using the pKa, one can
conclude the peroxymonocarbonate should be more reactive than hydrogen peroxide.13
O
O
H O
+ HCO3-
O
O
RR
O
O
H O
+ H2O
RRH
B-
H-B
Scheme 1-4: Oxidation of an alkene by both peroxymonocarbonate and hydrogen peroxide.13
Yao and Richardson also examined oxidations by peroxymonocarbonate in pure
water versus mixed solutions (alcohols and water), performed the reactions with micelles,
and analyzed the oxidation of different types of substrates.14;15 One result demonstrated
the catalytic ability of transition metals involving the oxidations by
peroxymonocarbonate. Manganese(II) has demonstrated the greatest reactivity of all the
metal studied.4;16
6
Chemistry of peroxymonocarbonate/manganese(II) oxidation. Burgess, Sychev,
and Stadtman all lead studies examining the oxidation of different substrates by hydrogen
peroxide in the presences of bicarbonate and manganese(II).16;19-22 Both Sychev and
Stadtman suggested the involvement of radicals in the oxidations. However, the
proposed mechanisms were slightly different depending on the substrate.
Sychev and coworkers examined the oxidation of different dyes with the addition
of radicals. For some dyes, the rates of reaction decreased. They therefore proposed two
different mechanisms, an inner-sphere or an outer-sphere mechanism, for the different
results. If the rate of reaction decreased, the result supported an outer-sphere
mechanism.22 If detecting no decrease, the proposed pathway was then including an
inner-sphere mechanism.21
Stadtman’s laboratory examined the oxidation of amino acids.2 No decrease in rate
was found with the addition of radical traps.20 They therefore concluded that the amino
acid oxidation mechanism involved a caged radical. Their proposed mechanism is similar
to the Sychev’s proposed inner-sphere mechanism.
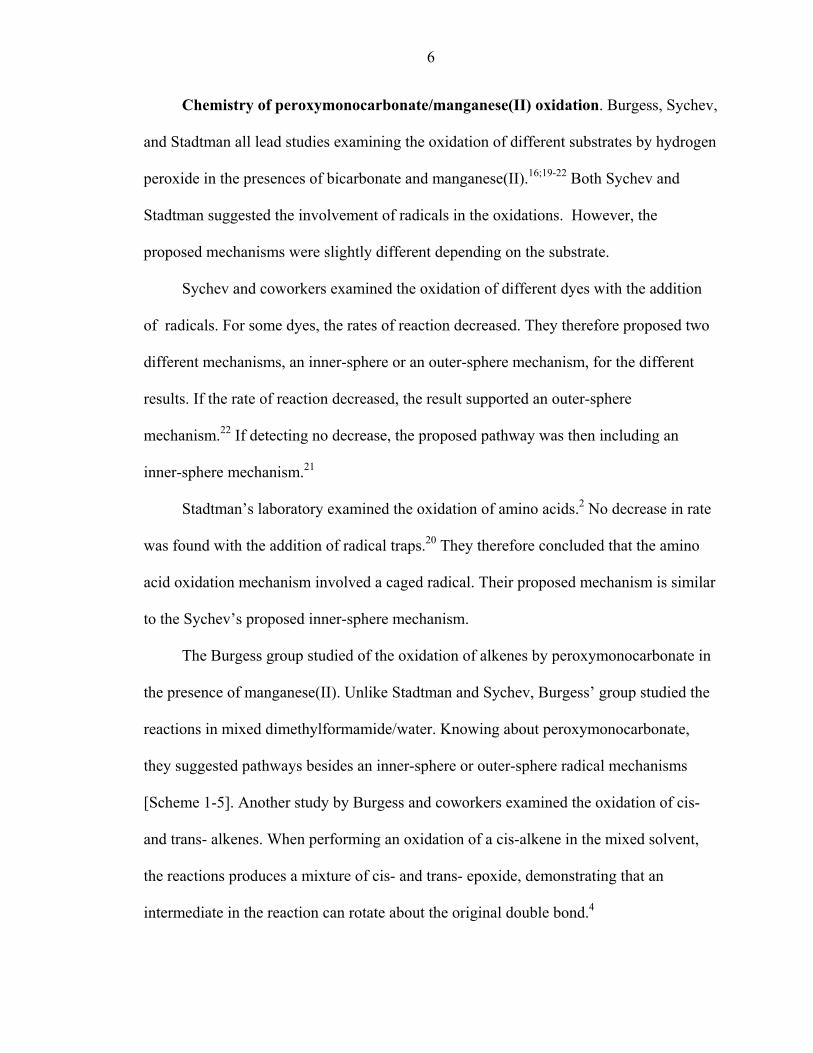
The Burgess group studied of the oxidation of alkenes by peroxymonocarbonate in
the presence of manganese(II). Unlike Stadtman and Sychev, Burgess’ group studied the
reactions in mixed dimethylformamide/water. Knowing about peroxymonocarbonate,
they suggested pathways besides an inner-sphere or outer-sphere radical mechanisms
[Scheme 1-5]. Another study by Burgess and coworkers examined the oxidation of cis-
and trans- alkenes. When performing an oxidation of a cis-alkene in the mixed solvent,
the reactions produces a mixture of cis- and trans- epoxide, demonstrating that an
intermediate in the reaction can rotate about the original double bond.4
7
Mn
O O
OO
2+
Mn
O
OO
2+
O+
Mn
O+ 4+
OMn2++
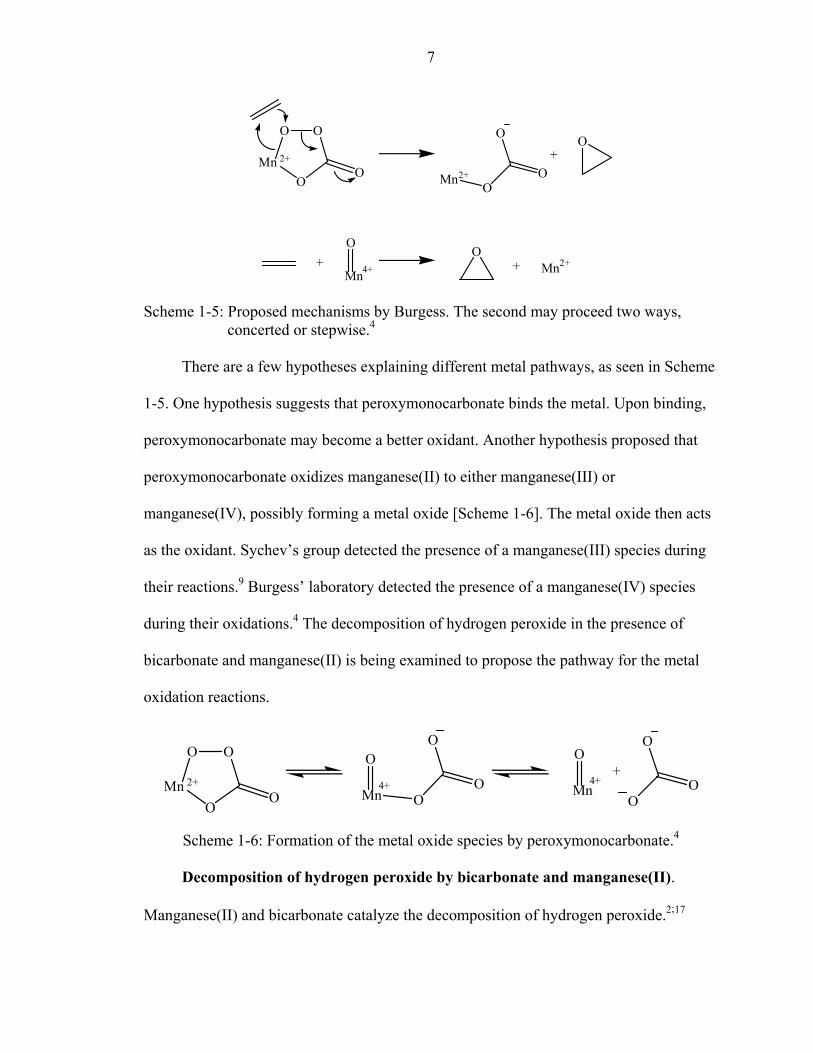
Scheme 1-5: Proposed mechanisms by Burgess. The second may proceed two ways, concerted or stepwise.4
There are a few hypotheses explaining different metal pathways, as seen in Scheme
1-5. One hypothesis suggests that peroxymonocarbonate binds the metal. Upon binding,
peroxymonocarbonate may become a better oxidant. Another hypothesis proposed that
peroxymonocarbonate oxidizes manganese(II) to either manganese(III) or
manganese(IV), possibly forming a metal oxide [Scheme 1-6]. The metal oxide then acts
as the oxidant. Sychev’s group detected the presence of a manganese(III) species during
their reactions.9 Burgess’ laboratory detected the presence of a manganese(IV) species
during their oxidations.4 The decomposition of hydrogen peroxide in the presence of
bicarbonate and manganese(II) is being examined to propose the pathway for the metal
oxidation reactions.
Mn
O O
OO
2+Mn
O
4+
O
OO
Mn
O
4+
O
OO
+
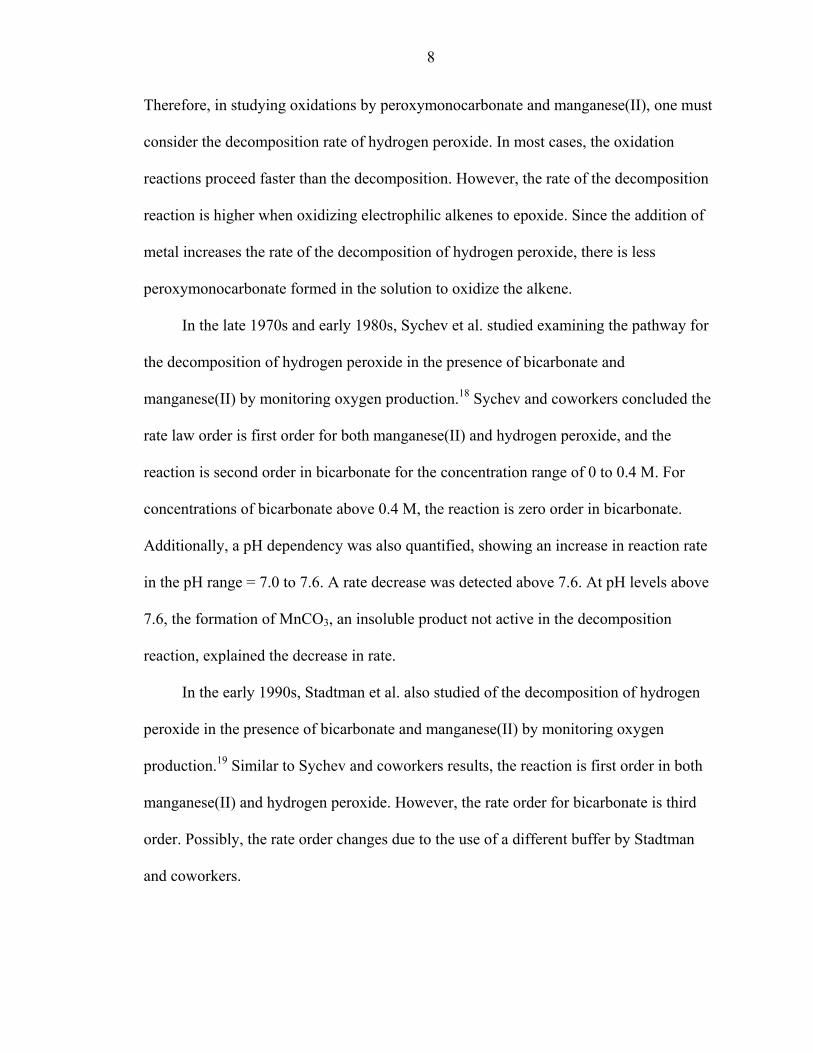
Scheme 1-6: Formation of the metal oxide species by peroxymonocarbonate.4
Decomposition of hydrogen peroxide by bicarbonate and manganese(II).
Manganese(II) and bicarbonate catalyze the decomposition of hydrogen peroxide.2;17
8
Therefore, in studying oxidations by peroxymonocarbonate and manganese(II), one must
consider the decomposition rate of hydrogen peroxide. In most cases, the oxidation
reactions proceed faster than the decomposition. However, the rate of the decomposition
reaction is higher when oxidizing electrophilic alkenes to epoxide. Since the addition of
metal increases the rate of the decomposition of hydrogen peroxide, there is less
peroxymonocarbonate formed in the solution to oxidize the alkene.
In the late 1970s and early 1980s, Sychev et al. studied examining the pathway for
the decomposition of hydrogen peroxide in the presence of bicarbonate and
manganese(II) by monitoring oxygen production.18 Sychev and coworkers concluded the
rate law order is first order for both manganese(II) and hydrogen peroxide, and the
reaction is second order in bicarbonate for the concentration range of 0 to 0.4 M. For
concentrations of bicarbonate above 0.4 M, the reaction is zero order in bicarbonate.
Additionally, a pH dependency was also quantified, showing an increase in reaction rate
in the pH range = 7.0 to 7.6. A rate decrease was detected above 7.6. At pH levels above
7.6, the formation of MnCO3, an insoluble product not active in the decomposition
reaction, explained the decrease in rate.
In the early 1990s, Stadtman et al. also studied of the decomposition of hydrogen
peroxide in the presence of bicarbonate and manganese(II) by monitoring oxygen
production.19 Similar to Sychev and coworkers results, the reaction is first order in both
manganese(II) and hydrogen peroxide. However, the rate order for bicarbonate is third
order. Possibly, the rate order changes due to the use of a different buffer by Stadtman
and coworkers.
9
Stadtman used other buffers such as phosphate or 4-(2-Hydroxyethyl)piperazine-1-
ethanesulfonic acid (HEPES) to maintain pH. When using these molecules, the reaction
rate decreases. The addition of carbon dioxide to the atmosphere above the solution
created a buffering effect near physiological pH (7.4).
Stadtman et al. also examined the addition of hydrogen peroxide to a completed
reaction.19 Compared to the initial rate of the reaction, the decomposition rate decreased
with the addition of hydrogen peroxide. During the initial reaction, the formation of a
nonreactive metal species caused the variation in rate.
Goals. The experiments described in this thesis were designed to address the
following questions regarding the reactions of bicarbonate-activated peroxide with
biological molecules:
1. Can peroxycarbonate oxidize biological molecules? 2. What are the effects (if any) of different buffers? 3. Are the products that Stadtman et al. detected the only ones produced under their
conditions?
CHAPTER 2 RESULTS AND DISCUSSION
Disproportionation of hydrogen peroxide. Manganese(II) can catalyze both the
decomposition of hydrogen peroxide in the presence of bicarbonate and oxidation
reactions by bicarbonate-activated hydrogen peroxide.2;3 Bennett and Sychev have
obtained similar results for both kinds of reactions. The rate orders in bicarbonate and
manganese(II) for oxidation and disproportionation are the same in most reports.16;18 It
may be possible to answer some questions regarding the oxidation reactions by studying
the simple disproportionation reaction.
The groups of Sychev and Stadtman studied the decomposition of hydrogen
peroxide by manganese(II)/bicarbonate.18;19 The two groups obtained similar results. For
both groups, the rate orders for both hydrogen peroxide and manganese(II) were first
order. Additionally, the formation of radicals was suggested to occur during the
decomposition reaction. However, one difference was the order in bicarbonate (Sychev
proposed second order and Stadtman third order). The difference in rate order may have
been due to the changes in reaction conditions.
When studying kinetics, a buffer is used to maintain pH. However, the buffer
should not normally affect the reaction. According to Stadtman et al., some buffers, such
as phosphate, change the rate of hydrogen peroxide decomposition in the presence of
bicarbonate and manganese(II).19 Richardson and coworkers used phosphate buffers
10
11
during the oxidation reactions, but they never examined the effect of the buffer on the
reactions.
The formation of insoluble metal phosphates is a potential problem when using a
phosphate buffer in reactions involving transition metals. To determine if problems may
surface from solubility during a reaction, one can use the Ksp value of the salt in question.
As the Ksp value decreases, the maximum soluble concentration also decreases. The Ksp
of MnHPO4 is 3.6*10-8. In many of the reactions studied here, 5 µM manganese(II) is
added to the reaction. To keep most of the metal soluble, the phosphate buffer
concentration must be maintained below 0.009 M. In most reactions, the concentration of
the buffer is near 0.1 M. Therefore, phosphate decreases the rate of reaction by
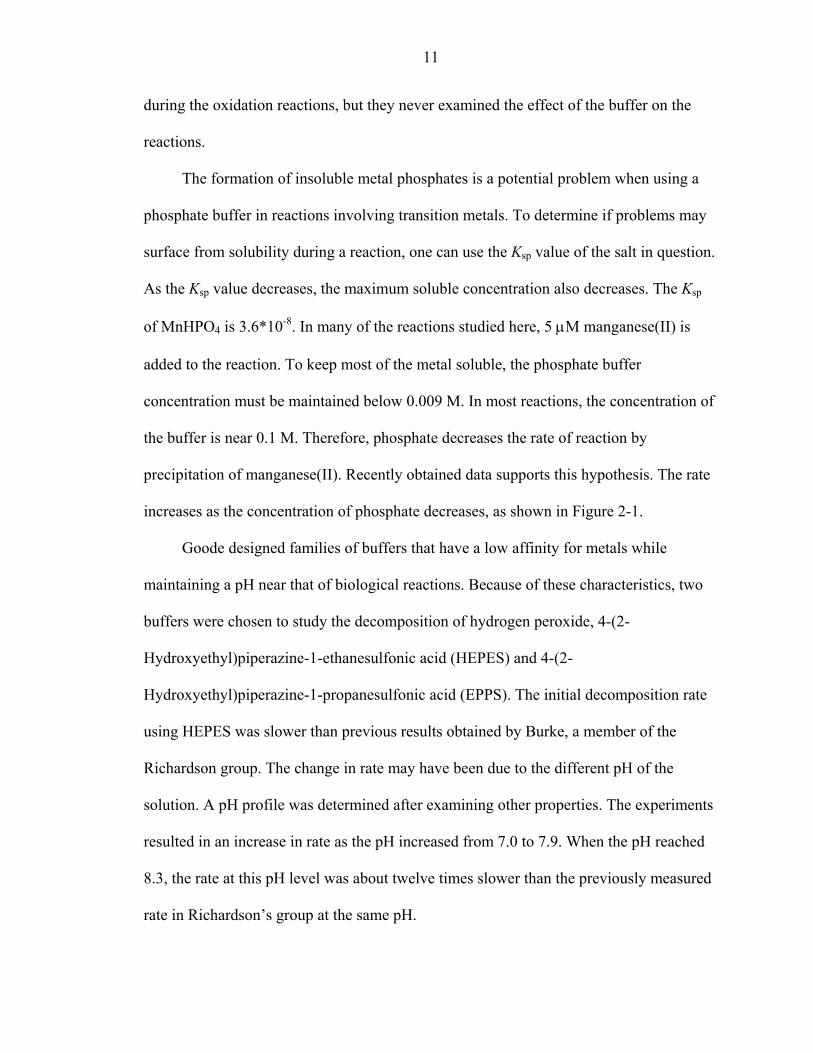
precipitation of manganese(II). Recently obtained data supports this hypothesis. The rate
increases as the concentration of phosphate decreases, as shown in Figure 2-1.
Goode designed families of buffers that have a low affinity for metals while
maintaining a pH near that of biological reactions. Because of these characteristics, two
buffers were chosen to study the decomposition of hydrogen peroxide, 4-(2-
Hydroxyethyl)piperazine-1-ethanesulfonic acid (HEPES) and 4-(2-
Hydroxyethyl)piperazine-1-propanesulfonic acid (EPPS). The initial decomposition rate
using HEPES was slower than previous results obtained by Burke, a member of the
Richardson group. The change in rate may have been due to the different pH of the
solution. A pH profile was determined after examining other properties. The experiments
resulted in an increase in rate as the pH increased from 7.0 to 7.9. When the pH reached
8.3, the rate at this pH level was about twelve times slower than the previously measured
rate in Richardson’s group at the same pH.
12
[Phosphate] vs kobs
0.0000
0.0010
0.0020
0 0.05 0.1 0.15 0.2 0.25 0.3 0.35
Initial concentration of phosphate buffer
k obs
(s-1
)
Figure 2-1: Dependence of Phosphate on the disproportionation of hydrogen peroxide. Fit of the Rate Law to the k1obs for the observed Phosphate Buffer data. The conditions for the reactions involved 0.2 M sodium bicarbonate, 0.1 M hydrogen peroxide, 5 µM Mn2+, 0 – 0.31 M Phosphate Buffer, 0 – 0.5 M sodium acetate. The pH of these reactions was completed at 8.3.
A difference in reaction methods may explain the difference in rate. The change in
procedure was not allowing time for the formation of peroxymonocarbonate. However,
an unexpected result was determined after mixing bicarbonate and hydrogen peroxide for
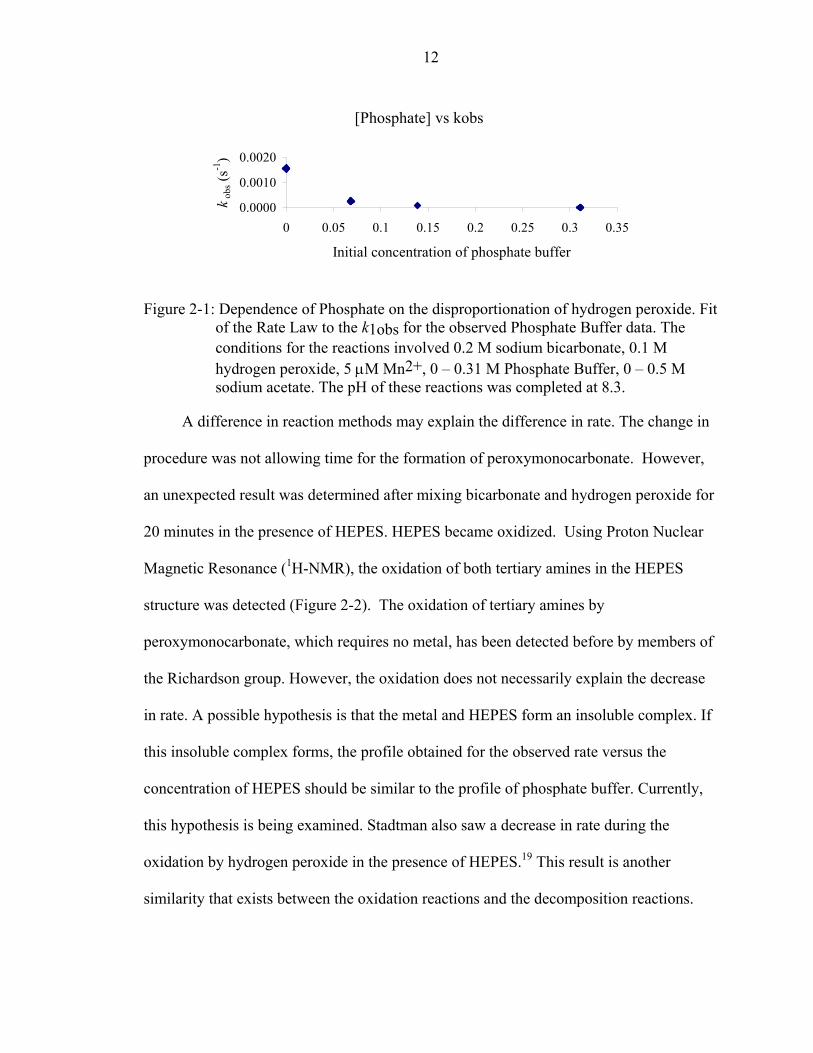
20 minutes in the presence of HEPES. HEPES became oxidized. Using Proton Nuclear
Magnetic Resonance (1H-NMR), the oxidation of both tertiary amines in the HEPES
structure was detected (Figure 2-2). The oxidation of tertiary amines by
peroxymonocarbonate, which requires no metal, has been detected before by members of
the Richardson group. However, the oxidation does not necessarily explain the decrease
in rate. A possible hypothesis is that the metal and HEPES form an insoluble complex. If
this insoluble complex forms, the profile obtained for the observed rate versus the
concentration of HEPES should be similar to the profile of phosphate buffer. Currently,
this hypothesis is being examined. Stadtman also saw a decrease in rate during the
oxidation by hydrogen peroxide in the presence of HEPES.19 This result is another
similarity that exists between the oxidation reactions and the decomposition reactions.
13
HO
N N
S O
O
O
A
BC
D
D A
H
A. ppm (f1) 2.503.003.504.004.50
AD
CB
B. p p m (f1) 2.503.003 .5 04.004.50
Figure 2-2: Oxidation of HEPES. (A) NMR spectrum of HEPES, buffered in 0.5 M phosphate buffer near pH of 8.3. (B) Oxidation of HEPES. The reaction consisted of 0.1 M HEPES, 0.15 M hydrogen peroxide, and .23 M bicarbonate, buffered in 0.5 M phosphate buffer near pH of 8.3.
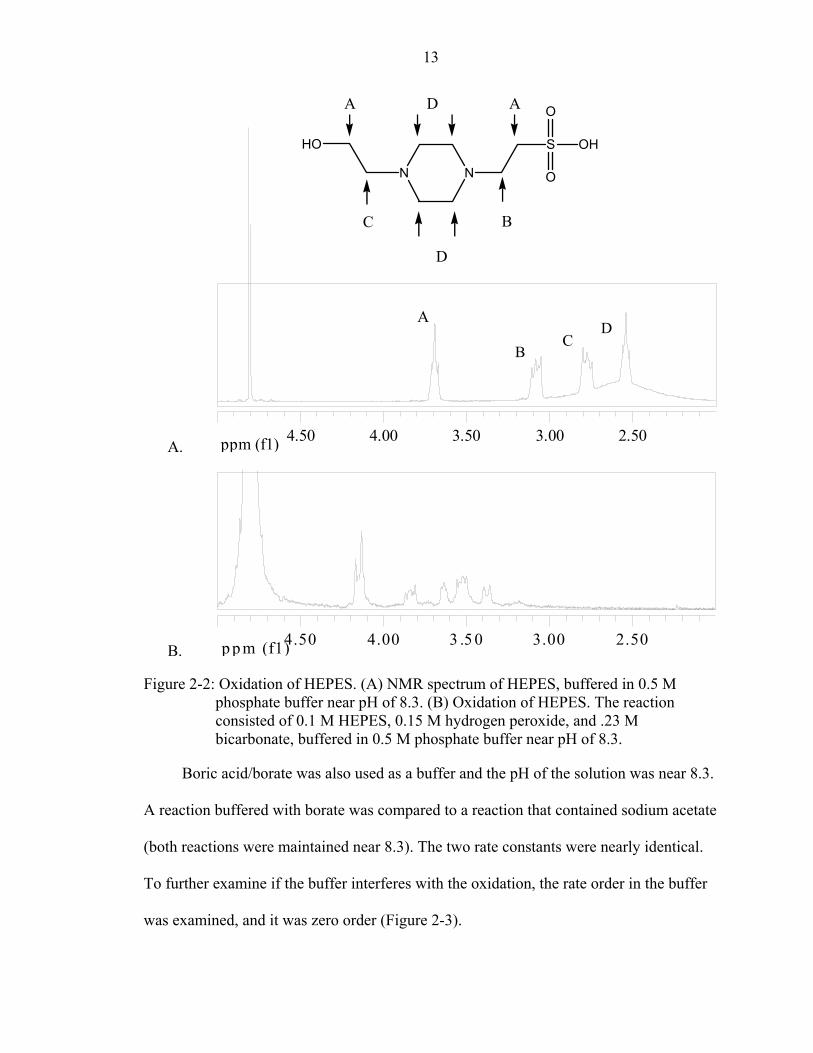
Boric acid/borate was also used as a buffer and the pH of the solution was near 8.3.
A reaction buffered with borate was compared to a reaction that contained sodium acetate
(both reactions were maintained near 8.3). The two rate constants were nearly identical.
To further examine if the buffer interferes with the oxidation, the rate order in the buffer
was examined, and it was zero order (Figure 2-3).
14
Dependence on Borate
0
0.002
0.004
0 0.1 0.2 0.3 0.4 0.5 0.6
Concentration of Borate
k obs
(s-1
)
Figure 2-3: Dependence of Borate. In a three-milliliter solution, 0.4 M sodium bicarbonate, 3 µM manganese(II) sulfate, and 0.2 – 0.5 M borate buffer were mixed. The reactions were started by adding 25 µL of 30% hydrogen peroxide and monitored using the UV-Vis at 264 nm. Trace metal was removed from sodium bicarbonate and borate buffer by Chelex.
Following the buffer dependence, different background reactions were examined.
Buffered at 8.3, the background reactions consisted of the following:
1. Borate buffer system with hydrogen peroxide and manganese(II) 2. Borate buffer system with hydrogen peroxide4 3. Borate buffer system with hydrogen peroxide and bicarbonate 4. Manganese(II) and bicarbonate 5. Manganese(II) and hydrogen peroxide During these reactions, no disproportionation was detected throughout the duration of a
reaction with all the components. Over a long period, some peroxide decomposition
occurred with the reactions containing bicarbonate and hydrogen peroxide, since
peracids—e.g. hydrogen peroxide and peroxymonocarbonate—decompose other
peracids. Trace metals from the sodium hydroxide are a possibility to explain the slightly
accelerated decomposition.
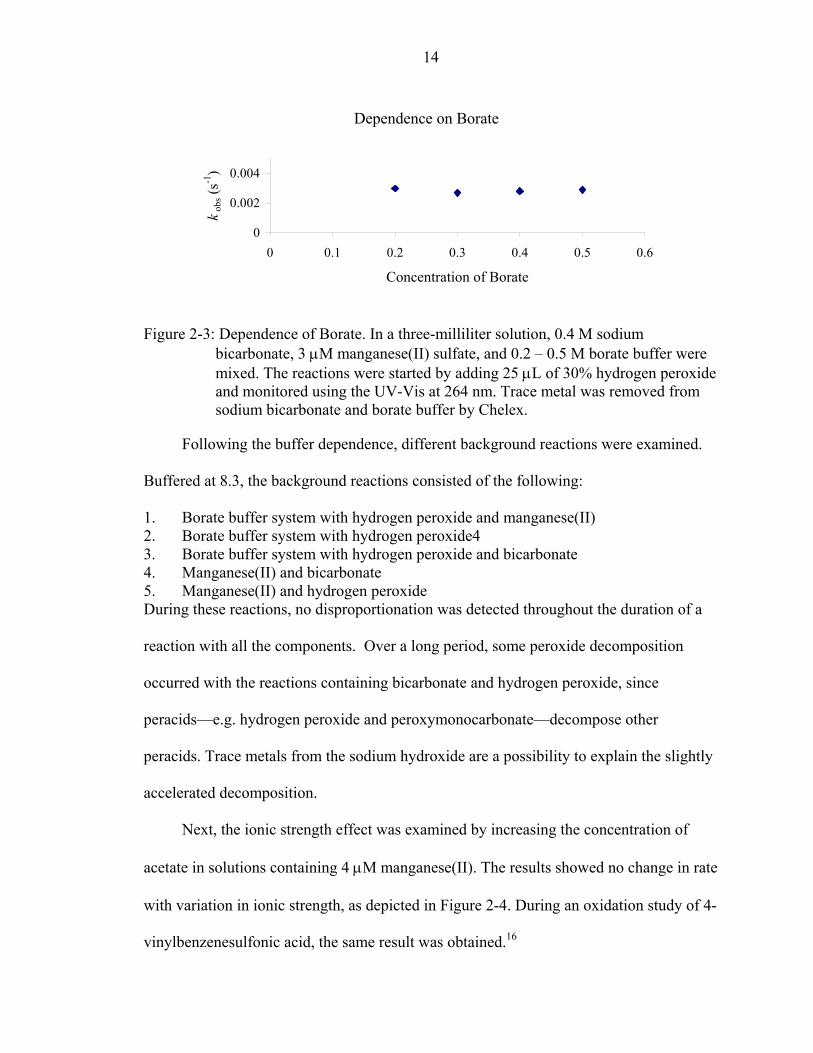
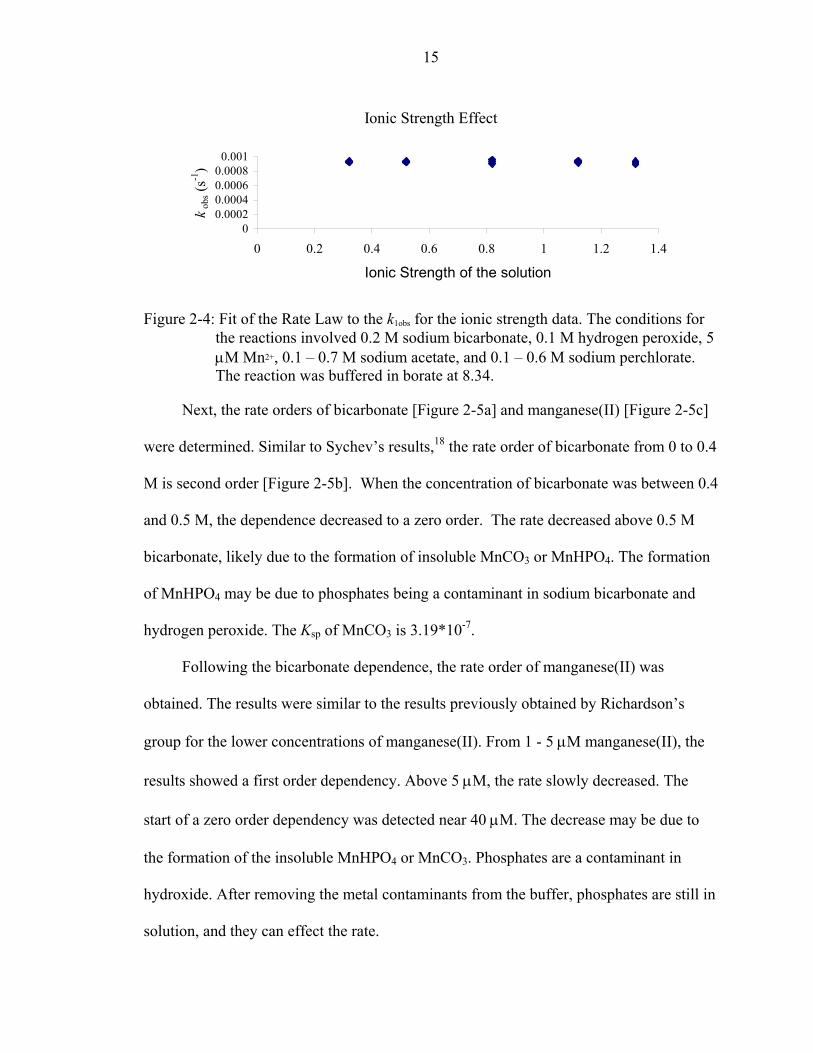
Next, the ionic strength effect was examined by increasing the concentration of
acetate in solutions containing 4 µM manganese(II). The results showed no change in rate
with variation in ionic strength, as depicted in Figure 2-4. During an oxidation study of 4-
vinylbenzenesulfonic acid, the same result was obtained.16
15
Ionic Strength Effect
00.00020.00040.00060.0008
0.001
0 0.2 0.4 0.6 0.8 1 1.2 1.4
Ionic Strength of the solution
k obs
(s-1
)
Figure 2-4: Fit of the Rate Law to the k1obs for the ionic strength data. The conditions for the reactions involved 0.2 M sodium bicarbonate, 0.1 M hydrogen peroxide, 5 µM Mn2+, 0.1 – 0.7 M sodium acetate, and 0.1 – 0.6 M sodium perchlorate. The reaction was buffered in borate at 8.34.
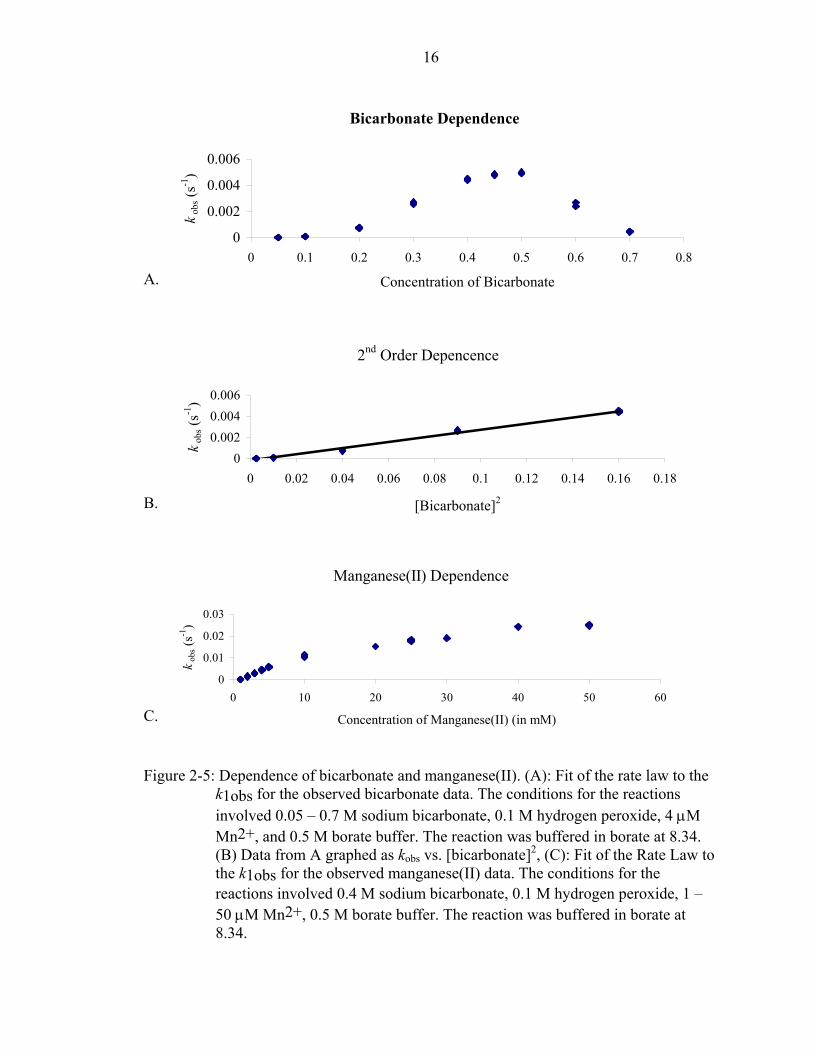
Next, the rate orders of bicarbonate [Figure 2-5a] and manganese(II) [Figure 2-5c]
were determined. Similar to Sychev’s results,18 the rate order of bicarbonate from 0 to 0.4
M is second order [Figure 2-5b]. When the concentration of bicarbonate was between 0.4
and 0.5 M, the dependence decreased to a zero order. The rate decreased above 0.5 M
bicarbonate, likely due to the formation of insoluble MnCO3 or MnHPO4. The formation
of MnHPO4 may be due to phosphates being a contaminant in sodium bicarbonate and
hydrogen peroxide. The Ksp of MnCO3 is 3.19*10-7.
Following the bicarbonate dependence, the rate order of manganese(II) was
obtained. The results were similar to the results previously obtained by Richardson’s
group for the lower concentrations of manganese(II). From 1 - 5 µM manganese(II), the
results showed a first order dependency. Above 5 µM, the rate slowly decreased. The
start of a zero order dependency was detected near 40 µM. The decrease may be due to
the formation of the insoluble MnHPO4 or MnCO3. Phosphates are a contaminant in
hydroxide. After removing the metal contaminants from the buffer, phosphates are still in
solution, and they can effect the rate.
16
A.
Bicarbonate Dependence
0
0.002
0.004
0.006
0 0.1 0.2 0.3 0.4 0.5 0.6 0.7 0.8
Concentration of Bicarbonate
k obs
(s-1
)
B.
2nd Order Depencence
00.0020.0040.006
0 0.02 0.04 0.06 0.08 0.1 0.12 0.14 0.16 0.18
[Bicarbonate]2
k obs
(s-1
)
C.
Manganese(II) Dependence
0
0.01
0.02
0.03
0 10 20 30 40 50 6
Concentration of Manganese(II) (in mM)
k obs
(s-1
)
0
Figure 2-5: Dependence of bicarbonate and manganese(II). (A): Fit of the rate law to the k1obs for the observed bicarbonate data. The conditions for the reactions involved 0.05 – 0.7 M sodium bicarbonate, 0.1 M hydrogen peroxide, 4 µM Mn2+, and 0.5 M borate buffer. The reaction was buffered in borate at 8.34. (B) Data from A graphed as kobs vs. [bicarbonate]2, (C): Fit of the Rate Law to the k1obs for the observed manganese(II) data. The conditions for the reactions involved 0.4 M sodium bicarbonate, 0.1 M hydrogen peroxide, 1 – 50 µM Mn2+, 0.5 M borate buffer. The reaction was buffered in borate at 8.34.
17
The reaction rates were similar to the data obtained previously by Richardson’s
group for the manganese(II) concentrations below 4 µM. In the current study, the
obtained reaction rates above 4 µM manganese(II) were greater than the value obtained
previously. Another difference in the methods was the addition of acetate in the previous
study to help maintain pH near 8.3. Stadtman also reported a decrease in rate with acetate
in solution, but previously, Richardson’s group detected no change in reaction rate with
the addition of acetate. One possibility for the decrease in rate is the formation of a
soluble manganese(II)-acetate dimer. The metal may have fewer coordination sites,
resulting in a decrease in rate.
Bicarbonate dependance
0
0.002
0.004
0.006
0 0.1 0.2 0.3 0.4 0.5 0.6 0.7 0.8
Concentration of bicarbonate
kob
s (s-1
)
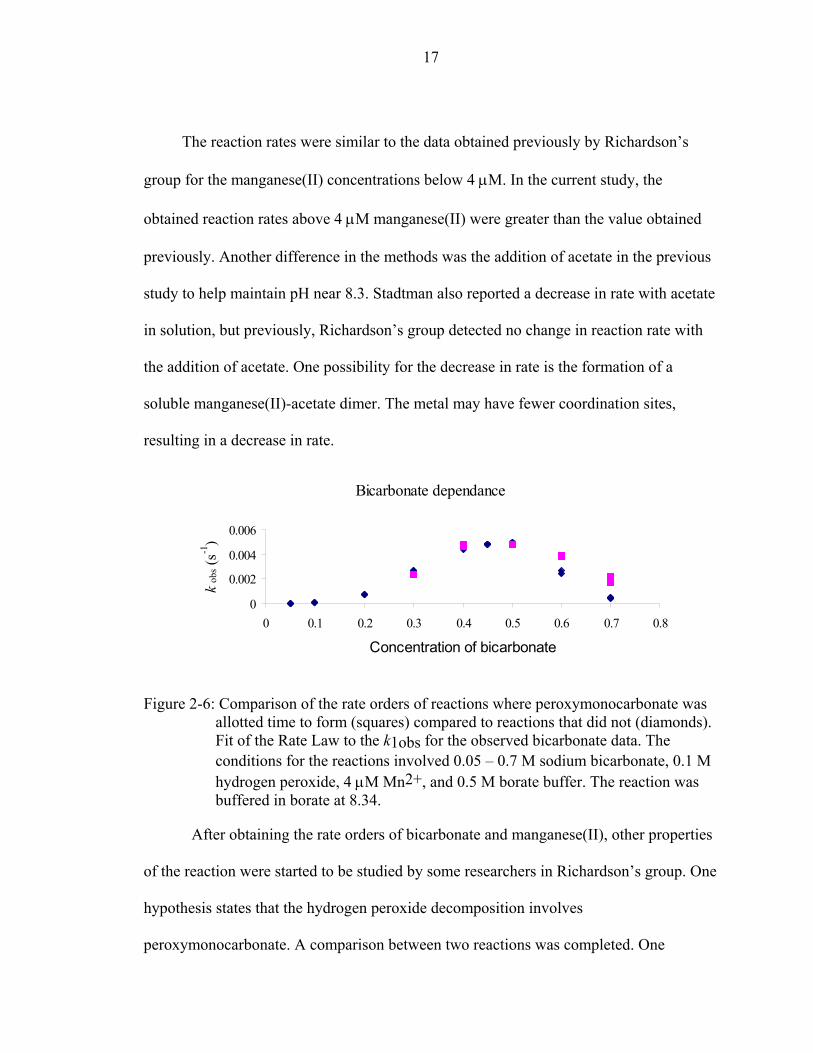
Figure 2-6: Comparison of the rate orders of reactions where peroxymonocarbonate was allotted time to form (squares) compared to reactions that did not (diamonds). Fit of the Rate Law to the k1obs for the observed bicarbonate data. The conditions for the reactions involved 0.05 – 0.7 M sodium bicarbonate, 0.1 M hydrogen peroxide, 4 µM Mn2+, and 0.5 M borate buffer. The reaction was buffered in borate at 8.34.
After obtaining the rate orders of bicarbonate and manganese(II), other properties
of the reaction were started to be studied by some researchers in Richardson’s group. One
hypothesis states that the hydrogen peroxide decomposition involves
peroxymonocarbonate. A comparison between two reactions was completed. One
18
reaction allowed time for peroxymonocarbonate to form by mixing bicarbonate and
hydrogen peroxide for 20 minutes without metal present. The other reaction reacted all
the components immediately [Figure 2-6]. Possibly due to the formation time for
peroxymonocarbonate, no change in rate with the lower concentrations of bicarbonate
was detected. For the reactions where bicarbonate and hydrogen peroxide were mixed
without metal, an increase in rate was found for the higher concentrations of bicarbonate.
However, the rate detected was lower than the rate obtained at 0.4 M bicarbonate. At 0.7
M of bicarbonate, the equilibrium concentration of peroxymonocarbonate is 0.006 M.
Through the formation of peroxymonocarbonate, there would be less carbonate in
solution. When the carbonate concentration decreases, the soluble concentration of metal
would increase. The effect would be an increased rate of reaction. The result does not
eliminate the possibility that peroxymonocarbonate has a role in the decomposition of
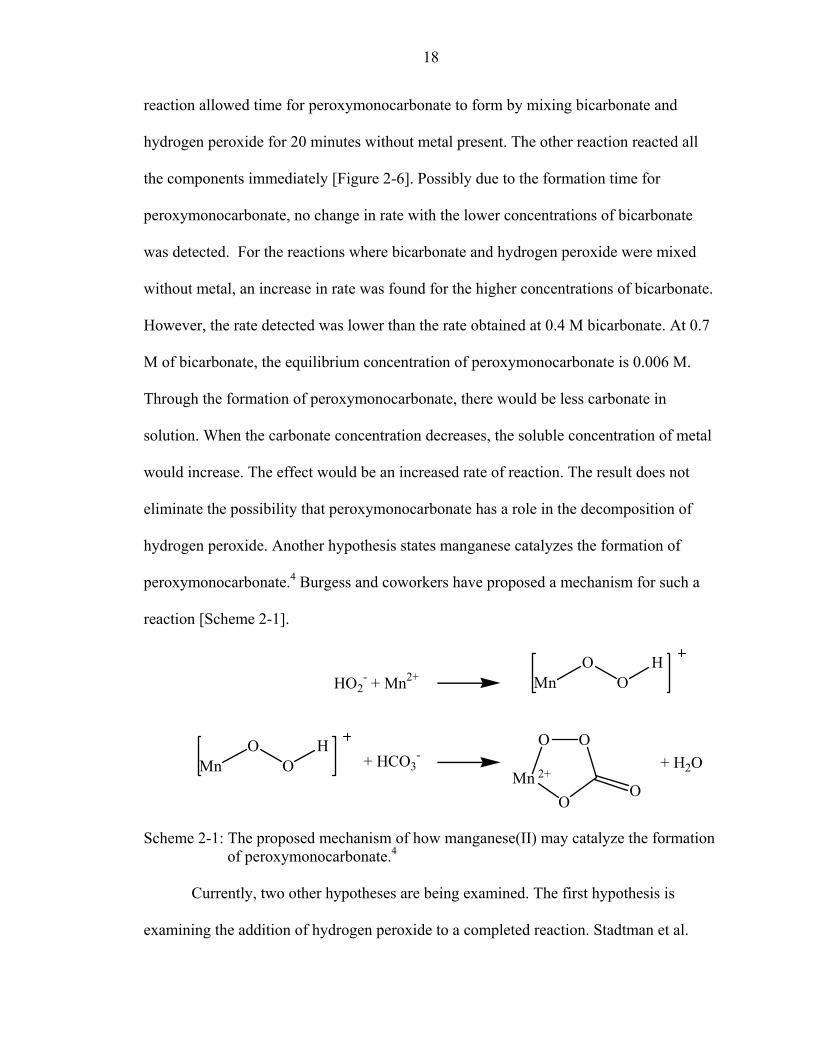
hydrogen peroxide. Another hypothesis states manganese catalyzes the formation of
peroxymonocarbonate.4 Burgess and coworkers have proposed a mechanism for such a
reaction [Scheme 2-1].
HO2- + Mn2+ Mn
OO
H
MnO
OH
+ HCO3-
Mn
O O
OO
2++ H2O
Scheme 2-1: The proposed mechanism of how manganese(II) may catalyze the formation of peroxymonocarbonate.4
Currently, two other hypotheses are being examined. The first hypothesis is
examining the addition of hydrogen peroxide to a completed reaction. Stadtman et al.
19
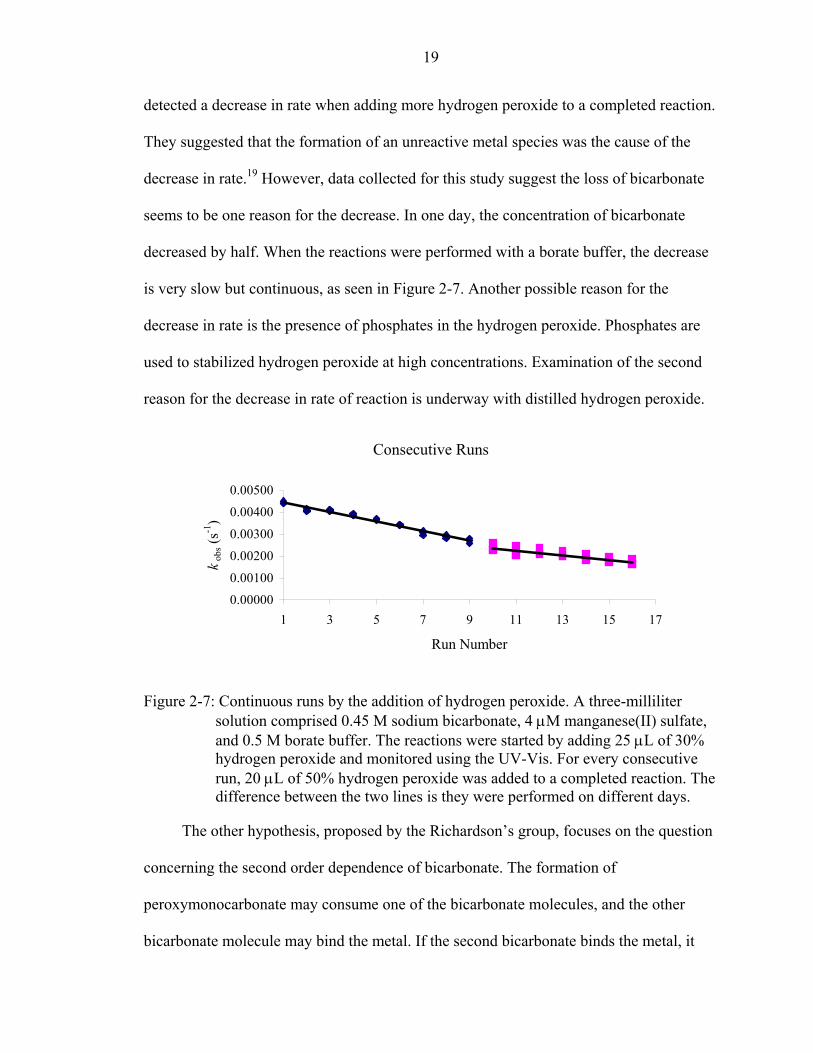
detected a decrease in rate when adding more hydrogen peroxide to a completed reaction.
They suggested that the formation of an unreactive metal species was the cause of the
decrease in rate.19 However, data collected for this study suggest the loss of bicarbonate
seems to be one reason for the decrease. In one day, the concentration of bicarbonate
decreased by half. When the reactions were performed with a borate buffer, the decrease
is very slow but continuous, as seen in Figure 2-7. Another possible reason for the
decrease in rate is the presence of phosphates in the hydrogen peroxide. Phosphates are
used to stabilized hydrogen peroxide at high concentrations. Examination of the second
reason for the decrease in rate of reaction is underway with distilled hydrogen peroxide.
Consecutive Runs
0.00000
0.00100
0.00200
0.00300
0.00400
0.00500
1 3 5 7 9 11 13 15 17
Run Number
k obs
(s-1
)
Figure 2-7: Continuous runs by the addition of hydrogen peroxide. A three-milliliter solution comprised 0.45 M sodium bicarbonate, 4 µM manganese(II) sulfate, and 0.5 M borate buffer. The reactions were started by adding 25 µL of 30% hydrogen peroxide and monitored using the UV-Vis. For every consecutive run, 20 µL of 50% hydrogen peroxide was added to a completed reaction. The difference between the two lines is they were performed on different days.
The other hypothesis, proposed by the Richardson’s group, focuses on the question
concerning the second order dependence of bicarbonate. The formation of
peroxymonocarbonate may consume one of the bicarbonate molecules, and the other
bicarbonate molecule may bind the metal. If the second bicarbonate binds the metal, it
20
may be possible to change the rate order of bicarbonate by adding other metal chelators.
If the rate order varies, the result would support the hypothesis. Currently, both different
macrocycles and molecules that could bind in a manner similar to bicarbonate are being
used to test the hypothesis. Initial results have not supported the hypothesis but more
studies are being performed.
The study presented here demonstrated that some buffers, such as phosphate and
HEPES, change the rate. One also must also be aware of all the contaminants within
bicarbonate and hydrogen peroxide. Many salts contain both phosphates and carbonate
and both anions are very insoluble with manganese(II).
One buffer, boric acid/borate, has not been shown to change the rate. Using this
buffer, the disproportionation of hydrogen peroxide has been analyzed. Both the rate
order of manganese(II) and bicarbonate have been determined, and the values match
reported values. Studies are continuing to propose a mechanism for the decomposition of
hydrogen peroxide with manganese(II) and bicarbonate.
Oxidation of DNA. Using 1H-NMR, Bennett detected a reaction between hydrogen
peroxide and linoleic acid in the presence of bicarbonate, forming an epoxide at each of
its double bonds.16 The result was an early observation of peroxymonocarbonate
oxidization of biological molecules. From the result, Regino decided to study the
oxidation of another biological molecule, guanosine monophosphate, with
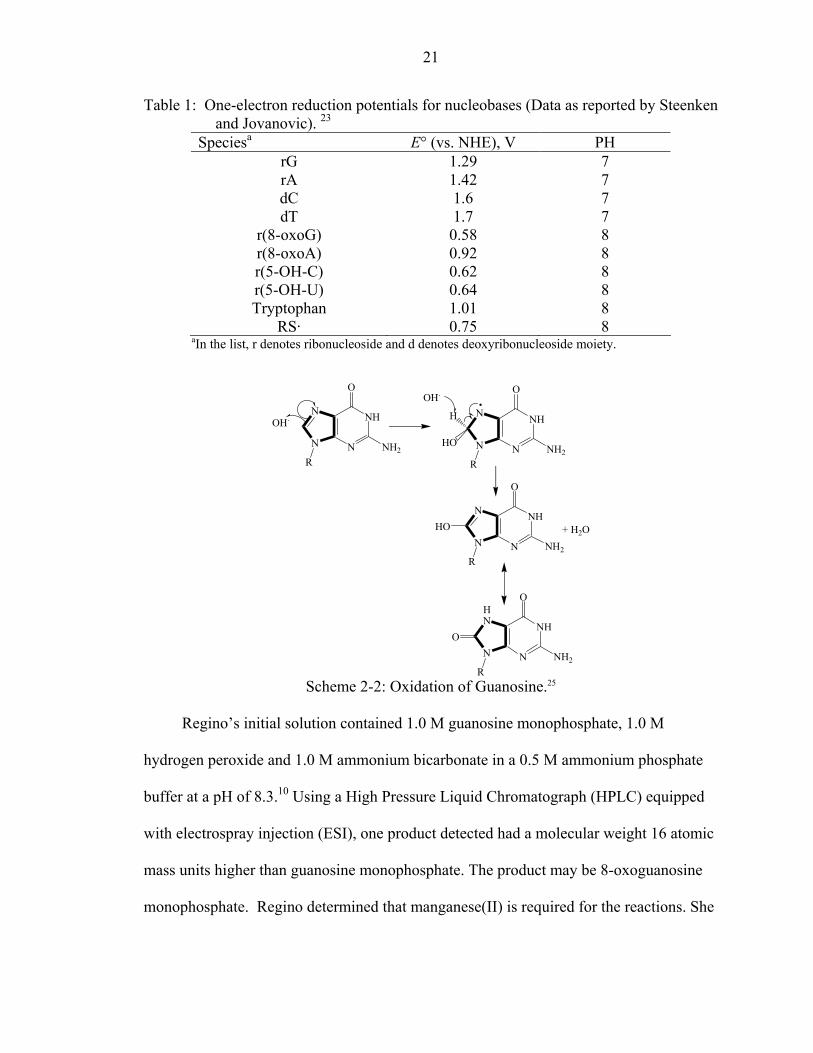
peroxymonocarbonate.10 During most oxidations of guanosine monophosphate, 8-
oxoguanosine forms [Scheme 2-2]. Another reason for choosing guanosine was its
reduction potential, the lowest of all DNA bases, Table 1.23
21
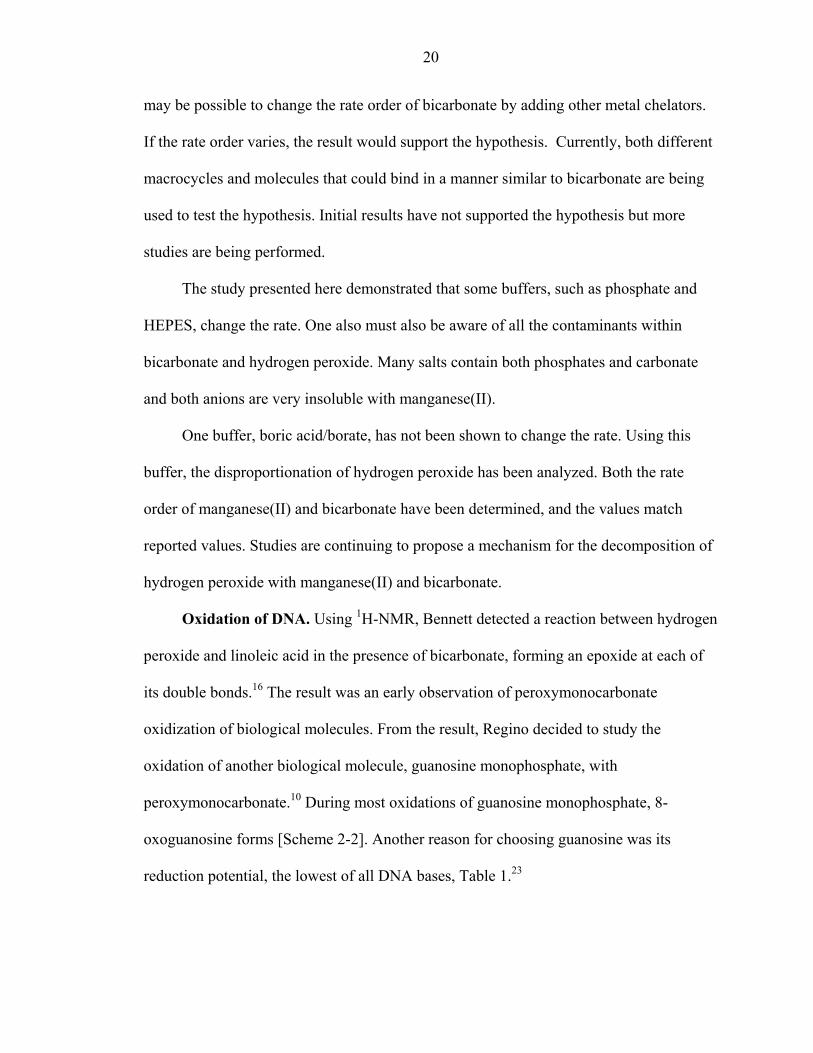
Table 1: One-electron reduction potentials for nucleobases (Data as reported by Steenken and Jovanovic). 23
Speciesa E° (vs. NHE), V PH rG 1.29 7 rA 1.42 7 dC 1.6 7 dT 1.7 7
r(8-oxoG) 0.58 8 r(8-oxoA) 0.92 8 r(5-OH-C) 0.62 8 r(5-OH-U) 0.64 8 Tryptophan 1.01 8
RS· 0.75 8 aIn the list, r denotes ribonucleoside and d denotes deoxyribonucleoside moiety.
NH
NN
N
O
NH2
NH
NN
N
O
NH2
HO + H2O
OH.
NH
NN
N
O
NH2
H
HO
NH
NN
HN
O
NH2
O
OH.
R R
R
R Scheme 2-2: Oxidation of Guanosine.25
Regino’s initial solution contained 1.0 M guanosine monophosphate, 1.0 M
hydrogen peroxide and 1.0 M ammonium bicarbonate in a 0.5 M ammonium phosphate
buffer at a pH of 8.3.10 Using a High Pressure Liquid Chromatograph (HPLC) equipped
with electrospray injection (ESI), one product detected had a molecular weight 16 atomic
mass units higher than guanosine monophosphate. The product may be 8-oxoguanosine
monophosphate. Regino determined that manganese(II) is required for the reactions. She
22
also developed a HPLC method to separate guanosine monophosphate from the other
oxidation products.
Regino’s work was reproduced in order to study the oxidation of DNA. The
addition of 5 µM manganese(II) to the reaction conditions was included due to the
requirement of manganese(II) for the reaction. After starting a reaction, aliquots of the
reaction were diluted. The samples were then analyzed using her HPLC method. The
results did not match the previously obtained chromatogram, possibly due to the metal
addition. The additional metal may have affected the reaction. Therefore, a reaction
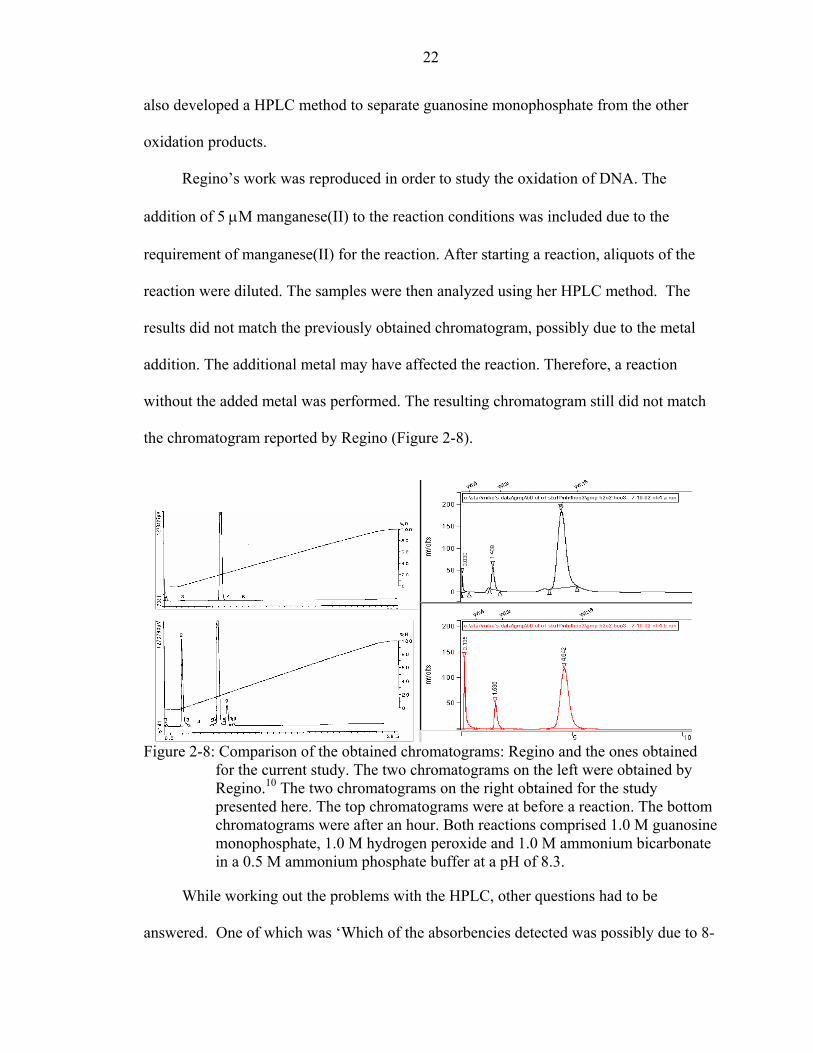
without the added metal was performed. The resulting chromatogram still did not match
the chromatogram reported by Regino (Figure 2-8).
Figure 2-8: Comparison of the obtained chromatograms: Regino and the ones obtained for the current study. The two chromatograms on the left were obtained by Regino.10 The two chromatograms on the right obtained for the study presented here. The top chromatograms were at before a reaction. The bottom chromatograms were after an hour. Both reactions comprised 1.0 M guanosine monophosphate, 1.0 M hydrogen peroxide and 1.0 M ammonium bicarbonate in a 0.5 M ammonium phosphate buffer at a pH of 8.3.
While working out the problems with the HPLC, other questions had to be
answered. One of which was ‘Which of the absorbencies detected was possibly due to 8-
23
oxoguanosine monophosphate eluting the column?’ To answer the question, I endeavored
to produce 8-oxoguanosine monophosphate with an iron complex, but was
unsuccessful.34 I then attempted to purchase 8-oxoguanosine monophosphate.
Unfortunately, no commercial source was available.
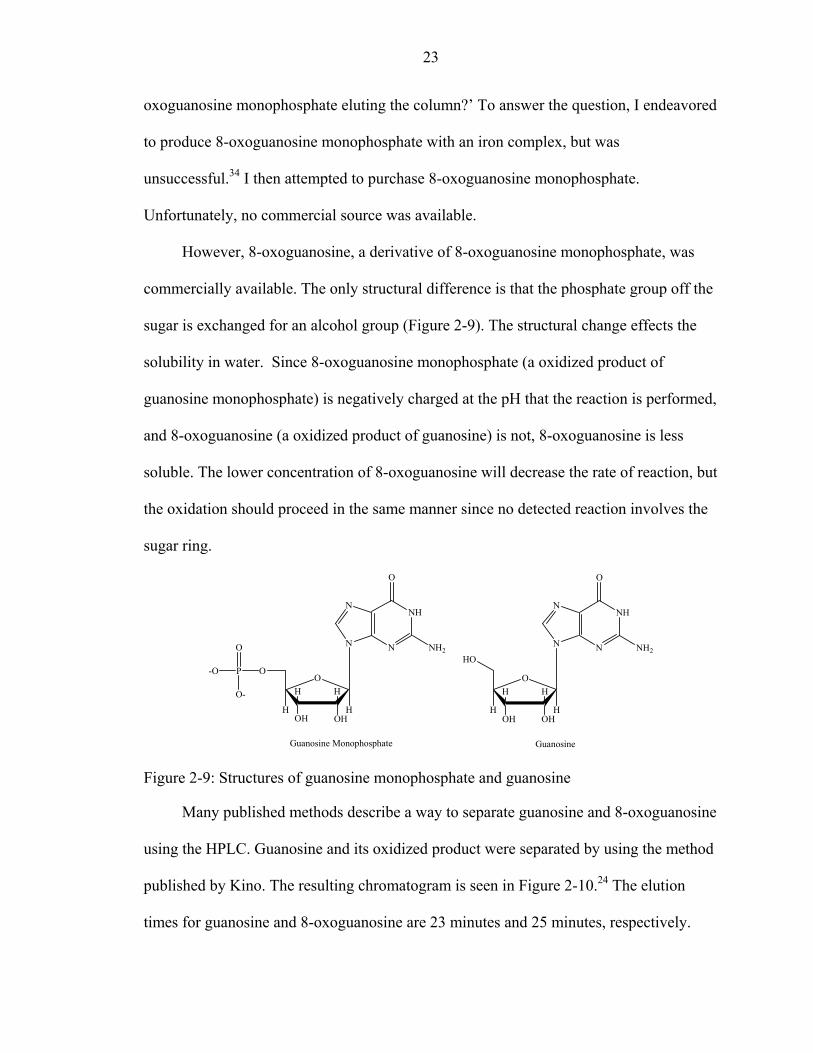
However, 8-oxoguanosine, a derivative of 8-oxoguanosine monophosphate, was
commercially available. The only structural difference is that the phosphate group off the
sugar is exchanged for an alcohol group (Figure 2-9). The structural change effects the
solubility in water. Since 8-oxoguanosine monophosphate (a oxidized product of
guanosine monophosphate) is negatively charged at the pH that the reaction is performed,
and 8-oxoguanosine (a oxidized product of guanosine) is not, 8-oxoguanosine is less
soluble. The lower concentration of 8-oxoguanosine will decrease the rate of reaction, but
the oxidation should proceed in the same manner since no detected reaction involves the
sugar ring.
NH
N
N
O
NH2N
O
OHOH
HH
HH
HO
NH
N
N
O
NH2N
O
OH
HH
HHOH
OP-O
O
O-
Guanosine Monophosphate Guanosine
Figure 2-9: Structures of guanosine monophosphate and guanosine
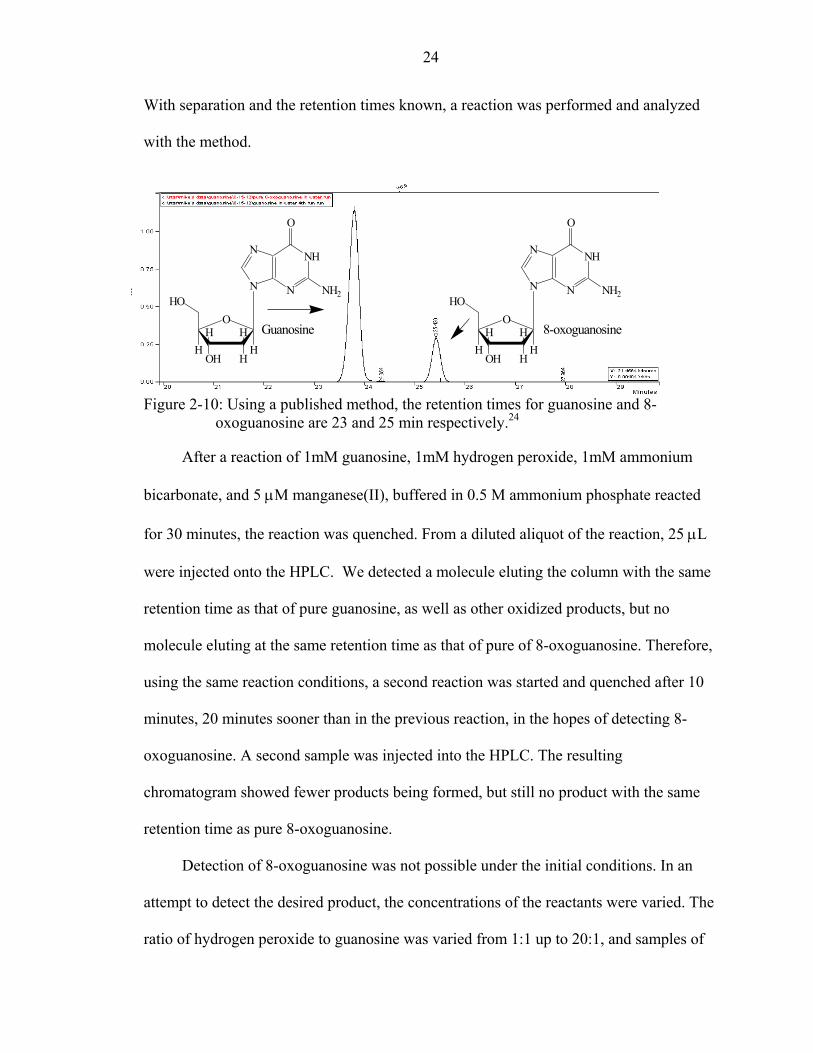
Many published methods describe a way to separate guanosine and 8-oxoguanosine
using the HPLC. Guanosine and its oxidized product were separated by using the method
published by Kino. The resulting chromatogram is seen in Figure 2-10.24 The elution
times for guanosine and 8-oxoguanosine are 23 minutes and 25 minutes, respectively.
24
With separation and the retention times known, a reaction was performed and analyzed
with the method.
NH
N
N
O
NH2N
O
HOH
HHHH
HO
NH
N
N
O
NH2N
O
HOH
HHHH
HO
Guanosine 8-oxoguanosine
Figure 2-10: Using a published method, the retention times for guanosine and 8- oxoguanosine are 23 and 25 min respectively.24
After a reaction of 1mM guanosine, 1mM hydrogen peroxide, 1mM ammonium
bicarbonate, and 5 µM manganese(II), buffered in 0.5 M ammonium phosphate reacted
for 30 minutes, the reaction was quenched. From a diluted aliquot of the reaction, 25 µL
were injected onto the HPLC. We detected a molecule eluting the column with the same
retention time as that of pure guanosine, as well as other oxidized products, but no
molecule eluting at the same retention time as that of pure of 8-oxoguanosine. Therefore,
using the same reaction conditions, a second reaction was started and quenched after 10
minutes, 20 minutes sooner than in the previous reaction, in the hopes of detecting 8-
oxoguanosine. A second sample was injected into the HPLC. The resulting
chromatogram showed fewer products being formed, but still no product with the same
retention time as pure 8-oxoguanosine.
Detection of 8-oxoguanosine was not possible under the initial conditions. In an
attempt to detect the desired product, the concentrations of the reactants were varied. The
ratio of hydrogen peroxide to guanosine was varied from 1:1 up to 20:1, and samples of
25
these reactions were injected into the HPLC. During the oxidation reactions, 8-
oxoguanosine was never detected. Compared to guanosine, 8-oxoguanosine has a lower
reduction potential, possibly resulting in a faster oxidation of 8-oxoguanosine. The faster
oxidation would limit the concentration in solution, making it harder to detect the
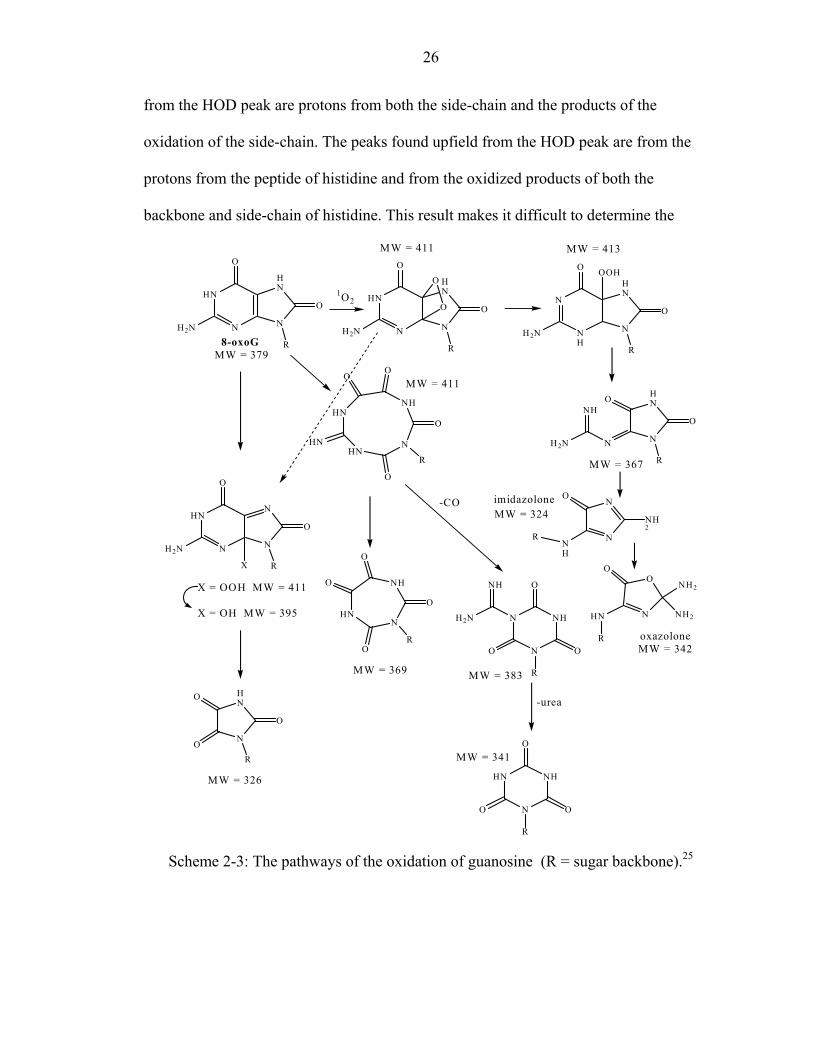
product. Besides the reduction potential of 8-oxoguanosine, the oxidation of 8-
oxoguanosine can occur at more than one position, increasing its oxidation rate. Shown
in Scheme 2-3 are the proposed pathways for 8-oxoguanosine to be oxidized by hydroxyl
radicals.25
Currently, other reported methods of detection are not available to us. Kinetically,
the oxidation reaction was difficult to study. A different substrate was sought. Hoping to
continue studying the oxidation of guanosine, a molecule proposed to oxidize in a similar
manner was obtained. The new substrate was an amino acid. The oxidized product is
detected near the active sites of some enzymes.26
Oxidation of amino acids. Of the twenty amino acids, histidine was the substrate
of interest. A proposed mechanism for the oxidation of the imidazole ring on histidine by
the hydroxyl radical includes a pathway similar to the pathway to form 8-oxoguanosine
from guanosine [Scheme 2-4]. 26 If oxidation of the imidazole ring could be followed, the
pathway by which the oxidation of the DNA base occurs may be better understood.
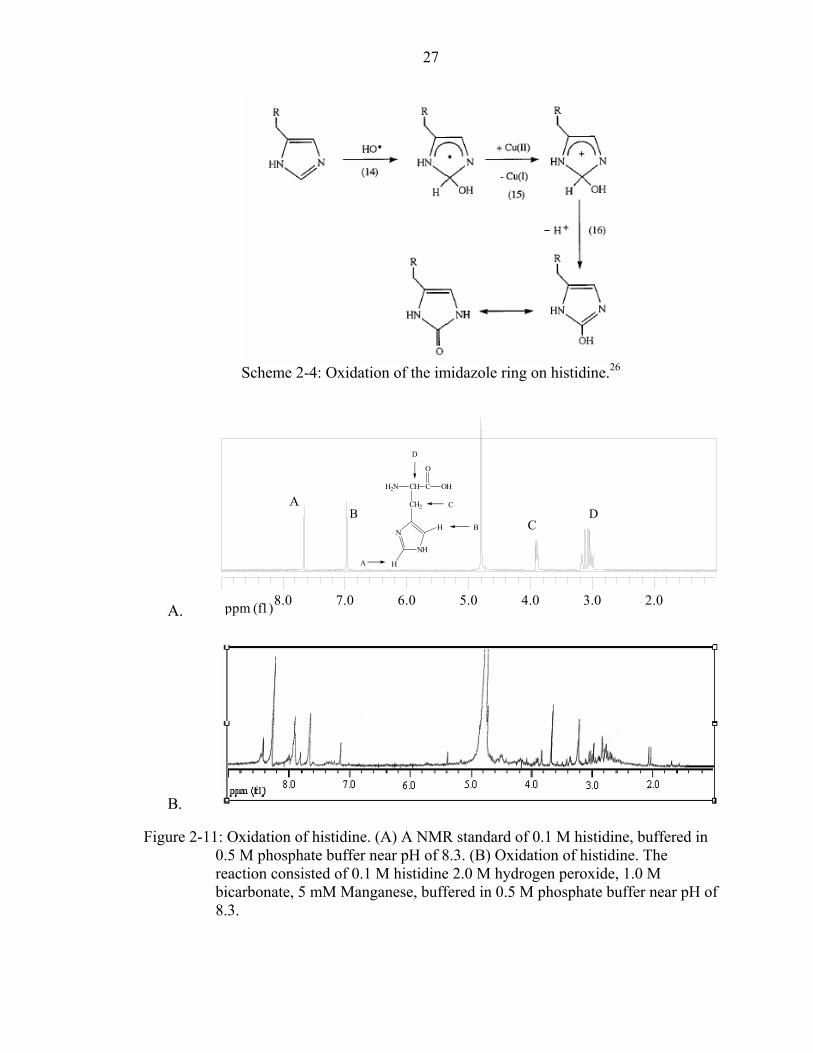
A histidine standard was obtained using Proton Nuclear Magnetic Resonance (1H-
NMR). Employing the oxidation method for guanosine, oxidation of histidine was
completed. The reaction was also analyzed using 1H-NMR. As seen in Figure 2-11, the
NMR spectrum after a reaction shows more peaks than does the standard of spectrum of
histidine. The peak at 4.60 is from deuterate of water (HOD). The peaks found downfield
26
from the HOD peak are protons from both the side-chain and the products of the
oxidation of the side-chain. The peaks found upfield from the HOD peak are from the
protons from the peptide of histidine and from the oxidized products of both the
backbone and side-chain of histidine. This result makes it difficult to determine the
HN
N N
HN
O
H2N
R
O
8-oxoGMW = 379
HN
N N
N
O
H2N
R
O
N
NH
N
HN
O
H2N
R
OHN
N N
HN
O
H2N
R
O
HN
HNN
NH
O
O
OOH
NH
N
O
N
HN
H2N
R
O
HN
OO
O
O
R
N
N
NH
O
O
HNN
NH
N
HN
X
X = OOH MW = 411
X = OH MW = 395
R
O
O
O
O
H2N
NH
O
R
HN
N
NH
O
O O
R
O
O
OR
1O2
-CO
-urea
MW = 326
MW = 411
MW = 411
MW = 413
MW = 367
MW = 369 MW = 383
MW = 341
imidazolone
N
N
NH2
O
NH
R
N
O
NH2
O
HN
R
NH2
oxazoloneMW = 342
MW = 324
Scheme 2-3: The pathways of the oxidation of guanosine (R = sugar backbone).25
27
Scheme 2-4: Oxidation of the imidazole ring on histidine.26
A. ppm (f1) 2.03.04.05.06.07.08.0
H2N CH C
CH2
OH
O
N
NH
H
H
A
B
C
D
AB D
C
B.
Figure 2-11: Oxidation of histidine. (A) A NMR standard of 0.1 M histidine, buffered in 0.5 M phosphate buffer near pH of 8.3. (B) Oxidation of histidine. The reaction consisted of 0.1 M histidine 2.0 M hydrogen peroxide, 1.0 M bicarbonate, 5 mM Manganese, buffered in 0.5 M phosphate buffer near pH of 8.3.
28
products using the NMR. Some published studies listed possible products from the
oxidation of the imidazole on histidine. The listed products included 2-oxohistidine,
aspartic acid, and asparagine.7 For the oxidation of the side-chain, the pathway to form
the products is proposed to proceed through two consecutive reactions. The first is a
deamination reaction, and the second is a decarboxylation reaction.35
The first set of experiments examined the oxidation of the backbone using an
amino acid with a less reactive side-chain. Glycine has the simplest side-chain of all the
amino acids, but peaks would not appear in the 1H-NMR for some of the proposed
oxidation products.27 Therefore, it was not chosen to be studied. The next simplest amino
acid is alanine. The oxidization of alanine can be analyzed by 1H-NMR. Therefore, the
pathway by which the backbone of an amino acid oxidizes will be examined with alanine.
A standard of alanine was then obtained using 1H-NMR.
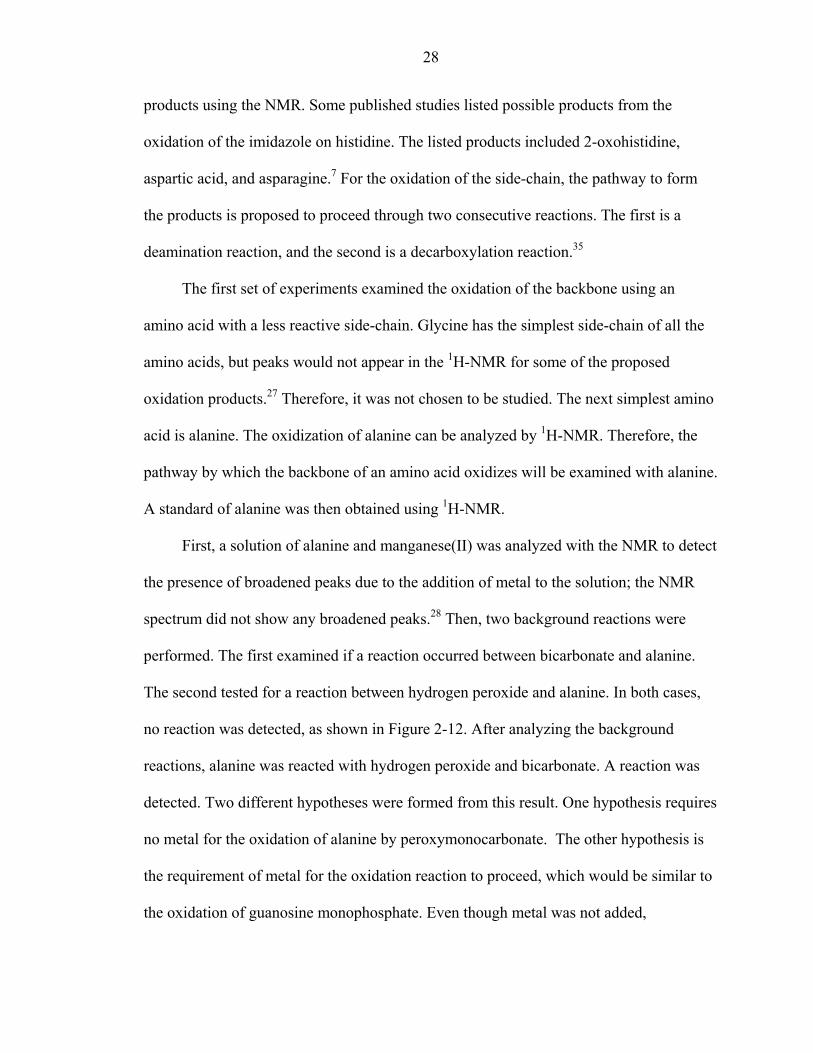
First, a solution of alanine and manganese(II) was analyzed with the NMR to detect
the presence of broadened peaks due to the addition of metal to the solution; the NMR
spectrum did not show any broadened peaks.28 Then, two background reactions were
performed. The first examined if a reaction occurred between bicarbonate and alanine.
The second tested for a reaction between hydrogen peroxide and alanine. In both cases,
no reaction was detected, as shown in Figure 2-12. After analyzing the background
reactions, alanine was reacted with hydrogen peroxide and bicarbonate. A reaction was
detected. Two different hypotheses were formed from this result. One hypothesis requires
no metal for the oxidation of alanine by peroxymonocarbonate. The other hypothesis is
the requirement of metal for the oxidation reaction to proceed, which would be similar to
the oxidation of guanosine monophosphate. Even though metal was not added,

29
manganese is one contaminate found in sodium bicarbonate. The metal contaminate may
have been the cause of the detected reaction. To further examine the second hypothesis,
5 µM metal was added to the reaction. As shown in Figure 2-12, a higher concentration
of products was detected. This result supports the second hypothesis, requiring metal for
the oxidation reactions. More experiments are needed to examine the importance of metal
during these oxidation reactions.
The first step to determine the products was examining Stadtman’s papers.2;20;35 In
his papers, he proposed reactions for the detected products.2 These reactions are shown in
Scheme 2-5. One product he reported was an aldehyde. In the case of alanine oxidation,
ethanal is the aldehyde that forms. If ethanal forms, a peak should appear between 9 and
10 in the 1H-NMR spectrum. When analyzing the reactions, no peaks were detected
downfield from the HOD peak. The boiling point of ethanal is below room temperature,
and the reactions were performed open to the air. Both of these suggest the evaporation of
ethanal may occur prior to analysis. Stadtman and coworkers performed their reaction in
a closed container, eliminating the possibility for ethanal to evaporate.
2 H2O2 + + CO2 + NH4+ + 2 H2O
H2O2 + + NH4+ + H2O
H2O2 + + NH4+ + HCO3
-
H3N CO2
R
H3N CO2
R
H3N CO2
R
RO
O
R
OO
O
R
O
H Scheme 2-5: Reactions that Stadtman proposed to obtain the products they detected. If
alanine was the amino acid being oxidized, R = Methyl.2
30
A. ppm (f1)1.502.002.503.003.504.004.50
B
B. ppm (f1)1.502.002.503.003.504.004.50
H2N CH C
CH3
OH
OA
BA
B
C. ppm (f1)1.502.002.503.003.504.004.50
A
B
A
D. ppm (f1)1.502.002.503.003.504.004.50
B
A
Figure 2-12: Oxidation of Alanine. (A) 0.10 M Alanine, (B) 0.10 M Alanine with 1.0 M
hydrogen peroxide after 24 hours, (C) shows 0.10 M alanine with 0.5 M bicarbonate, and (D) shows 0.10 M alanine with a mixture of 5 µM manganese, 0.5 M ammonium bicarbonate, and 1.0 M hydrogen peroxide. All of the mixtures were buffered in phosphate at 8.3 and the solvent is D2O.
31
To determine if an aldehyde forms, a different amino acid was studied. To produce
an aldehyde with a higher boiling point, an amino acid with a longer side-chain than that
of alanine was examined. When oxidizing leucine, the resulting aldehyde formed
(isovaleraldehyde) has a boiling point of 90oC.
Another concern was eliminated at the same time. This other worry dealt with over-
oxidation of the amino acids. During the oxidation of both histidine and alanine, the
concentration of the hydrogen peroxide was greater than ten times the concentration of
the amino acid. A Fenton type reaction may be possible with the excess hydrogen
peroxide. To eliminate this concern, experiments using Stadtman’s lab procedure were
performed.2
However, with the new procedure came a new concern. They used a carbon
dioxide-rich atmosphere above the solution to buffer the oxidations.2 During the
decomposition studies, Statman’s lab detected a different rate order for bicarbonate with
the addition of carbon dioxide to the atmosphere above the solution. Therefore, a
reaction with the addition of carbon dioxide to the atmosphere above the solution may
change the reactivity.
A series of experiments were devised to test the effects, if any, of a carbon dioxide-
rich atmosphere. First, a series of experiments were performed with carbon dioxide added
to the atmosphere. The first experiment completed reproduced experiments lead by
Stadtman.2 After two hours, the solution was analyzed by two different methods. The
first method used the HPLC. Stadtman and coworkers had reported using the HPLC as a
means to determine what products formed. When performing the reported HPLC
method, none of the molecules retention times were similar when comparing runs.
32
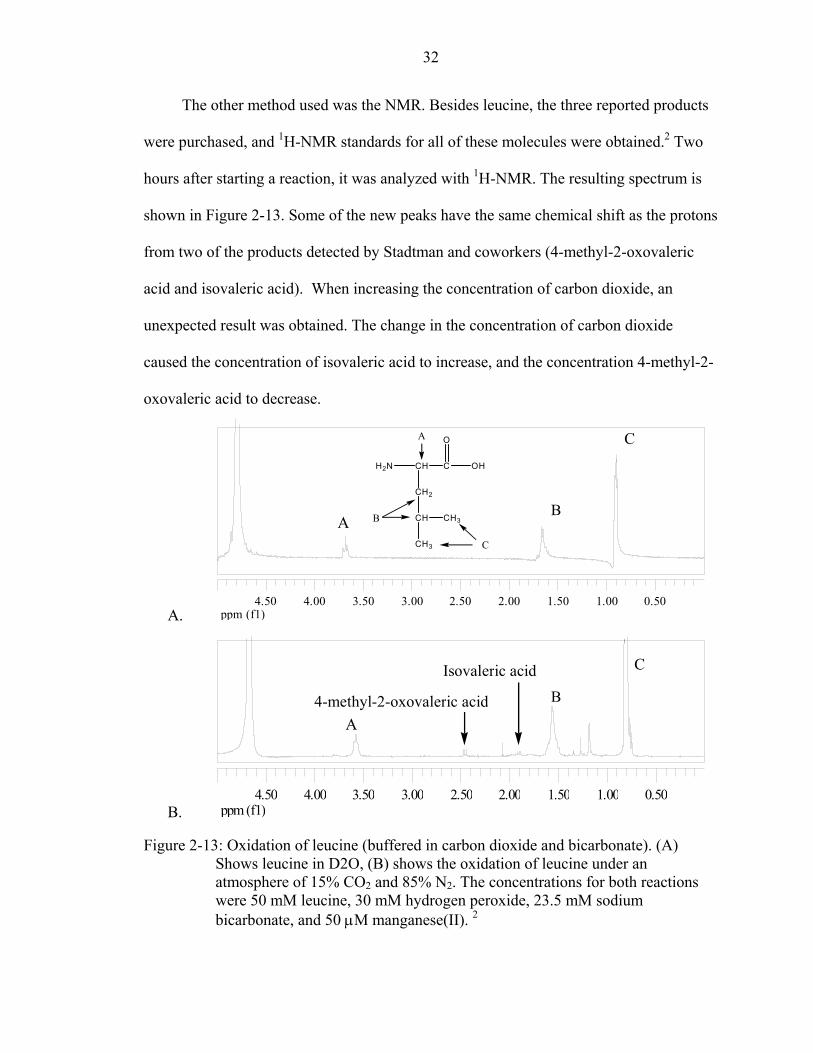
The other method used was the NMR. Besides leucine, the three reported products
were purchased, and 1H-NMR standards for all of these molecules were obtained.2 Two
hours after starting a reaction, it was analyzed with 1H-NMR. The resulting spectrum is
shown in Figure 2-13. Some of the new peaks have the same chemical shift as the protons
from two of the products detected by Stadtman and coworkers (4-methyl-2-oxovaleric
acid and isovaleric acid). When increasing the concentration of carbon dioxide, an
unexpected result was obtained. The change in the concentration of carbon dioxide
caused the concentration of isovaleric acid to increase, and the concentration 4-methyl-2-
oxovaleric acid to decrease.
A. ppm (f1)0.501.001.502.002.503.003.504.004.50
CH2N CH C
CH2
OH
O
CH CH3
CH3
A
C
B BA
B. ppm (f1)0.501.001.502.002.503.003.504.004.50
C
A4-methyl-2-oxovaleric acid
Isovaleric acidB
Figure 2-13: Oxidation of leucine (buffered in carbon dioxide and bicarbonate). (A) Shows leucine in D2O, (B) shows the oxidation of leucine under an atmosphere of 15% CO2 and 85% N2. The concentrations for both reactions were 50 mM leucine, 30 mM hydrogen peroxide, 23.5 mM sodium bicarbonate, and 50 µM manganese(II). 2
33
Through pH changes, the varying concentrations of the two products can be
explained. The solution becomes more acidic as the concentration of carbon dioxide
above the solution increases. The result of increasing acidity makes hydroperoxide
(HOO-) less abundant in the solution. Hydroperoxide is hypothesized to decarboxylate α-
keto acids, resulting in the formation of a carboxylic acid [Scheme 2-6].29-33 In the
reaction, 4-methyl-2-oxovaleric acid is the α-keto acid, and isovaleric acid is the
resulting carboxylic acid.
Scheme 2-6: The proposed decarboxylation reaction.30
HO
O O
CH3 OHOO
O OCH3
+ OOHHO
O
CH3
+ CO2 + H2O
Pyruvate Hydroperoxide Acetic Acid
HB
H
B
H2O2 HOO- + H+
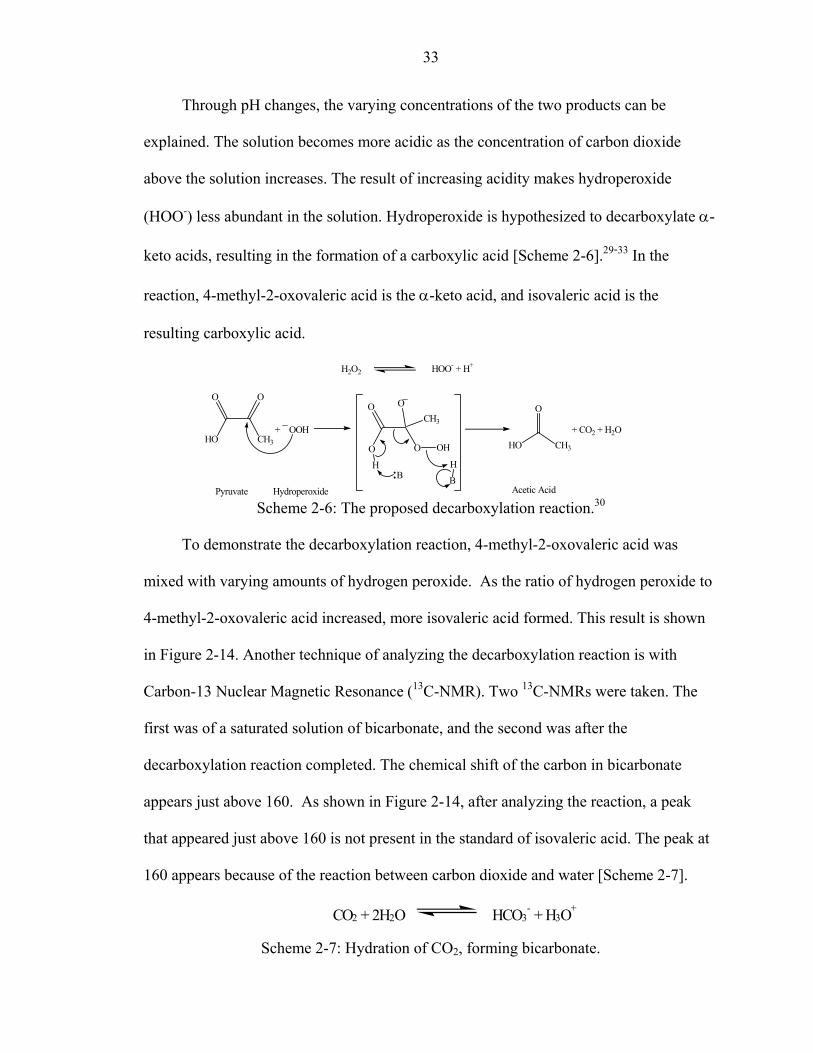
To demonstrate the decarboxylation reaction, 4-methyl-2-oxovaleric acid was
mixed with varying amounts of hydrogen peroxide. As the ratio of hydrogen peroxide to
4-methyl-2-oxovaleric acid increased, more isovaleric acid formed. This result is shown
in Figure 2-14. Another technique of analyzing the decarboxylation reaction is with
Carbon-13 Nuclear Magnetic Resonance (13C-NMR). Two 13C-NMRs were taken. The
first was of a saturated solution of bicarbonate, and the second was after the
decarboxylation reaction completed. The chemical shift of the carbon in bicarbonate
appears just above 160. As shown in Figure 2-14, after analyzing the reaction, a peak
that appeared just above 160 is not present in the standard of isovaleric acid. The peak at
160 appears because of the reaction between carbon dioxide and water [Scheme 2-7].
CO2 + 2H2O HCO3- + H3O +
Scheme 2-7: Hydration of CO2, forming bicarbonate.
34
A. ppm (f1) 0.501.001.502.002.503.003.504.004.50
B. ppm (f1) 0.501.001.502.002.503.003.504.004.50
C. ppm (f1) 0.501.001.502.002.503.003.504.004.50
D. ppm (f1) 255075100125150175
4-methyl-2-oxovaleric acid
CC
H2C
HO
O CH
CH3
CH3
C
B
O
A
Isovaleric acid
C
H2C
HO
CH
CH3
CH3
C'
B'
O
A'
A
A
C
C
B
B
C'
C'
B'
B'
A'
A'
4-methyl-2-oxovaleric acid + hydrogen peroxide isovaleric acid + carbon dioxide + water
Carbon peak from bicarbonate
Figure 2-14: Decarboxylation reaction. (A) 50 mM 4-methyl-2-oxovaleric acid, (B) 50
mM isovaleric acid, (C) and (D) shows the decarboxylation of 4-methyl-2-oxovaleric acid (1H and 13C) using 50mM 4-methyl-2-oxovaleric acid, and either 30 mM hydrogen peroxide (C) or 60 mM hydrogen peroxide (D) in aphosphate buffer, pH 8.3. All reactions preformed in D2O.
35
A. ppm (f1) 2.03.04.05.06.07.08.09.0
isovaleraldehyde + water dialcoholCH
H2C CH
CH3
CH3
O
CHCH2
CH
CH3
CH3HO
OHA
B D
C
A'
B'
C'D'
B'A'
DB
A DC' '
C
B. ppm (f1) 2.03.04.05.06.07.08.09.0
DC
BA
D'
C'
B'
A'
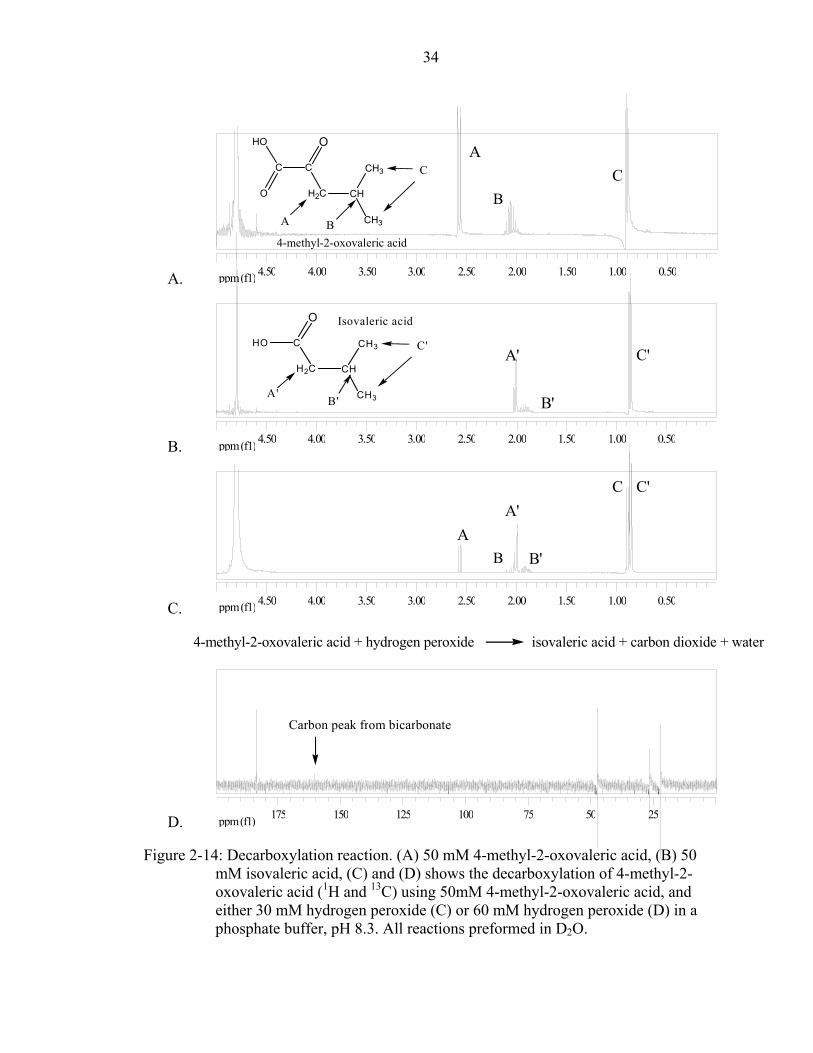
Figure 2-15: Reaction with isovaleraldehyde. (A) NMR standard of isovaleraldehyde. The concentration of the aldehyde is .5 M. The buffer used comprised borate, with the pH was near 8.34. (B) Oxidation of isovaleraldehyde, where the concentrations were50 mM aldehyde, 30 mM hydrogen peroxide, 23.5 mM sodium bicarbonate, and 50 µM manganese(II). This reaction was buffered in phosphate buffer, with the pH near 8.3.
To determine if any other reactions occur, 4-methyl-2-oxovaleric acid and
isovaleric acid were reacted separately under the same conditions used to oxidize leucine.
Aside from the decarboxylation reaction, no other reaction was detected.
A standard of isovaleraldehyde was also analyzed. As shown in Figure 2-15, peaks
that appear in the NMR spectra after an oxidation of leucine have the same chemical
shifts as protons showed in the standard of aldehyde, supporting Stadtman’s group
results.2 However, the peak between 9 and 10 found in the NMR spectrum of the
aldehyde is not detected after a reaction. Detection of the peak may be difficult due to a
reaction between isovaleraldehyde and water, forming a dialcohol. Isovaleraldehyde was
also oxidized similar to leucine. The only product detected has the same chemical shifts
as peaks appear in the NMR spectrum of a standard of isovaleric acid.
36
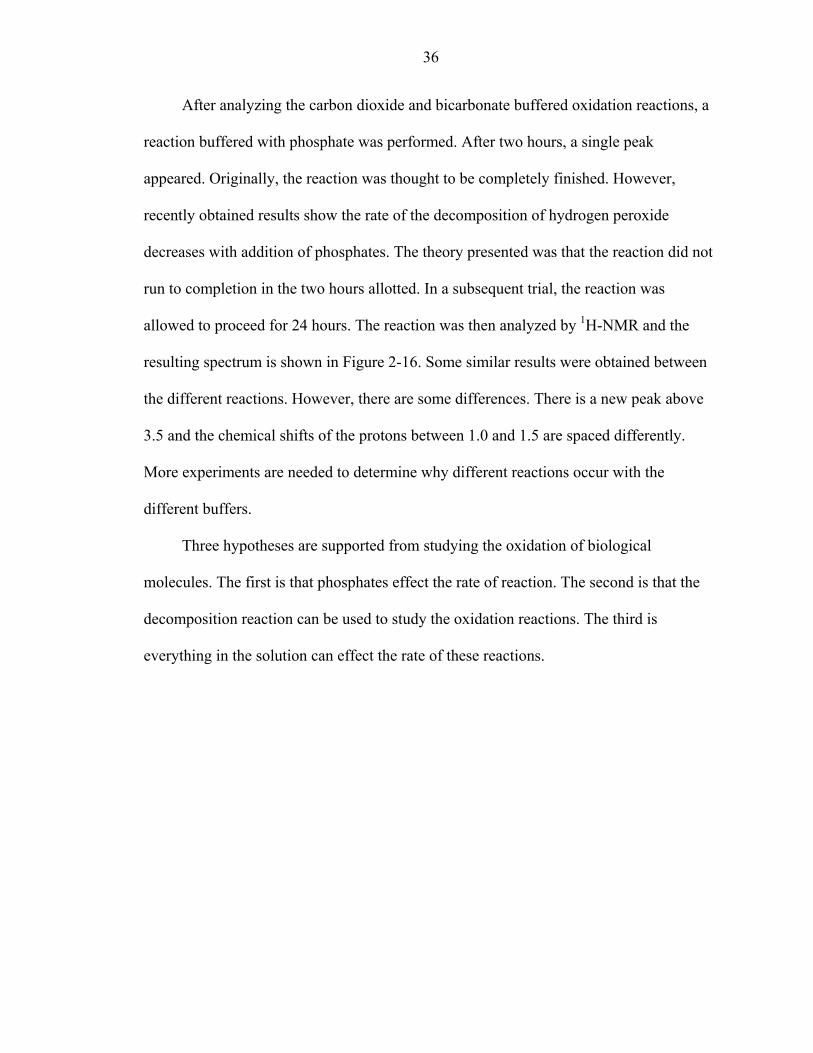
After analyzing the carbon dioxide and bicarbonate buffered oxidation reactions, a
reaction buffered with phosphate was performed. After two hours, a single peak
appeared. Originally, the reaction was thought to be completely finished. However,
recently obtained results show the rate of the decomposition of hydrogen peroxide
decreases with addition of phosphates. The theory presented was that the reaction did not
run to completion in the two hours allotted. In a subsequent trial, the reaction was
allowed to proceed for 24 hours. The reaction was then analyzed by 1H-NMR and the
resulting spectrum is shown in Figure 2-16. Some similar results were obtained between
the different reactions. However, there are some differences. There is a new peak above
3.5 and the chemical shifts of the protons between 1.0 and 1.5 are spaced differently.
More experiments are needed to determine why different reactions occur with the
different buffers.
Three hypotheses are supported from studying the oxidation of biological
molecules. The first is that phosphates effect the rate of reaction. The second is that the
decomposition reaction can be used to study the oxidation reactions. The third is
everything in the solution can effect the rate of these reactions.
37
A. ppm (f1)0.501.001.502.002.503.003.504.004.50
B. ppm (f1) 1.02.03.04.0
C. ppm (f1)0.501.001.502.002.503.003.504.004.50
H2N CH C
CH2
OH
O
CH CH3
CH3
A
C
B
A
A
A
B
B
B
C
C
C
D.
A
ppm (f1)0.501.001.502.002.503.003.504.004.50
B C
Figure 2-16: Comparing oxidation of leucine in two different buffers. A) Shows leucine
in D2O, (B) shows oxidation of leucine after two hours open to the air and buffered with sodium phosphate at pH 8.3, (C) shows oxidation of leucine after twenty four hours open to the air and buffered with sodium phosphate at pH 8.3, (D) shows the oxidation of leucine under an atmosphere of 15% CO2 and 85% N2. The concentrations for both reactions were 50 mM leucine, 30 mM hydrogen peroxide, 23.5 mM sodium bicarbonate, and 50 µM manganese(II).
CHAPTER 3 CONCLUSION
The oxidation reactions by peroxymonocarbonate have been examined through the
study of the disproportionation of hydrogen peroxide. From decomposition studies, some
buffers have been shown to affect the rate of reaction. Two of these buffers are
phosphate and HEPES.
Examination of a borate buffer was also undertaken. From obtained results, no
effect on the rate of the decomposition of hydrogen peroxide has been detected. Using
borate to buffer the solutions near 8.3, the rate orders for manganese(II) and bicarbonate
were determined. The results were similar to the published values, first order for
manganese(II) and second order for bicarbonate.18 In Richardson’s lab, two hypotheses
are currently being examined. The first hypothesis is studying the effects of adding
hydrogen peroxide to a completed reaction. The second hypothesis involves the
importance of the second order dependence in bicarbonate.
Also presented here was the oxidation of biological molecules. Oxidation of some
biological molecules, such as guanosine monophosphate, by peroxymonocarbonate
requires manganese(II). HPLC was used to study the oxidation reaction, and the product
of interest was 8-oxoguanosine monophosphate. The separation of the oxidation products
was inconclusive, and a derivative, guanosine, was then investigated.
Separation and detection of guanosine and 8-oxoguanosine were obtained using the
HPLC, monitoring at 254 nm.24 While analyzing the initial reaction, 8-oxoguanosine was
not detected. In an effort to detect the product, variations in the method of oxidation
38
39
were engaged. While varying reaction time and the amount of hydrogen peroxide,
detection of 8-oxoguanosine was never obtained. The only obtained result was that
different products appeared, possibly due to over-oxidation of guanosine and all of its
oxidized derivatives.
Kinetically, guanosine oxidation became difficult to study due to the formation of
many products. Oxidative reactions of another group of biological molecules, amino
acids, commenced. One amino acid of interest was histidine. A published oxidation
pathway proposed the oxidation of the imidazole ring on histidine similar to guanosine.6
Histidine was oxidized in the presences of peroxymonocarbonate and metal. Upon further
review of reported results, both the side chain and the backbone became oxidized.2 To
understand the pathway for the oxidation of the backbone, oxidation reactions of alanine
and leucine were studied. A study of the oxidation reactions showed that both
deamination and decarboxylation reactions occurred on the backbone of the amino acid.
Oxidation of amino acids buffered by phosphate or carbon dioxide and bicarbonate
produces some similar products. However, there are detectable differences. One notable
difference was that, after two hours, detection of more products occurred when carbon
dioxide and bicarbonate buffered the reaction compared with the reactions buffered in
phosphate. One possible explanation for the difference is that phosphates decrease the
concentration of metal in solution, resulting in a decrease in rate of reaction.
Another difference is, after twenty-four hours, the detection of more products when
buffering the reaction with phosphate. This supports a hypothesis. The addition of many
molecules can effect the rate of reactions. To determine the additional products formed in
the phosphate buffer reactions, more experiments will be examined. These results have

40
suggested that peroxymonocarbonate is not a molecule which could cause much
oxidative stress.
CHAPTER 4 CHEMICALS AND EQUIPMENT
Guanosine monophosphate, guanosine, L-leucine, DL-alanine, glycine, L-histidine,
boric acid, HEPES, sodium HEPES, and EPPS were obtained from Aldrich (St. Louis)
and used as received. Ammonium bicarbonate, sodium bicarbonate, sodium phosphate
(monobasic, dibasic, and tribasic), and manganese(II) sulfate were obtained from Fisher
(Fairlawn, NJ) and used without further purification. Hydrogen peroxide (both 30% and
50%) was obtained from Solvay Interox Inc, and D2O was obtained from Cambridge
Isotope Laboratories, Inc. The 8-oxoguanosine was obtained from Toronto Research
Chemicals.
Two different High Pressure Liquid Chromatographs (HPLCs) were used during
the experiments. One HPLC, bought from Rainin, was the HPXL model with a single
wavelength detector. The other HPLC was a Prostar Varian HPLC with a photo-diode
array detector. There were two different columns used during the experiments. The anion
exchange column was a strong anion exchange column (Hydropore AX 83-603 4.6 x 1.5
µm, 12 µm 300 Å) that was purchased through Rainin. The Supelco Discovery’s 25cm x
4.6 mm C-18 reverse-phase column packed with 5 µM endcapped, metal-free particles
was also used during the experiments.
NMR spectra were obtained using a Gemini, a VXR, or a Mercury spectrometer
operating at 300 MHz. The reactions were preformed in D2O, with spectra referenced to
the residual solvent peak.
41

42
UV-Vis spectra were obtained using a Hewlett Packard UV-Vis spectrometer. The
reactions were preformed in H2O and the observed wavelength was 264 nm.
CHAPTER 5 METHODS
Phosphate dependence for the decomposition of hydrogen peroxide. Before a
reaction, 1.0 M sodium bicarbonate was put through a Chelex column and collected. In a
quartz cuvette, a three-milliliter solution comprised 0.3 M sodium bicarbonate, 5 µM
manganese(II) sulfate, and 0 – 1.5 M phosphate buffer. To keep the ionic strength
constant, 0 – 1.5 M sodium acetate was also added. The reactions were started by adding
25 µL of 30% hydrogen peroxide and monitored using the UV-Vis.
Preparing HEPES and EPPS buffers for the decomposition of hydrogen
peroxide. HEPES was used to buffer the reactions from 7.0 up to 7.9, and EPPS was
used to buffer the reactions from 8.0 up to 8.6. Different amounts of sodium HEPES and
HEPES were mixed to obtained the desired pH. A stock of the buffers was prepared to
have a final concentration of 2.0 M. The concentration of the buffer in the reactions was
diluted to 0.5 M.
Oxidation of HEPES by peroxymonocarbonate. A standard of HEPES was
obtained by mixing 0.1 M HEPES with 0.5 M phosphate buffer, pH near 8.3. For the
oxidation of HEPES, 0.1 M HEPES, 0.15 M hydrogen peroxide, .23 M bicarbonate,
buffered in 0.5 M phosphate buffer near pH of 8.3.
Preparing borate buffer for the decomposition of hydrogen peroxide. To
prepare a 1.0 M borate buffer, 6.184 grams of boric acid was added to 75 mL of water in
a 100 mL flask. To this solution, 10 M sodium hydroxide was added until the pH of the
solution was near 8.3. Water was then added again until the total solution was 100 mL.
43
44
Borate dependence for the decomposition of hydrogen peroxide. Before a
reaction, 1.0 M sodium bicarbonate was put through a Chelex column and collected. In a
three-milliliter solution, 0.4 M sodium bicarbonate, 3 µM manganese(II) sulfate, and 0.2
– 0.5 M borate buffer were mixed. The reactions were started by adding 25 µL of 30%
hydrogen peroxide and monitored using the UV-Vis using a three-milliliter cell.
Bicarbonate dependence for the decomposition of hydrogen peroxide. Before a
reaction, 1.0 M sodium bicarbonate was put through a Chelex column and collected.
Mixed in a quartz cuvette, a three-milliliter solution comprised 0.05 – 0.8 M sodium
bicarbonate, 5 µM manganese(II) sulfate, and 0.5 M borate buffer. The reactions were
started by adding 25 µL of 30% hydrogen peroxide and monitored using the UV-Vis.
Manganese(II) dependence for the decomposition of hydrogen peroxide.
Before a reaction, 1.0 M sodium bicarbonate was put through a Chelex column and
collected. In a quartz cuvette, a three-milliliter solution that comprised 0.4 M sodium
bicarbonate, 0 – 50 µM manganese(II) sulfate, and 0.5 M borate buffer was mixed. The
reactions were started by adding 25 µL of 30% hydrogen peroxide and monitored using
the UV-Vis.
Ionic strength effect for the decomposition of hydrogen peroxide. Before a
reaction, 1.0 M sodium bicarbonate was put through a Chelex column and collected. In a
quartz cuvette, a three-milliliter solution that comprised 0.4 M sodium bicarbonate, 4 µM
manganese(II) sulfate, and 0.5 M borate buffer was mixed. To increase the ionic strength,
0 – 1.5 M sodium acetate was added. The reactions were started by adding 25 µL of 30%
hydrogen peroxide and monitored using the UV-Vis.
45
Many consecutive runs for the decomposition of hydrogen peroxide. Before a
reaction, 1.0 M sodium bicarbonate was put through a Chelex column and collected. In a
quartz cuvette, a three-milliliter solution that comprised 0.45 M sodium bicarbonate, 4
µM manganese(II) sulfate, and 0.5 M borate buffer was mixed. The reactions were
started by adding 25 µL of 30% hydrogen peroxide and monitored using the UV-Vis. For
every consecutive run, 20 µL of 50% hydrogen peroxide was added to a completed
reaction.
UV-Vis procedure to analyze the decomposition of hydrogen peroxide. The
reactions were analyzed at 264 nm (the shoulder from the hydrogen peroxide peak). At
this wavelength, 0.1 M hydrogen peroxide gives an absorbance just above one. An
absorbance of the reactions was taken every 16 seconds for most of the runs. For
reactions containing more than 10 µM manganese(II) sulfate, the absorbance was taken
every second. For the reactions containing 0.2 M ammonium bicarbonate or less, the
absorbance was taken every ten minutes.
Oxidation of guanosine monophosphate. First, 1.0 M hydrogen peroxide and
1.0 M ammonium bicarbonate were reacted together in 0.5 M ammonium phosphate
(buffered at pH 8.3) for 20 minutes to allow the formation of peroxymonocarbonate.
Then, 1.0 M guanosine monophosphate and 5 µM manganese(II) sulfate were added to
the reaction mixture. At room temperature, the reaction mixed for two hours. An aliquot
of the reaction was diluted a million fold; 20 µL of a diluted aliquot was injected into the
HPLC. For the second reaction, the same procedure was use with the exception of the
added metal to the reactions.10
46
Detection of guanosine monophosphate on the HPLC using an anion
exchange column. Separation of guanosine monophosphate and the oxidized products
were attempted using a strong anion exchange column. A binary pump system was used
to introduce the mobile phase, which consisted of solvent A (5mM ammonium
phosphate) and solvent B (750 mM ammonium phosphate) in a linear gradient, which
went from 100% A to 100% B, over a 30 minute period. Both solvents were buffered at
pH 4.0. The solvent was pumped at 1.0 mL/min and the reaction was monitored at 254
nm. Following the run, it took the column another 20 minutes to reequilibrate.10
Standard of guanosine and 8-oxoguanosine. Using the same HPLC method for
analyzing the oxidation of guanosine reactions, 1 mM guanosine mixed with in 0.5 M
ammonium phosphate buffer (pH 8.3). An aliquot of the reaction was diluted a thousand
fold; 20 µL of a diluted aliquot was injected into the HPLC. Using the same procedure
for obtaining the retention time for guanosine, retention time for 8-oxoguanosine was
found.24
Oxidation of guanosine. Similarly to the oxidation of guanosine monophosphate,
1.0 mM hydrogen peroxide and 1.0 mM ammonium bicarbonate were reacted together in
0.5 M ammonium phosphate buffer (pH 8.3) for 20 minutes. Then, 1.0 mM guanosine
and 5 µM manganese(II) sulfate were added to the reaction mixture. At room
temperature, the reaction mixed for either 10 or 30 minutes. An aliquot of the reaction
was diluted a thousand fold; 20 µL of a diluted aliquot was injected into the HPLC.
During the second set of reactions, hydrogen peroxide increased from 1 mM, up to 20
mM.
47
Analyzing the oxidation of guanosine on the HPLC using a C18 reversed
phase column. A procedure for separating guanosine and 8-oxoguanosine was found in a
paper published by Kino and Sugiyama. The procedure included a duel solvent system
using 50 mM ammonium formate buffer and acetonitrile as solvents A and B,
respectively. The HPLC procedure comprised 100% A from 0-5 min (isocratic), 100-
93% A for 5-27 min (linear gradient), and 93% A for 27-35 min (isocratic). The flow
rate was also one mL/min and the reactions were monitored at 254 nm. Each run took 45
minutes, followed by 20 minutes to allow the column to reequilibrate.24Oxidation of
histidine: A histidine standard was prepared by mixing 0.1 M histidine with 0.5 M
ammonium phosphate buffered (pH 8.3) in D2O. For the reactions, 2.0 M hydrogen
peroxide and 0.5 M ammonium bicarbonate in 0.5 M ammonium phosphate (buffered at
pH 8.3) were reacted together in D2O for 20 minutes. Then, 0.1 M histidine and 5 µM
manganese(II) sulfate were added to the reaction mixture. At room temperature, the
reaction mixed for twenty-four hours. Using 1H-NMR, the reaction and the histidine
standard were analyzed.10
Oxidation of alanine. An alanine standard was prepared by mixing 0.1 M alanine
with 0.5 M ammonium phosphate buffered (pH 8.3) in D2O. 0.1 M alanine was mixed
with 0.5 M ammonium phosphate buffered (pH 8.3) in D2O and either 0.5 M ammonium
bicarbonate, 2.0 M hydrogen peroxide, or 5 µM manganese(II) sulfate. For the reactions,
2.0 M hydrogen peroxide and 0.5 M ammonium bicarbonate in 0.5 M ammonium
phosphate (buffered at pH 8.3) were reacted together in D2O for 20 minutes. Then, 0.1 M
alanine and 5 µM manganese(II) sulfate were added to the reaction mixture. All of the
solutions were analyzed using 1H-NMR after twenty-four hours
48
Oxidation of leucine (phosphate buffered reactions). A leucine standard was
prepared by mixing 50 mM leucine with 0.5 M ammonium phosphate buffered (pH 8.3)
in D2O. For the reactions, 30 mM hydrogen peroxide and 23.5 mM ammonium
bicarbonate in 0.5 M ammonium phosphate (buffered at pH 8.3) were reacted together in
D2O for 20 minutes. Then, 50 mM leucine and 50 µM manganese(II) sulfate were added
to the reaction mixture. Open to the air, the reaction mixed for either two hours or
twenty-four hours at room temperature. Using 1H-NMR, the reaction and the leucine
standard were analyzed.
Oxidation of leucine (carbon dioxide / bicarbonate buffer). Berlett et al.
reported procedure was used for these reactions. Before a reaction, a tank was filled with
both carbon dioxide and nitrogen. The percent of carbon dioxide varied from 10%, up to
20%. In a closed container, 30 mM hydrogen peroxide and 23.5 mM ammonium
bicarbonate mixed in D2O for 10 minutes while bubbling the gas mixture through the
solution. Then, 50 mM leucine and 50 µM manganese(II) sulfate were added to the
reaction mixture. Bubbling continued until the gas tank was empty.2 After two hours at
room temperature, the reactions analyzed using 1H-NMR.
Decarboxylation of 4-methyl-2-oxovaleric acid. The standard of 4-methyl-2-
oxovaleric acid was obtained by mixing 50 mM 4-methyl-2-oxovaleric acid and 0.5 M
ammonium phosphate buffered (pH 8.3) in D2O. The standard of isovaleric acid was
obtained using the same method. The standard of sodium bicarbonate was obtained by
taking a 13C-NMR of a saturated solution of bicarbonate in D2O. In a NMR tube, 50 mM
4-methyl-2-oxovaleric acid and either 30mM or 60 mM hydrogen peroxide were mixed
and buffered in sodium phosphate at pH 8.3.
49
NMR Work. All of the 1H-NMR spectra were taken in D2O and referenced to the
residual solvent peak. The 13C-NMR of the decarboxylation was examined an hour after
the reaction was started.
LIST OF REFERENCES
1) Christian Schöneich Experimental Gerontology 1999, 34, 19-34.
2) B. S. Berlett; P. B. Chock; M. B. Yim; E. R. Stadtman Proceeding of the National Academy of Science of the United States of America 1990, 87, 389-393.
3) A. Ya. Sychev; Mai Hui Him; V. G. Isak Russian Journal of Physical Chemistry 1984, 58, 549-551.
4) Benjamin S. Lane; Matthew Vogt; Victoria J. DeRose; Kevin Burgess Journal of the American Chemical Society 2002, 124, 11946-11954.
5) Deon A. Bennett; Huirong Yao; David E. Richardson Inorganic Chemistry 2001, 40, 2996-3001.
6) Fang Zhao; Elena Ghezzo-Schöneich; Gagy I. Aced; Jinyang Hong; Terry Milby; Christian Schöneich The Journal of Biological Chemistry 1997, 272, 9019-9029.
7) Koji Uchida; Shundro Kawakishi Bioorganic Chemistry 1989, 17, 330-343.
8) Junichi Odo; Hanae Yamaguchi; Hirotaka Ohsaki; Noriyoshi Ohmura Chemical and Pharmaceutical Bulletin 2004, 52(2), 266-269.
9) A. Ya. Sychev; U. Pfannmeller; V. G. Isak Russian Journal of Physical Chemistry 1983, 57, 1024-1026.
10) C. A. S. Regino. Peroxymonocarbonate as a New Reactive Oxygen Species and Its Reactivity with Biomolecules. University of Florida Dissertation 2002, 91-107.
11) David E.Richardson; C. A. S. Regino; Huirong Yao; John A. Barranger Free Radicals in Biology and Medicine 2004, 35, 1538-1550.
12) D. Philip Jones; William P. Griffith Journal of the Chemical Society, Dalton Transaction 1980, 2526-2532.
13) David E. Richardson; Huirong Yao; Karen M.Frank; Deon A. Bennett Journal of the American Chemical Society 2000, 122, 1729-1739.
50
51
14) Huirong Yao; David E. Richardson Journal of the American Chemical Society 2000, 122, 3220-3221.
15) Huirong Yao; David E. Richardson Journal of the American Chemical Society 2003, 125, 6211-6221.
16) Deon A. Bennett. Kinetics and Mechanisms for the Oxidation of Organic Compounds by Bicarbonate-Activated Peroxide. University of Florida Dissertation 2002.
17) A. Ya. Sychev; V. G. Isak; Dao Van Lap Russian Journal of Physical Chemistry 1978, 52, 55-59.
18) A. Ya. Sychev; V. G. Isak; Dao Van Lap Russian Journal of Physical Chemistry 1977, 51, 212-214.
19) E.R.Stadtman; B.S.Berlett; P.B.Chock Proceeding of the National Academy of Science of the United States of America 1990, 87, 384-388.
20) M. B. Yim; B. S. Berlett; P. B. Chock; E. R. Stadtman Proceeding of the National Academy of Science of the United States of America 1990, 87, 394-398.
21) A. Ya. Sychev; U. Pfannmeller; V. G. Isak Russian Journal of Physical Chemistry 1983, 57, 1197-1199.
22) V. G. Isak; U. Pfannmeller; A. Ya. Sychev Russian Journal of Physical Chemistry 1983, 57, 1193-1196.
23) S. Steenken; S. V. Jovanovic Journal of the American Chemical Society 1997, 119, 617-618.
24) K. Kino; H. Sugiyama Chemistry and Biology 2001, 8, 369-378.
25) C. J. Burrows; J. G. Muller Chemical Review 1998, 98, 1109-1151.
26) K. Uchida; S. Kawahishi Federation of European Biochemical Societies letters 1993, 332, 208-210.
27) Charles R. Maxwell; Dorothy C. Peterson Journal of the American Chemical Society 1957, 79, 5110-5117.
28) Helmut Sigel; Rolf Griesser; Donald B. McCormick Archives of Biochemistry and Biophysics 1969, 134, 217-227.
29) C. A. Bunton Nature 1949, 163, 444-444.
30) C. A. Bunton; E. S. Halberstadt; A. J. Everett; G. J. Minkoff Nature 1948, 161, 172-173.
52
31) Solange Desagher; Jacques Glowinski; Joël Prémont The Journal of Neuroscience 1997, 17, 9060-9067.
32) Karl A. Nath; Emily O. Ngo; Bing Zhou; Louise M. Nutter American Journal of Physiology 1995, 268, C227-C236.
33) George Constantopoulos; John A. Barranger Analytical Biochemistry 1984, 139, 353-358.
a. Yuzo Nishida; Sayo Ito Journal of the Chemical Society, Chemical Communication 1995, 12, 1211-1212.
b. Earl R. Stadtman; Barbara S. Berlett The Journal of Biological Chemistry 1991, 266, 17201-17211.
BIOGRAPHICAL SKETCH
Michael Stanley Mitchell was born on the 26th of September in the year 1979. He
grew up in Gurnee, IL, with his parents, Larry and Linda Mitchell, and two siblings, Greg
and Cathy Mitchell. While attending Warren Township High School, he was part of the
Science Olympian Team. He competed in many fields, one of which was chemistry.
After high school, he moved to Peoria, IL. There, he attended Bradley University
and became interested in both chemistry and biochemistry. He worked on two different
projects. One project studied P450, and the second was synthesizing different organic
molecules. He received a B.S. in both biochemistry and chemistry.
While in Peoria, he worked at the United States Agricultural Laboratory. He was a
technician in the polymer labs. One project attempted to make a biodegradable using
starch.
Following undergraduate, he moved to Gainesville, FL, and went to the University
of Florida. He obtained his master’s while working for David Richardson. He studied the
oxidation of biological molecules.
53
Recommended