Ownership Structure and Tax Avoidance:
Evidence from Agency Costs of State Ownership in China
Mark Bradshaw *
Carroll School of Management
Boston College
Guanmin Liao
School of Accountancy
Central University of Finance and Economics
Mark (Shuai) Ma
Kogod School of Business
American University
Current Version : 11/10/2014
*Corresponding coauthor We thank Jeff Cohen, Carol Ann Frost, Pingyang Gao, Feng Gu, Alison Koester, Zining Li, Weihong Xu,
and participants at Boston University, Georgetown, INSEAD, Peking University, Renmin University of
China, Southern Methodist University, SUNY at Buffalo, the AAA 2012 Annual Conference, the 2012
Tel Aviv University Accounting Research Conference, the Sixth Annual University of Toronto
Accounting Conference, and the 11th International Symposium on Empirical Accounting Research in
China. Liao acknowledges financial support from the National Natural Science Foundation of China,
Grant # 70902001 and #71272233.
Ownership Structure and Tax Avoidance:
Evidence from Agency Costs of State Ownership in China
Abstract: Prior research argues that tax avoidance is beneficial to shareholders. In state owned
enterprises (SOEs), taxes are a dividend to the controlling shareholder, the state, but a cost to
other shareholders. Therefore, the controlling shareholder of the SOE benefits from less tax
avoidance by the SOE. Using a sample of publicly traded companies in China, we find that SOEs
exhibit significantly higher income tax rates than do non-SOEs, consistent with less tax
avoidance. These results are especially pronounced for local versus central SOEs and during the
year in which SOE managers face term performance evaluations. SOE tax rates are negatively
associated with stock returns, consistent with the transfer of wealth away from minority
shareholders through less tax avoidance. Overall, the findings suggest SOEs make tax decisions
favorable to the controlling shareholder but costly to the minority shareholders, and the state
utilizes SOE managers’ career concerns to promote the minimization of tax avoidance. The
findings contribute to our understanding of the impact of ownership structure on tax avoidance
and to the agency literature on tunneling mechanisms.
1
Ownership Structure and Tax Avoidance:
Evidence from Agency Costs of State Ownership in China
1. Introduction
Conventional wisdom argues that because taxes are a significant cost to a firm, tax
avoidance is beneficial to shareholders (e.g., Chen, Chen, Cheng and Shevlin 2010).1 However,
in state owned enterprises (SOEs), taxes are an implicit dividend to the controlling shareholder.2
Thus, less tax avoidance actually benefits the controlling shareholder of SOEs and reflects an
implicit expropriation of wealth from other shareholders. Further, due to restrictiveness of the
SOE executive labor market (discussed in detail later), managers face incentives to prioritize the
controlling shareholder’s interest and engage in less tax avoidance. Using a sample of publicly
traded firms in China, we investigate whether tax expense and cash taxes paid by SOEs are
consistent with such tunneling of resources to the controlling shareholder.
The well-established literature on agency conflicts (e.g., Jensen and Meckling 1976)
articulates the conflict of interest between managers and diffuse shareholders. In this literature,
managers’ career concerns can alleviate agency problems and enhance shareholder value (e.g.,
Fama 1980; Gibbons and Murphy 1992; Brickley, Coles and Linck 1999). However, controlling
shareholders can create a friction that alters managers’ incentives to maximize firm value,
focusing instead on decisions that benefit their careers. According to recent studies (e.g., Jiang et
al. 2010), large blockholders control a majority of international publicly traded firms, including
1 Following Hanlon and Heitzman (2010), we work under the definition that tax avoidance is any planning behavior
that reduces a firm’s tax burden. Tax avoidance does not imply illegal activities. 2 Cash dividends are not prevalent among Chinese companies during our sample period. Recently, the Shanghai
stock exchange has initiated incentives that encourage companies to increase dividend payout ratios (Reuters,
“China encourages companies to increase dividends,” August 15, 2012). The China Securities Regulatory
Commission has finalized a dividend payment policy disclosure and is rumored to be coordinating with other
government authorities to encourage dividends (Beijing Business Today, “CSRC has finalized plans to implement
mandatory dividend payment policy,” November 29, 2011).
2
most European and Asian firms. Because managers’ careers are subject to a greater degree of
control by these large shareholders, the managers’ career concerns become subject to the
objectives of the controlling shareholder, even though they may be anathema to minority
shareholders. This risk of controlling shareholder expropriation of minority shareholders is
referred to in the agency literature as “self-dealing” (Djankov et al. 2008) or “tunneling”
(Johnson et al. 2000).
As a result of Chinese economic reforms and strong growth since 1979, a large number of
SOEs are publicly traded on China’s stock exchanges, but most common shares owned by the
state were generally not allowed to trade prior to 2005.3 Therefore, the state historically did not
benefit from stock price appreciation. Combined with a weak institutional environment relative
to western markets (discussed later in Section 2.1), the state has incentives to derive benefits
through other channels, such as tunneling of resources from SOEs. Also, given distinct
differences between the labor markets for SOE and non-SOE managers, a SOE manager faces
rather limited non-SOE corporate opportunities (e.g., Li and Zhou 2005; Cao et al. 2010), further
aligning SOE managers’ career concerns with those of the state. Therefore, our first prediction is
that SOEs make tax decisions favorable to the state but costly to minority shareholders, captured
empirically by higher tax rates and cash tax payments for SOEs relative to non-SOEs.
Evidence regarding tax rates and payments of SOEs relative to non-SOEs is an
implication of the ownership structure of SOEs. For SOEs, however, such evidence should
reflect, among other factors, SOE managers’ incentives and career concerns to the extent they are
3 In July 2005, the Chinese government announced an initiative to convert non-tradable shares to tradable, which
took several years to implement. However, the Chinese government maintains a policy of retaining control of many
SOEs. Thus, even after 2005, state owned shares do not actively trade. As discussed later, currently less than half of
the aggregate shares of such firms are allowed to trade.
3
linked to tax decisions.4 In China, the assignment of managers in SOEs is controlled by the state.
As Li (1998) points out, most SOE managers have bureaucratic titles. For example, managers of
large state owned energy firms have bureaucratic titles equivalent to the Secretary of Commerce
in China. SOE managers face ongoing evaluations for political promotions, which provide
further incentives for SOE managers to cater to the controlling shareholder (Li and Zhou 2005;
Cao et al. 2010). In these evaluations, managers are promoted to higher bureaucratic ranks if
evaluated favorably; otherwise, they are retained in their current position or assigned to similar
or lower level political positions. Thus, our second prediction is that political promotions of SOE
managers are associated with lower tax avoidance.
Using a sample of 2,054 Chinese firms for the years 1999-2012, we compare tax
avoidance by SOEs and non-SOEs. Consistent with our first prediction, SOEs exhibit less tax
avoidance than do non-SOEs, captured by higher effective and cash tax rates. The differences in
both effective and cash tax rates between SOEs and non-SOEs are approximately 1%, after
controlling for other variables, which strikes us as economically large. For example, SOEs in our
sample realized total pre-tax profits of approximately RMB 6.2 trillion, implying that the SOEs
incurred excess taxes of approximately RMB 62 billion (USD 10 billion) relative to that of their
non-SOE counterparts. With regards to our second prediction, we find the probability an SOE
manager is promoted to a higher level bureaucratic position is positively associated with the
income taxes of the SOE they manage. Overall, these findings are consistent with SOE managers
making tax decisions favorable to the state but costly to minority shareholders, and the state
4 The nature of monitoring within Chinese SOEs is likely to differ from that of non-SOEs, and is likely a major
determinant of the level of incentives faced by managers.
4
rewarding the SOE managers in the form of political promotions.5 The results are robust to
controlling for a number of factors and several other tests (described below).
SOE managers’ employment contracts always have a three-year term (SASAC 2003).
Thus, in addition to routine annual performance evaluations, SOE managers receive a term-
evaluation every three years (see SASAC 2003). Prior studies argue that managers tend to be
myopic (e.g. Bhojraj and Libby 2005); if descriptive of our sample managers, SOE managers
will have heightened concern about a term-evaluation and its implication for their career in the
third year relative to the first two years of the term-evaluation cycle. Therefore, we corroborate
our primary findings by investigating whether SOE managers report higher taxes in the specific
year of term-evaluations (i.e., the third year of the three year term). Indeed, we find that
differences in effective and cash tax rates between SOEs and non-SOEs are highest in the year of
term-evaluations, further supporting our predicted link between political promotion incentives
and SOE manager’s tax decisions.
Relative to the central government in Beijing, local governments can more easily
intervene in the operations of SOEs and are less likely to be prosecuted for misconduct or
misappropriation of state funds (e.g., Wang et al. 2008; Cheung et al. 2008). Thus, we also test
whether our findings differ across local versus central state government control.6 We find that
the difference between SOE and non-SOE tax rates is higher for local government controlled
5 We are cognizant that there are likely incentives in addition to lower tax avoidance that are associated with
promotions, so do not imply that tax payments are the preeminent focal point of managerial incentives.
Nevertheless, anecdotal evidence is consistent with SOEs proudly highlighting the amount of taxes paid by their
firm. For example, see Yangtze River Pharmaceutical Group’s (YRPG) ‘Company News’ website, which discussed
their tax payments as follows: “YRPG ranked 27th
among Top 100, and 1st place in pharmaceutical industry. This
indicated that YRPG has made more contribution to country and society.” Source:
http://www.yangzijiang.com/en/gsnews_detail.aspx?id=2586. 6 Local governments are those provincial, city, or county governments, whereas central state government refers to
the capital government in Beijing.
5
SOEs. The more pronounced effects for local SOEs reinforce the existence of a direct link
between ownership and tax reporting incentives of SOE managers.
To better identify the direction of causality and control for potential self-selection
problems, we provide several other tests. First, we perform tests based on the treatment effect
model (e.g., Maddala 1983; Li and Prabhala 2006) to mitigate concerns about self-selection. The
treatment effect model relies on two exogenous shocks from the split share reform and decisions
by the Central Committee of the Communist Party of China. Specifically, these exogenous
shocks reduce the state ownership in certain unregulated industries, while the state still controls
the ownership of regulated industries which are “the economic lifeline of a country” (Central
Committee of the Communist Party of China, 2003). After controlling for the hazard ratio of
self-selection, we find SOEs still have significantly higher tax rates than do non-SOEs. Second,
we provide difference-in-difference tests by using a matched sample of privatized SOEs and
non-SOEs. We find that privatized SOEs have higher tax rates than do non-SOEs prior to
privatizations, but the difference disappears after privatizations. This is consistent with state
ownership leading to higher tax rates. Third, our results are also robust to using one-to-one
propensity score matched samples.
We provide several additional tests to further validate our arguments. First, we examine
the stock return effect of tax avoidance. Our study is motivated from the agency literature.
However, an alternative interpretation of our results is that SOEs benefit from paying higher
taxes to the state, which would offset any wealth expropriation of minority shareholders’ through
the tunneling of resources via tax payments. For example, the state might steer lucrative
contracts towards the firm, arrange favorable financing, or grant other benefits not available to
other firms. To examine whether SOEs’ tax decisions are costly to minority shareholders, we
6
examine the association between tax rates and long-window stock returns and government grants.
We find a negative association between unexpected tax rates and abnormal stock returns,
consistent with the joint observations that investors are aware of tunneling through taxes but that
this does not translate into benefits to minority shareholders, who are primarily rewarded from
their investments through stock price appreciation. Further, we also find no relation between tax
rates and governmental grants, inconsistent with SOEs accruing other state-directed benefits in
exchange for less tax avoidance.
Second, we consider tax haven operations as an alternative measure of tax avoidance.
Chinese companies usually establish tax haven operations through merger and acquisitions
(M&As). Therefore, we test whether state ownership affects the likelihood of activities in tax
havens. Probit regressions show that SOEs are less likely to have M&As in tax havens than non-
SOEs. This is consistent with our argument that SOEs are less aggressive with tax avoidance
activities.
Third, we test whether the effect of state ownership is mitigated when the SOEs are
experiencing financial difficulties. Specifically, we split the sample based on the bankruptcy risk
(measured based on Ohlson (1990)’s bankruptcy risk model). We find our results are mitigated
for firms with high bankruptcy risk and poor financial health. This finding suggests that due to
the state’s incentive to save SOEs from bankruptcy and maintain economic growth, the state
reduces the tunneling of resources out of the SOEs.
Our study is motivated by and contributes to three streams of literature. First, we
contribute to the corporate tax literature, which provides few tests on the role of organizational
factors, such as ownership structure, in determining a firm’s tax reporting behavior. Shackelford
and Shevlin (2001) call for more empirical analysis in this important area. Similarly, Hanlon and
7
Heitzman (2010) also call for more studies on the determinants on tax avoidance and Dyreng et
al. (2010) advocate more research on how managers’ careers are affected by their tax avoidance
behavior. Second, we contribute to our understanding of the relation between tax avoidance and
firms’ agency conflicts, especially between controlling and minority shareholders (Scholes et al.
2005; Desai and Dharmapala 2004, 2006; Desai, Dyck, and Zingales 2007). Finally, we
contribute to the internationally focused agency and tunneling literature. In addition, our study
also has implications our study for the US market and other international markets. During the
recent financial crisis, the U.S. federal government actually provided tax benefits to companies
that the state temporarily take control over. For example, General Motor (i.e., GM) is exempted
from the application of Sec. 382 of the tax code. The US federal government’s decisions are
partially due to their political concerns.7
During the recent crisis, the US government has the
urgent need to save the US economy. Therefore, the state provides some special benefits to help
GM and other troubled companies. Consistent with this idea, we find the effect of state
ownership on tax avoidance is mitigated when the SOEs face high bankruptcy risk. However, our
findings imply that if the state still holds the ownership of GM after the financial difficulties, the
state ownership may result in significant agency costs to other investors.
The study proceeds as follows. The next section discusses key institutional features of the
Chinese market, reviews relevant literature, and provides formal hypotheses. Section 3 describes
the data. We identify the research design and model specification and present our primary
findings in Section 4. Section 5 provides alternative analyses, and section 6 concludes.
7 Ramseyer and Rasmussen (2011) suggest US government used the special tax benefit to help one of GM's
stakeholders, UAW, which is a loyal political supporter of the current government. Ramseyer and Rasmussen (2011)
also suggest that in a similar situation, the UK government didn't do the same thing as the US government did.
8
2. Prior Literature and Formal Hypotheses
2.1 Prior research
2.1.1 Brief Institutional Background on the Chinese SOE Market
Before 1979, the entire Chinese economy was controlled exclusively by the government.
All enterprises were owned by the state and operated as if they were production units of a single
giant firm (i.e., the Chinese economy). No Chinese firms had autonomy to make production or
marketing decisions. Rather, production plans and prices were set by the state, as were all profits.
Managerial compensation was not tied to financial performance, but depended on a firm’s size,
the managers’ seniority, and whether the firm met specific directives from the state. Thus,
managers had little incentive to improve firm performance, which had almost no effect on their
personal wealth or status (Groves et al. 1995).
Economic development was initiated by a series of SOE reforms in 1979. The first stage,
spanning from 1979 to 1983, emphasized improved financial performance of SOEs, and the state
allowed SOEs to retain a small portion (e.g., 3%) of profits. This reform granted some level of
autonomy to SOE managers, and a labor market for managerial human capital emerged. The
second stage spanned 1983 to 1992, and China established a “Management Responsibility
Contract System” (MRCS), which instituted contracts to give SOE managers more autonomy (Su
2005). For example, SOE managers were empowered to make certain decisions about production,
investment, and marketing. In the third stage of SOE reforms (from 1993 to the present), the
performance of SOEs has improved through several efforts. In the early 1990s, the state set up a
“partial privatization” initiative, which included the sale of a minority ownership in SOEs to
private investors at two major stock exchanges in China - Shanghai (in 1990) and Shenzhen (in
1991). By the end of 2012, these two exchanges represent more than 2,000 publicly listed firms
9
with a total market capital of RMB 23 trillion. Most common shares owned by the state were
classified as non-tradable prior to 2005. However, in July 2005 the Chinese government
announced an initiative to convert theses non-tradable shares into tradable shares, which took
several years to implement.
Even with the trajectory of these economic reforms, due to weak enforcement and other
implementation issues, the reforms do not seem to have solved the risk of controlling shareholder
expropriation of minority shareholders (Jiang et al. 2010). Further, the government has a policy
of retaining controlling interest in SOEs.8 Thus, even after the rollover of non-tradable shares to
tradable in 2005, the state cannot actively trade its shares or benefit from stock price
appreciation. Consequently, the state has a strong incentive to derive immediate monetary
benefits through other channels, including tunneling of resources from SOEs. The weak legal
and financial reporting environment in China further provides the state with additional
opportunities to extract benefits.9
2.1.2 Agency Problems, Controlling Shareholders and Tunneling
The early literature on agency theory focused on the U.S. market, where the central
conflict is between managers and disperse, atomistic shareholders. However, in international
markets most firms are controlled by large block shareholders. In this case, the primary agency
risk is the expropriation of minority shareholders by controlling shareholders (e.g., Jiang et al.,
2010). Indeed, recent research in this area has increasingly focused on the Type II agency
8 During our sample period, the state ceded control of only 164 firms.
9 For example, MacNeil (2002) notes that the state always enjoys priorities in Chinese courts. Similarly, Piotroski
and Wong (2011) discuss the institutional links in China that explain the current lack of transparency in their
securities markets.
10
problem - the risk of controlling shareholder expropriation of minority investors (i.e., ‘tunneling’
as discussed Johnson et al. 2000 or ‘self-dealing’ as discussed in Djankov et al. 2008).
Grossman and Hart (1988), Hart (1995) and Zingales (1994) are among the earliest
studies on the private benefits of control, which is defined as “benefits the current management
or the acquirer obtain for themselves, but which the target security holders do not obtain.” For
example, Zingales (1994) examines the Italian market and estimates the private benefits of
control to be 60 percent of the value of nonvoting equity. More recent studies reinforce that
controlling ownership decreases firm value (e.g., Bae et al. 2002; Bertrand, Mehta, and
Mullainanthan 2002; Faccio et al. 2001; Lemmon and Lin 2003). Cheung et al. (2006) provide
evidence on controlling shareholders’ tunneling through related party transactions, whereby
controlling shareholders use related party transactions to both prop up earnings for their firms
and transfer resources from public firms to related parties. Further, Jiang et al. (2010) provide
evidence on controlling shareholders’ tunneling in China through inter-corporate loans, which
approximate tens of billions (RMB) during 1996 to 2006.
2.1.3 Tax Reporting in an Agency Context
Although tax planning is important for shareholders, studies on the determinants of tax
avoidance are surprisingly limited (Hanlon and Heitzman 2010). Shackelford and Shevlin (2001)
call for a better understanding of the relations among ownership structure, agency conflict and
tax reporting. Chen et al. (2010) take “a first step toward a better understanding of the impact of
ownership structure on firms’ tax reporting practices” by examining tax avoidance in family
firms. They find that family-owned public firms engage in less aggressive tax reporting behavior
than do non-family firms, arguing that family owners relinquish tax benefits to avoid possible
reputation damage from a tax audit and/or any associated price protection imposed by minority
11
shareholders’ to offset family entrenchment. Chen et al. (2010) is the only other study of which
we are aware that directly examines the impact of ownership structure on tax reporting.
2.1.4 State Ownership and Managerial Incentive to Tax Avoidance
State owned enterprises are characterized as having worse financial performance than
non-state owned firms, and privatization improves firm financial performance (e.g., Boubakri
and Cosset 1998; D'Souza and Megginson 1999; Djankov and Murrell 2002; Sun and Tong
2003). A number of theories attribute the noted inefficiency of state ownership to managers’
weak incentives to maximize profits (e.g., Shleifer and Vishny 1994; Boycko et al. 1996). For
example, Shleifer and Vishny (1994) argue that bureaucrats are the ultimate controllers of SOEs,
and bureaucrats' major objective is to achieve political objectives rather profit maximization. To
address their own political goals, bureaucrats provide incentives for managers to achieve those
political objectives (Cragg and Dyck 2003). However, empirical evidence on how bureaucrats
use SOE managers’ career concerns to address their own political goals is limited.
Bureaucrats’ control over SOE managers’ careers can further affect the SOEs’ tax
reporting, because managers can individually affect corporate tax avoidance behavior. Dyreng et
al. (2010) demonstrate that, in addition to the effects of firm characteristics on tax avoidance,
individual managers contribute their own preferences towards tax avoidance. They examine
executive mobility across different firms and show a strong manager-specific effect in the
explanation of tax avoidance. The combined but limited evidence of an ownership and individual
manager effect on firm-level tax avoidance motivates our predictions that SOEs in China exhibit
lower tax avoidance and that individual managers associated with lower tax avoidance receive
favorable promotions.
12
2.2 Formal Hypotheses
Traditionally, taxes are a large cost to a firm and its shareholders, making tax planning an
important part of a manager’s job (e.g., Chen et al. 2010). In SOEs, however, taxes represent a
dividend to the controlling shareholder - the state - but a cost to minority shareholders. Thus, the
controlling shareholder benefits from higher effective tax rates. Corporate tax collections are the
major source of monetary resources for the state, making it a primary political objective as well.
Together, these features of the Chinese SOE market and the tunneling hypothesis suggest that
SOE managers make tax decisions favorable to the state. We measure the impact of tax decisions
made by SOE managers using effective tax rates and cash payments for taxes. Our first
hypothesis is as follows (in alternative form):
H1: SOEs exhibit higher effective tax rates and cash tax payments than do non-SOEs.
Prior literature argues that bureaucrats provide incentives for managers to achieve
political objectives (Cragg and Dyck 2003), and individual managers can have impacts on
corporate tax avoidance (Dyreng et al. 2010). Therefore, it is reasonable to expect a link between
management incentives and SOE tax reporting behavior. One way in which managers’ incentives
can be examined is to associate tax rates with promotions. During our sample period, SOE
managers maintain the clearest decision rights with respect to operations; the state maintains
ultimate control over the personnel charged with managing SOEs. Li (1998) observes that most
SOE managers have bureaucratic titles. SOE managers also receive ongoing evaluations for
political promotions, and prior research suggests that such political promotions are effective
incentives for SOE managers (Li and Zhou 2005; Cao et al. 2010). Because such evaluations are
overseen by bureaucrats, SOE managers will be inclined to focus on objectives that best serve
13
those of the bureaucrats. In these evaluations, SOE managers are assigned to similar or even
lower level political positions if bureaucrats are unsatisfied with the performance of the SOE
managers. Also, importantly, factors other than financial performance play an important role in
determining the evaluation outcomes (Du et al. 2012).
These features of the SOE labor market and the evaluation system suggest that SOE
managers will very likely respond to the political objectives of bureaucrats, which must include
the collection of higher taxes by the state. We adopt an outcome-based approach to examining
this link by examining whether tax rates are associated with political promotions, and restrict our
analysis to the subsample of only SOE firms. Our second hypothesis (in alternative form) is:
H2: The probability that an SOE manager is promoted to a higher level position is
positively associated to the SOE’s tax rates.
3. Sample, Tax Rate Measures, and Descriptive Statistics
3.1 Sample
We first obtain financial data for all the listed Chinese firms (excluding financial
institutions) during 1999 to 2012 (n=20,376). Data are taken from the China Stock Market and
Accounting Research (CSMAR) database (for financial accounting information, ownership and
corporate governance information), Center for Chinese Economic Research (CCER) database
(for industry classification), and WIND database (for information about income taxes).10
We then
manually search annual financial and other reports for SOE firms and collect information on the
CEOs,11
including age, CEO appointment date, departure date, and information about political
10
These three databases are widely used in prior literature on the Chinese market (e.g., Wang et al. 2008, Jiang et al.
2010 and Li and Zhou 2005). Details are in the appendix. 11
CEOs are responsible for most operating and financial decisions in China. For example, in an interview, a CFO
from a public Chinese firm (Name :JiangSuYueDa, Stock trading code: 600805) said Chinese CEOs make most
decisions, and other executives (such as CFOs) generally follow the decisions made by CEOs.
14
appointments.12
As shown in Panel A of Table 1,we remove firm-year observations without valid
data for the current effective tax rates (n=3,049). 655 observations with ambiguous or missing
ownership information are deleted.13
We also delete 270 observations with insufficient data for
market value of equity, lagged net income or other variables. Finally, using current effective tax
rate as the tax avoidance measure, our sample for testing H1 consists of 16,402 observations
(2,054 unique firms). For the tests using cash effect tax rates, the sample is 15,769, after
removing 606 observations with no cash tax expense data. For the test of promotions (H2), we
initially have a sample of 11,130 firm-years, but remove 2,583 observations with CEO tenure
shorter than one year or missing information about CEO tenure, 1,544 observations for which
CEOs leave the positions because of health problems, legal problems, retirement, demotions or
ambiguous reasons, and 2 observations missing information about other control variables.14
The
final sample for the test of H2 is 7,001 observations, when the current effective tax rate is
employed as tax avoidance measure. The sample is 6,753 observations for tests using cash
effective tax rates.
Table 1 further reports the sample composition. The 16,402 firm-years reflect 2,054
unique firms. We identify a firm as a SOE if its ultimate controller is the state (Faccio and Lang,
2002).15
Over 67% of the firms that comprise our sample are SOEs (Panel B). Among SOEs,
12
In addition to corporate financial reports, we manually collect information from media announcements about SOE
promotions, and we also use other search engines and databases (i.e., Google; Baidu and Sina Finance) to identify
other manager characteristics. 13
Ambiguous ownership refers to scenarios where it is not clear whether the firm is state owned or not, such as
collective enterprises. 14 For these observations, it is not clear whether the tax decisions are made by the prior manager or the replacement.
In primary tests, we delete 769 observations for which we cannot clearly determine whether the departure is a
promotion, a demotion or other outcome. In untabulated tests, we set PROMOTION to 0 for these 769 observations,
with no change in our reported results. 15
The controlling owner controls an absolute majority (i.e., over 50%) of voting rights, or holds enough voting
rights to have de facto control. According to Chinese regulations, de facto control occurs under four conditions:1) a
person or legal entity directly controls an absolute majority (i.e., over 50%) of voting rights; 2) a person or legal
entity owns, directly or indirectly, more than 30% of voting rights and no other shareholders own a higher
15
approximately 72% are controlled by local governments, rather than the central state government.
Panel C of Table 1 tabulates the industry distribution. Consistent with prior literature (e.g., Wang
et al. 2008), there are more SOEs than non-SOEs in most industries except furniture and other
manufacturing. Not surprisingly, the distribution of SOEs across industries indicates extremely
high state ownership in several crucial industries, such as mining (92%), energy supply (95%),
and transportation (91%). Panel D shows summary data for managers’ political promotion
evaluations. During the sample period, there are 1,735 departing SOE managers, with 11% of
those departing being promoted to higher level positions. In our primary tests, we delete CEOs
who leave their positions due to health problems, legal problems, retirement and other
ambiguous reasons.
3.2 Tax Rate Measures
Based on prior literature, we use two measures of income tax rates: the current effective
tax rate and the cash effective tax rate.16,17
During most years of our sample period (through
2007), Chinese accounting standards permitted companies to use either the tax payment method
(i.e., payable basis) or tax provision method (i.e., deferral basis) to account for income taxes.18
percentage directly or indirectly; 3) a person or legal entity can determine the assignments of more than a half of
directors; 4) a person or legal entity has enough voting rights to influence the company's important operating
decisions. 16
The tax avoidance literature also uses other measures of tax burden. However, the validity of these other measures
is not clear in the Chinese market. For example, Chinese firms are characterized by earnings manipulation (e.g.,
Piotroski and Wong, 2011), so alternative book-tax difference measures might be dominated by earnings
manipulation, clouding our ability to compare SOEs and non-SOEs along our dimension of interest (See Hanlon and
Heitzman, 2010 for details). 17
Prior to 2002, all the income tax revenues of central SOEs belonged to the central government, and the tax
revenues of local SOEs belonged to local governments (the State Council, 1993). From 2002, the corporate income
tax revenues of the SOEs are generally divided to the central and local governments proportionally. Specifically, in
the year of 2002, the central government received 50% of the tax revenues, and the local governments got the other
50% (the State Council, 2001). After 2002, the central government collects 60% of the tax revenues, and the
remaining 40% belongs to the local government (the State Council, 2003). Therefore, we did not decompose the tax
expense into local vs. central taxes. 18
After 2007, companies are prohibited from using the tax payment method.
16
Under the tax payment method, reported income tax expense only includes current tax expense
(i.e., deferred tax expense is not recorded); under the tax provision method, reported income tax
expense includes both current and deferred tax expense. Over 90% of public companies choose
the tax payment method before 2007, so we do not separately examine tax deferral strategies
from tax avoidance due to data limitation.
First, we employ the current effective tax rate (ETR) to measure tax avoidance:
ETR i,t = Total Current Income Tax Expense i,t / Pretax Income i,t
The second measure is the cash effective tax rate (CETRi,t):
CETR i,t = Cash Income Taxes Paid i,t / Pretax Income i,t.
We winsorize both measures at 1 to combat any small denominator problems and negative values
are set to 0 (Dyreng et al. 2010). 19
Consistent with prior research, a lower (higher) ETR or CETR
is associated with more (less) tax avoidance.20
3.3 Descriptive Statistics
We partition the sample into two groups: SOEs and non-SOEs. Our analyses start with
univariate analyses of tax rates across the sample period. We calculate the mean value of ETR
and CETR separately in each year for SOEs and non-SOEs. As shown in Figure 1, for both ETR
and CETR, SOEs exhibit higher tax rates across all sample years relative to non-SOEs, although
there is variation in tax rates across years for both SOEs and non-SOEs. These descriptive results
are consistent with the first hypothesis that SOEs have greater tax rates than do non-SOEs.
19
Observations with negative pretax income and non-zero tax expenses are deleted, because tax rates are not
meaningful to these observations. 20
Due to non-disclosure of cash taxes paid for most of our sample years, we calculate cash income taxes paid as
current tax expense plus beginning-of-year taxes payable minus end-of-year taxes payable. Hanlon and Heitzman
(2010) explain that CETR may have a mismatch problem if fiscal (numerator) and calendar (denominator) year-ends
are different. All Chinese firms have calendar fiscal year-ends, so our data are not susceptible to this problem.
17
Table 2 presents univariate statistics of the two tax expense measures for the entire
sample period, as well as the correlation matrix. Panel A reports the means and medians of tax
expense measures, separately for SOEs and non-SOEs. The univariate evidence is consistent
with SOEs exhibiting higher tax rates than those of non-SOEs. For example. mian ETR is 0.222
for SOEs , higher than 0.210 for non-SOEs. These differences are nominally larger than those
reported by Chen et al. (2011) for family-owned firms relative to other firms. Panel B shows that
these results are driven by locally-owned SOEs. Panel B indicates that local SOEs exhibit
significantly higher tax rates than do central SOEs, with differences significant at the 0.01 level
in all cases. For example, the mean ETR for local SOEs (0.228) is higher than the mean ETR for
central SOEs (0.207), the difference significantly different from zero (t-statistic= –5.475). This
result is consistent with local governments having stronger influence over SOEs, echoing results
in Wang et al. (2008). Panel C shows the probability of promotion for SOE managers across
quintiles of tax rates. As tax rates increase, the probability of promotion also increases. The
pattern is nonlinear in the last two quintiles, probably because of noise introduced by the
winsorization of firms with small denominator problems.
Table 3 provides descriptive characteristics and correlations for other variables. SOEs are
more profitable, larger, less leveraged and more capital intensive than non-SOEs, but SOEs have
lower market to book ratio. These results are consistent with prior studies (e.g., Wang et al.,
2008). Panel B reports correlations among control variables. Among other variables, ROA and
LEV exhibit the largest correlation (–0.373), not large enough to suggest significant problems
with multicollinearity. We checked VIFs for all regressions, and no VIFs exceed 10. In addition,
untabluated results show that the effective tax rate and cash tax rate are, not surprisingly, highly
positively correlated with each other (0.701).
18
4. Multivariate Tests and Primary Empirical Results
4.1 Multivariate Tests
We first investigate the effect of state ownership on firms’ tax rates. The first hypothesis
predicts that tax rates of SOEs are higher than those of non-SOEs. To test the first hypothesis, we
estimate the following OLS regression, where SOE is an indicator variable equal to one if the
firm is state owned (see the Appendix for other variable definitions). In model (1), there are two
alternative dependent variables: ETR or CETR. We predict α1 will be positive, consistent with
less tax avoidance by SOEs.
tsFixedEffecGDPGrowαeferenceTaxαDualCEOαMgmtOwnα
OwnConcenαCrossListαEquOfferαAMαForeSaleαRDα
NOLαCAPEXαLevαROAαMBSizeαSOEααCETR
ETR
i,t
i,t
i,ti,t6i,t5i,t4i,t3i,t2i,t10
ti
ti
17161514
1312111098
7
,
,
Pr
&
(1)
We control for factors previously identified in the literature that may affect tax avoidance
(e.g., Manzon and Plesko, 2002; Mills, 1998; Rego, 2003; Dyreng et al., 2008; Frank et al., 2009;
Armstrong et al. 2012; Rego and Wilson 2012; Hope et al., 2013). Several control variables (Size,
ROA, Lev and NOL) capture tax planning incentives and opportunities. Because larger firms
enjoy economies of scale in tax avoidance behavior, we control for firm size (Size), measured as
the natural log of the total assets (Cheng et al. 2012). Similarly, we include ROA to capture
profitability, because more profitable firms have stronger incentives to avoid taxes (Manzon and
Plesko, 2002; Rego 2003; Frank et al. 2009; and McGuire et al. 2012).21
Leverage (Lev) is
included because firms with higher leverage already enjoy the tax shield benefit of debt
21
In contrast, Gupta and Newberry (1997) find a positive relation between ETRs and profitability. They argue that
higher income is associated with higher marginal tax rates, and therefore more profitable firms will exhibit higher
ETRs. However, the corporate income tax rate is not progressive in China. During our sample period, the income tax
rate for domestic corporations is a flat 33% (see article 3 in State Council of China, 1993).
19
financing, which may be associated with a differential tendency to engage in incremental tax
avoidance.22
We use a proxy for loss carryover (NOL) to capture whether firms can use the tax
benefits associated with the loss in the previous five year.23
We control for growth potential by
including market to book ratio (MB), as growth firms may make more investments in tax-favored
assets and have more opportunities to avoid taxes (e.g., Chen et al. 2010). We include a control
for capital expenditure CAPEX, since investment often related to book-tax differences resulted
from the investment tax credit and accelerated depreciation methods (Armstrong et al. 2012).
Similarly, we include R&D to control for tax credits and tax avoidance opportunities related to
research and development expense (e.g., Rego and Wilson 2012). The ratio of foreign sales to
total sales, ForeSale, is included to control for the effect of foreign operation (Rego 2003). M&A
is used to control for the merger and acquisition activities which could generate significant tax
benefits (e.g., Devos, Kadapakkam, and Krishnamurthy 2009). Seasoned equity offering
(EquOffer) is also controlled for, because firms may have incentives to avoid tax and increase
earnings around external financing. To control for other possible correlated variables, we include
OwnCon as a proxy for ownership concentration and other three proxies for corporate
governance: cross listing (CrossList), management ownership (MgmtOwn) and CEO-Chair
duality (DualCEO). TaxPreference is a dummy variable that set to one if a firm potentially
enjoys a preferential statutory tax rate. There are three major types of firms that potentially enjoy
a preferential tax rate. 24
First, according to Chinese financial regulations (e.g., MOF 1994, 1996,
1997), certain firms operating in specially designated economic and technology development
22
Article 6 of the tax law (State Council of China 1993) allows deduction of interest expense. 23
Chinese firms are allowed to carry losses forward for five years [firms are not allowed to carry backward (Ernst
&Young, 2006)]. But, Chinese firms do not report NOL (net loss carryover) on balance sheet. In the Chinese market,
firms do not provide data on carryover losses. So, we calculate a continuous variable, NOL, based on the net income
reported in the last five years. NOL= the accumulated pre-tax earnings/losses for the last five years; 0 if the
accumulated pre-tax earnings is positive for the last five year. 24
All of these tax deductions are available only after a firm receives approval from the state government.
20
zones are granted tax credits. Second, qualified enterprises with foreign direct investment
sometimes qualify for tax rate reductions of 0-15% in years following foreign direct investments.
Third, start-up firms can qualify for special deductions for certain start-up expenses. Finally, we
further include the growth rate of regional GDP (GDPGrow) to control for differences in
economic performance; industry and year indicator variables are included to control for possible
variation in tax policies across industries and years.
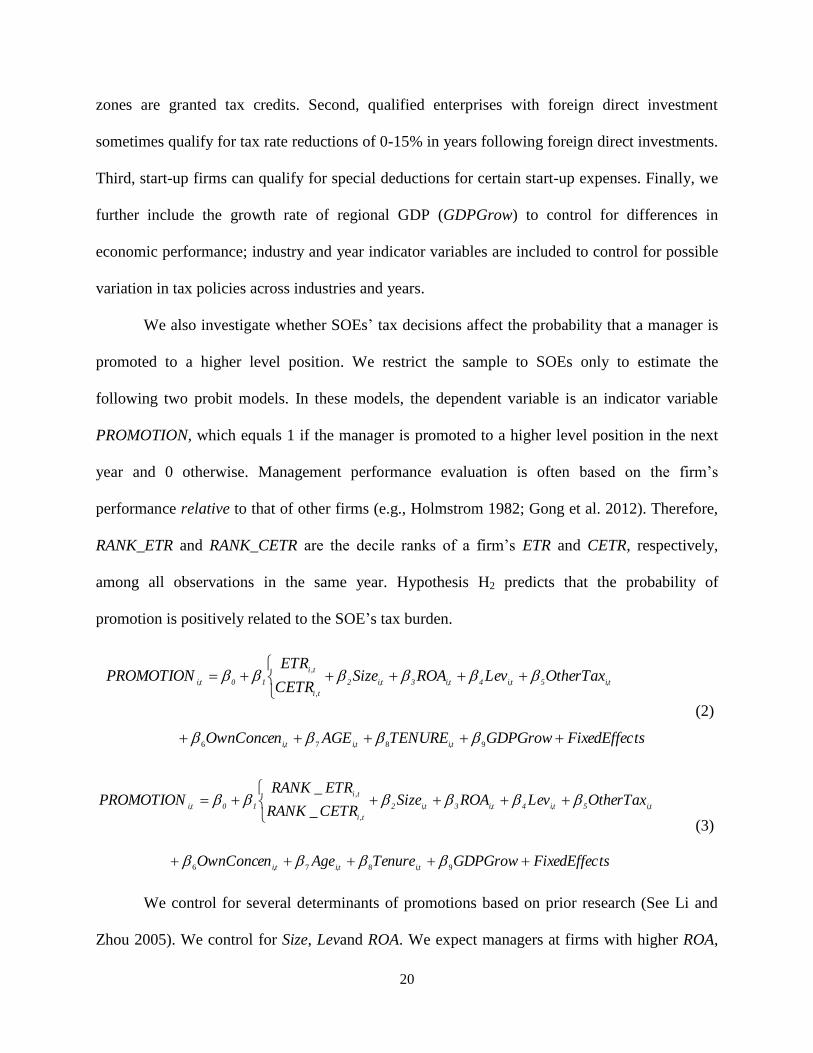
We also investigate whether SOEs’ tax decisions affect the probability that a manager is
promoted to a higher level position. We restrict the sample to SOEs only to estimate the
following two probit models. In these models, the dependent variable is an indicator variable
PROMOTION, which equals 1 if the manager is promoted to a higher level position in the next
year and 0 otherwise. Management performance evaluation is often based on the firm’s
performance relative to that of other firms (e.g., Holmstrom 1982; Gong et al. 2012). Therefore,
RANK_ETR and RANK_CETR are the decile ranks of a firm’s ETR and CETR, respectively,
among all observations in the same year. Hypothesis H2 predicts that the probability of
promotion is positively related to the SOE’s tax burden.
9876
,
,
tsFixedEffecGDPGrowTENUREAGEOwnConcen
OtherTaxLevROASizeCETR
ETRPROMOTION
i,ti,ti,t
i,t5i,t4i,t3i,t2
ti
ti
10i,t
(2)
_
_
9876
,
,
tsFixedEffecGDPGrowTenureAgeOwnConcen
OtherTaxLevROASizeCETRRANK
ETRRANKPROMOTION
i,ti,ti,t
i,t5i,t4i,t3i,t2
ti
ti
10i,t
(3)
We control for several determinants of promotions based on prior research (See Li and
Zhou 2005). We control for Size, Levand ROA. We expect managers at firms with higher ROA,
21
and larger SIZE are more likely to be promoted, but we do not have clear predictions for Lev. In
addition, we use OtherTax to control for other taxes or fees the firm pays to the government
exclusive of income taxes.25
Second, we control for CEO age (Age) and CEO tenure (Tenure), as
we suspect a manager is less likely to be promoted if older or having been at a firm for many
years. We also control for the proportion of ownership of the largest shareholder, which is the
state for SOEs, to capture the influence of ownership concentration (OwnConcen). We also
include of the growth rate of provincial GDP (GDPGrow) to control for differences in economic
performance across regions. Finally, we control for industry and year fixed effects.
4.2. Primary Empirical Results
4.2.1 State Ownership and Tax Avoidance
H1 predicts that income taxes of SOEs are higher than those of non-SOEs. SOE is an
indicator variable for state owned enterprises. If SOEs engage in less tax avoidance than do non-
SOEs, we expect a positive coefficient on SOE in model (1). Results appear in Panel A of Table
4, where t-statistics are based on standard errors clustered by firm. In Column 1 (2), we use ETR
(CETR) as the dependent variable. For both measures of tax rates, we find the coefficients on the
SOE variable are positive and significant, consistent with a tunneling hypothesis whereby SOEs
pay greater taxes than do non-SOEs. The differences in both effective tax rates and cash tax rates
between SOEs and non-SOEs are, on average, 1%. These results are economically sinioficant.
For example, SOEs realized total pre-tax profits of approximately RMB 7.1 trillion during our
sample period, implying that the SOEs incurred excess taxes of approximately RMB 71 billion
(USD 11.5 billion) relative to that of their non-SOE counterparts. In addition, coefficients on the
25
A large part of OtherTax reflects value-added taxes. Firms are not likely to avoid these taxes because of
prohibitively high legal costs; the highest penalty to value-added tax evasion is death. OtherTax is scaled by revenue
because other fees and taxes are usually a function of revenue.
22
control variables are generally consistent with prior research. Firms with higher profitability
(ROA), more capital expenditure (CAPEX), greater loss carryover (NOL), more R&D, equity
financing (EquOffer) and preferential statutory tax rate are associated with lower tax rates.
4.2.2 Local versus Central State Ownership
Our second analysis captures whether SOEs are controlled by the central or local
government. Local governments have stronger influence over SOEs than do central governments
(Wang et al. 2008), and local government officials are less likely to be prosecuted for
misconduct and misappropriation of state funds (Cheung et al. 2008). Therefore, if the effect of
state ownership on tax payments and the effect of tax payments on promotions (examined in the
next section) are caused by state intervention and misconduct, we expect that local governments
engage in more tunneling, and that local governments are more likely to use SOEs to fulfill
political goals. Thus, we predict that the difference in tax rates between SOEs and non-SOEs is
greater when the SOEs are controlled by local government rather than the central government.
To test this prediction, we construct two indicator variables: Central SOE and Local SOE.
A firm is categorized as a Central SOE if it is controlled by the central government in Beijing or
its agencies; a firm is categorized as a Local SOE if it is controlled by a local government. We
then re-estimate model (1) including these two indicator variables, and results appear in Panel B
of Table 4. For both columns in the table, we find that the coefficients on Local SOE are positive
and significant, but the coefficients on Central SOE are insignificant. For example, in the first
column, the coefficient on Local SOE is 0.014 (t-statistic=2.65), but the coefficient on the
Central SOE is 0.003 (t-statistic= 0.46). Thus, local state ownership of SOEs appears to be more
influential in discouraging tax avoidance than does ownership by the central government, and
seems to drive our primary results.
23
4.2.3 Probability of Manager Promotion
Next, we investigate whether SOEs’ tax decisions affect the probability that managers are
promoted to higher level positions. The second hypothesis predicts that the probability is
positively related to the level of taxes paid. Refer back to the univariate results in Panel C of
Table 2, which show the frequency of promotion across all quintiles of tax rates for SOEs.
Higher current tax rates and cash tax rates are generally associated with higher frequency of
promotion, consistent with expectations.
To formally test H2, we use all SOE observations to estimate models (2) and (3), and
results appear in Table 5. In columns 1 and 3 of Panel A, we use ETR and CETR, respectively, as
our measures of tax avoidance. In columns 2 and 4, the tax measures are RANK_ETR and
RANK_CETR, which are the decile ranks of a firm’ ETR or CETR among all the observations in
the same year. The results reported in Panel A are stronger for ETR than for CETR. For all the
four columns, we find that the coefficients on both ETR (CETR) and RANK_ETR (RANK_CETR)
are negative and significant at the 5% level.
In untabulated tests, we also examine whether the positive association between tax rates
and the probability that a manager is promoted differs across local and central governments. We
find the effects of tax rates on promotion are significant and similar for both central and local
SOEs. A caveat to this analysis however is that it is not uncommon for local SOE managers to be
promoted to positions in central SOEs; thus, the promotion evaluations for many local SOE
managers sometimes is linked to the central government. Therefore, we caution that, for the
analyses on the relation between taxes and promotion, it may be inappropriate to partition the
sample based on whether the SOE is a central SOE or a local SOE.
24
4.2.4 Effect of Term Evaluation
SOE managers’ employment contracts always have a three-year term. Based on evidence
that managers tend to be myopic (e.g., Bhojraj and Libby 2005), they may be more concerned
about term evaluation and their careers in the third year relative to the first two years. Therefore,
to further verify the argument that managers’ tax decisions are affected by their career concerns,
we test whether SOE managers make more tax decisions favorable to the state in the third year
relative to the first two years of their three-year terms. We spilt the sample based on whether or
not the manager is in the third year of the three-year term and re-estimate model (1) for each
subsample. We expect that the coefficient on SOE to be greater in the third year of SOE
managers’ terms relative to the first two years.
In Panel B of Table 5, we find the coefficient on ETR (or CETR) is significantly positive
in the third year, but not in the first two years.26
For example, when ETR is the dependent
variable, the coefficients on SOE are 0.008 (t-statistic=1.27) for the first two years but 0.023 (t-
statistic=2.61) for the third year. Z-statistic tests for differences in coefficients for the third year
relative to the other two are significant at the 5% level, one tail (Z-statistic=1.86 for ETR tests;
1.72 for CETR tests).The tabulated findings, however, are consistent with the expectation that
managers make tax decisions most favorable to the state in the year of term-evaluation.
5. Extensions
5.1 Exogenous Shocks in State Ownership and Treatment Effect Model Test
We performed tests based on the treatment effect model to mitigate concerns about self-
selection. Maddala (1983) extended Heckman’s (1979) sample selection model to evaluate the
26
For the ETR (CETR) tests in Panel B Table 5, we must delete 5,656 (5,426) observations due to an inability to
identify in which year of the three year evaluation cycle the observation falls.
25
effect of treatment effect. The treatment effect model is widely used in prior research to mitigate
the effects of non-random treatment assignment and self-selection biases (Guo and Fraser 2014;
Li and Prabhala 2006). The treatment effect model also uses a two-stage approach, where the
first stage is a prediction model with a dummy variable as the dependent variable for the
treatment condition. The second stage further includes the hazard ratio (e.g., Lambda estimated
from the first stage) to corrects the effect of self-selection bias. Therefore, the effect of treatment
estimated from the second stage is net of the effect of self-selection bias.27
Our first stage regression have five variables that are not included in the second stage
regression: 1) CPCMeeting, an indicator for the 3rd Plenary Session of the 16th China
Communist Party Central Committee meeting in 2003, which decided to lessen the state control
of public corporations (Central Committee of the Communist Party of China, 2003). Thus, the
proportion of state owned enterprises is expected to decrease after the meeting. 2)
SplitShareReform, an indicator for the split share structure reform (reform initiated in 2005),
which allows previously non-tradable state-owned shares to be tradable on the stock market (e.g.,
Liao et al., 2014).28
By 2007, most firms (representing 97% of the market capitalization at the
time) completed the reform ( Li et al., 2001). Thus, after 2007, the state could more freely sell
their shares on the public stock market, leading to a reduction in state ownership. 3) Regulated
Industries, an indicator for regulated industries which the state strategically retains the control of.
Even though the Communist Party decided to lessen control for public firms after 2003, the state
still has policies to control “the economic lifeline of a country” and “the important industries and
27 The treatment effect model (also known as Heckit models in Greene 2003) is different from the Heckman sample
selection model in two aspects: 1) the dummy variable indicating the treatment condition is also included in the
second stage of the treatment effect model; 2) the dependent variable of the stage second is available for
observations with treatments and those without treatments. 28
Prior to the reform, some state owned shares are not allowed to be traded on stock exchanges. However, before
the split share reform, the state ownership could be diluted by issuing extra shares.
26
key fields that have a bearing on national security” (Central Committee of the Communist Party
of China, 2003). 29
We expect state ownership to be higher in regulated industries. 4) The
interaction of Regulated Industries and CPCMeeting in 2003. We expected the effect of
CPCMeeting on state ownership to be mitigated by Regulated Industries, because the stat wants
to maintain the control for these. 5) the interaction of Regulated Industries and
SplitShareReform. Similarly, we expected the effect of SplitShareReform on state ownership to
be mitigated by Regulated Industries.
Importantly, to run reliable treatment effect mode, the first stage needs to have at least
one variable that is not related to the dependent variable in the second stage. The variables above
are based on government regulations, and we expect these government decisions to be made
exogenously by the government at the macro-economy level. Untabulated results find the
dependent variable in the second stage is not significantly related to Regulated
Industries×SplitShareReform and Regulated Industries× CPCMeeting, supporting our augments.
We report the results of the treatment effect model in Table 6 Panels A and B. Panel A
shows the first stage regression. In addition to the exogenous variables, we also included
variables measuring firm fundamentals and corporate governance in the first stage regression.30
Consistent with our expectations, we find all these variables are significantly related to the
indicator for state ownership (SOE), the dependent variable of the first stage. The results suggest
higher state ownership for regulated industries. State ownership decreases after the CPC meeting
29
We obtain the list of regulated industries from Chang et al. (2014). Regulated industries include mining,
railroads, trucking, airlines, telecommunications, energy supply, and media. These industries are identified based
policy reports from the state council (General Office of the State Council, 2006) and Shenzhen stock exchange
(Chen et al. 2008). These industries are characterized with high state ownership concentration and high entrance
barrier. 30
Several other variables, which are determinants of tax rates in the second stage, are not included in the first stage,
because there is no clear reason to expect these variables to be related to state ownership. But, untabulated results
suggest that our findings are robust to further including these other variables.
27
in 2003 and also the split share reform. But, the decrease in state ownership is mitigated for
regulated industries. Figure 3 further visually presents state owned enterprise concentration
across three periods: Pre 2003 CPC meeting (1999 to 2002), Post 2003 CPC meeting (2003 to
2006), and Post Split-Share Reform (2007 to 2012). The percentage of state owned enterprises in
regulated industries are stable across the three time periods. The percentage of state owned
enterprises in non-regulated industries decreases across the three time periods. This further
supports the use of these exogenous variables. Table 6 Panel B reports the second stage
regression results after controlling for the hazard ratio from the first stage. Results in the second
stage suggest that state ownership is associated with significantly higher tax rates, support our
primary findings. This treatment effect model test mitigates concerns about self-selection.
5.2 Difference in Differences Test of Privatization
To further alleviate concerns about correlated omitted variables, we perform several
analyses on privatizations. First, we provide a comparison of tax rates before and after
privatizations during the sample period. As shown in Figure 2, both effective tax rates and cash
effective tax rates decrease after privatization. 31
We further provided difference in differences
tests of privitizations. Based on firm size at the end of the year prior to privatization, we match
each pre-privatization SOE with a non-state-owned enterprise from the same industry. 32
Then,
we obtain all the annual observations of the SOEs and the matched non-SOEs. We use this
matched sample to perform difference in difference tests. We set up two variables: Pre-
Privatization which is an indicator which is set to 1 for SOEs prior to privatizations, 0 for
matched non-SOE observations; Post-Privatization which is an indicator which is set to 1 for
31
A firm is privatized when the state is not the controlling shareholder of the firm any longer. 32
We require the SOEs and non-SOEs to have observations for at least two years before and after the year of the
privatizations.
28
SOEs after privatizations, 0 for matched non-SOE observations. Then, we expect that SOEs have
higher tax rates than do non-SOEs prior to privatizations, but the difference should disappear
after privatizations. Results reported in Table 6 Panel C suggest that Pre-Privatization is
significantly associated with higher tax rates, but Post-Privatization is not significantly
associated with tax rates. These are still consistent with our argument that state ownership is
related with higher tax rates. This test could mitigate concerns about omitted time-invariant
variables.
5.3 Propensity Score Matching
Table 6 Panel D provides one to one propensity score matched sample tests. The tests
follow a two-stage approach. Using the full sample, the first-stage regression predicts the
probability that a firm is a SOE. Then, we match each non-SOE with one SOE based on the
predicted value from the first stage regression.33
The second stage regression uses the matched
samples, and our results remain robust. These matched sample tests could also mitigate concerns
about the differences in firm characteristics between SOEs and non-SOEs.
5.4 Income Taxes and Stock Returns for SOEs
An offsetting mechanism to the expropriation of wealth from minority shareholders is
that SOEs (and the minority shareholders) realize certain benefits in return from the state. For
example, the state might steer lucrative contracts or favorable financing to the SOE. If so, then
these benefits ought to be priced. Stock returns are not of great importance to the state, but they
are the primary vehicle for minority shareholders to profit. We provide indirect evidence on this
by examining the association between unexpected tax rates and abnormal stock returns for SOE.
33
For the CETR tests, we further deleted observations with no CETR data and their matched observations.
29
In China, listed firms are required to issue financial reports during January 1 through
April 31. We calculate buy-and-hold abnormal stock returns from the beginning of May to the
next April. Then, we compute buy-and-hold abnormal stock returns by taking the difference
between the raw return and the market return during the same period. Further, we use two
benchmarks to calculate the unexpected tax rates: tax rates in in the last year and the average tax
rates in the last three years. Finally, using the sample of SOEs, we regress buy-and-hold
abnormal stock returns on unexpected tax rates and control variables (Lag_SIZE, Lag_MB,
Lag_Lev, and ΔROA). ΔROA (ΔROA3) is used to control for the firm’s unexpected financial
performance during the current year compared with the last year (the last three years). Lag_SIZE,
Lag_MB are used to control for size and value risk factors (e.g., Fama and French 1992, 1993).34
In Table 7 Panel A, we find significant negative coefficients on both proxies for unexpected tax
rates. For example, in the first column, the coefficient on ETR is –0.108 (t-statistic= –5.59). At
best, this evidence is inconsistent with benefits accruing to SOEs (and minority shareholders)
through less tax avoidance, and at worst the evidence suggests SOEs’ lack of tax avoidance is
costly to minority shareholders, all consistent with our primary hypothesis and conclusion.
5.5 Merger and Acquisition in Tax Haven
Tax haven operations are associated with aggressive tax reporting behavior (e.g., Hope et
al. 2013). Chinese firms do not disclose detailed data about tax haven operations, but many
Chinese companies establish their operations in tax havens by acquiring firms in tax havens. So,
we examine whether state ownership affects the probability of acquiring foreign firms in tax
havens. We manually collected data on foreign merger and acquisitions. Using probit regressions,
34
Market factor is controlled for by subtracting off the market return from stock return.
30
Table 7 Panel B suggest that non-SOEs are more likely to acquire and merger foreign firms in
tax havens than non-SOEs. Specifically, the first column uses a subsample of firms with M&A
activities (in either tax haven or any other areas); the second column uses the full sample of firms,
regardless whether the firm has M&A activities. We include firm size, leverage, market to book
value, ownership concentration and preferential tax rates as control variables. The findings are
consistent with the argument that non-SOEs are more tax aggressive than SOEs.
5.6 The Role of Financial Health
We test whether the association between SOEs and ETRs is affected by financial health.
Specifically, we split the sample based on the bankruptcy risk (measured based on Ohlson
(1990)’s bankruptcy risk model). We predict the effects of SOEs on ETR to be mitigated when
the financial health is poor. Table 7 Panel C provides results consistent with our prediction. This
finding suggests that due to the state’s incentive to save SOEs from bankruptcy and maintain
economic growth, the state reduces the tunneling of resources out of the SOEs.
5.7 Untabluated Additional Tests
5.7.1 Tax and Governmental Grants
In addition to examining the relation between taxes and stock returns, a more direct test is
whether the government allocates more financial grants to SOEs with higher tax rates. We obtain
data on government grants from the WIND database for years from 2007 (data not available
before 2007). In untabulated results, we find, after controlling for several other variables and
current year’s grants, 35
next year’s governmental grants (scaled by total sales) are not
significantly associated with either a SEO’s effective tax rate (coefficient= –0.001, t-statistic= –
35
Conclusion are the same when current year’s grants is not controlled for.
31
0.77) or cash tax rate (coefficient= –0.000, t-statistic= –0.38). Again, these results are
inconsistent with an alternative explanation that SOEs’ higher tax rates translate into benefits for
the firm.
5.7.2 The Role of Governance
We also consider the effects of three governance mechanisms: the degrees of
marketization across regions, management ownership and whether the CEO is also the chair of
the board of directors. Marketization is an index measuring the development of the regional
market and institutions from Fan et al. (2010). We find that the effects of SOEs on tax rates are
significantly more positive for firms in areas with the degrees of marketization are lower. The
board of directors is expected to be more independent and more effective when the CEO is not
also the chair of the board of directors. We find the effects of SOE on cash tax rates are less
positive when the CEO does not also serve as chair of the board of directors (the differences in
the effects are significant when CETR is used). However, we find high management ownership
does not significantly affect the relationship between state ownership and tax rates, which is
consistent with benefits of minimizing tax avoidance accruing to the SOE manager exceeding the
negative wealth effects of the manager’s equity holdings. However, this inference is based on a
non-result, and other explanations remain.
5.7.3 Other Additional Tests
We also employ several other tests to ensure the robustness of our results. First, we use
an alternative definition of SOE, where a firm is identified as a SOE if the shares held by the
largest shareholder are state-owned shares and exceed 20%. Second, we test whether our results
are due to SEO managers being pro-government or not. Specifically, we use two proxies for pro-
32
government managers: politically connected managers and managers who are communism party
members. Untabaluated results suggest no significant interaction effect of pro-government
managers and SOEs. Third, our results are robust to controlling for discretionary accruals
(Dechow et al, 1995). Fourth, our tax rate results are robust to excluding ROA from the
regressions or replacing ROA with stock returns. Finally, we delete firms with state ownership
greater 70%, and our results are robust. None of our findings are sensitive to these alternatives,
suggesting that our findings are robust.
6. Conclusion
Using a sample of listed Chinese firms, we find that SOEs have significantly higher
effective tax rates and cash tax rates than do non-SOEs. We also find a positive association
between tax rates and SOE manager promotions. SOE managers exhibit a marked increase in tax
rates during years in which they face term-evaluations for promotions. The effects of SOE
ownership on reduced tax avoidance are greater for SOEs controlled by local governments than
the central government. In addition, we find some evidence that certain corporate governance
mechanisms seem to mitigate the negative relation between SOEs and tax avoidance. Results are
robust to numerous alternative tests. Collectively, the findings suggest that the SOEs make tax
decisions favorable to the controlling shareholder, the state, but costly to the minority
shareholders, and the state utilizes SOE managers’ career concerns to incentivize these decisions.
Our study contributes to a better understanding of corporate tax avoidance behavior
(Hanlon and Heitzman 2010). First, we provide evidence on the importance of ownership
structure in determining a firm’s tax avoidance behavior (e.g., Shackelford and Shevlin 2001).
Second, our study also supports the idea that individual managers and their career concerns play
important roles in corporate tax reporting decisions (e.g.,Dyreng et al. 2010). Finally, our study
33
suggests that corporate tax avoidance behavior is associated with agency conflicts between
controlling and minority shareholders, and these findings have important implications for
investors in international emerging markets (e.g.,Desai and Dharmapala 2004, 2006; Desai,
Dyck, and Zingales 2007).
34
References
Armstrong,C. J. Blouin, and D. Larcker. 2012. The Incentives for Tax Planning. Journal of
Accounting and Economics 53, 391 - 411.
Bae, K. H., J. K. Kang, and J. M. Kim. 2002. Tunneling or value added? Evidence from mergers
by Korean business groups. The Journal of Finance 57 (6):2695-2740.
Bertrand, M., P. Mehta, and S. Mullainathan. 2002. Ferreting out tunneling: An application to
Indian business groups. The Quarterly Journal of Economics 117 (1):121-148.
Bhojraj, S., and R. Libby. 2005. Capital market pressure, disclosure frequency-induced
earnings/cash flow conflict, and managerial myopia. The Accounting Review 80 (1):1-20.
Boubakri, N., and J. C. Cosset. 1998. The financial and operating performance of newly
privatized firms: Evidence from developing countries. The Journal of Finance 53 (3):1081-
1110.
Boycko, M., A. Shleifer, and R. W. Vishny. 1996. A theory of privatisation. The Economic
Journal 106 (435):309-319.
Brickley, J. A., J. S. Linck, and J. L. Coles. 1999. What happens to CEOs after they retire? New
evidence on career concerns, horizon problems, and CEO incentives. Journal of Financial
Economics 52 (3):341-377.
Calomiris, C.W., Fisman, R., and Y., Wang, 2010. Profiting from government stakes in a
command economy: Evidence from Chinese asset sales. Journal of Financial Economics
96, 399-412
Cao, J., M. Lemmon, X. Pan, and G. Tian. 2010. Political Promotion, CEO Compensation, and
Their Effect on Firm Performance. Working Paper, Singapore Management University.
Central Committee of the Communist Party of China, 1999, The Decision of the Central
Committee of The Communist Party of China on Major Issues Concerning The Reform and
Development of State-Owned Enterprises , Beijing China
Central Committee of the Communist Party of China, 2003, Decision of the Central Committee
of the Communist Party of China on Some Issues concerning the Improvement of the
Socialist Market Economy, Beijing China
Chang C., X. Chen, and G. Liao, 2014, What are the Reliably Important Determinants of Capital
Structure in China?, Pacific-Basin Finance Journal, 30, 87-113
Chen B., J. Yu, X. Wang and J. Lai, 2008, Empirical Analyses of Chinese non-state-owned
enterprises, working paper, Shenzhen Stock Exchange.
Chen, S., X. Chen, Q. Cheng, and T. Shevlin. 2010. Are family firms more tax aggressive than
non-family firms? Journal of Financial Economics 95 (1):41-61.
Cheng, C. A., H. H. Huang, Y. Li, and J. Stanfield. 2012. The effect of hedge fund activism on
corporate tax avoidance. The Accounting Review 87 (5):1493-1526.
Cheung, Y., P. R. Rau, and A. Stouraitis. 2006. Tunneling, propping, and expropriation:
evidence from connected party transactions in Hong Kong. Journal of Financial Economics
82 (2):343-386.
Cheung, Y., P. R. Rau, and A. Stouraitis. 2008. The helping hand, the lazy hand, or the grabbing
hand? Central vs. local government shareholders in publicly listed firms in China. Working
Paper, University of Hong Kong.
Cragg, M., and A. Dyck. 2003. Privatization and management incentives: Evidence from the
United Kingdom. Journal of Law, Economics and Organization 19 (1), 176-218.
35
Dechow, P., R. Sloan and A. Sweeney,1995, Detecting Earnings Management, The Accounting
Review, 70, 2 ,193-225
Deloitte, 2013. Taxation and investment in China 2013. Available at
http://www2.deloitte.com/content/dam/Deloitte/global/Documents/Tax/dttl-tax-chinaguide-
2013.pdf
Desai, M., A. Dyck and L. Zingales, 2007. Theft and taxes. Journal of Financial Economics 84,
591-693.
Desai, M. A., and D. Dharmapala. 2004. Earnings management and corporate tax shelters.
Working Paper. Harvard University and University of Connecticut.
Desai, M. A., and D. Dharmapala. 2006. Corporate tax avoidance and high-powered incentives.
Journal of Financial Economics 79 (1):145-179.
Devos, E., P.R. Kadapakkam, and S. Krishnamurthy, 2009. How do mergers create value?A
comparison of taxes, market power, and efficiency improvements as explanations
forsynergies. Review of Financial Studies 22 (3), 1179–1211
Djankov, S., R. La Porta, F. Lopez-de-Silanes, and A. Shleifer. 2008. The law and economics of
self-dealing. Journal of Financial Economics 88 (3):430-465.
Djankov, S., and P. Murrell. 2002. Enterprise restructuring in transition: A quantitative survey.
Journal of Economic Literature 40 (3):739-792.
D'Souza, J., and W. L. Megginson. 1999. The financial and operating performance of privatized
firms during the 1990s. The Journal of Finance 54 (4):1397-1438.
Du, F., G. Tang, and S. M. Young. 2012. Influence Activities and Favoritism in Subjective
Performance Evaluation: Evidence from Chinese State-Owned Enterprises. The Accounting
Review 87 (5):1555-1588.
Dyreng, S., and B. Lindsey. 2009. Using financial accounting data to examine the effect of
foreign operations located in tax havens and other countries on US multinational firms’ tax
rates. Journal of Accounting Research 47: 1238-1316.
Dyreng, S. D., M. Hanlon, and E. L. Maydew. 2008. Long-run corporate tax avoidance. The
Accounting Review 83 (1):61-82.
Dyreng, S. D., M. Hanlon, and E. L. Maydew. 2010. The effects of executives on corporate tax
avoidance. The Accounting Review 85 (4):1163-1189.
Ernst & Young LLP, 2006, Tax Implications of Operating in China, Published in the UK.
Faccio, M., L. H. Lang, and L. Young. 2001. Dividends and expropriation. American Economic
Review 91 (1):54-78.
Faccio, M., and L. H. Lang. 2002. The ultimate ownership of Western European corporations.
Journal of Financial Economics 65 (3):365-395.
Fama, E. F. 1980. Agency Problems and the Theory of the Firm. The Journal of Political
Economy 88 (2):288-307.
Fama, E. F., and K. R. French. 1992. The cross‐section of expected stock returns. The Journal
of Finance 47 (2):427-465.
Fama, E. F., and K. R. French. 1993. Common risk factors in the returns on stocks and bonds.
Journal of Financial Economics 33 (1):3-56.
Fan, G., X. Wang, and H. Zhu. 2010. NERI index of Marketization of China's Provinces 2009
Report: The Economic Science Press (in Chinese).
Frank, M. M., L. J. Lynch, and S. O. Rego. 2009. Tax reporting aggressiveness and its relation to
aggressive financial reporting. The Accounting Review 84 (2):467-496.
Greene, W., 2003, Econometric Analysis, 5th edition, Prentice Hall.
36
Gibbons, R., and K. Murphy. 1992. Optimal incentive contracts in the presence of career
concerns: Theory and evidence. Journal of Political Economy 100(3):468-505.
Gong, G., L. Y. Li, and J. Y. Shin. 2011. Relative performance evaluation and related peer
groups in executive compensation contracts. The Accounting Review 86 (3):1007-1043.
Grossman, S. J., and O. D. Hart. 1988. One share-one vote and the market for corporate control.
Journal of Financial Economics 20 (January–March):175-202.
Groves, T., Y. Hong, J. McMillan, and B. Naughton. 1995. China's evolving managerial labor
market. Journal of Political Economy 103 (4): 873-892.
Gupta, S., and K. Newberry. 1997. Determinants of the variability in corporate effective tax
rates: Evidence from longitudinal data. Journal of Accounting and Public Policy 16 (1):1-
34.
Hanlon, M., and S. Heitzman. 2010. A review of tax research. Journal of Accounting and
Economics 50 (2):127-178.
Hart, O. 1995. Firms, contracts, and financial structure: Oxford University Press.
Heckman, J.J., 1979, Sample selection as a specification error, Econometrica, 47, 153-161.
Holmstrom, B. 1982. Moral hazard in teams. The Bell Journal of Economics 13 (2):324-340.
Hope, O., M. S. Ma, and W. B. Thomas. 2013. Tax avoidance and geographic earnings
disclosure. Journal of Accounting and Economics 56 (2):170-189.
Jensen, M. C., and W. H. Meckling. 1976. Theory of the firm: Managerial behavior, agency costs
and ownership structure. Journal of Financial Economics 3 (4):305-360.
Jiang, G., C. Lee, and H. Yue. 2010. Tunneling through intercorporate loans: The China
experience. Journal of Financial Economics 98 (1):1-20.
Johnson, S., R. La Porta, A. Shleifer and F. Lopez-de-Silanes. 2000. Tunneling. American
Economic Review Papers and Proceedings 90 (2):22-27.
Lemmon, M. L., and K. V. Lins. 2003. Ownership structure, corporate governance, and firm
value: Evidence from the East Asian financial crisis. The Journal of Finance 58 (4):1445-
1468.
KPMG, 2012. Securing R&D Tax Incentives in China. Available at http://kpmg.de/docs/Securing-
Research-Development-Tax-Incentives-in-China-201210.pdf Li, D. D. 1998. Changing incentives of the Chinese bureaucracy. American Economic Review 88
(2):393-397.
Li K. and N.R. Prabhala, 2006, Self-Selection Models in Corporate Finance, Forthcoming in B.
Espen Eckbo (ed.), Handbook of Corporate Finance: Empirical Corporate Finance
(Handbooks in Finance Series, Elsevier/North-Holland), Chapter 2
Li K., T. Wang, Y-L Cheung and P. Jiang, 2011, Privatization and Risk Sharing: Evidence from
the Split Share Structure Reform in China, Review of Financial Studies 24 (7): 2499-2525
Li, H., and L. Zhou. 2005. Political turnover and economic performance: the incentive role of
personnel control in China. Journal of Public Economics 89 (9):1743-1762.
Liao, L., B. Liu and H. Wang. 2014. China’s secondary privatization: Perspectives from the
split-share structure reform. Journal of Financial Economics, forthcoming.
MacNeil, I. 2002. Adaptation and convergence in corporate governance: The case of Chinese
listed companies. Journal of Corporate Law Studies 2 (2):289-344.
Maddala, G.S., 1983, Limited-Dependent and Qualitative Variables in Econometrics,
Cambridge: Cambridge University Press.
Manzon, G., and G. Plesko. 2002. The relation between financial and tax reporting measures of
income. Tax Law Review 55 (2):175-214.
37
McGuire, S. T., T. C. Omer, and D. Wang. 2012. Tax avoidance: Does tax-specific industry
expertise make a difference? The Accounting Review 87 (3):975-1003.
Mills, L. F. 1998. Book-tax differences and Internal Revenue Service adjustments. Journal of
Accounting Research 36 (2):343-356.
Ministry of Finance, PRC (MOF). 1994. The detailed rules for the implementation of the income
tax law of the PRC for enterprises (In Chinese).
Ministry of Finance, PRC (MOF). 1996. CaiShuiZi (1996) No. 41 (In Chinese).
Ministry of Finance, PRC (MOF). 1997. CaiShuiZi (1997) No. 49 (In Chinese).
Ohlson J., 1980, Financial Ratios and the Probabilistic Prediction of Bankruptcy, Journal of
Accounting Research, 18, 1, 109-131
Piotroski, J., and T.J. Wong. 2011. Institutions and information environment of Chinese listed
firms. Working Paper. Stanford University and the Chinese University of Hong Kong.
Rego, S. O. 2003. Tax Avoidance Activities of US Multinational Corporations. Contemporary
Accounting Research 20 (4):805-833.
Rego, S. and R. Wilson, 2012. Equity Risk Incentives and Corporate Tax Aggressiveness.
Journal of Accounting Research., 50: 775–810
Scholes M., M. Wolfson, M. Erickson, E. Maydew, and T. Shevlin. 2005. Taxes and Business
Strategy: A Planning Approach (3rd edition): Pearson Prentice Hall, Upper Saddle River,
NJ.
Shackelford, D. A., and T. Shevlin. 2001. Empirical tax research in accounting. Journal of
Accounting and Economics 31 (1):321-387.
Shenyang Guo and Mark W. Fraser, 2014, Propensity Score Analysis Statistical Methods and
Applications, Second Edition, SAGE Publications, Inc New York
Shleifer, A., and R. W. Vishny. 1994. Politicians and firms. The Quarterly Journal of Economics
109 (4):995-1025.
State-Owned Assets Supervision and Administration Commission (SASAC). 2003. State-Owned
Assets Supervision and Administration Commission Order No.2.
State Council of China. 1993. Provisional Regulations on Enterprise Income Tax of the People's
Republic of China, Promulgated on Order [1993] No. 137.
Su, D. 2005. Corporate finance and state enterprise reform in China. China Economic Review 16
(2):118-148.
Sun, Q., and W. H. Tong. 2003. China share issue privatization: the extent of its success. Journal
of Financial Economics 70 (2):183-222.
The General Office of the State Council, 2006, Notice of the General Office of the State Council
on Forwarding the Guiding Opinions of the SASAC about Promoting the Adjustment of
State-owned Capital and the Reorganization of State-owned Enterprise, Beijing China
The State Council, 1993 Decision of the State Council on Implementing the Tax Division
Management System, Beijing China
The State Council, 2001, Notice of Reforms of the Sharing System of Income Tax Revenues,
Beijing China
The State Council, 2003, Notice of the State Council on Clarifying the Proportion for the Central
Government and the Local Government to Share the Income from Income Taxes, Beijing
China
Wang, Q., T. Wong, and L. Xia. 2008. State ownership, the institutional environment, and
auditor choice: Evidence from China. Journal of Accounting and Economics 46 (1):112-
134.
38
Wang, Y., and M. Campbell, 2010. Business failure prediction for publicly listed companies in
China. Journal of Business and Management 16(1). 75
Zingales, L. 1994. The value of the voting right: A study of the Milan stock exchange
experience. Review of Financial Studies 7 (1):125-148.
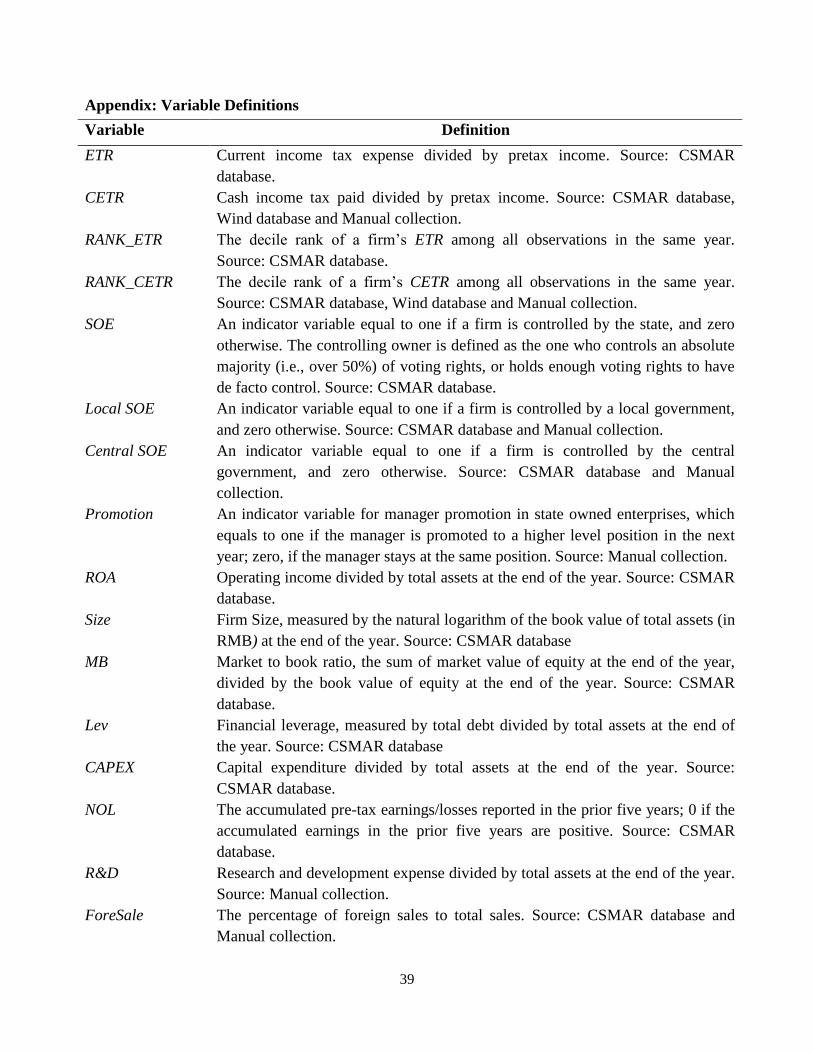
39
Appendix: Variable Definitions
Variable Definition
ETR Current income tax expense divided by pretax income. Source: CSMAR
database.
CETR Cash income tax paid divided by pretax income. Source: CSMAR database,
Wind database and Manual collection.
RANK_ETR The decile rank of a firm’s ETR among all observations in the same year.
Source: CSMAR database.
RANK_CETR The decile rank of a firm’s CETR among all observations in the same year.
Source: CSMAR database, Wind database and Manual collection.
SOE An indicator variable equal to one if a firm is controlled by the state, and zero
otherwise. The controlling owner is defined as the one who controls an absolute
majority (i.e., over 50%) of voting rights, or holds enough voting rights to have
de facto control. Source: CSMAR database.
Local SOE An indicator variable equal to one if a firm is controlled by a local government,
and zero otherwise. Source: CSMAR database and Manual collection.
Central SOE An indicator variable equal to one if a firm is controlled by the central
government, and zero otherwise. Source: CSMAR database and Manual
collection.
Promotion An indicator variable for manager promotion in state owned enterprises, which
equals to one if the manager is promoted to a higher level position in the next
year; zero, if the manager stays at the same position. Source: Manual collection.
ROA Operating income divided by total assets at the end of the year. Source: CSMAR
database.
Size Firm Size, measured by the natural logarithm of the book value of total assets (in
RMB) at the end of the year. Source: CSMAR database
MB Market to book ratio, the sum of market value of equity at the end of the year,
divided by the book value of equity at the end of the year. Source: CSMAR
database.
Lev Financial leverage, measured by total debt divided by total assets at the end of
the year. Source: CSMAR database
CAPEX Capital expenditure divided by total assets at the end of the year. Source:
CSMAR database.
NOL The accumulated pre-tax earnings/losses reported in the prior five years; 0 if the
accumulated earnings in the prior five years are positive. Source: CSMAR
database.
R&D Research and development expense divided by total assets at the end of the year.
Source: Manual collection.
ForeSale The percentage of foreign sales to total sales. Source: CSMAR database and
Manual collection.
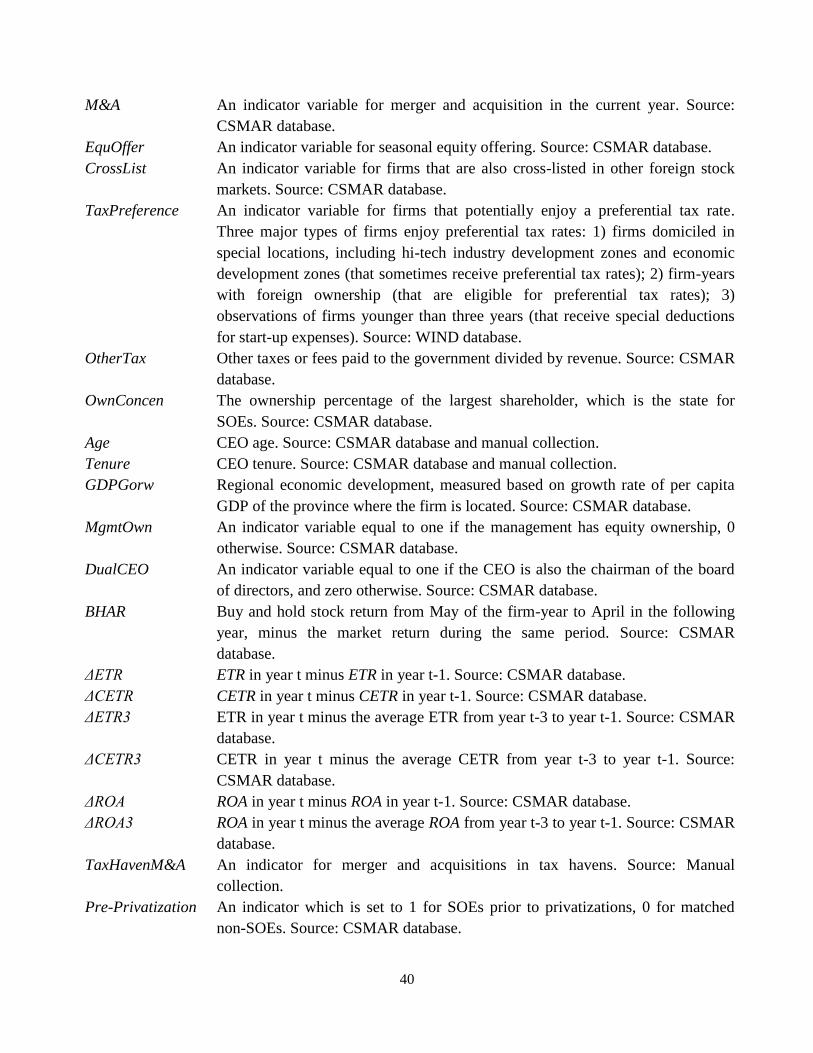
40
M&A An indicator variable for merger and acquisition in the current year. Source:
CSMAR database.
EquOffer An indicator variable for seasonal equity offering. Source: CSMAR database.
CrossList An indicator variable for firms that are also cross-listed in other foreign stock
markets. Source: CSMAR database.
TaxPreference An indicator variable for firms that potentially enjoy a preferential tax rate.
Three major types of firms enjoy preferential tax rates: 1) firms domiciled in
special locations, including hi-tech industry development zones and economic
development zones (that sometimes receive preferential tax rates); 2) firm-years
with foreign ownership (that are eligible for preferential tax rates); 3)
observations of firms younger than three years (that receive special deductions
for start-up expenses). Source: WIND database.
OtherTax Other taxes or fees paid to the government divided by revenue. Source: CSMAR
database.
OwnConcen The ownership percentage of the largest shareholder, which is the state for
SOEs. Source: CSMAR database.
Age CEO age. Source: CSMAR database and manual collection.
Tenure CEO tenure. Source: CSMAR database and manual collection.
GDPGorw Regional economic development, measured based on growth rate of per capita
GDP of the province where the firm is located. Source: CSMAR database.
MgmtOwn
An indicator variable equal to one if the management has equity ownership, 0
otherwise. Source: CSMAR database.
DualCEO An indicator variable equal to one if the CEO is also the chairman of the board
of directors, and zero otherwise. Source: CSMAR database.
BHAR Buy and hold stock return from May of the firm-year to April in the following
year, minus the market return during the same period. Source: CSMAR
database.
ΔETR ETR in year t minus ETR in year t-1. Source: CSMAR database.
ΔCETR CETR in year t minus CETR in year t-1. Source: CSMAR database.
ΔETR3 ETR in year t minus the average ETR from year t-3 to year t-1. Source: CSMAR
database.
ΔCETR3 CETR in year t minus the average CETR from year t-3 to year t-1. Source:
CSMAR database.
ΔROA ROA in year t minus ROA in year t-1. Source: CSMAR database.
ΔROA3 ROA in year t minus the average ROA from year t-3 to year t-1. Source: CSMAR
database.
TaxHavenM&A An indicator for merger and acquisitions in tax havens. Source: Manual
collection.
Pre-Privatization An indicator which is set to 1 for SOEs prior to privatizations, 0 for matched
non-SOEs. Source: CSMAR database.
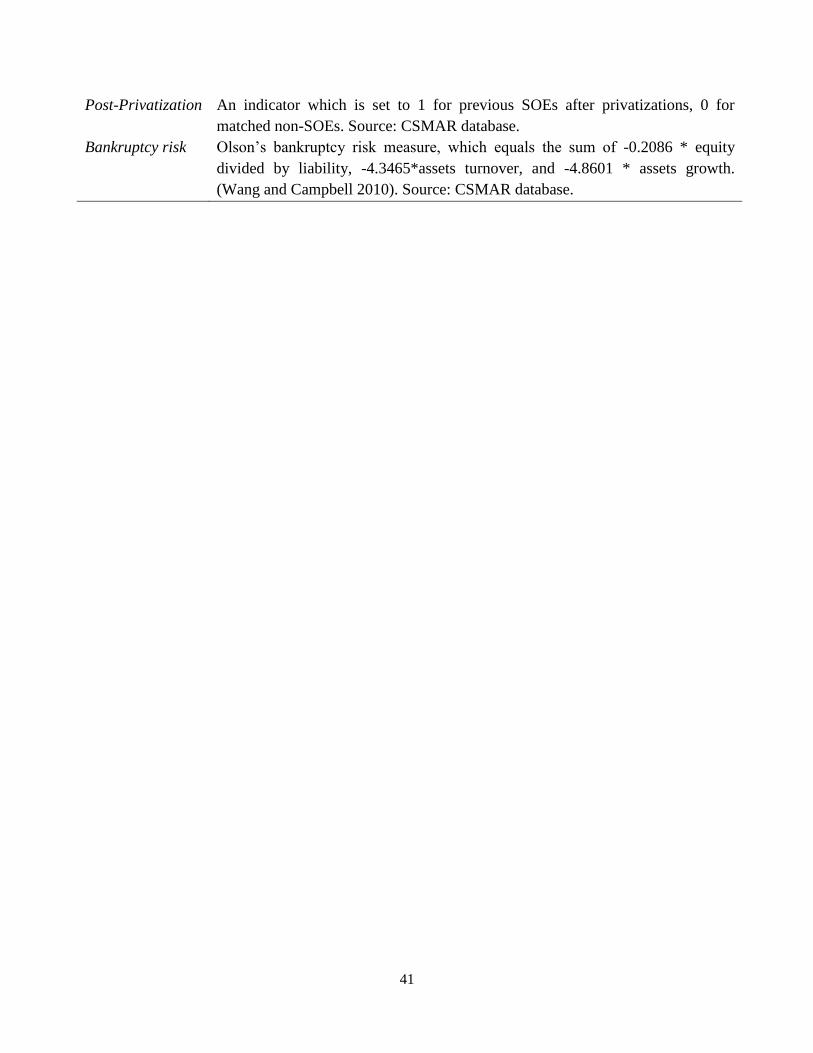
41
Post-Privatization An indicator which is set to 1 for previous SOEs after privatizations, 0 for
matched non-SOEs. Source: CSMAR database.
Bankruptcy risk Olson’s bankruptcy risk measure, which equals the sum of -0.2086 * equity
divided by liability, -4.3465*assets turnover, and -4.8601 * assets growth.
(Wang and Campbell 2010). Source: CSMAR database.
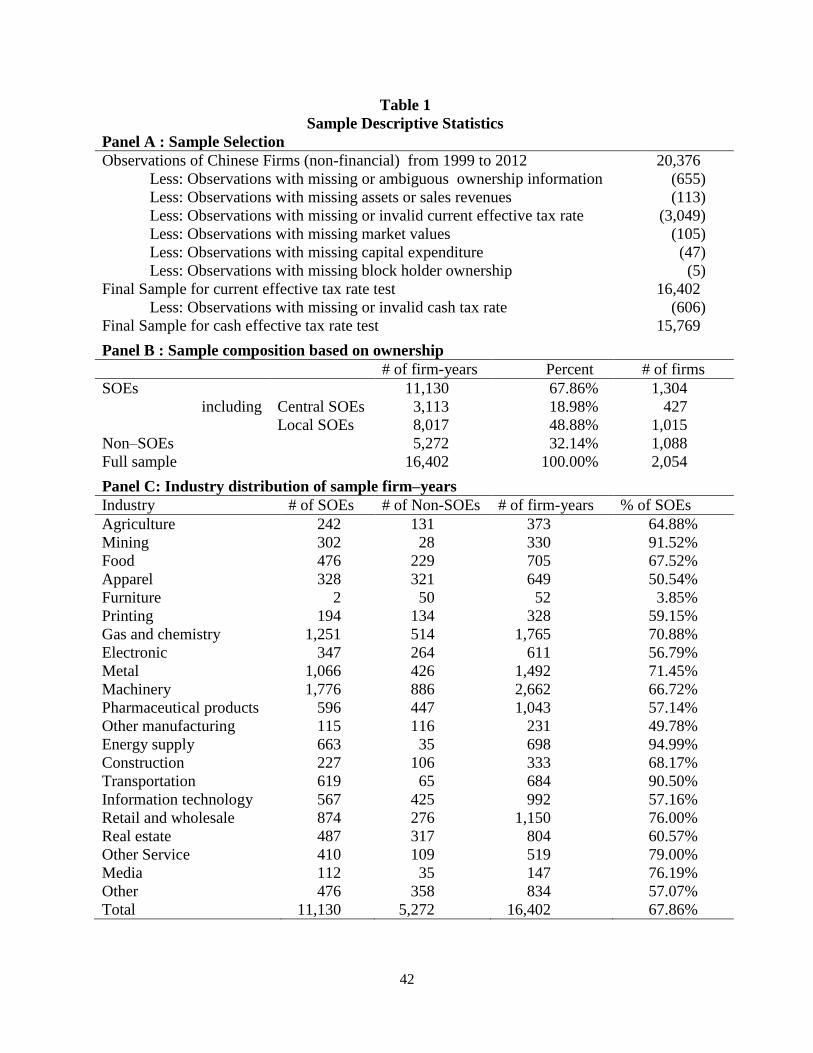
42
Table 1
Sample Descriptive Statistics
Panel A : Sample Selection
Observations of Chinese Firms (non-financial) from 1999 to 2012 20,376
Less: Observations with missing or ambiguous ownership information (655)
Less: Observations with missing assets or sales revenues (113)
Less: Observations with missing or invalid current effective tax rate (3,049)
Less: Observations with missing market values (105)
Less: Observations with missing capital expenditure (47)
Less: Observations with missing block holder ownership (5)
Final Sample for current effective tax rate test 16,402
Less: Observations with missing or invalid cash tax rate (606)
Final Sample for cash effective tax rate test 15,769
Panel B : Sample composition based on ownership
# of firm-years Percent # of firms
SOEs 11,130 67.86% 1,304
including Central SOEs 3,113 18.98% 427
Local SOEs 8,017 48.88% 1,015
Non–SOEs
5,272 32.14% 1,088
Full sample 16,402 100.00% 2,054
Panel C: Industry distribution of sample firm–years
Industry # of SOEs # of Non-SOEs # of firm-years % of SOEs
Agriculture 242 131 373 64.88%
Mining 302 28 330 91.52%
Food 476 229 705 67.52%
Apparel 328 321 649 50.54%
Furniture 2 50 52 3.85%
Printing 194 134 328 59.15%
Gas and chemistry 1,251 514 1,765 70.88%
Electronic 347 264 611 56.79%
Metal 1,066 426 1,492 71.45%
Machinery 1,776 886 2,662 66.72%
Pharmaceutical products 596 447 1,043 57.14%
Other manufacturing 115 116 231 49.78%
Energy supply 663 35 698 94.99%
Construction 227 106 333 68.17%
Transportation 619 65 684 90.50%
Information technology 567 425 992 57.16%
Retail and wholesale 874 276 1,150 76.00%
Real estate 487 317 804 60.57%
Other Service 410 109 519 79.00%
Media 112 35 147 76.19%
Other 476 358 834 57.07%
Total 11,130 5,272 16,402 67.86%
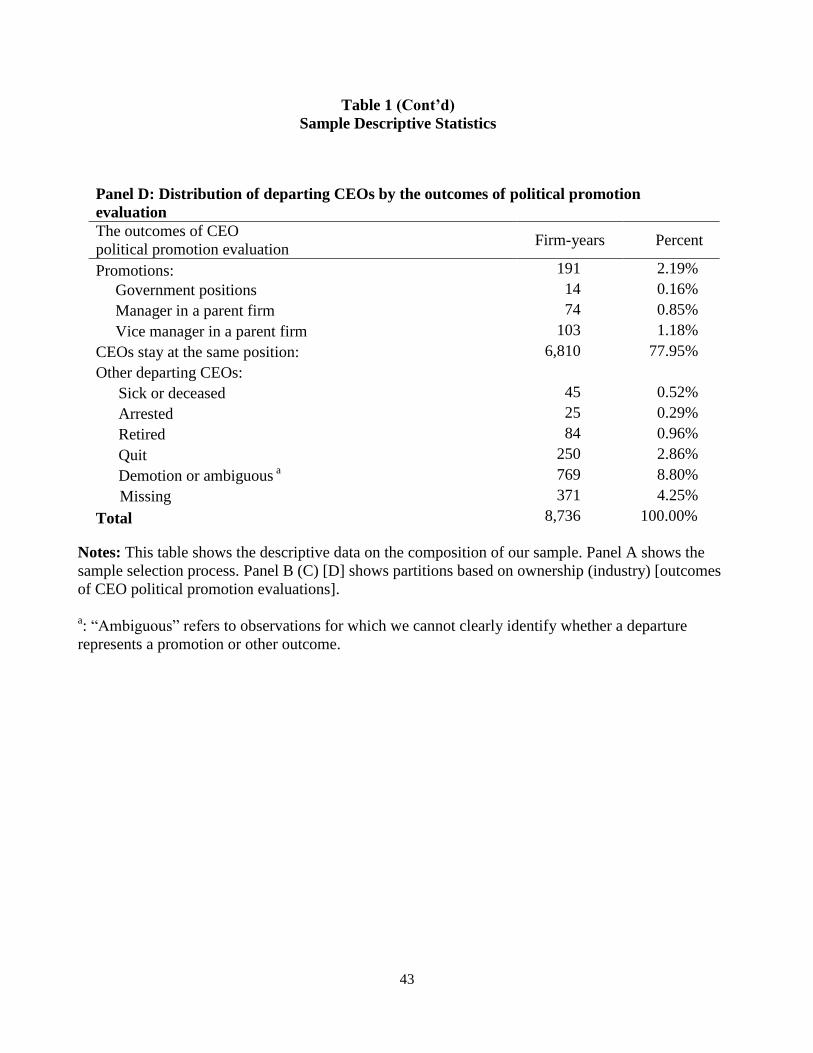
43
Table 1 (Cont’d)
Sample Descriptive Statistics
Notes: This table shows the descriptive data on the composition of our sample. Panel A shows the
sample selection process. Panel B (C) [D] shows partitions based on ownership (industry) [outcomes
of CEO political promotion evaluations].
a: “Ambiguous” refers to observations for which we cannot clearly identify whether a departure
represents a promotion or other outcome.
Panel D: Distribution of departing CEOs by the outcomes of political promotion
evaluation
The outcomes of CEO
political promotion evaluation Firm-years Percent
Promotions: 191 2.19%
Government positions 14 0.16%
Manager in a parent firm 74 0.85%
Vice manager in a parent firm 103 1.18%
CEOs stay at the same position: 6,810 77.95%
Other departing CEOs:
Sick or deceased 45 0.52%
Arrested 25 0.29%
Retired 84 0.96%
Quit 250 2.86%
Demotion or ambiguous a 769 8.80%
Missing 371 4.25%
Total 8,736 100.00%
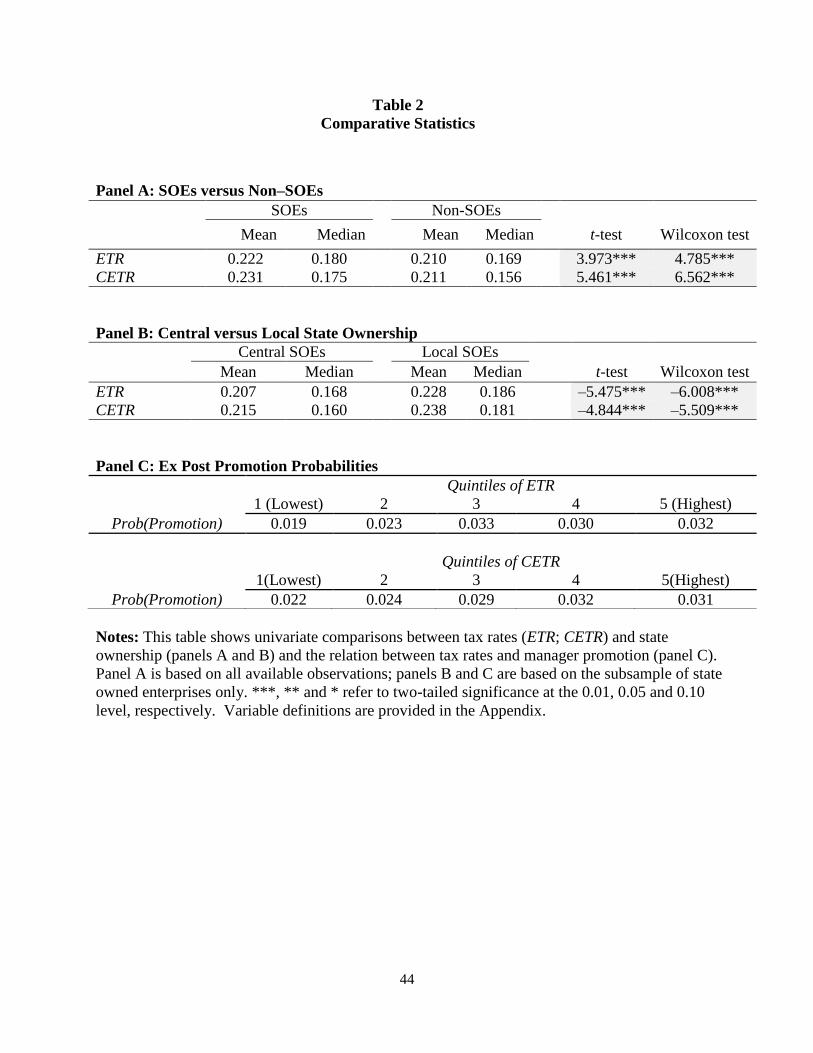
44
Table 2
Comparative Statistics
Notes: This table shows univariate comparisons between tax rates (ETR; CETR) and state
ownership (panels A and B) and the relation between tax rates and manager promotion (panel C).
Panel A is based on all available observations; panels B and C are based on the subsample of state
owned enterprises only. ***, ** and * refer to two-tailed significance at the 0.01, 0.05 and 0.10
level, respectively. Variable definitions are provided in the Appendix.
Panel A: SOEs versus Non–SOEs
SOEs
Non-SOEs
Mean Median Mean Median t-test Wilcoxon test
ETR 0.222 0.180 0.210 0.169 3.973*** 4.785***
CETR 0.231 0.175 0.211 0.156 5.461*** 6.562***
Panel B: Central versus Local State Ownership
Central SOEs Local SOEs
Mean Median
Mean Median t-test Wilcoxon test
ETR 0.207 0.168
0.228 0.186
–5.475*** –6.008***
CETR 0.215 0.160 0.238 0.181 –4.844*** –5.509***
Panel C: Ex Post Promotion Probabilities
Quintiles of ETR
1 (Lowest) 2 3 4 5 (Highest)
Prob(Promotion) 0.019 0.023 0.033 0.030 0.032
Quintiles of CETR
1(Lowest) 2 3 4 5(Highest)
Prob(Promotion) 0.022 0.024 0.029 0.032 0.031
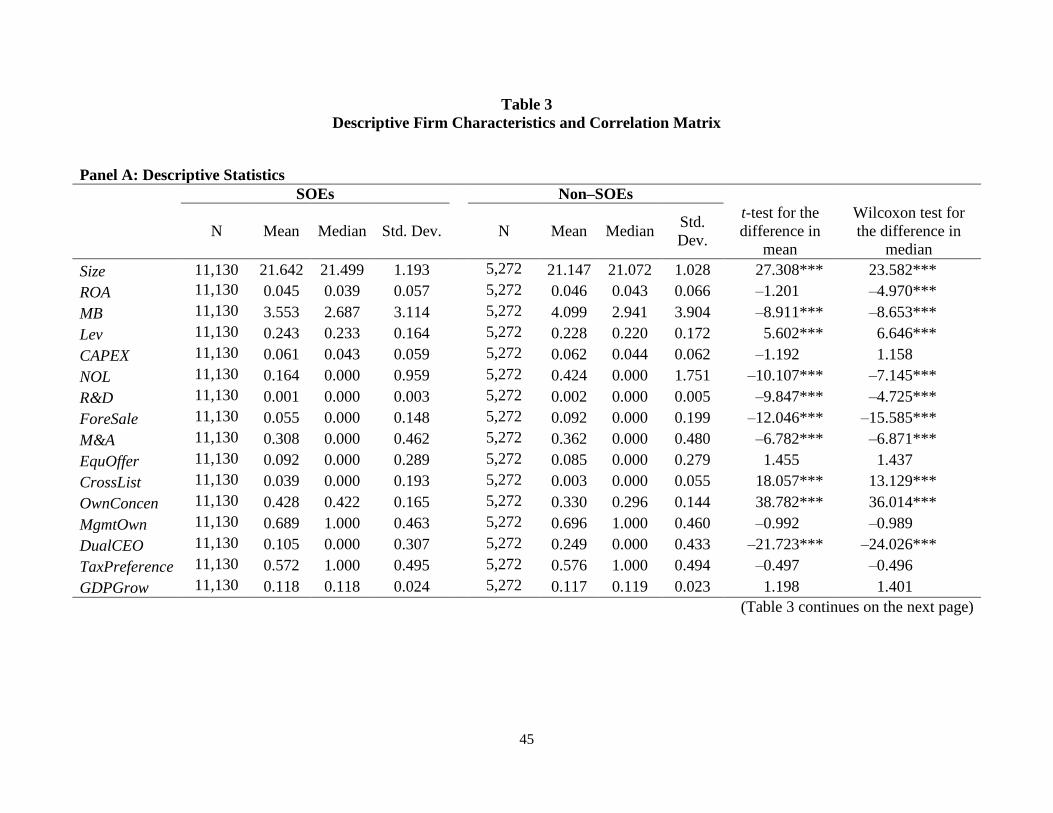
45
Table 3
Descriptive Firm Characteristics and Correlation Matrix
Panel A: Descriptive Statistics
SOEs Non–SOEs
N Mean Median Std. Dev. N Mean Median Std.
Dev.
t-test for the
difference in
mean
Wilcoxon test for
the difference in
median
Size 11,130 21.642 21.499 1.193
5,272 21.147 21.072 1.028 27.308*** 23.582***
ROA 11,130 0.045 0.039 0.057
5,272 0.046 0.043 0.066 –1.201 –4.970***
MB 11,130 3.553 2.687 3.114
5,272 4.099 2.941 3.904 –8.911*** –8.653***
Lev 11,130 0.243 0.233 0.164
5,272 0.228 0.220 0.172 5.602*** 6.646***
CAPEX 11,130 0.061 0.043 0.059
5,272 0.062 0.044 0.062 –1.192 1.158
NOL 11,130 0.164 0.000 0.959
5,272 0.424 0.000 1.751 –10.107*** –7.145***
R&D 11,130 0.001 0.000 0.003
5,272 0.002 0.000 0.005 –9.847*** –4.725***
ForeSale 11,130 0.055 0.000 0.148
5,272 0.092 0.000 0.199 –12.046*** –15.585***
M&A 11,130 0.308 0.000 0.462
5,272 0.362 0.000 0.480 –6.782*** –6.871***
EquOffer 11,130 0.092 0.000 0.289
5,272 0.085 0.000 0.279 1.455 1.437
CrossList 11,130 0.039 0.000 0.193
5,272 0.003 0.000 0.055 18.057*** 13.129***
OwnConcen 11,130 0.428 0.422 0.165
5,272 0.330 0.296 0.144 38.782*** 36.014***
MgmtOwn 11,130 0.689 1.000 0.463
5,272 0.696 1.000 0.460 –0.992 –0.989
DualCEO 11,130 0.105 0.000 0.307
5,272 0.249 0.000 0.433 –21.723*** –24.026***
TaxPreference 11,130 0.572 1.000 0.495
5,272 0.576 1.000 0.494 –0.497 –0.496
GDPGrow 11,130 0.118 0.118 0.024
5,272 0.117 0.119 0.023 1.198 1.401
(Table 3 continues on the next page)
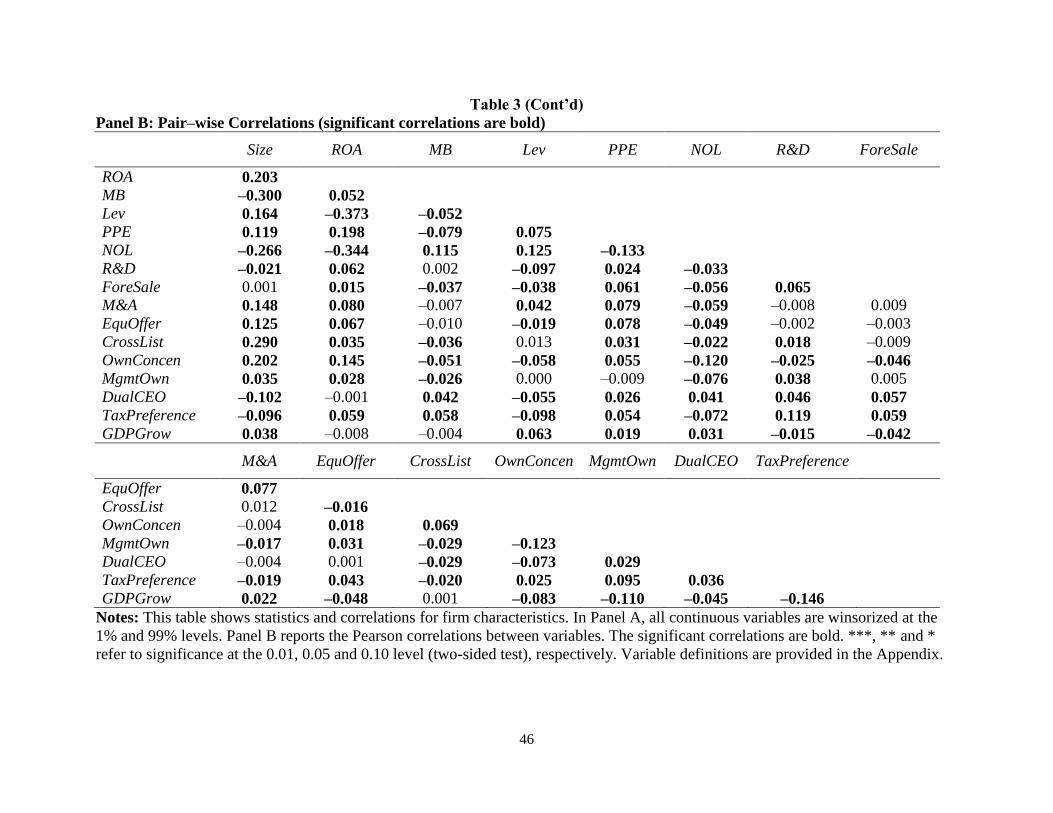
46
Table 3 (Cont’d)
Panel B: Pair–wise Correlations (significant correlations are bold)
Size ROA MB Lev PPE NOL R&D ForeSale
ROA 0.203
MB –0.300 0.052
Lev 0.164 –0.373 –0.052
PPE 0.119 0.198 –0.079 0.075
NOL –0.266 –0.344 0.115 0.125 –0.133
R&D –0.021 0.062 0.002 –0.097 0.024 –0.033
ForeSale 0.001 0.015 –0.037 –0.038 0.061 –0.056 0.065
M&A 0.148 0.080 –0.007 0.042 0.079 –0.059 –0.008 0.009
EquOffer 0.125 0.067 –0.010 –0.019 0.078 –0.049 –0.002 –0.003
CrossList 0.290 0.035 –0.036 0.013 0.031 –0.022 0.018 –0.009
OwnConcen 0.202 0.145 –0.051 –0.058 0.055 –0.120 –0.025 –0.046
MgmtOwn 0.035 0.028 –0.026 0.000 –0.009 –0.076 0.038 0.005
DualCEO –0.102 –0.001 0.042 –0.055 0.026 0.041 0.046 0.057
TaxPreference –0.096 0.059 0.058 –0.098 0.054 –0.072 0.119 0.059
GDPGrow 0.038 –0.008 –0.004 0.063 0.019 0.031 –0.015 –0.042
M&A EquOffer CrossList OwnConcen MgmtOwn DualCEO TaxPreference
EquOffer 0.077
CrossList 0.012 –0.016
OwnConcen –0.004 0.018 0.069
MgmtOwn –0.017 0.031 –0.029 –0.123
DualCEO –0.004 0.001 –0.029 –0.073 0.029
TaxPreference –0.019 0.043 –0.020 0.025 0.095 0.036
GDPGrow 0.022 –0.048 0.001 –0.083 –0.110 –0.045 –0.146
Notes: This table shows statistics and correlations for firm characteristics. In Panel A, all continuous variables are winsorized at the
1% and 99% levels. Panel B reports the Pearson correlations between variables. The significant correlations are bold. ***, ** and *
refer to significance at the 0.01, 0.05 and 0.10 level (two-sided test), respectively. Variable definitions are provided in the Appendix.
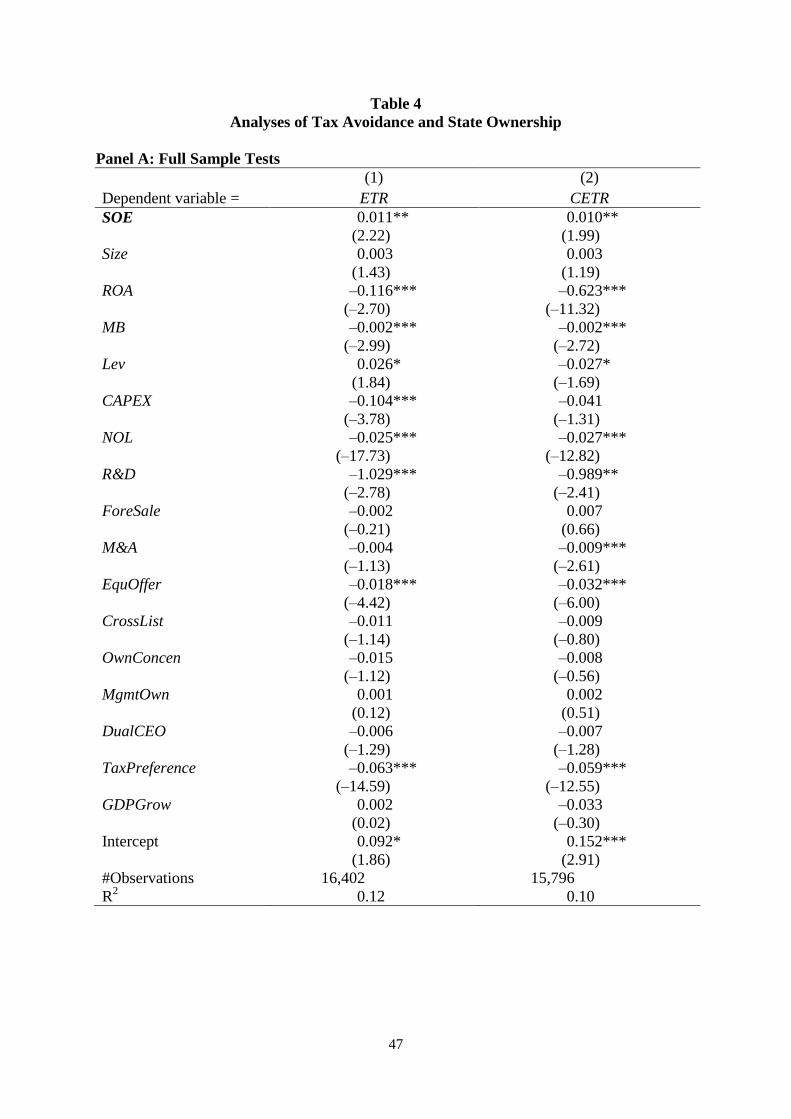
47
Table 4
Analyses of Tax Avoidance and State Ownership
Panel A: Full Sample Tests
(1) (2)
Dependent variable = ETR CETR
SOE 0.011** 0.010**
(2.22) (1.99)
Size 0.003 0.003
(1.43) (1.19)
ROA –0.116*** –0.623***
(–2.70) (–11.32)
MB –0.002*** –0.002***
(–2.99) (–2.72)
Lev 0.026* –0.027*
(1.84) (–1.69)
CAPEX –0.104*** –0.041
(–3.78) (–1.31)
NOL –0.025*** –0.027***
(–17.73) (–12.82)
R&D –1.029*** –0.989**
(–2.78) (–2.41)
ForeSale –0.002 0.007
(–0.21) (0.66)
M&A –0.004 –0.009***
(–1.13) (–2.61)
EquOffer –0.018*** –0.032***
(–4.42) (–6.00)
CrossList –0.011 –0.009
(–1.14) (–0.80)
OwnConcen –0.015 –0.008
(–1.12) (–0.56)
MgmtOwn 0.001 0.002
(0.12) (0.51)
DualCEO –0.006 –0.007
(–1.29) (–1.28)
TaxPreference –0.063*** –0.059***
(–14.59) (–12.55)
GDPGrow 0.002 –0.033
(0.02) (–0.30)
Intercept 0.092* 0.152***
(1.86) (2.91)
#Observations 16,402 15,796
R2 0.12 0.10
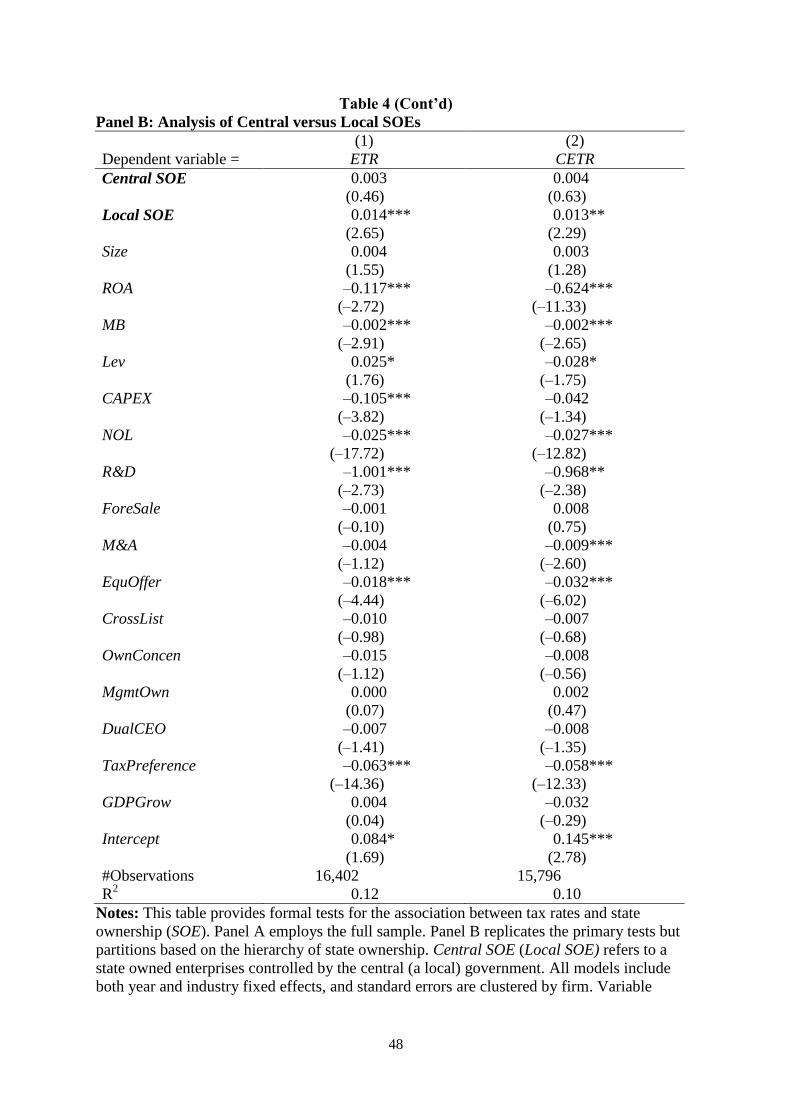
48
Table 4 (Cont’d)
Panel B: Analysis of Central versus Local SOEs
(1) (2)
Dependent variable = ETR CETR
Central SOE 0.003 0.004
(0.46) (0.63)
Local SOE 0.014*** 0.013**
(2.65) (2.29)
Size 0.004 0.003
(1.55) (1.28)
ROA –0.117*** –0.624***
(–2.72) (–11.33)
MB –0.002*** –0.002***
(–2.91) (–2.65)
Lev 0.025* –0.028*
(1.76) (–1.75)
CAPEX –0.105*** –0.042
(–3.82) (–1.34)
NOL –0.025*** –0.027***
(–17.72) (–12.82)
R&D –1.001*** –0.968**
(–2.73) (–2.38)
ForeSale –0.001 0.008
(–0.10) (0.75)
M&A –0.004 –0.009***
(–1.12) (–2.60)
EquOffer –0.018*** –0.032***
(–4.44) (–6.02)
CrossList –0.010 –0.007
(–0.98) (–0.68)
OwnConcen –0.015 –0.008
(–1.12) (–0.56)
MgmtOwn 0.000 0.002
(0.07) (0.47)
DualCEO –0.007 –0.008
(–1.41) (–1.35)
TaxPreference –0.063*** –0.058***
(–14.36) (–12.33)
GDPGrow 0.004 –0.032
(0.04) (–0.29)
Intercept 0.084* 0.145***
(1.69) (2.78)
#Observations 16,402 15,796
R2 0.12 0.10
Notes: This table provides formal tests for the association between tax rates and state
ownership (SOE). Panel A employs the full sample. Panel B replicates the primary tests but
partitions based on the hierarchy of state ownership. Central SOE (Local SOE) refers to a
state owned enterprises controlled by the central (a local) government. All models include
both year and industry fixed effects, and standard errors are clustered by firm. Variable
49
definitions are provided in Appendix. t-statistics are reported in parentheses. ***, ** and *
refer to two-tailed significance at the 0.01, 0.05 and 0.10 level, respectively.
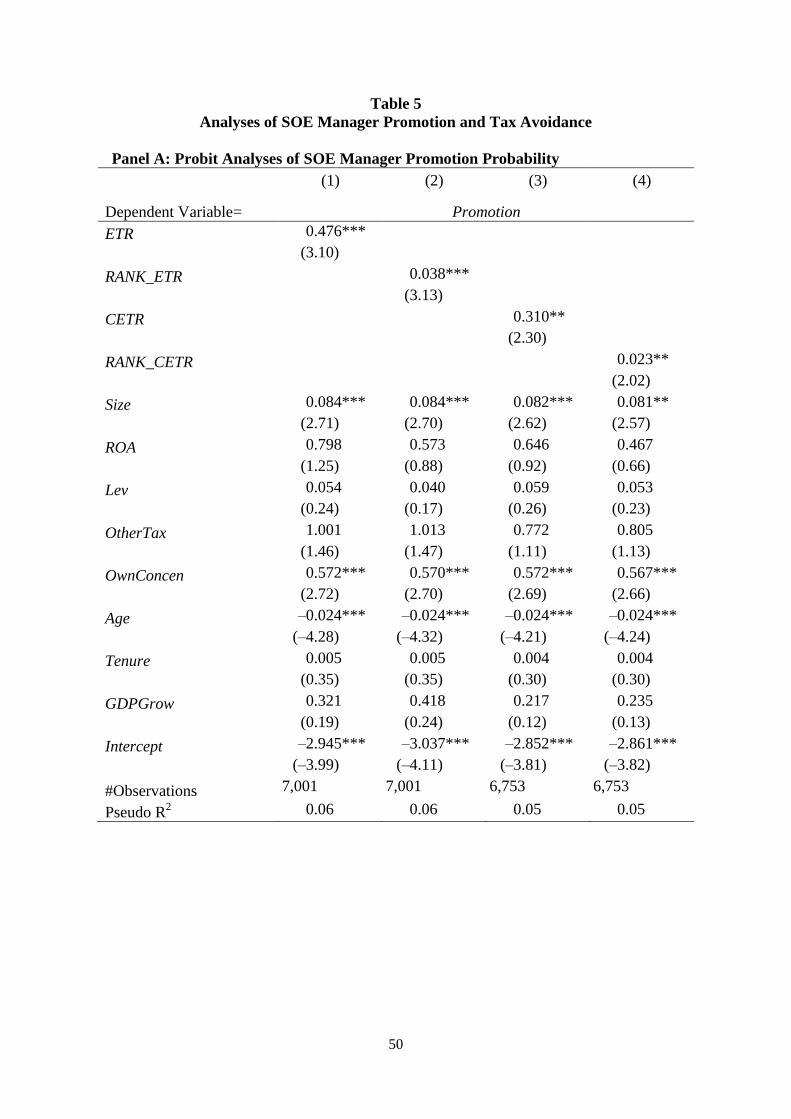
50
Table 5
Analyses of SOE Manager Promotion and Tax Avoidance
Panel A: Probit Analyses of SOE Manager Promotion Probability
(1) (2) (3) (4)
Dependent Variable= Promotion
ETR 0.476***
(3.10)
RANK_ETR 0.038***
(3.13)
CETR 0.310**
(2.30)
RANK_CETR 0.023**
(2.02)
Size 0.084*** 0.084*** 0.082*** 0.081**
(2.71) (2.70) (2.62) (2.57)
ROA 0.798 0.573 0.646 0.467
(1.25) (0.88) (0.92) (0.66)
Lev 0.054 0.040 0.059 0.053
(0.24) (0.17) (0.26) (0.23)
OtherTax 1.001 1.013 0.772 0.805
(1.46) (1.47) (1.11) (1.13)
OwnConcen 0.572*** 0.570*** 0.572*** 0.567***
(2.72) (2.70) (2.69) (2.66)
Age –0.024*** –0.024*** –0.024*** –0.024***
(–4.28) (–4.32) (–4.21) (–4.24)
Tenure 0.005 0.005 0.004 0.004
(0.35) (0.35) (0.30) (0.30)
GDPGrow 0.321 0.418 0.217 0.235
(0.19) (0.24) (0.12) (0.13)
Intercept –2.945*** –3.037*** –2.852*** –2.861***
(–3.99) (–4.11) (–3.81) (–3.82)
#Observations 7,001 7,001 6,753 6,753
Pseudo R2 0.06 0.06 0.05 0.05
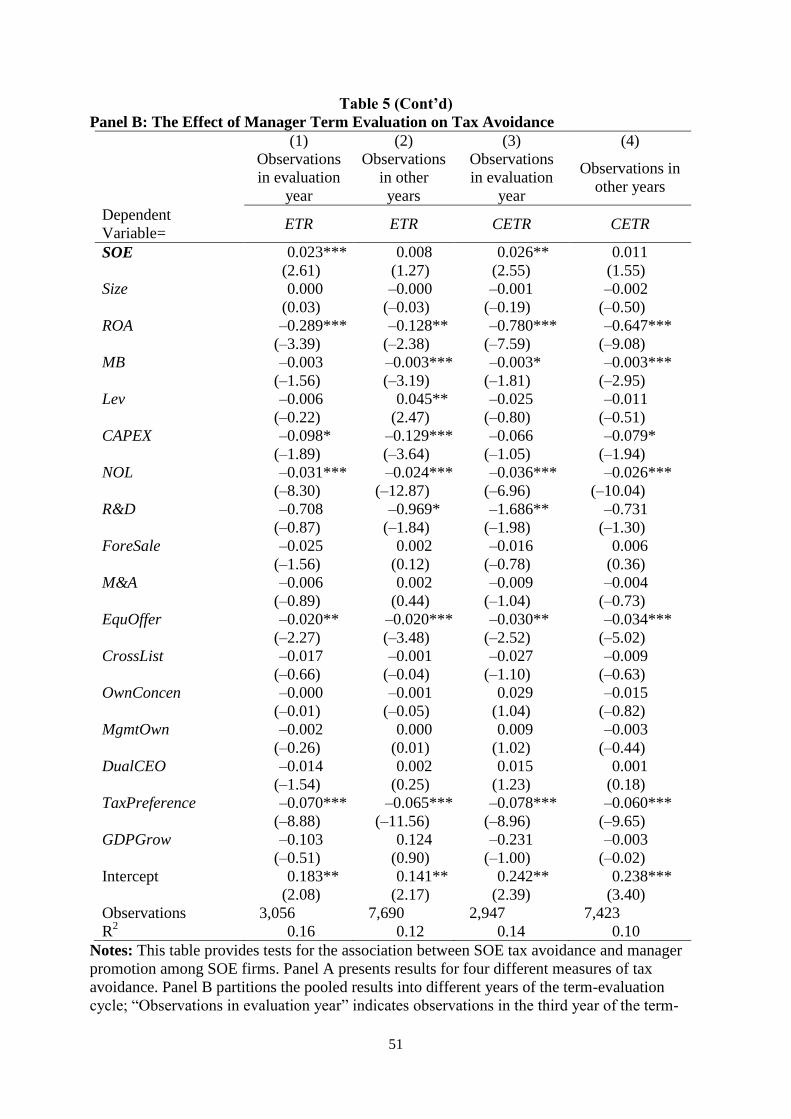
51
Table 5 (Cont’d)
Panel B: The Effect of Manager Term Evaluation on Tax Avoidance
(1) (2) (3) (4)
Observations
in evaluation
year
Observations
in other
years
Observations
in evaluation
year
Observations in
other years
Dependent
Variable= ETR ETR CETR CETR
SOE 0.023*** 0.008 0.026** 0.011
(2.61) (1.27) (2.55) (1.55)
Size 0.000 –0.000 –0.001 –0.002
(0.03) (–0.03) (–0.19) (–0.50)
ROA –0.289*** –0.128** –0.780*** –0.647***
(–3.39) (–2.38) (–7.59) (–9.08)
MB –0.003 –0.003*** –0.003* –0.003***
(–1.56) (–3.19) (–1.81) (–2.95)
Lev –0.006 0.045** –0.025 –0.011
(–0.22) (2.47) (–0.80) (–0.51)
CAPEX –0.098* –0.129*** –0.066 –0.079*
(–1.89) (–3.64) (–1.05) (–1.94)
NOL –0.031*** –0.024*** –0.036*** –0.026***
(–8.30) (–12.87) (–6.96) (–10.04)
R&D –0.708 –0.969* –1.686** –0.731
(–0.87) (–1.84) (–1.98) (–1.30)
ForeSale –0.025 0.002 –0.016 0.006
(–1.56) (0.12) (–0.78) (0.36)
M&A –0.006 0.002 –0.009 –0.004
(–0.89) (0.44) (–1.04) (–0.73)
EquOffer –0.020** –0.020*** –0.030** –0.034***
(–2.27) (–3.48) (–2.52) (–5.02)
CrossList –0.017 –0.001 –0.027 –0.009
(–0.66) (–0.04) (–1.10) (–0.63)
OwnConcen –0.000 –0.001 0.029 –0.015
(–0.01) (–0.05) (1.04) (–0.82)
MgmtOwn –0.002 0.000 0.009 –0.003
(–0.26) (0.01) (1.02) (–0.44)
DualCEO –0.014 0.002 0.015 0.001
(–1.54) (0.25) (1.23) (0.18)
TaxPreference –0.070*** –0.065*** –0.078*** –0.060***
(–8.88) (–11.56) (–8.96) (–9.65)
GDPGrow –0.103 0.124 –0.231 –0.003
(–0.51) (0.90) (–1.00) (–0.02)
Intercept 0.183** 0.141** 0.242** 0.238***
(2.08) (2.17) (2.39) (3.40)
Observations 3,056 7,690 2,947 7,423
R2 0.16 0.12 0.14 0.10
Notes: This table provides tests for the association between SOE tax avoidance and manager
promotion among SOE firms. Panel A presents results for four different measures of tax
avoidance. Panel B partitions the pooled results into different years of the term-evaluation
cycle; “Observations in evaluation year” indicates observations in the third year of the term-
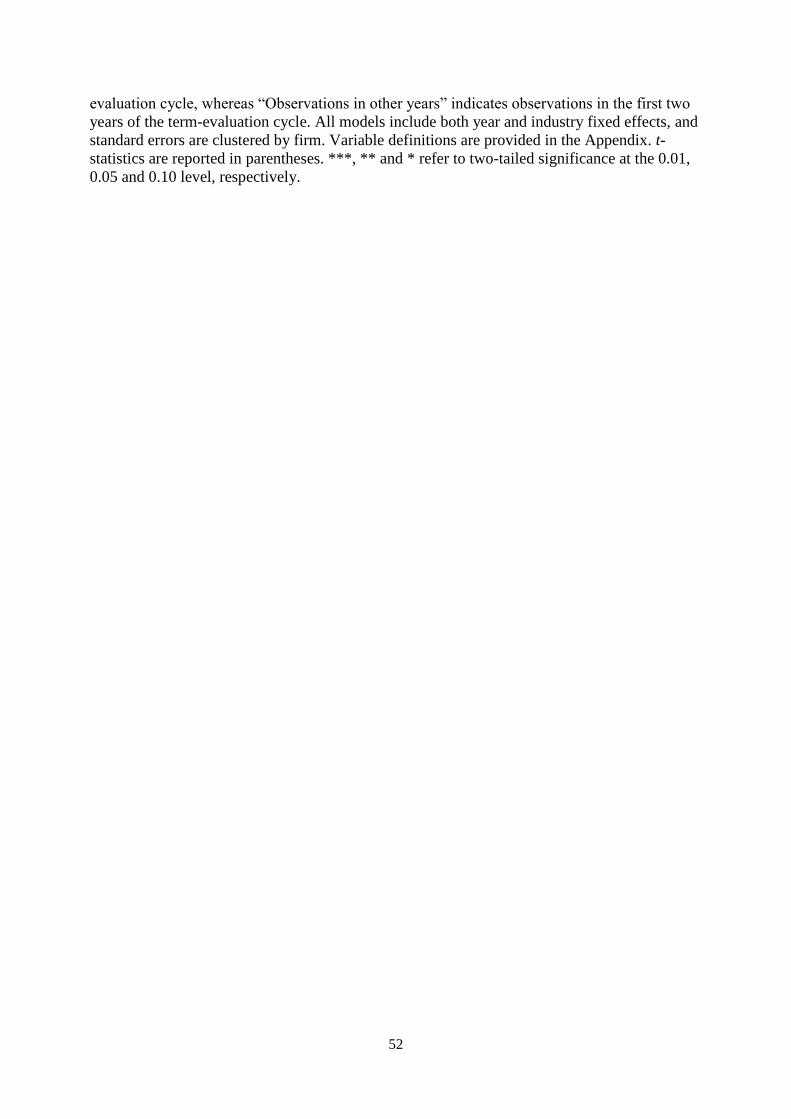
52
evaluation cycle, whereas “Observations in other years” indicates observations in the first two
years of the term-evaluation cycle. All models include both year and industry fixed effects, and
standard errors are clustered by firm. Variable definitions are provided in the Appendix. t-
statistics are reported in parentheses. ***, ** and * refer to two-tailed significance at the 0.01,
0.05 and 0.10 level, respectively.
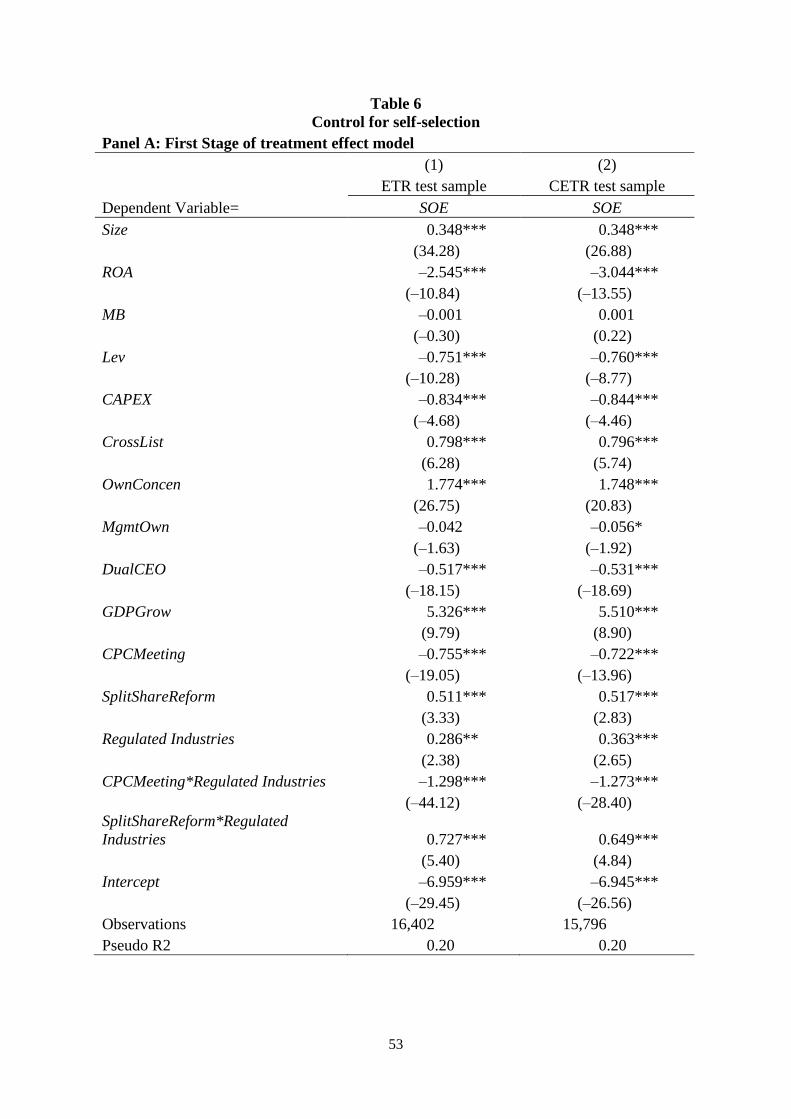
53
Table 6
Control for self-selection
Panel A: First Stage of treatment effect model
(1) (2)
ETR test sample CETR test sample
Dependent Variable= SOE SOE
Size 0.348*** 0.348***
(34.28) (26.88)
ROA –2.545*** –3.044***
(–10.84) (–13.55)
MB –0.001 0.001
(–0.30) (0.22)
Lev –0.751*** –0.760***
(–10.28) (–8.77)
CAPEX –0.834*** –0.844***
(–4.68) (–4.46)
CrossList 0.798*** 0.796***
(6.28) (5.74)
OwnConcen 1.774*** 1.748***
(26.75) (20.83)
MgmtOwn –0.042 –0.056*
(–1.63) (–1.92)
DualCEO –0.517*** –0.531***
(–18.15) (–18.69)
GDPGrow 5.326*** 5.510***
(9.79) (8.90)
CPCMeeting –0.755*** –0.722***
(–19.05) (–13.96)
SplitShareReform 0.511*** 0.517***
(3.33) (2.83)
Regulated Industries 0.286** 0.363***
(2.38) (2.65)
CPCMeeting*Regulated Industries –1.298*** –1.273***
(–44.12) (–28.40)
SplitShareReform*Regulated
Industries 0.727*** 0.649***
(5.40) (4.84)
Intercept –6.959*** –6.945***
(–29.45) (–26.56)
Observations 16,402 15,796
Pseudo R2 0.20 0.20
54
Panel B: Second Stage of treatment effect model
(1) (2)
Dependent Variable= ETR CETR
SOE 0.053*** 0.053***
(2.74) (2.68)
Size –0.001 –0.001
(–0.34) (–0.41)
ROA –0.084*** –0.585***
(–2.58) (–12.73)
MB –0.002*** –0.002***
(–3.68) (–2.67)
Lev 0.033*** –0.019
(3.08) (–1.46)
CAPEX –0.094*** –0.031
(–4.45) (–1.00)
NOL –0.025*** –0.027***
(–21.97) (–14.05)
R&D –1.013*** –0.974**
(–3.60) (–2.53)
ForeSale –0.002 0.008
(–0.19) (0.76)
M&A –0.004 –0.010**
(–1.21) (–2.54)
EquOffer –0.019*** –0.032***
(–3.71) (–7.68)
CrossList –0.014* –0.011
(–1.72) (–1.01)
OwnConcen –0.035*** –0.028**
(–2.69) (–2.50)
MgmtOwn 0.001 0.003
(0.47) (0.74)
DualCEO 0.001 0.000
(0.14) (0.02)
TaxPreference –0.063*** –0.059***
(–20.44) (–15.74)
GDPGrow –0.067 –0.105
(–0.80) (–1.12)
Lambda –0.026** –0.026**
(–2.18) (–2.22)
Intercept 0.153*** 0.212***
(3.66) (3.89)
#Observations 16,402 15,796
R2 0.12 0.10
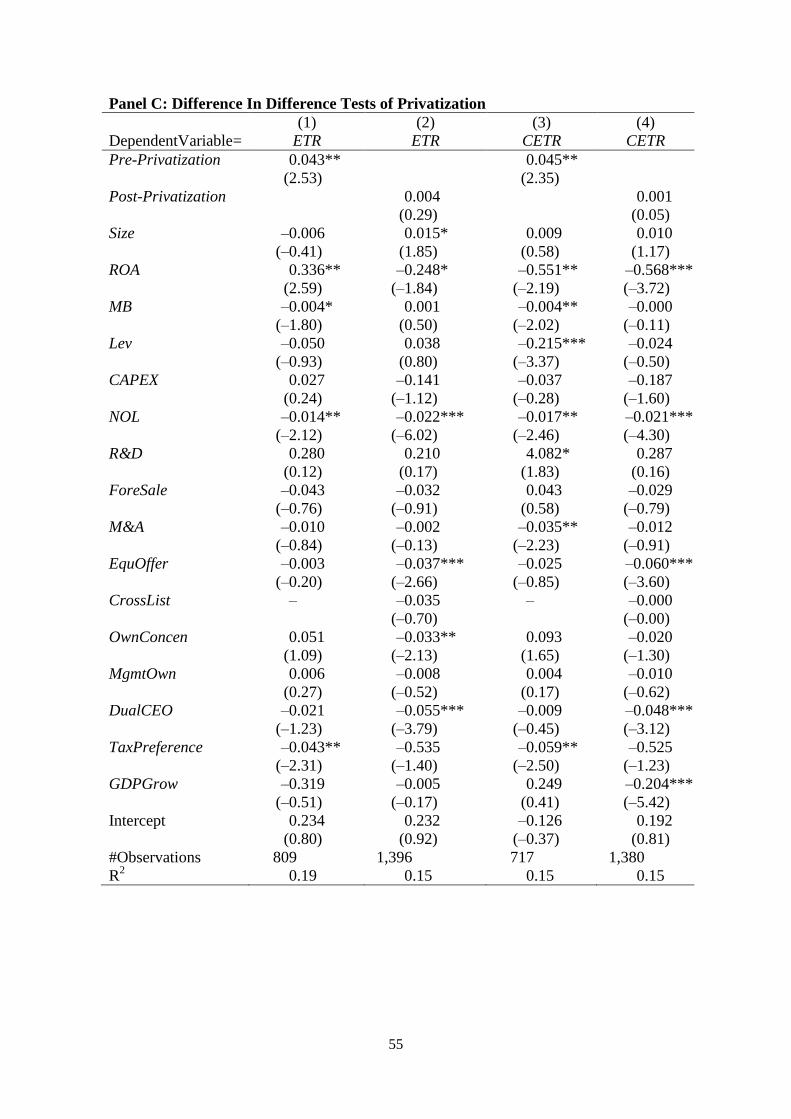
55
Panel C: Difference In Difference Tests of Privatization
(1) (2) (3) (4)
DependentVariable= ETR ETR CETR CETR
Pre-Privatization 0.043** 0.045**
(2.53) (2.35)
Post-Privatization 0.004 0.001
(0.29) (0.05)
Size –0.006 0.015* 0.009 0.010
(–0.41) (1.85) (0.58) (1.17)
ROA 0.336** –0.248* –0.551** –0.568***
(2.59) (–1.84) (–2.19) (–3.72)
MB –0.004* 0.001 –0.004** –0.000
(–1.80) (0.50) (–2.02) (–0.11)
Lev –0.050 0.038 –0.215*** –0.024
(–0.93) (0.80) (–3.37) (–0.50)
CAPEX 0.027 –0.141 –0.037 –0.187
(0.24) (–1.12) (–0.28) (–1.60)
NOL –0.014** –0.022*** –0.017** –0.021***
(–2.12) (–6.02) (–2.46) (–4.30)
R&D 0.280 0.210 4.082* 0.287
(0.12) (0.17) (1.83) (0.16)
ForeSale –0.043 –0.032 0.043 –0.029
(–0.76) (–0.91) (0.58) (–0.79)
M&A –0.010 –0.002 –0.035** –0.012
(–0.84) (–0.13) (–2.23) (–0.91)
EquOffer –0.003 –0.037*** –0.025 –0.060***
(–0.20) (–2.66) (–0.85) (–3.60)
CrossList – –0.035 – –0.000
(–0.70) (–0.00)
OwnConcen 0.051 –0.033** 0.093 –0.020
(1.09) (–2.13) (1.65) (–1.30)
MgmtOwn 0.006 –0.008 0.004 –0.010
(0.27) (–0.52) (0.17) (–0.62)
DualCEO –0.021 –0.055*** –0.009 –0.048***
(–1.23) (–3.79) (–0.45) (–3.12)
TaxPreference –0.043** –0.535 –0.059** –0.525
(–2.31) (–1.40) (–2.50) (–1.23)
GDPGrow –0.319 –0.005 0.249 –0.204***
(–0.51) (–0.17) (0.41) (–5.42)
Intercept 0.234 0.232 –0.126 0.192
(0.80) (0.92) (–0.37) (0.81)
#Observations 809 1,396 717 1,380
R2 0.19 0.15 0.15 0.15
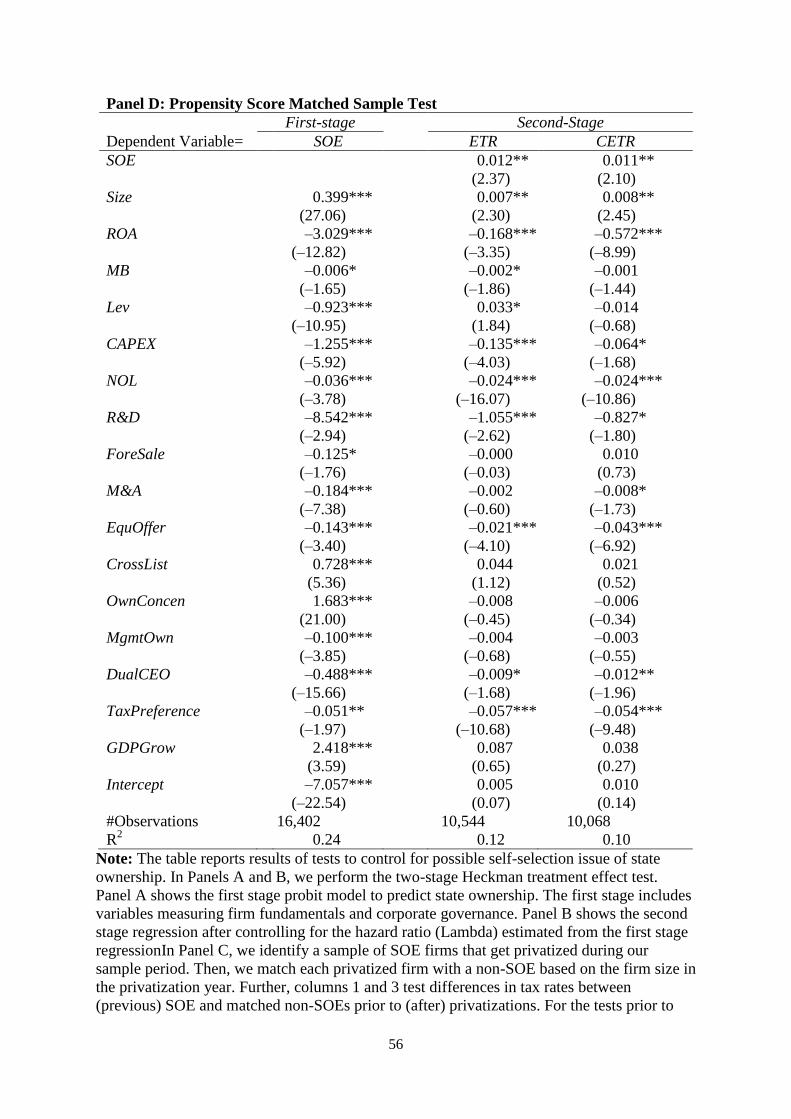
56
Panel D: Propensity Score Matched Sample Test
First-stage
Second-Stage
Dependent Variable= SOE ETR CETR
SOE
0.012** 0.011**
(2.37) (2.10)
Size 0.399***
0.007** 0.008**
(27.06)
(2.30) (2.45)
ROA –3.029***
–0.168*** –0.572***
(–12.82)
(–3.35) (–8.99)
MB –0.006*
–0.002* –0.001
(–1.65)
(–1.86) (–1.44)
Lev –0.923***
0.033* –0.014
(–10.95)
(1.84) (–0.68)
CAPEX –1.255***
–0.135*** –0.064*
(–5.92)
(–4.03) (–1.68)
NOL –0.036***
–0.024*** –0.024***
(–3.78)
(–16.07) (–10.86)
R&D –8.542***
–1.055*** –0.827*
(–2.94)
(–2.62) (–1.80)
ForeSale –0.125*
–0.000 0.010
(–1.76)
(–0.03) (0.73)
M&A –0.184***
–0.002 –0.008*
(–7.38)
(–0.60) (–1.73)
EquOffer –0.143***
–0.021*** –0.043***
(–3.40)
(–4.10) (–6.92)
CrossList 0.728***
0.044 0.021
(5.36)
(1.12) (0.52)
OwnConcen 1.683***
–0.008 –0.006
(21.00)
(–0.45) (–0.34)
MgmtOwn –0.100***
–0.004 –0.003
(–3.85)
(–0.68) (–0.55)
DualCEO –0.488***
–0.009* –0.012**
(–15.66)
(–1.68) (–1.96)
TaxPreference –0.051**
–0.057*** –0.054***
(–1.97)
(–10.68) (–9.48)
GDPGrow 2.418***
0.087 0.038
(3.59)
(0.65) (0.27)
Intercept –7.057***
0.005 0.010
(–22.54)
(0.07) (0.14)
#Observations 16,402
10,544 10,068
R2 0.24 0.12 0.10
Note: The table reports results of tests to control for possible self-selection issue of state
ownership. In Panels A and B, we perform the two-stage Heckman treatment effect test.
Panel A shows the first stage probit model to predict state ownership. The first stage includes
variables measuring firm fundamentals and corporate governance. Panel B shows the second
stage regression after controlling for the hazard ratio (Lambda) estimated from the first stage
regressionIn Panel C, we identify a sample of SOE firms that get privatized during our
sample period. Then, we match each privatized firm with a non-SOE based on the firm size in
the privatization year. Further, columns 1 and 3 test differences in tax rates between
(previous) SOE and matched non-SOEs prior to (after) privatizations. For the tests prior to
57
privatizations, we do not include “CrossList”, because no firms are cross listed in the test
samples. In Panel D, we provide one to one propensity score matched sample tests. Variable
definitions are provided in the Appendix. Panels B, C and D include both year and industry
fixed effects, and standard errors are clustered by firm. t-statistics are reported in parentheses.
***, ** and * refer to two-tailed significance at the 0.01, 0.05 and 0.10 level, respectively.
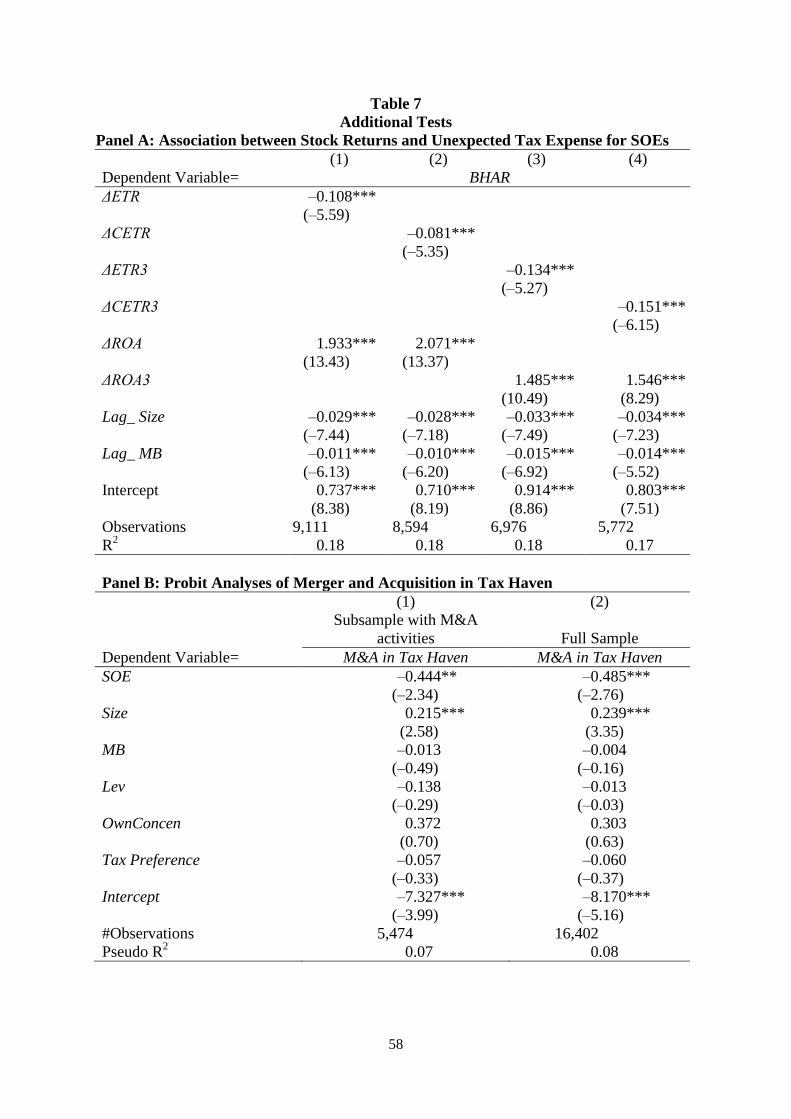
58
Table 7
Additional Tests
Panel A: Association between Stock Returns and Unexpected Tax Expense for SOEs
(1) (2) (3) (4)
Dependent Variable= BHAR
ΔETR –0.108***
(–5.59)
ΔCETR –0.081***
(–5.35)
ΔETR3 –0.134***
(–5.27)
ΔCETR3 –0.151***
(–6.15)
ΔROA 1.933*** 2.071***
(13.43) (13.37)
ΔROA3 1.485*** 1.546***
(10.49) (8.29)
Lag_ Size –0.029*** –0.028*** –0.033*** –0.034***
(–7.44) (–7.18) (–7.49) (–7.23)
Lag_ MB –0.011*** –0.010*** –0.015*** –0.014***
(–6.13) (–6.20) (–6.92) (–5.52)
Intercept 0.737*** 0.710*** 0.914*** 0.803***
(8.38) (8.19) (8.86) (7.51)
Observations 9,111 8,594 6,976 5,772
R2 0.18 0.18 0.18 0.17
Panel B: Probit Analyses of Merger and Acquisition in Tax Haven
(1) (2)
Subsample with M&A
activities Full Sample
Dependent Variable= M&A in Tax Haven M&A in Tax Haven
SOE –0.444** –0.485***
(–2.34) (–2.76)
Size 0.215*** 0.239***
(2.58) (3.35)
MB –0.013 –0.004
(–0.49) (–0.16)
Lev –0.138 –0.013
(–0.29) (–0.03)
OwnConcen 0.372 0.303
(0.70) (0.63)
Tax Preference –0.057 –0.060
(–0.33) (–0.37)
Intercept –7.327*** –8.170***
(–3.99) (–5.16)
#Observations 5,474 16,402
Pseudo R2 0.07 0.08
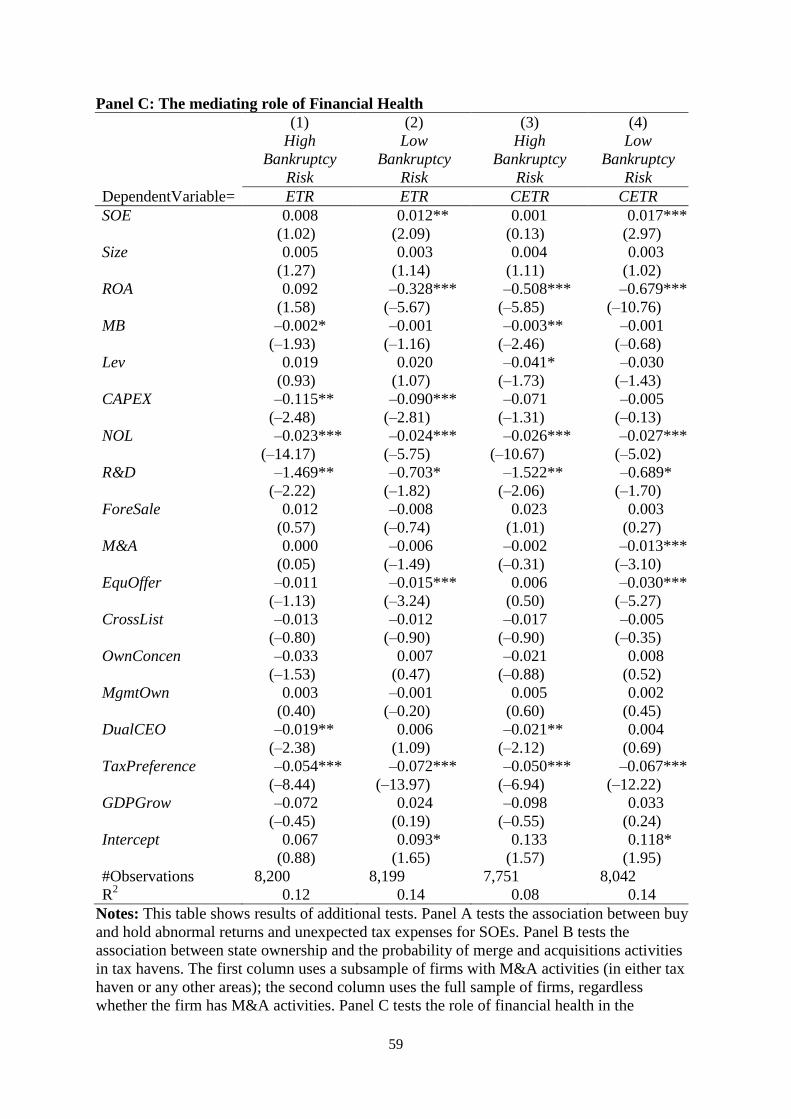
59
Panel C: The mediating role of Financial Health
(1) (2) (3) (4)
High
Bankruptcy
Risk
Low
Bankruptcy
Risk
High
Bankruptcy
Risk
Low
Bankruptcy
Risk
DependentVariable= ETR ETR CETR CETR
SOE 0.008 0.012** 0.001 0.017***
(1.02) (2.09) (0.13) (2.97)
Size 0.005 0.003 0.004 0.003
(1.27) (1.14) (1.11) (1.02)
ROA 0.092 –0.328*** –0.508*** –0.679***
(1.58) (–5.67) (–5.85) (–10.76)
MB –0.002* –0.001 –0.003** –0.001
(–1.93) (–1.16) (–2.46) (–0.68)
Lev 0.019 0.020 –0.041* –0.030
(0.93) (1.07) (–1.73) (–1.43)
CAPEX –0.115** –0.090*** –0.071 –0.005
(–2.48) (–2.81) (–1.31) (–0.13)
NOL –0.023*** –0.024*** –0.026*** –0.027***
(–14.17) (–5.75) (–10.67) (–5.02)
R&D –1.469** –0.703* –1.522** –0.689*
(–2.22) (–1.82) (–2.06) (–1.70)
ForeSale 0.012 –0.008 0.023 0.003
(0.57) (–0.74) (1.01) (0.27)
M&A 0.000 –0.006 –0.002 –0.013***
(0.05) (–1.49) (–0.31) (–3.10)
EquOffer –0.011 –0.015*** 0.006 –0.030***
(–1.13) (–3.24) (0.50) (–5.27)
CrossList –0.013 –0.012 –0.017 –0.005
(–0.80) (–0.90) (–0.90) (–0.35)
OwnConcen –0.033 0.007 –0.021 0.008
(–1.53) (0.47) (–0.88) (0.52)
MgmtOwn 0.003 –0.001 0.005 0.002
(0.40) (–0.20) (0.60) (0.45)
DualCEO –0.019** 0.006 –0.021** 0.004
(–2.38) (1.09) (–2.12) (0.69)
TaxPreference –0.054*** –0.072*** –0.050*** –0.067***
(–8.44) (–13.97) (–6.94) (–12.22)
GDPGrow –0.072 0.024 –0.098 0.033
(–0.45) (0.19) (–0.55) (0.24)
Intercept 0.067 0.093* 0.133 0.118*
(0.88) (1.65) (1.57) (1.95)
#Observations 8,200 8,199 7,751 8,042
R2 0.12 0.14 0.08 0.14
Notes: This table shows results of additional tests. Panel A tests the association between buy
and hold abnormal returns and unexpected tax expenses for SOEs. Panel B tests the
association between state ownership and the probability of merge and acquisitions activities
in tax havens. The first column uses a subsample of firms with M&A activities (in either tax
haven or any other areas); the second column uses the full sample of firms, regardless
whether the firm has M&A activities. Panel C tests the role of financial health in the

60
association between state ownership and tax rates. Specifically, we split the sample based on
the median of bankruptcy risk. Variable definitions are provided in the Appendix. Panels A
and C include both year and industry fixed effects, and standard errors are clustered by firm.
t-statistics are reported in parentheses. ***, ** and * refer to two-tailed significance at the
0.01, 0.05 and 0.10 level, respectively.
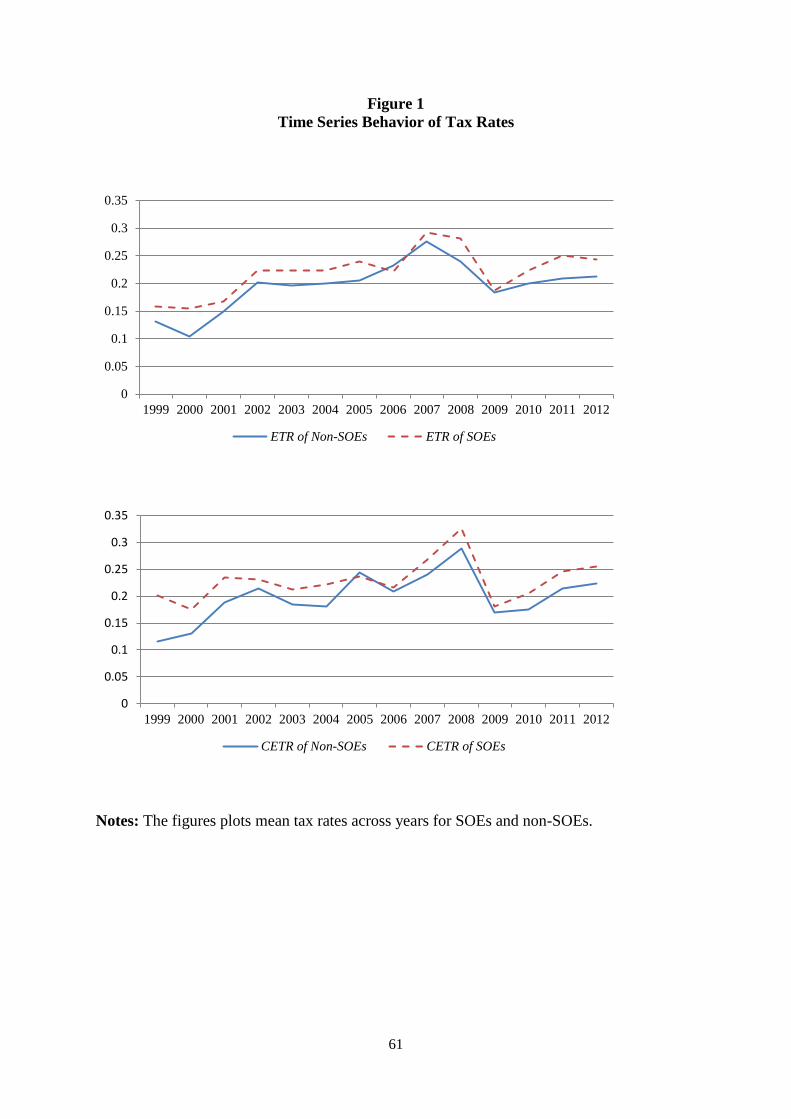
61
Figure 1
Time Series Behavior of Tax Rates
Notes: The figures plots mean tax rates across years for SOEs and non-SOEs.
0
0.05
0.1
0.15
0.2
0.25
0.3
0.35
1999 2000 2001 2002 2003 2004 2005 2006 2007 2008 2009 2010 2011 2012
ETR of Non-SOEs ETR of SOEs
0
0.05
0.1
0.15
0.2
0.25
0.3
0.35
1999 2000 2001 2002 2003 2004 2005 2006 2007 2008 2009 2010 2011 2012
CETR of Non-SOEs CETR of SOEs
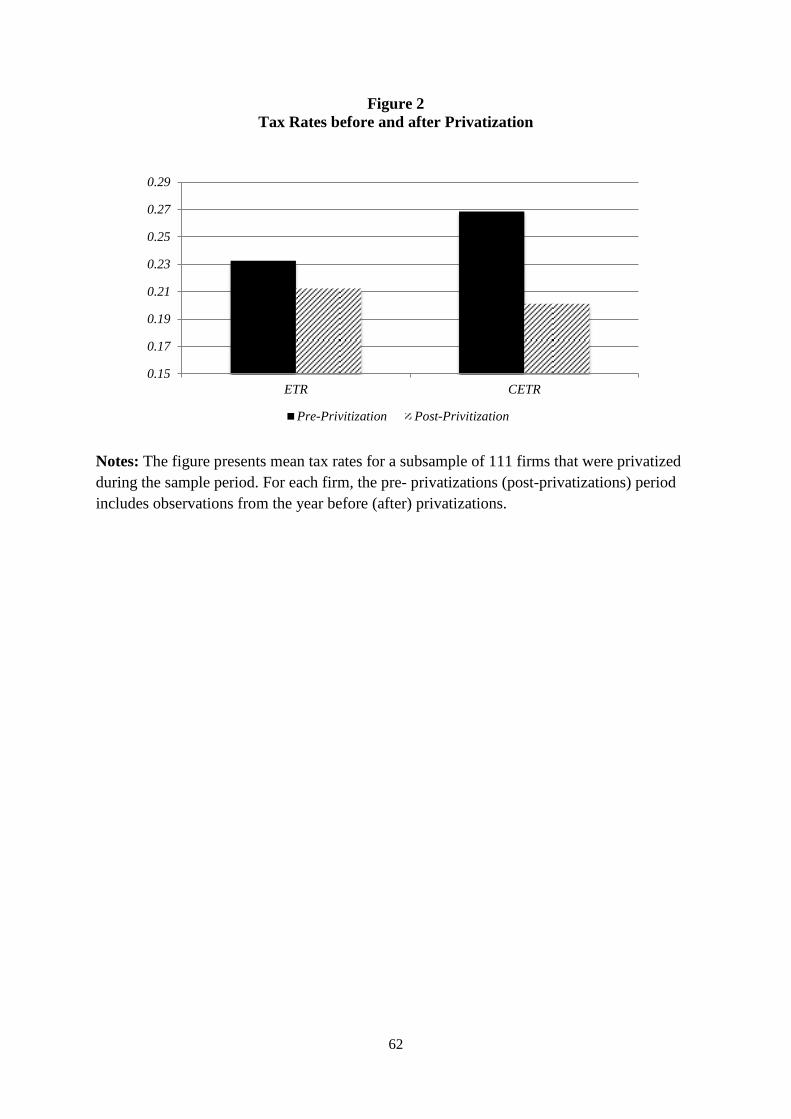
62
Figure 2
Tax Rates before and after Privatization
Notes: The figure presents mean tax rates for a subsample of 111 firms that were privatized
during the sample period. For each firm, the pre- privatizations (post-privatizations) period
includes observations from the year before (after) privatizations.
0.15
0.17
0.19
0.21
0.23
0.25
0.27
0.29
ETR CETR
Pre-Privitization Post-Privitization
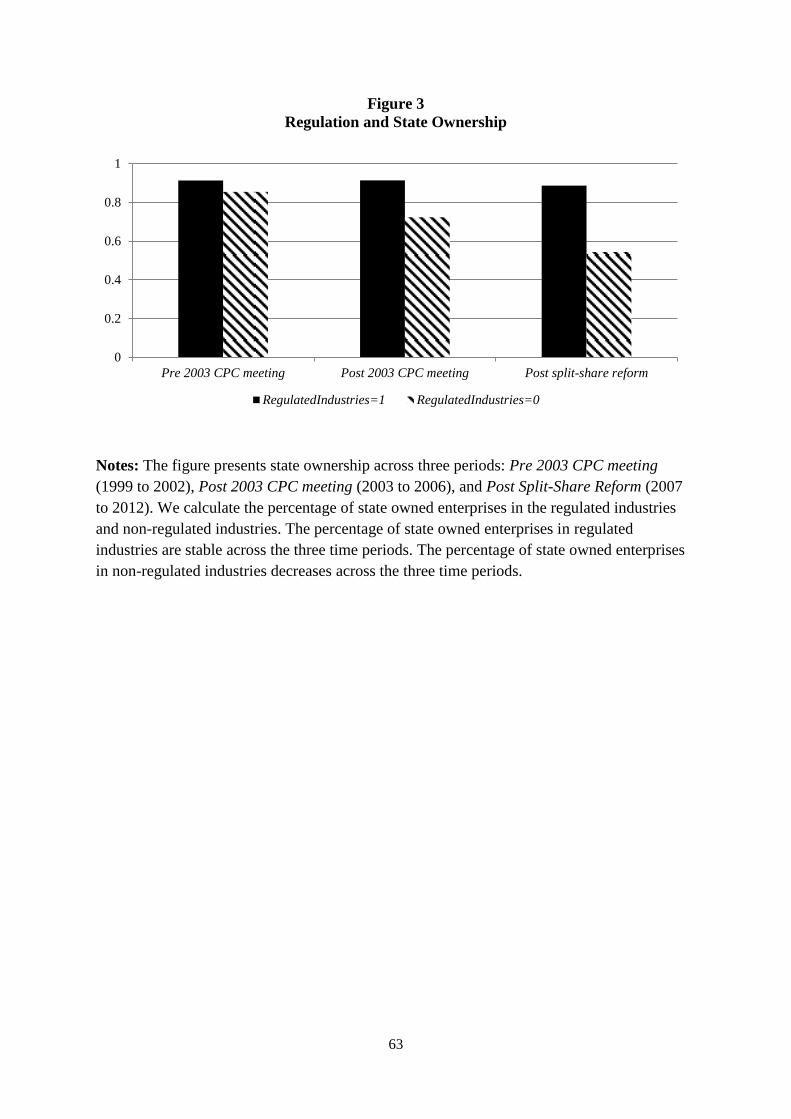
63
Figure 3
Regulation and State Ownership
Notes: The figure presents state ownership across three periods: Pre 2003 CPC meeting
(1999 to 2002), Post 2003 CPC meeting (2003 to 2006), and Post Split-Share Reform (2007
to 2012). We calculate the percentage of state owned enterprises in the regulated industries
and non-regulated industries. The percentage of state owned enterprises in regulated
industries are stable across the three time periods. The percentage of state owned enterprises
in non-regulated industries decreases across the three time periods.
0
0.2
0.4
0.6
0.8
1
Pre 2003 CPC meeting Post 2003 CPC meeting Post split-share reform
RegulatedIndustries=1 RegulatedIndustries=0
Recommended


![CISG AC Opinion No 9 Consequences of Avoidance of the ... · primary obligations of the parties include the seller’s obligations to make delivery and transfer ownership[9] 9 and](https://img.pdfslide.us/doc/110x75/5ebcfdb4bca76071cb521969/cisg-ac-opinion-no-9-consequences-of-avoidance-of-the-primary-obligations-of.jpg)