W I L L I A M E D W A R D S
P R O F . E M E R I T U S
I O W A S T A T E U N I V E R S I T Y
Outlook for Farmland Values and Cash Rents

Tract 1 sold for $396,425 or $5,050 per acre,
and Tract 2 sold for $273,600 or $3,600 per acre!
Average farmland value in Mahaska Co. was
$7,366 in November 2013 based on ISU survey.
Mahaska County, IA Land Auction
Two Farms SOLD today!
Farmland values and cash rents are always news!
“Results from this survey suggest that cash rents in 2014 will be slightly below 2013 levels.” (Schnitkey, Sept. 3, 2013)
OSU economist: “2014 Ohio farm land values flat or in decline” (Ward, Dec. 1, 2013)
“At this point in time, land prices appear to be moving gradually lower without significant volatility," states Goss. (July 14, 2014)
“The value of cropland in Nebraska continues its upward climb, rising 6.6 percent from a year ago to an average of $5,180 an acre.” USDA (Aug. 2, 2014)
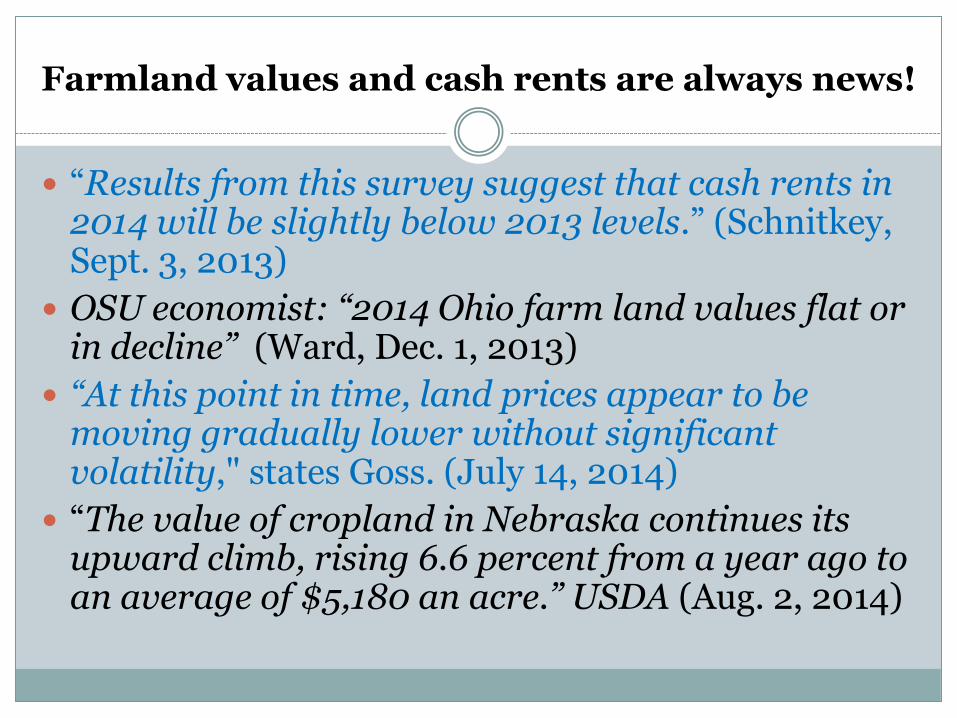
USDA Cash Rent Estimates
State 2013 2014 % change ILLINOIS $ 223 $ 234 4.9% INDIANA $ 192 $ 195 1.6%
IOWA $ 255 $ 260 2.0% KANSAS $ 63 $ 62 -0.8%
KENTUCKY $ 149 $ 148 -0.7% MICHIGAN $ 118 $ 123 4.2%
MINNESOTA $ 178 $ 186 4.5% MISSOURI $ 121 $ 132 9.1% NEBRASKA $ 203 $ 205 1.0%
NEW MEXICO $ 105 $ 93 -11.4% NORTH DAKOTA $ 65 $ 68 4.6%
OHIO $ 139 $ 144 3.6% OKLAHOMA $ 34 $ 34 0.0%
SOUTH DAKOTA $ 105 $ 116 10.5% WISCONSIN $ 124 $ 135 8.9%

Iowa Cash Rent Survey Comparisons
USDA Survey ISU Survey
Year $/acre % change $/acre % change
2010 176 1% 184 1%
2011 196 11% 214 16%
2012 235 20% 252 18%
2013 255 9% 270 7%
2014 260 2% 260 -4%

Returns to Land Identity
Yield x Price
+ USDA payments
+ MPCI indemnities
- Nonland costs of production
= Net return to land
- Cash rent
= Tenant’s “profit”

Data 1990-2013/2014
Yields: NASS state averages
Prices: USDA marketing year prices
Costs: ISU budgets
USDA payments: NASS or EWG
MPCI indemnities: RMA
Rents: USDA survey or ISU survey

$-
$50.00
$100.00
$150.00
$200.00
$250.00
$300.00
$350.00
$400.00
$450.00
$500.00
$/acre
Annual Net Return to Land, Corn and Soybeans, and Cash Rents (Iowa)
Net Return to Land Cash Rent
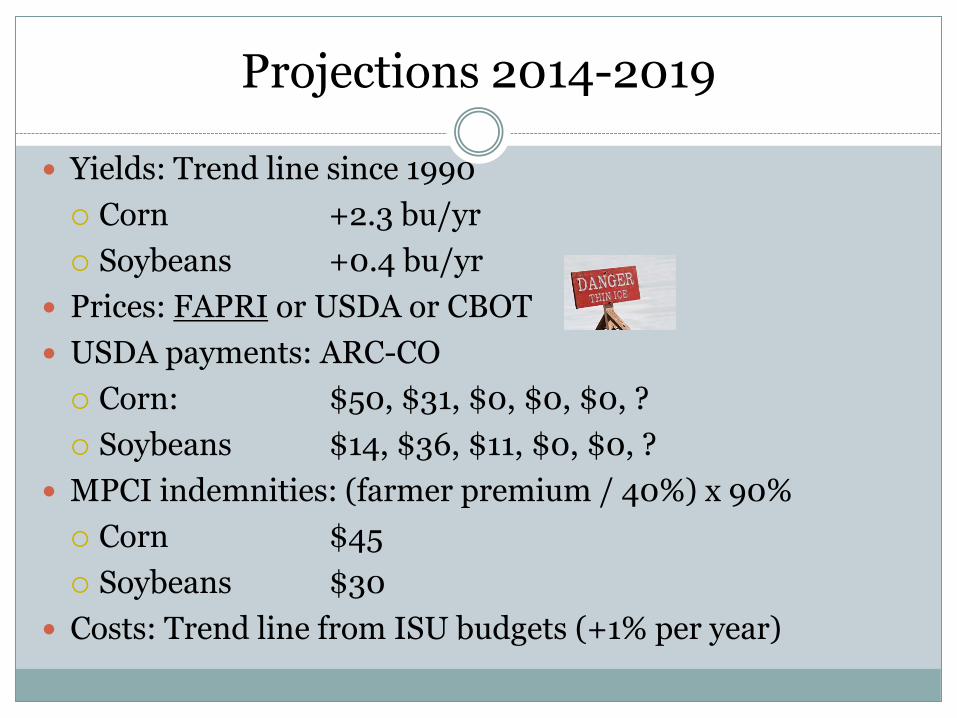
Projections 2014-2019
Yields: Trend line since 1990
Corn +2.3 bu/yr
Soybeans +0.4 bu/yr
Prices: FAPRI or USDA or CBOT
USDA payments: ARC-CO
Corn: $50, $31, $0, $0, $0, ?
Soybeans $14, $36, $11, $0, $0, ?
MPCI indemnities: (farmer premium / 40%) x 90%
Corn $45
Soybeans $30
Costs: Trend line from ISU budgets (+1% per year)

Corn Price Estimates (U.S. marketing year prices)
Source FAPRI USDA OPTIMISTIC 2013 $ 4.42 $ 4.50 $ 4.45 2014 $ 4.17 $ 3.65 $ 4.60 2015 $ 4.09 $ 3.30 $ 4.60 2016 $ 4.07 $ 3.35 $ 4.60 2017 $ 4.06 $ 3.45 $ 4.60 2018 $ 4.04 $ 3.60 $ 4.60 2019 $ 4.02 $ 3.75 $ 4.60
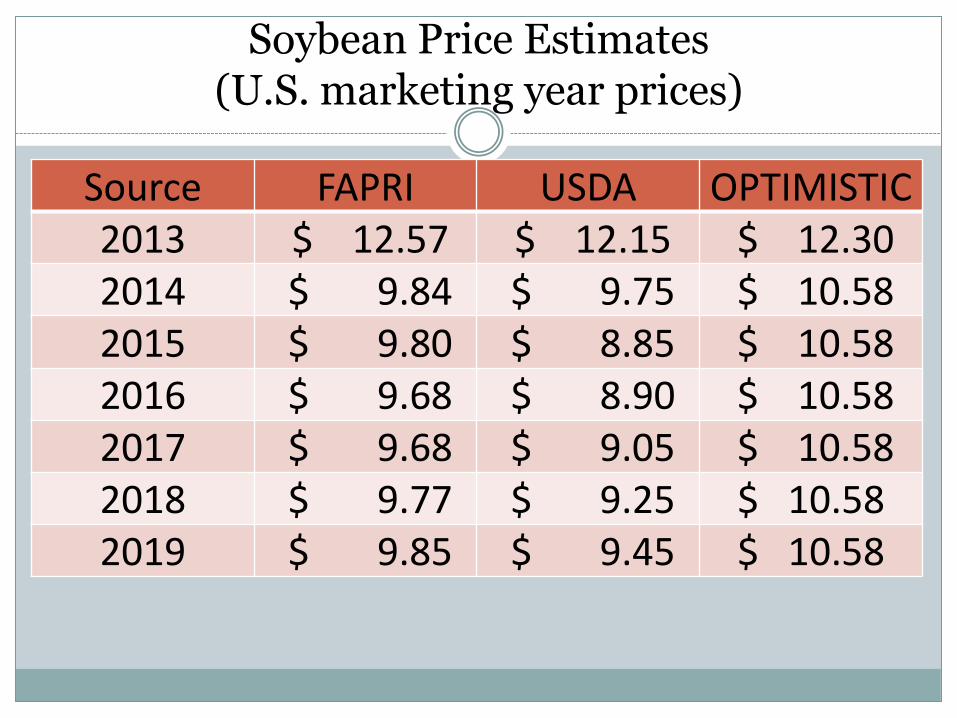
Soybean Price Estimates (U.S. marketing year prices)
Source FAPRI USDA OPTIMISTIC 2013 $ 12.57 $ 12.15 $ 12.30 2014 $ 9.84 $ 9.75 $ 10.58 2015 $ 9.80 $ 8.85 $ 10.58 2016 $ 9.68 $ 8.90 $ 10.58 2017 $ 9.68 $ 9.05 $ 10.58 2018 $ 9.77 $ 9.25 $ 10.58 2019 $ 9.85 $ 9.45 $ 10.58

$-
$50.00
$100.00
$150.00
$200.00
$250.00
$300.00
$350.00
$400.00
$450.00
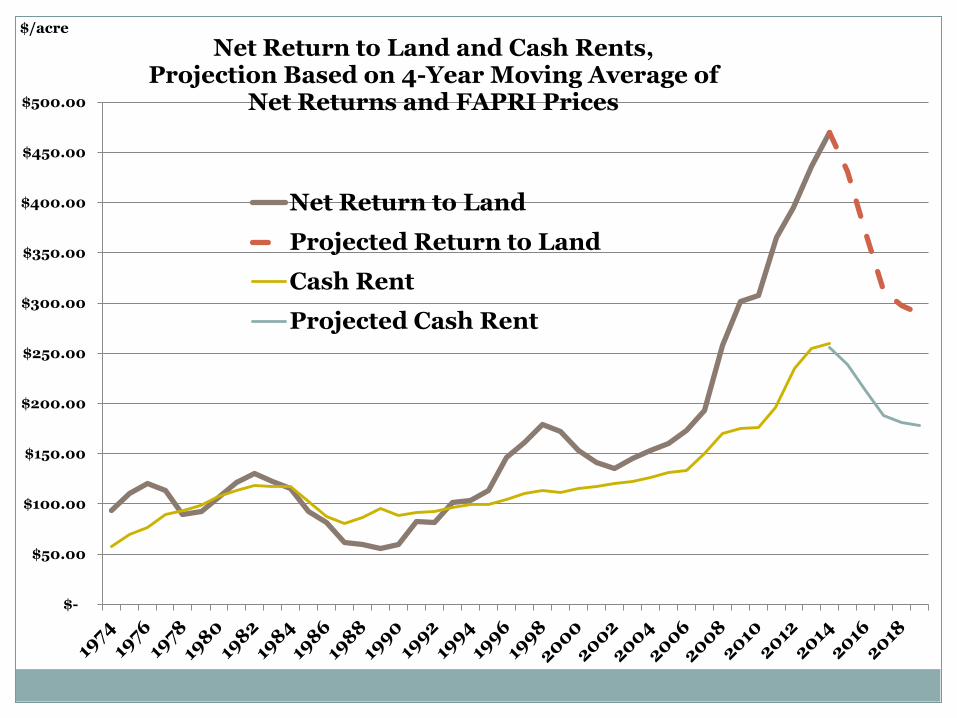
$500.00 $/acre Net Return to Land and Cash Rents, Projection Based on 4-Year Moving Average of
Net Returns and FAPRI Prices
Net Return to Land
Projected Return to Land
Cash Rent

Cash Rents?
Look at historical relationship since 1975.
Regress cash rent on net return to land
Current year
3-year moving average
4-year moving average
5-year moving average

$-
$50
$100
$150
$200
$250
$300
$/acre
Iowa Cash Rents, Actual & Projected
3-yr avg
4-yr avg
5-yr avg
Actual Rent
$-
$50.00
$100.00
$150.00
$200.00
$250.00
$300.00
$350.00
$400.00
$450.00
$500.00
$/acre
Net Return to Land and Cash Rents, Projection Based on 4-Year Moving Average of
Net Returns and FAPRI Prices
Net Return to Land
Projected Return to Land
Cash Rent
Projected Cash Rent

Projected Iowa Average Cash Rent (based on alternative price scenarios)
$243
$221
$203 $207 $207
$239
$213
$188 $182 $178
$236
$203 $173
$159 $151
$-
$25
$50
$75
$100
$125
$150
$175
$200
$225
$250
$275
2015 2016 2017 2018 2019
Optimistic
FAPRI
USDA

Are rents “sticky downward”?
“They think the tenants should bleed for a while and give the profits from previous years to the landlords.” – ISU Extension field specialist, quoting landowners.
Most operators still have some liquidity to burn.


Iowa Land Value Surveys
ISU (November, ag realtor survey) Farmland: $8,716 (up 5.1% annually)
USDA (January, farmer survey) Cropland: $8,750 (up 9.4% annually)
Pasture: $3,400 (up 5.5% annually)
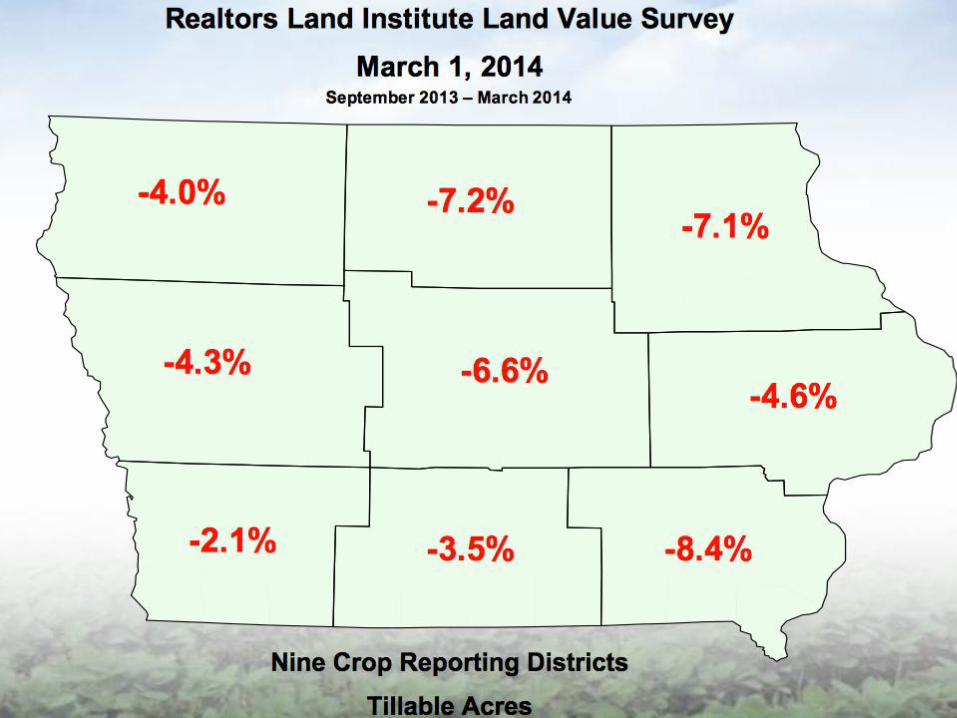
Iowa Realtors Land Institute (April, ag realtor survey) Cropland: $8,286 (down 5.4% since Sept.)
Pasture: $2,736 (up 2% since Sept.)
Federal Reserve Bank of Chicago (April, bank survey) “Good” farmland: down 2% annually
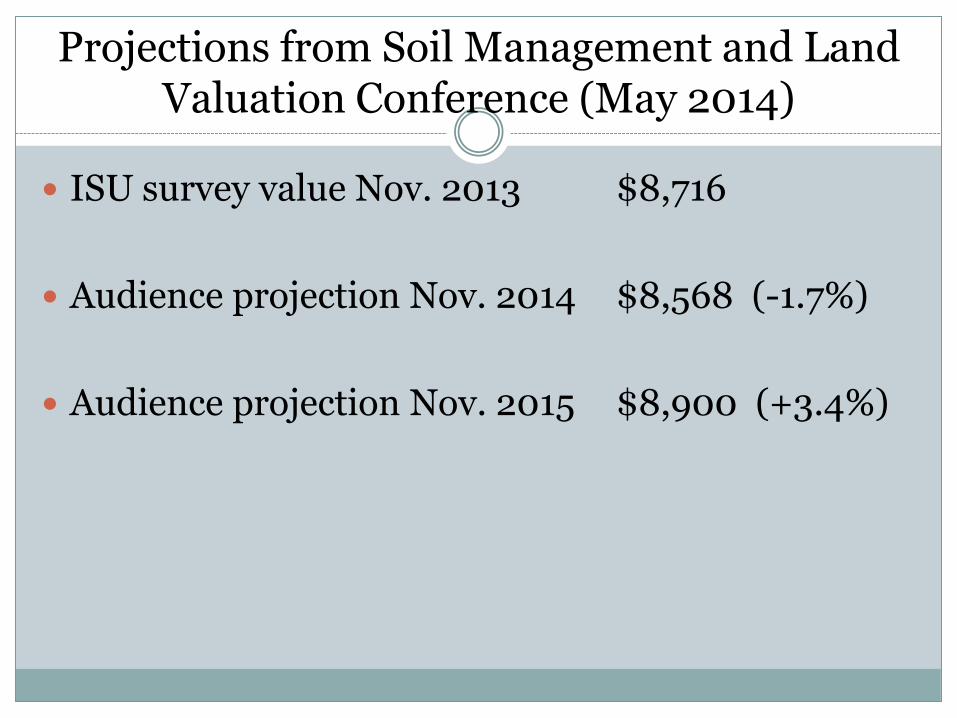
Projections from Soil Management and Land Valuation Conference (May 2014)
ISU survey value Nov. 2013 $8,716
Audience projection Nov. 2014 $8,568 (-1.7%)
Audience projection Nov. 2015 $8,900 (+3.4%)

USDA Land Value Estimates
State 2013 Original 2013 Revised 2014 % change ILLINOIS $ 7,900 $ 7,190 $ 7,700 7.1% INDIANA $ 7,100 $ 6,590 $ 7,050 7.0%
IOWA $ 8,600 $ 8,000 $ 8,750 9.4% KANSAS $ 2,100 $ 1,930 $ 2,260 17.1%
KENTUCKY $ 3,750 $ 3,430 $ 3,550 3.5% MICHIGAN $ 4,600 $ 4,120 $ 4,500 9.2%
MINNESOTA $ 4,850 $ 4,390 $ 4,870 10.9% MISSOURI $ 3,800 $ 3,500 $ 3,810 8.9% NEBRASKA $ 5,330 $ 4,860 $ 5,180 6.6%
NEW MEXICO $ 1,516 $ 1,450 $ 1,450 0.0% N. DAKOTA $ 1,910 $ 1,750 $ 2,050 17.1%
OHIO $ 5,700 $ 5,190 $ 5,650 8.9% OKLAHOMA $ 1,520 $ 1,390 $ 1,500 7.9% S. DAKOTA $ 3,020 $ 2,840 $ 3,430 20.8%
WISCONSIN $ 4,300 $ 4,010 $ 4,350 8.5%
$-
$1,000
$2,000
$3,000
$4,000
$5,000
$6,000
$7,000
$8,000
$9,000
$10,000
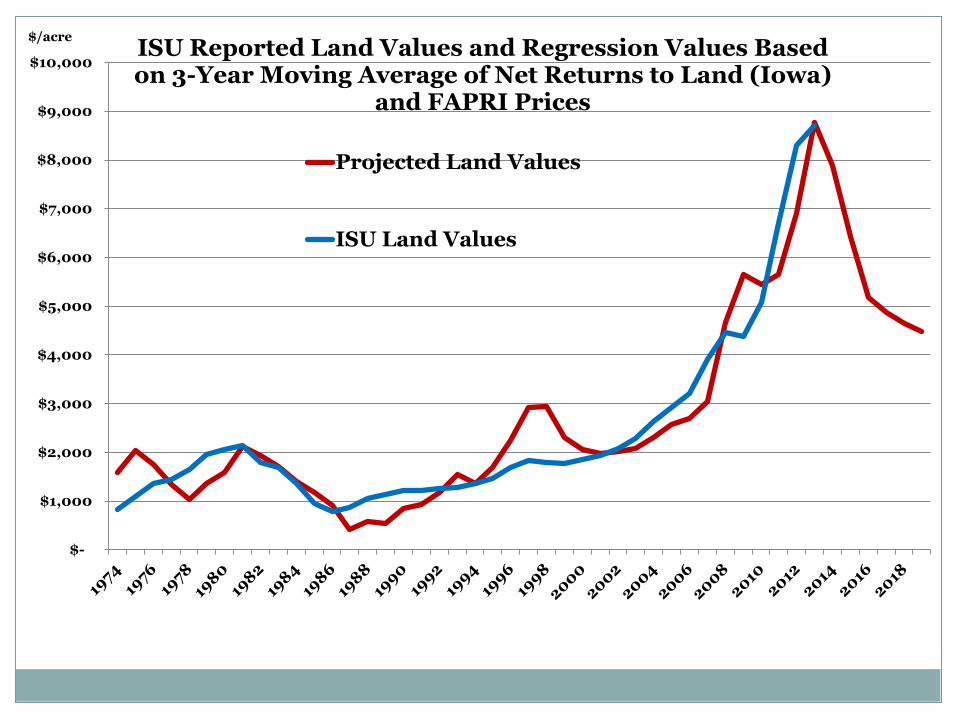
$/acre ISU Reported Land Values and Regression Values Based on 3-Year Moving Average of Net Returns to Land (Iowa)
and FAPRI Prices
Projected Land Values
ISU Land Values

Projected Iowa Land Values under Alternative Price Scenarios
$7,889
$6,693
$5,695 $5,841 $5,822 $5,884
$7,958
$6,491
$5,269
$4,917 $4,698
$4,508
$7,889
$6,319
$4,682
$4,121
$3,525 $3,391
$-
$500
$1,000
$1,500
$2,000
$2,500
$3,000
$3,500
$4,000
$4,500
$5,000
$5,500
$6,000
$6,500
$7,000
$7,500
$8,000
$8,500
2014 2015 2016 2017 2018 2019
Optimistic
FAPRI
USDA

Summary
Using current price projections, cash rents could fall 20-40% and land values 30-60% from 2014 levels.
Is that a good thing or a bad thing?
Are you a tenant? Landowner? Owner-operator?
Rents and land values reflect the ag economy.

What else could happen?
Interest rates could go up (neg. for values)
Inflation could increase (mixed bag)
Weather could be bad (where?)
Increased livestock feeding (positive)
Increased biofuel production (positive)
Acres could contract in response to low prices
Livestock profits could support land values
More cash leases are “flexible” (18% in Iowa)

Questions?
Recommended