485 Massachusetts Avenue, Suite 3
Cambridge, Massachusetts 02139
617.661.3248 | www.synapse-energy.com
Orlando’s Renewable Energy
Future
The Path to 100 Percent Renewable Energy by
2050
Prepared for The First 50 Coalition
June 2020
AUTHORS
Philip Eash-Gates
Devi Glick
Shelley Kwok
Rachel Wilson
Synapse Energy Economics, Inc. Orlando’s Renewable Energy Future
CONTENTS
EXECUTIVE SUMMARY .................................................................................................................. I
1. ORLANDO’S RENEWABLE ENERGY COMMITMENTS REQUIRE AMBITIOUS ACTION FROM THE ORLANDO
UTILITIES COMMISSION ....................................................................................................... 8
1.1. The City of Orlando has committed to 100 percent renewable energy by 2050 ..................8
1.2. OUC relies predominantly on fossil fuels to supply electricity to the City’s residents ..........9
1.3. OUC has hired Siemens to conduct an EIRP process that will determine the City’s long-term resource plan ........................................................................................................ 11
2. REPLACING OUC’S EXPENSIVE STANTON COAL PLANT WITH RENEWABLE ENERGY CAN SAVE CUSTOMERS
OVER $175 MILLION OVER THE NEXT TWO DECADES ................................................................ 12
2.1. Modeled scenarios consider continued reliance on coal, conversion to gas, and a transition to renewables and clean energy ..................................................................................... 13
2.2. Transitioning to renewables will save OUC ratepayers over $175 million over the next two decades ......................................................................................................................... 15
3. CONTINUED OPERATION OF STANTON 1 AND 2 ON COAL OR CONVERSION TO GAS IS NOT CONSISTENT
WITH ORLANDO’S CLIMATE GOALS AND SUBJECTS RATEPAYERS TO UNNECESSARY RISKS .................... 22
3.1. OUC must retire Stanton and transition to renewables to reach its climate goals ............ 22
3.2. Continued reliance on fossil fuels resources exposes ratepayers to significant economic and health risks ............................................................................................................. 24
4. REPLACING STANTON’S COAL UNITS WITH RENEWABLE ENERGY RESOURCES CREATES HIGH QUALITY LOCAL
JOBS ............................................................................................................................. 25
4.1. Investment in renewable energy delivers more local benefits than continued reliance on fossil fuels ..................................................................................................................... 25
4.2. In Orlando, transitioning to renewables will create 10,000 net job-years over the next two decades ......................................................................................................................... 26
5. RECOMMENDATIONS ........................................................................................................ 29
APPENDIX A. RESOURCE PLAN METHODOLOGY AND INPUTS ............................................................ A-1
APPENDIX B. DETAILED RESOURCE PLAN SCENARIO RESULTS ........................................................... B-1
APPENDIX C. JOBS AND ECONOMIC IMPACTS ANALYSIS METHODOLOGY AND INPUTS ............................. C-1
APPENDIX D. DETAILED JOB IMPACTS RESULTS ............................................................................. D-1
Synapse Energy Economics, Inc. Orlando’s Renewable Energy Future
List of Figures:
ES Figure 1: Coal Continues—nameplate capacity ....................................................................................... iii
ES Figure 2: Coal to Gas Conversion—nameplate capacity ......................................................................... iii
ES Figure 3: Renewable Energy —nameplate capacity ................................................................................ iii
ES Figure 4: Coal Continues—generation.……………………………………………………………………………………………….iv
ES Figure 5: Coal to Gas Conversion—generation ....................................................................................... iv
ES Figure 6: Renewable Energy—generation ............................................................................................... iv
ES Figure 7: CO2 emission trajectories of modeled scenarios ...................................................................... v
ES Figure 8: Average annual employment impacts of the Renewable Energy scenario relative to Coal
Continues ..................................................................................................................................................... vi
Figure 1: Annual revenue requirement for Coal Continues scenario ......................................................... 16
Figure 2: Difference in annual revenue requirement for Renewable Energy scenario relative to Coal
Continues scenario ...................................................................................................................................... 17
Figure 3: Nameplate installed capacity for Coal Continues scenario .......................................................... 18
Figure 4: Nameplate installed capacity for Coal to Gas Conversion scenario ............................................. 18
Figure 5: Nameplate installed capacity for Renewable Energy scenario .................................................... 19
Figure 6: Coal Continues—generation results ............................................................................................ 20
Figure 7: Coal to Gas Conversion—generation ........................................................................................... 21
Figure 8: Renewable Energy—generation .................................................................................................. 21
Figure 9: CO2 emission trajectories of modeled scenarios ......................................................................... 23
Figure 10: Average annual employment impacts of the Renewable Energy scenario relative to Coal
Continues .................................................................................................................................................... 28
Figure A-1: Synapse average seasonal natural gas forecast with Siemens Citygate adder ...................... A-2
Figure B-1: Annual revenue requirement by resource type for Coal Continues scenario ......................... B-2
Figure B-2: Annual revenue requirement by resource type for Coal to Gas Conversion scenario ............ B-2
Figure B-3: Annual revenue requirement by resource type for Renewable Energy scenario ................... B-3
Figure B-4: Annual revenue requirement by expense type for Coal Continues scenario .......................... B-3
Figure B-5: Annual revenue requirement by expense type for Coal to Gas Conversion scenario ............. B-4
Figure B-6: Annual revenue requirement by expense type for Renewable Energy scenario .................... B-4
Figure B-7: Winter firm capacity—Coal Continues scenario ...................................................................... B-5
Figure B-8: Summer firm capacity—Coal Continues scenario ................................................................... B-5
Figure B-9: Winter firm capacity—Coal to Gas Conversion scenario ......................................................... B-6
Figure B- 10: Summer firm capacity—Coal to Gas Conversion scenario ................................................... B-6
Figure B-12: Winter firm capacity—Renewable Energy scenario .............................................................. B-7
Figure B-13: Summer firm capacity—Renewable Energy scenario ............................................................ B-7
Figure C- 1: Synapse’s economic model for OUC energy investment ....................................................... C-2

Synapse Energy Economics, Inc. Orlando’s Renewable Energy Future
List of Tables
ES Table 1: Scenario net present value revenue requirement (NPVRR) 2020–2040 .................................... ii
Table 1: OUC's Energy mix by resource type for 2018 and 2019 ................................................................ 10
Table 2: Capacity (MW) owned and purchased by OUC by fuel type ......................................................... 10
Table 3: Scenario net present value revenue requirement (NPVRR) 2020–2040 ...................................... 16
Table 4: Change in full-time equivalent job years by resource, 2020–2040 (FTE job-years)...................... 27
Table 5: Change in full-time equivalent job-years (FTE job-years) relative to base scenario by sector,
2020–2040 .................................................................................................................................................. 29
Table D-1: Job impact by resource and sector for the Renewable Energy scenario relative to Coal
Continues (FTE job-years).......................................................................................................................... D-1
Table D-2: Job impact by resource and sector for the Coal to Gas Conversion scenario relative to Coal
Continues (FTE job-years).......................................................................................................................... D-2
Synapse Energy Economics, Inc. Orlando’s Renewable Energy Future i
EXECUTIVE SUMMARY
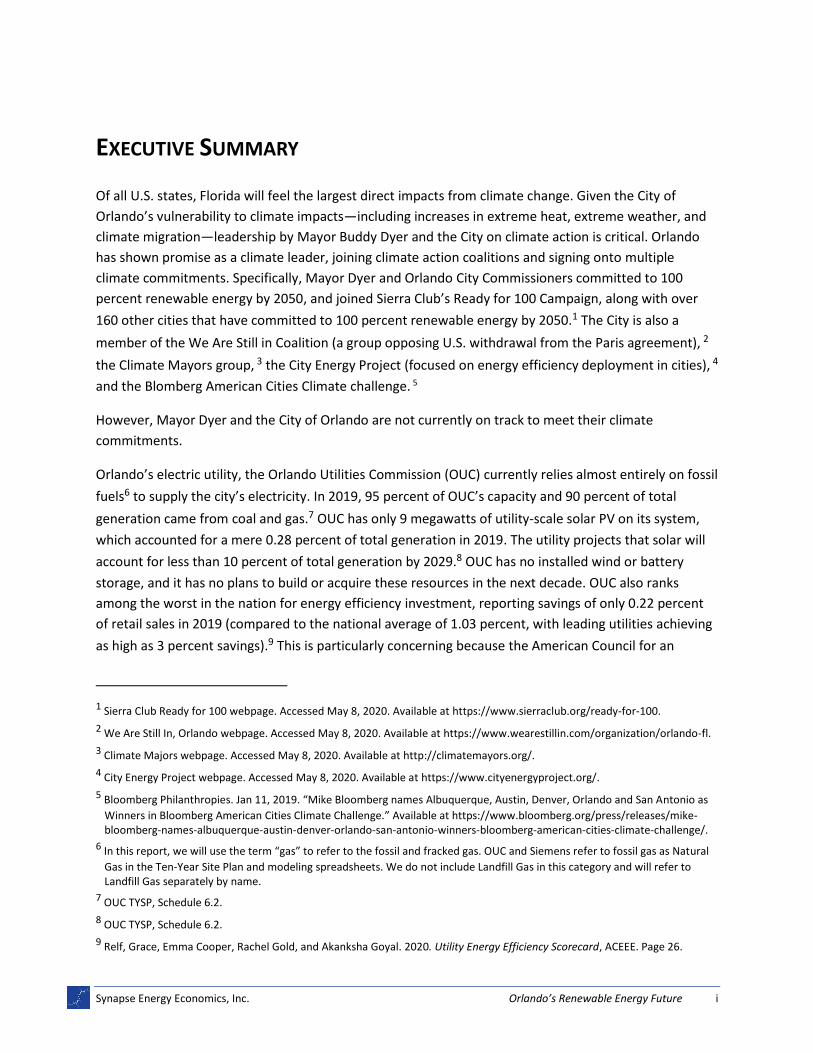
Of all U.S. states, Florida will feel the largest direct impacts from climate change. Given the City of
Orlando’s vulnerability to climate impacts—including increases in extreme heat, extreme weather, and
climate migration—leadership by Mayor Buddy Dyer and the City on climate action is critical. Orlando
has shown promise as a climate leader, joining climate action coalitions and signing onto multiple
climate commitments. Specifically, Mayor Dyer and Orlando City Commissioners committed to 100
percent renewable energy by 2050, and joined Sierra Club’s Ready for 100 Campaign, along with over
160 other cities that have committed to 100 percent renewable energy by 2050.1 The City is also a
member of the We Are Still in Coalition (a group opposing U.S. withdrawal from the Paris agreement), 2
the Climate Mayors group, 3 the City Energy Project (focused on energy efficiency deployment in cities), 4
and the Blomberg American Cities Climate challenge. 5
However, Mayor Dyer and the City of Orlando are not currently on track to meet their climate
commitments.
Orlando’s electric utility, the Orlando Utilities Commission (OUC) currently relies almost entirely on fossil
fuels6 to supply the city’s electricity. In 2019, 95 percent of OUC’s capacity and 90 percent of total
generation came from coal and gas.7 OUC has only 9 megawatts of utility-scale solar PV on its system,
which accounted for a mere 0.28 percent of total generation in 2019. The utility projects that solar will
account for less than 10 percent of total generation by 2029.8 OUC has no installed wind or battery
storage, and it has no plans to build or acquire these resources in the next decade. OUC also ranks
among the worst in the nation for energy efficiency investment, reporting savings of only 0.22 percent
of retail sales in 2019 (compared to the national average of 1.03 percent, with leading utilities achieving
as high as 3 percent savings).9 This is particularly concerning because the American Council for an
1 Sierra Club Ready for 100 webpage. Accessed May 8, 2020. Available at https://www.sierraclub.org/ready-for-100.
2 We Are Still In, Orlando webpage. Accessed May 8, 2020. Available at https://www.wearestillin.com/organization/orlando-fl.
3 Climate Majors webpage. Accessed May 8, 2020. Available at http://climatemayors.org/.
4 City Energy Project webpage. Accessed May 8, 2020. Available at https://www.cityenergyproject.org/.
5 Bloomberg Philanthropies. Jan 11, 2019. “Mike Bloomberg names Albuquerque, Austin, Denver, Orlando and San Antonio as
Winners in Bloomberg American Cities Climate Challenge.” Available at https://www.bloomberg.org/press/releases/mike-bloomberg-names-albuquerque-austin-denver-orlando-san-antonio-winners-bloomberg-american-cities-climate-challenge/.
6 In this report, we will use the term “gas” to refer to the fossil and fracked gas. OUC and Siemens refer to fossil gas as Natural
Gas in the Ten-Year Site Plan and modeling spreadsheets. We do not include Landfill Gas in this category and will refer to Landfill Gas separately by name.
7 OUC TYSP, Schedule 6.2.
8 OUC TYSP, Schedule 6.2.
9 Relf, Grace, Emma Cooper, Rachel Gold, and Akanksha Goyal. 2020. Utility Energy Efficiency Scorecard, ACEEE. Page 26.

Synapse Energy Economics, Inc. Orlando’s Renewable Energy Future ii
Energy-Efficient Economy (ACEEE) estimates that energy efficiency upgrades could cut energy use by 18
percent for homes and 23 percent for commercial buildings, thereby reducing greenhouse gas emissions
and lowering system costs for ratepayers.10
OUC recently hired Siemens Energy Business Advisory to facilitate a full 20-year Electricity Integrated
Resource Planning (EIRP) process that, among other things, evaluates conversion of Stanton Coal Units 1
and 2 to gas. To date, OUC’s publicly available documents on the EIRP process show no evidence that
the utility plans to pivot towards renewables or substantially increase energy efficiency and therefore,
no evidence that OUC is planning to fulfill Mayor Dyer and City Commissioners’ pledge.
In anticipation of OUC’s EIRP, we evaluated three scenarios for OUC’s system: a Coal Continues scenario
where OUC continues to rely on coal at Stanton 1 and 2, a Coal to Gas Conversion scenario where OUC
converts Stanton Units 1 and 2 to gas, and a Renewable Energy scenario where OUC transitions from
coal to solar PV, battery storage, and demand-side management.
As shown in ES Table 1:, we find that transitioning to renewables is the lowest cost scenario while
converting Stanton to gas is the costliest. Specifically, transitioning to renewables will save ratepayers
$176 million over the next two decades relative to continuing to rely on coal and $543 million relative to
converting Stanton to gas.
ES Table 1: Scenario net present value revenue requirement (NPVRR) 2020–2040
$2019 Million Coal
Continues Coal to Gas Conversion
Renewable Energy Scenario
Portfolio Cost $4,217 $4,584 $4,041
Difference from Coal Continues - $367 ($176)
Difference from Renewable Energy $176 $543 -
Note: Negative value = savings. Discount rate = OUC WACC of 6.3 percent. NPVRR does not include landfill gas costs, which were not available and do not differ across scenarios.
In the Coal Continues and the Coal to Gas Conversion scenarios, fossil fuels account for over 80 percent
of OUC’s capacity, as shown in ES Figure 1 and ES Figure 2. In contrast, in the Renewable Energy
scenario, OUC transitions to rely on solar PV and battery storage in the summer and battery storage in
the winter to meet its capacity needs as shown in ES Figure 3. Coal and gas together account for just 20
percent of total summer capacity and 35 percent of winter capacity in the Renewable Energy scenario.
Critically, the Renewable Energy scenario relies on battery storage which is modular and therefore a
lower risk investment for ratepayers than fossil resources. Specifically, battery storage can be better
matched to the quantity and timing of system needs, and it can provide many of the grid services
10 Nadel, S. and Ungar, L. 2019. Halfway There: Energy Efficiency Can Cut Energy Use and Greenhouse Gas Emissions in Half by
2050, ACEEE.

Synapse Energy Economics, Inc. Orlando’s Renewable Energy Future iii
ES Figure 2: Coal to Gas Conversion—nameplate capacity
ES Figure 3: Renewable Energy —nameplate capacity
ES Figure 1: Coal Continues—nameplate capacity
Synapse Energy Economics, Inc. Orlando’s Renewable Energy Future iv
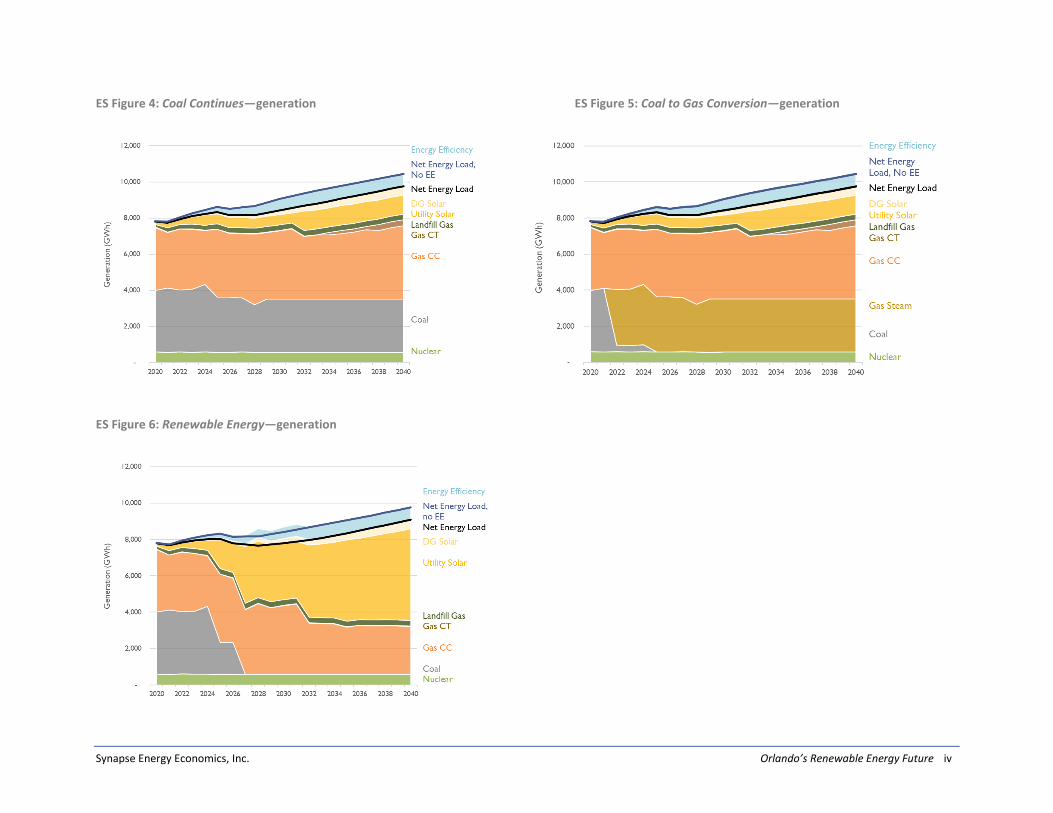
ES Figure 4: Coal Continues—generation ES Figure 5: Coal to Gas Conversion—generation
ES Figure 6: Renewable Energy—generation

Synapse Energy Economics, Inc. Orlando’s Renewable Energy Future v
typically supplied by fossil resources. This saves ratepayers money and reduces risk relative to building a
large fossil asset to meet projected future needs that may or may not materialize.
On an energy basis, fossil fuels dominate the generation mix in the Coal Continues and Coal to Gas
Conversion scenarios, accounting for around 75 percent of OUC’s total generation by 2040 as shown in
ES Figure 4 and ES Figure 4. Solar PV accounts for only 16 percent of total generation by 2040. In the
Renewable Energy scenario, solar PV accounts for over half of total generation, and fossil fuels account
for less than 30 percent of total generation, as shown in ES Figure 6.
Neither the Coal Continues nor Coal to Gas Conversion scenarios put OUC on track to reach the Mayor
and City’s goal of 100 percent renewables or zero emissions by 2050. As shown in ES Figure 7, only in the
Renewable Energy scenario will OUC be on track to reach its 100 percent commitment and zero
emissions by 2050. Emissions levels in the Coal Continues scenario are three and a half times larger than
levels in the Renewable Energy scenario by 2040 and approximately triple in the Coal to Gas Conversion
scenario, also relative to the Renewable Energy scenario. Total emissions over the period 2020 through
2040 for the Coal Continues scenario amount to over 100 million tons of CO2, which is nearly double the
level seen in the Renewable Energy scenario. Total emissions over the period 2020 through 2040 for the
Coal to Gas Conversion scenario amount to approximately 80 million tons of CO2, which is just under one
and a half times the level seen in the Renewable Energy scenario.
ES Figure 7: CO2 emission trajectories of modeled scenarios
Further, continued reliance on fossil fuels subjects ratepayers to risks from regulatory uncertainty,
stranded asset potential, and fuel price volatility, as well as health risks from air pollution (which
Synapse Energy Economics, Inc. Orlando’s Renewable Energy Future vi
exacerbates lung and heart conditions11 and increases vulnerability to certain diseases, including COVID-
19).12
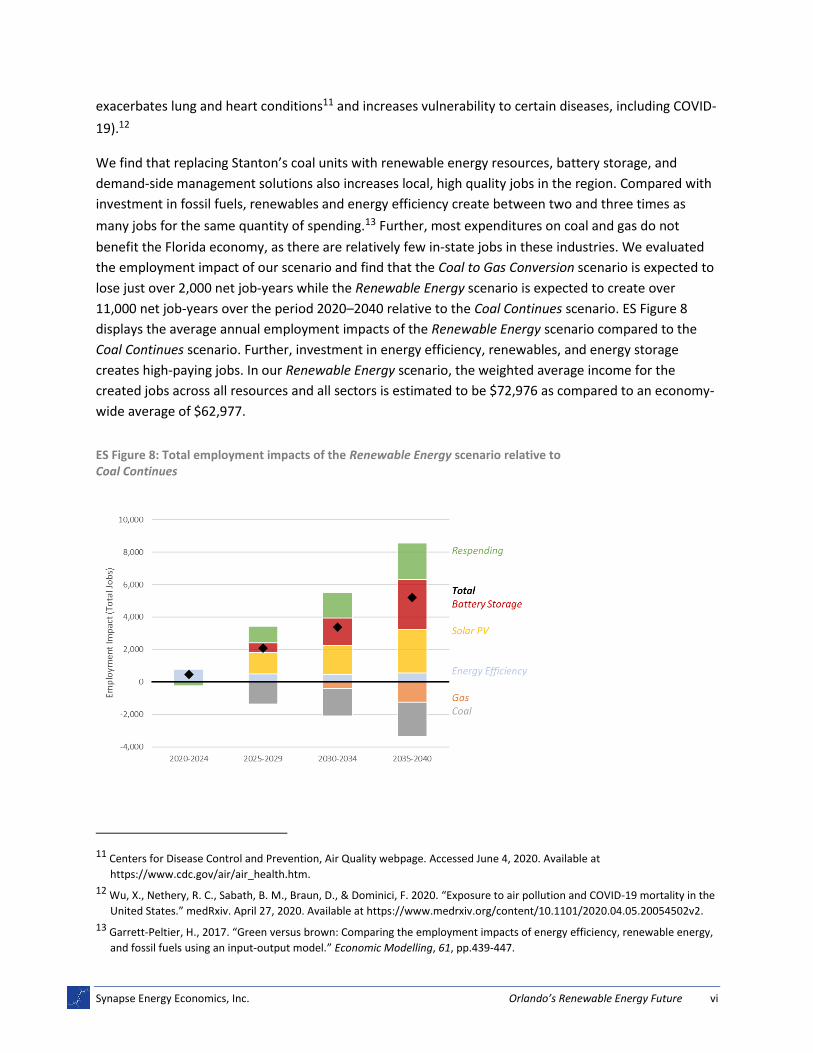
We find that replacing Stanton’s coal units with renewable energy resources, battery storage, and
demand-side management solutions also increases local, high quality jobs in the region. Compared with
investment in fossil fuels, renewables and energy efficiency create between two and three times as
many jobs for the same quantity of spending.13 Further, most expenditures on coal and gas do not
benefit the Florida economy, as there are relatively few in-state jobs in these industries. We evaluated
the employment impact of our scenario and find that the Coal to Gas Conversion scenario is expected to
lose just over 2,000 net job-years while the Renewable Energy scenario is expected to create over
11,000 net job-years over the period 2020–2040 relative to the Coal Continues scenario. ES Figure 8
displays the average annual employment impacts of the Renewable Energy scenario compared to the
Coal Continues scenario. Further, investment in energy efficiency, renewables, and energy storage
creates high-paying jobs. In our Renewable Energy scenario, the weighted average income for the
created jobs across all resources and all sectors is estimated to be $72,976 as compared to an economy-
wide average of $62,977.
ES Figure 8: Total employment impacts of the Renewable Energy scenario relative to Coal Continues
11 Centers for Disease Control and Prevention, Air Quality webpage. Accessed June 4, 2020. Available at
https://www.cdc.gov/air/air_health.htm.
12 Wu, X., Nethery, R. C., Sabath, B. M., Braun, D., & Dominici, F. 2020. “Exposure to air pollution and COVID-19 mortality in the
United States.” medRxiv. April 27, 2020. Available at https://www.medrxiv.org/content/10.1101/2020.04.05.20054502v2.
13 Garrett-Peltier, H., 2017. “Green versus brown: Comparing the employment impacts of energy efficiency, renewable energy,
and fossil fuels using an input-output model.” Economic Modelling, 61, pp.439-447.

Synapse Energy Economics, Inc. Orlando’s Renewable Energy Future vii
Given the significant disconnect between Orlando Mayor Buddy Dyer’s stated climate commitments and
the action of its electric utility, the City must now act to align all plans and actions that impact climate
and energy use with the City’s stated goals. OUC must provide Mayor Dyer and the City of Orlando a
clear plan on how it will transition from its current reliance on fossil fuels to a clean system that relies on
solar PV, battery storage, and energy efficiency. A renewable portfolio will not only provide
environmental benefits, but as we have shown in this report, will save the citizens of Orlando hundreds
of millions of dollars directly, in addition to providing significant local jobs and economic stimulus, and
protecting public health.
Our specific recommendations are as follows:
1. OUC must use the EIRP being prepared by Siemens to chart a path consistent with reaching 100 percent renewables by 2050. The plan should include a transparent evaluation of the economic retirement dates for OUC’s coal plants at Stanton and all other fossil fuel resources; should include no new fossil fuel resources; and should replace all retired resources and meet any future load growth with solar PV, battery storage, and demand-side management solutions.
2. OUC needs to develop best-in-class energy efficiency programs to reduce load and target peak demand. It then needs to dramatically scale up investment in these programs to achieve incremental savings of at least one percent of retail sales per year.
3. OUC and the City of Orlando should evaluate the risk of any further investments in coal and gas plants being rendered uneconomic before the end of their useful life by policy changes and continued clean energy cost declines.
4. OUC and the City of Orlando should quantify the job and community impacts of its selected resource plan and ensure that OUC’s resource plan yields local investment and local clean energy jobs. Especially now, as the City of Orlando battles a public health crisis and the resulting impact of job losses, OUC’s has the ability to choose a path that can lead to cleaner air and create locally-based, high-quality jobs for Orlando residents.

Synapse Energy Economics, Inc. Orlando’s Renewable Energy Future 8
1. ORLANDO’S RENEWABLE ENERGY COMMITMENTS REQUIRE
AMBITIOUS ACTION FROM THE ORLANDO UTILITIES
COMMISSION
1.1. The City of Orlando has committed to 100 percent renewable energy by 2050
Of all U.S. states, Florida will feel the largest direct impacts from climate change. Hurricanes, sea level
rise, agriculture losses, extreme heat, and growing energy needs threaten the region and are likely to
result in substantial economic losses. Orlando in particular is projected to be hard hit both physically and
economically.14 Given the City’s vulnerability to climate impacts, leadership by the City on mitigation
and adaptation is critical, both to protect the City, and to set an example for other cities and regions for
mitigating their own climate impacts.
Orlando has shown promise as a climate leader, joining climate action coalitions and signing onto
multiple climate commitments. Specifically, Orlando has committed to 100 percent renewable energy by
2050 and joined Sierra Club’s Ready for 100 Campaign, along with over 160 other cities that have also
committed to 100 percent renewable energy by 2050.15 Orlando has joined the We Are Still In Coalition,
a group of cities, states, tribes, businesses, universities, healthcare organizations, and faith groups that
oppose the U.S. withdrawal from the Paris Agreement and commit to not retreating from responding to
the climate crisis.16 Orlando is part of the Climate Mayors group, a bi-partisan network of mayors
committed to demonstrating climate leadership.17 Orlando is also one of 10 cities selected to participate
in the City Energy Project, a joint initiative of the Institute for Market Transformation and the Natural
Resources Defense Council to explore bold practical ways to deploy energy efficiency at the city level.18
And it is one of 25 cities nationwide chosen to participate in the Bloomberg American Cities Climate
Challenge, receiving a $2.5 million dollar grant in 2019 to support climate action.19
14 Peters, Xander. 2019. “Florida will bear the brunt of climate change. Why do we keep voting for lawmakers without a plan?”
Orlando Weekly. February 6. Available at https://www.orlandoweekly.com/orlando/so-why-do-so-many-of-its-residents-keep-voting-for-lawmakers-opposed-to-climate-policy/Content?oid=23804474.
15 Sierra Club Ready for 100 webpage. Accessed May 8, 2020. Available at https://www.sierraclub.org/ready-for-100.
16 We Are Still In, Orlando webpage. Accessed May 8, 2020. Available at https://www.wearestillin.com/organization/orlando-fl.
17 Climate Majors webpage. Accessed May 8, 2020. Available at http://climatemayors.org/.
18 City Energy Project webpage. Accessed May 8, 2020. Available at https://www.cityenergyproject.org/.
19 Bloomberg Philanthropies. 2019. “Mike Bloomberg names Albuquerque, Austin, Denver, Orlando and San Antonio as
Winners in Bloomberg American Cities Climate Challenge.” Jan 11. Available at

Synapse Energy Economics, Inc. Orlando’s Renewable Energy Future 9
While Orlando’s climate commitments are to be applauded, the City must now act to align all plans and
actions that impact climate and energy use with the City’s stated goals. Commitments are voluntary and
not self-enforcing. Without coordinated action across city departments, Orlando’s climate commitments
will amount to little more than rhetoric. One place where this is particularly important is Orlando’s
electricity system.
1.2. OUC relies predominantly on fossil fuels to supply electricity to the City’s residents
The City of Orlando receives its electricity from the Orlando Utilities Commission (OUC),20 a municipal
utility that serves both Orlando, the nearby city of St. Cloud, and several neighboring cities through
wholesale contracts. OUC is a member of the Florida Municipal Power Pool (FMPP), an electric power
pool that centralizes dispatch of all pool members’21 resources to meet total load in the most
economical way. OUC serves as the dispatcher of FMPP and claims that participation in FMPP has
provided significant savings to OUC, mainly by providing a market for OUC to sell excess generation.22
OUC continues to rely heavily on fossil fuels.
Over 95 percent of OUC’s generation capacity is fossil-based
Despite the City of Orlando’s stated commitment to achieve 100 percent renewables by 2050, OUC
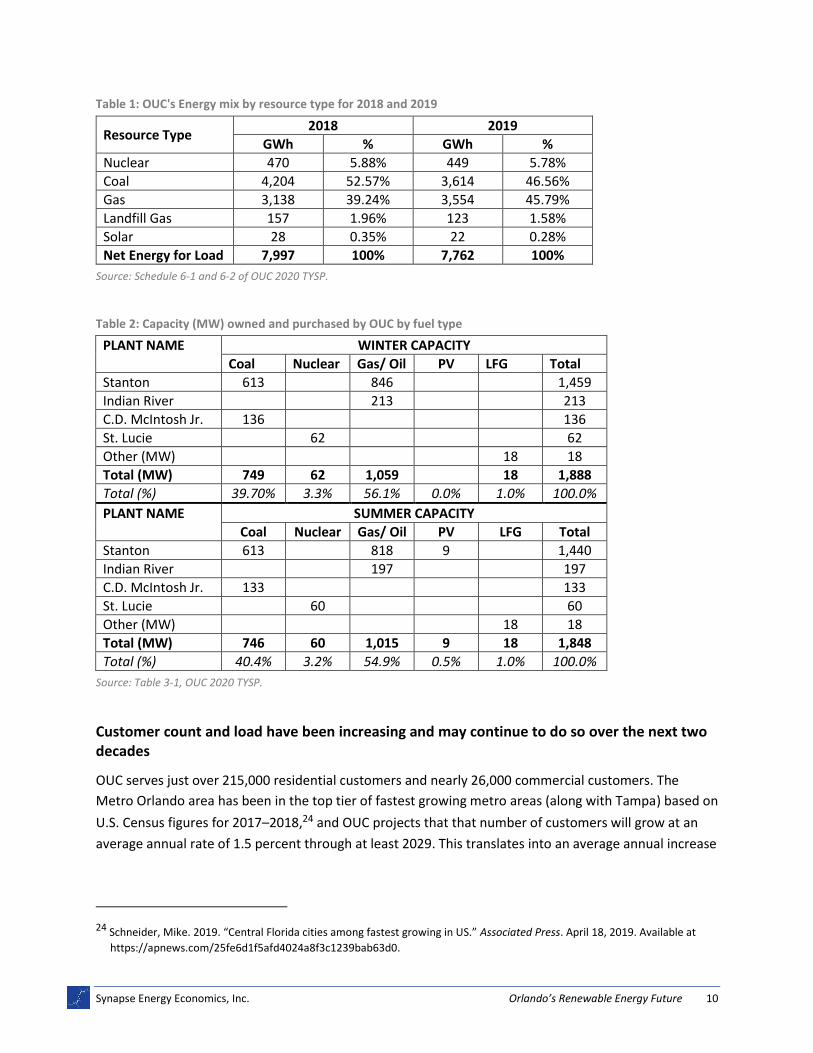
relies almost entirely on coal and gas to supply the City’s electricity. As shown in Table 1Table 3, in 2019
coal and gas accounted for over 90 percent of OUC’s total generation, while solar only accounted for
0.28 percent.23 Table 2 shows OUC’s current winter and summer capacity mix, which is over 95 percent
coal and gas, with a small amount of nuclear, landfill gas, and solar PV. OUC has only 9 megawatts (MW)
of utility-scale solar PV on its system (nameplate), and no wind or battery storage installed.
https://www.bloomberg.org/press/releases/mike-bloomberg-names-albuquerque-austin-denver-orlando-san-antonio-winners-bloomberg-american-cities-climate-challenge/.
20 OUC is a statutory commission that was created by the legislature of the State of Florida as a separate part of City
government.
21 Lakeland Electric and the Florida Municipal Power Agency (FMPA) All-Requirements Project are also member of FMPP.
22 OUC TYSP, page 1-1.
23 OUC TYSP, Schedule 6.2.
Synapse Energy Economics, Inc. Orlando’s Renewable Energy Future 10
Table 1: OUC's Energy mix by resource type for 2018 and 2019
Resource Type 2018 2019
GWh % GWh %
Nuclear 470 5.88% 449 5.78%
Coal 4,204 52.57% 3,614 46.56%
Gas 3,138 39.24% 3,554 45.79%
Landfill Gas 157 1.96% 123 1.58%
Solar 28 0.35% 22 0.28%
Net Energy for Load 7,997 100% 7,762 100%
Source: Schedule 6-1 and 6-2 of OUC 2020 TYSP.
Table 2: Capacity (MW) owned and purchased by OUC by fuel type
PLANT NAME WINTER CAPACITY
Coal Nuclear Gas/ Oil PV LFG Total
Stanton 613 846 1,459
Indian River 213 213
C.D. McIntosh Jr. 136 136
St. Lucie 62 62
Other (MW) 18 18
Total (MW) 749 62 1,059 18 1,888
Total (%) 39.70% 3.3% 56.1% 0.0% 1.0% 100.0%
PLANT NAME SUMMER CAPACITY
Coal Nuclear Gas/ Oil PV LFG Total
Stanton 613 818 9 1,440
Indian River 197 197
C.D. McIntosh Jr. 133 133
St. Lucie 60 60
Other (MW) 18 18
Total (MW) 746 60 1,015 9 18 1,848
Total (%) 40.4% 3.2% 54.9% 0.5% 1.0% 100.0%
Source: Table 3-1, OUC 2020 TYSP.
Customer count and load have been increasing and may continue to do so over the next two decades
OUC serves just over 215,000 residential customers and nearly 26,000 commercial customers. The
Metro Orlando area has been in the top tier of fastest growing metro areas (along with Tampa) based on
U.S. Census figures for 2017–2018,24 and OUC projects that that number of customers will grow at an
average annual rate of 1.5 percent through at least 2029. This translates into an average annual increase
24 Schneider, Mike. 2019. “Central Florida cities among fastest growing in US.” Associated Press. April 18, 2019. Available at
https://apnews.com/25fe6d1f5afd4024a8f3c1239bab63d0.

Synapse Energy Economics, Inc. Orlando’s Renewable Energy Future 11
in retail sales of 1.6 percent between now and 2029.25 OUC also supplies electricity through power sale
contracts with Bartow, Lake Worth, Winter Park, Florida Power & Light, Mount Dora, and
Chattahoochee.26
1.3. OUC has hired Siemens to conduct an EIRP process that will determine the City’s long-term resource plan
OUC is required by Florida law to publish a Ten-year site plan (TYSP) every year. A TYSP does not involve
a robust planning exercise; however, it is a useful guide for understanding the utility’s near-term load
forecast and resource plan. This year, in addition to producing its annual TYSP, OUC hired Siemens to
run a full 20-year Electric Integrated Resource Planning (EIRP) process. The outcome of this EIRP process
will play a strong role in determining OUC’s resource plan for the next several decades.
Given Orlando’s climate commitments, we would expect OUC’s resource plans to be aligned with the
goal of 100 percent renewable energy by 2050. However, there is no evidence in any of OUC’s publicly
available documents, including OUC’s most recent TYSP from April 2020 and Siemens EIRP modeling
files,27 that the utility plans to pivot towards renewables and energy efficiency to meet its climate
commitments.
OUC’s 2020 TYSP includes minimal investment in renewables or efficiency
OUC’s TYSP indicates plans to add only around 250 MW of solar PV over the next decade,28 which OUC
projects will account for less than 10 percent of OUC’s generation by 2029. At this rate, renewable
generation would account for only 16 percent of total generation (25 percent non-fossil generation
including nuclear and landfill gas) by 2050, far below the level required to meet Orlando’s 100 percent
stated commitment. OUC’s demand-side management goals approved by the Florida Public Service
Commission (PSC) for the next decade are also disheartening, starting at 0.02 percent in 2020 and
increasing to 0.18 percent savings as a percent of retail sales by 2029. These goals are even lower than
OUC’s current demand-side management investment at 0.22 percent.29 This is particularly concerning
because the American Council for an Energy-Efficient Economy (ACEEE) estimates that energy efficiency
25 OUC TYSP, page 4-6.
26 Bartow’s and FP&L’s contracts expire at the end of 2020, Lake Worth’s at the end of 2025, and Winter Park’s at the end of
2026. Mr. Dora and Chattahoochee contracts begin in 2021 and run through the end of 2027.
27 Synapse reviewed Siemens modeling input files that were provided by OUC to Sierra Club in response to Serra Club’s public
records request.
28 OUC TYSP, pages 2-6 – 2-9.
29 OUC TYSP, page 5-2.
Synapse Energy Economics, Inc. Orlando’s Renewable Energy Future 12
upgrades could cut energy use by 18 percent for homes and 23 percent for commercial buildings,
thereby reducing greenhouse gas emissions and lowering system costs for ratepayers.30
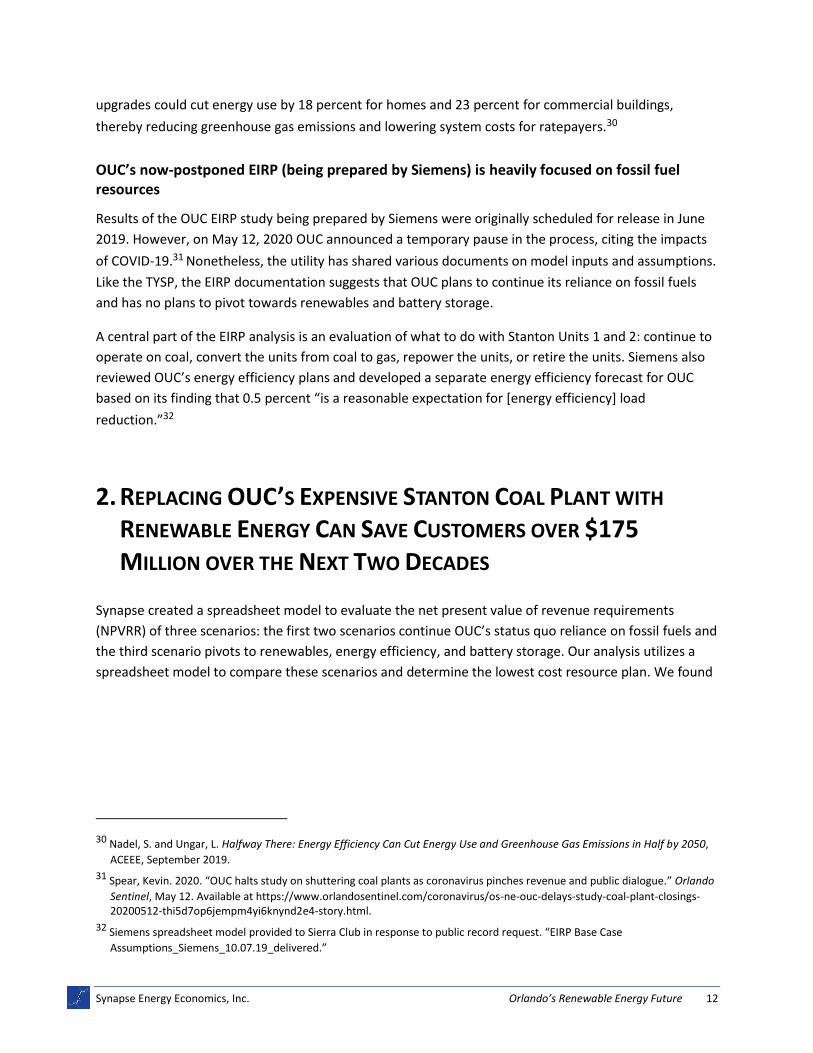
OUC’s now-postponed EIRP (being prepared by Siemens) is heavily focused on fossil fuel resources
Results of the OUC EIRP study being prepared by Siemens were originally scheduled for release in June
2019. However, on May 12, 2020 OUC announced a temporary pause in the process, citing the impacts
of COVID-19.31 Nonetheless, the utility has shared various documents on model inputs and assumptions.
Like the TYSP, the EIRP documentation suggests that OUC plans to continue its reliance on fossil fuels
and has no plans to pivot towards renewables and battery storage.
A central part of the EIRP analysis is an evaluation of what to do with Stanton Units 1 and 2: continue to
operate on coal, convert the units from coal to gas, repower the units, or retire the units. Siemens also
reviewed OUC’s energy efficiency plans and developed a separate energy efficiency forecast for OUC
based on its finding that 0.5 percent “is a reasonable expectation for [energy efficiency] load
reduction.”32
2. REPLACING OUC’S EXPENSIVE STANTON COAL PLANT WITH
RENEWABLE ENERGY CAN SAVE CUSTOMERS OVER $175
MILLION OVER THE NEXT TWO DECADES
Synapse created a spreadsheet model to evaluate the net present value of revenue requirements
(NPVRR) of three scenarios: the first two scenarios continue OUC’s status quo reliance on fossil fuels and
the third scenario pivots to renewables, energy efficiency, and battery storage. Our analysis utilizes a
spreadsheet model to compare these scenarios and determine the lowest cost resource plan. We found
30 Nadel, S. and Ungar, L. Halfway There: Energy Efficiency Can Cut Energy Use and Greenhouse Gas Emissions in Half by 2050,
ACEEE, September 2019.
31 Spear, Kevin. 2020. “OUC halts study on shuttering coal plants as coronavirus pinches revenue and public dialogue.” Orlando
Sentinel, May 12. Available at https://www.orlandosentinel.com/coronavirus/os-ne-ouc-delays-study-coal-plant-closings-20200512-thi5d7op6jempm4yi6knynd2e4-story.html.
32 Siemens spreadsheet model provided to Sierra Club in response to public record request. “EIRP Base Case
Assumptions_Siemens_10.07.19_delivered.”
Synapse Energy Economics, Inc. Orlando’s Renewable Energy Future 13
that the Coal Conversion to Gas scenario will increase
costs to ratepayers by approximately $370 million,
while transitioning to renewables (the Renewable
Energy scenario) will directly save ratepayers over
$175 million over the next two decades. The full
results are discussed in Section 2.2 below.
2.1. Modeled scenarios consider continued reliance on coal, conversion to gas, and a transition to renewables and clean energy
Fossil Fuel Scenarios
We modeled two fossil fuel scenarios: the Coal
Continues scenario where OUC continues burning coal
at Stanton Units 1 and 2, and the Coal to Gas
Conversion scenario, where OUC converts Stanton
Units 1 and 2 to gas. The two scenarios differ only in
that in the Coal Continues scenario OUC continues to
operate Stanton Units 1 and 2 on coal, and in the
Conversion to Gas scenario OUC converts Stanton Unit
1 and Unit 2 to gas in 2022. Neither scenario put
Orlando on track to reach 100 percent renewables by
2050.
• We rely on OUC’s 2020 TYSP as well as
Siemens EIRP model inputs for our resource
addition and retirement information. CD
McIntosh Unit 3, a 352 MW coal unit of which
OUC’s owns 140.8 MW, retires in the end of
2024, and the Stanton A power purchase
agreement (gas combined cycle) expires in the
end of 2031. We do not test or allow other
retirements in the 2020 –2040 timeframe.
• OUC has no need for new capacity until 2032.
We meet OUC’s post-2032 capacity needs
with a small amount of solar PV, assuming that
OUC continues to deploy solar beyond 2029 at
the rate currently planned for the next
decade, and predominantly with new gas
A R E N E W A B L E E N E R G Y
P O R T F O L I O C A N M E E T S Y S T E M
N E E D S
Solar PV can provide critical summer peak capacity at the times when system demand is highest. Further, when solar PV and battery storage are both deployed on a system, solar energy can be stored to meet system needs during non-daylight hours. This allows the utility to rely on solar energy to displace energy from higher variable-cost fossil fuels and save ratepayers money.
Battery storage comes in smaller capacity increments than traditional fossil generation alternatives and can be constructed and deployed relatively quickly as capacity is needed. This saves ratepayers money and reduces the risk of overbuilding to meet uncertain future conditions. Battery storage also provides critical grid services that systems traditionally get from fossil fuel resources. Batteries are instantaneously responsive to changing system needs, and can, for example, quickly come offline as solar ramps up in the morning and come back online as it ramps down in the evening. Additionally, systems that rely on battery storage instead of large fossil fuel resources can actually lower their contingency requirements, as smaller resources require smaller levels of back-up reserves in case of a system failure. (Systems that rely on large, centralized fossil resources need large reserves to meet NERC requirements in case of an event where a single generator, transmission line, or other asset fails. As systems transition to rely on smaller, modular resources, such as battery storage, they will not have to plan for large, single resource outage contingencies.)
Demand-side management, including energy efficiency, can lower system energy use and system peak (through, for example, direct load control). Energy efficiency displaces high variable cost fossil fuels and should always be considered first in a resource plan.
Synapse Energy Economics, Inc. Orlando’s Renewable Energy Future 14
combined cycle and combustion turbine
resources. Firm imports will also be an option
if there continues to be significant excess gas
capacity in the region by this time.
• We use OUC’s base load forecast from its
2020 TYSP which assumes an average annual
growth rate for retail sales of 1.6 percent and
a peak growth rate of 1.9 percent in summer
and 2.3 percent in winter. We rely on the
PSC’s demand-side management goals for
energy efficiency.
• We assume wholesale contracts that expire
are not renewed.
• We rely on Siemens’ and OUC’s cost and
operational information for current and
planned resources. Where OUC-specific data
is not available or is incomplete, we rely on
the Horizons Energy National Database and
other public industry-recognized sources.
Renewable Energy scenario
Our third scenario reflects a Renewable Energy
scenario where Stanton Unit 1 and 2 are replaced by
emission-free solar PV, incremental and dispatchable
battery storage, and demand-side management. The
Renewable Energy scenario puts OUC on the path to
achieve 100 percent renewable energy by 2050.
• We retire Stanton 1 and 2 in 2024 and 2026
respectively, and meet capacity needs with
solar PV and battery storage. We test a series
of Stanton retirement dates in the near-term
to identify the least-cost option.
• We rely on solar PV and incremental battery
storage to meet capacity and energy needs
that arise when the Stanton A power purchase
agreement expires. We assume OUC’s share
of Stanton A and Stanton B would be retired
and replaced beyond 2040.
S O L A R PV A N D BA T T E R Y S T O R A G E
C O S T S H A V E DR O P P E D
D R A M A T I C A L L Y I N R E C E N T YE A R S
Solar PV Nationally, utility-scale PV and battery storage costs have dropped dramatically (50 percent over the past five years) and are projected to continue to do so for the foreseeable future. In Florida specifically, utility-scale solar PV costs dropped around 38 percent between 2015 and the end of 2019.
Despite this dramatic cost decline, there is only 3,690 MW of solar installed in the state, and in 2019, less than 2 percent of Florida's generation came from solar PV. In contrast, gas fueled around 70 percent of Florida’s electricity generation in 2018. This is due in large part to the regulatory climate in the state. Florida lacks solar policies that have driven investment in solar elsewhere; specifically, Florida does not have a state renewable portfolio standard (RPS) and the state does not allow residential or commercial scale power purchase agreements.
Sources: Lazard Levelized Cost of Energy Version 9.0, November 2015. Lazard Levelized Cost of Energy Version 13.0, November 2019. LCOE and capital cost of Crystalline Utility-Scale Solar PV.
Fu, Ran, David J. Feldman, and Robert M. Margolis. US solar photovoltaic system cost benchmark: Q1 2018. No. NREL/TP-6A20-72399.
National Renewable Energy Laboratory (NREL), Golden, CO (United States), 2018.
Florida Solar (Data Current Through Q4 2019). Solar Energy Industries Association webpage, access May 26, 2020. Available at https://www.seia.org/state-solar-policy/florida-solar.
Solar Energy Industries Association (SEIA).
Florida State Profile and Energy Estimates, U.S. Energy Information Administration Website. Accessed May 26, 2020. Available at https://www.eia.gov/state/?sid=FL.

Synapse Energy Economics, Inc. Orlando’s Renewable Energy Future 15
• We ramp up energy efficiency investment to
national average levels by 2025 (annual savings
representing 1.03 percent of retail sales).33 We
assume that energy efficiency does not change
the load profile, but it reduces summer and
winter peak loads proportionately to total
annual savings.
• We assume excess energy can be sold as non-
firm energy in FMPP or bilaterally to other
regional entities.
• We rely on industry-recognized sources
including ACEEE, National Renewable Energy
Lab (NREL), Lazard, and U.S. Energy Information
Administration (EIA) for cost and operational
information for future renewables.
More information on topology, modeling structure,
load, fuel prices, and other assumptions can be found
in Appendix A.
2.2. Transitioning to renewables will save OUC ratepayers over $175 million over the next two decades
Based on our analysis of capital and operational costs
(including initial and sustaining capital investments,
fixed and variable operations and maintenance, fuel,
and energy efficiency program investment), we find
that the Renewable Energy scenario is the lowest cost
resource option for Orlando ratepayers and the Coal to
Gas Conversion scenario is the most expensive option.
As shown in Table 3, the Renewable Energy scenario
saves ratepayers over $175 million relative to the Coal
Continues scenario and nearly $550 million relative to
the Coal to Gas Conversion scenario.
33 Relf, Grace, Emma Cooper, Rachel Gold, and Akanksha Goyal. 2020 Utility Energy Efficiency Scorecard, ACEEE. February 2020.
Page 26.
I N V E S T M E N T S I N DE M A N D - S I D E
M A N A G E M E N T W I L L I N C R E A S E
E N E R G Y A F F O R D A B I L I T Y F O R A L L ,
E S P E C I A L L Y R A T E P A Y E R S I N L O W -I N C O M E NE I G H B O R H O O D S
The national average for spending on energy as a percentage of income is 3.5 percent according to ACEEE, and 2 percent for Orlando specifically based on the U.S. Department of Energy’s Low-Income Energy Affordability Data (LEAD) Tool. However, low-income Floridians face high energy burdens, meaning that an outsized portion of their income goes towards home energy bills. Specifically, the average energy burden among Orlando’s low-income population is 7.2 percent, and with a quarter of the low-income population having an energy burden over 12 percent. Living in inefficient housing means low-income residents pay more per square foot for their utility bills, and these high energy burdens force families to face trade-offs between energy and other basic necessities, such as food and medicine.
While demand-side management programs can lower utility costs and therefore rates for all customers, targeted demand-side management programs can simultaneously focus on decreasing the electricity bills of low-income customers and therefore lower the energy burden they face.
Sources: Drehobl, A. and Ross, L. Lifting the High Energy Burden in America’s Largest Cities: How Energy Efficiency Can Improve Low Income and Underserved Communities. ACEEE, April 2016.
U.S. Department of Energy’s Low-Income Energy Affordability Data (LEAD) Tool.
Synapse Energy Economics, Inc. Orlando’s Renewable Energy Future 16
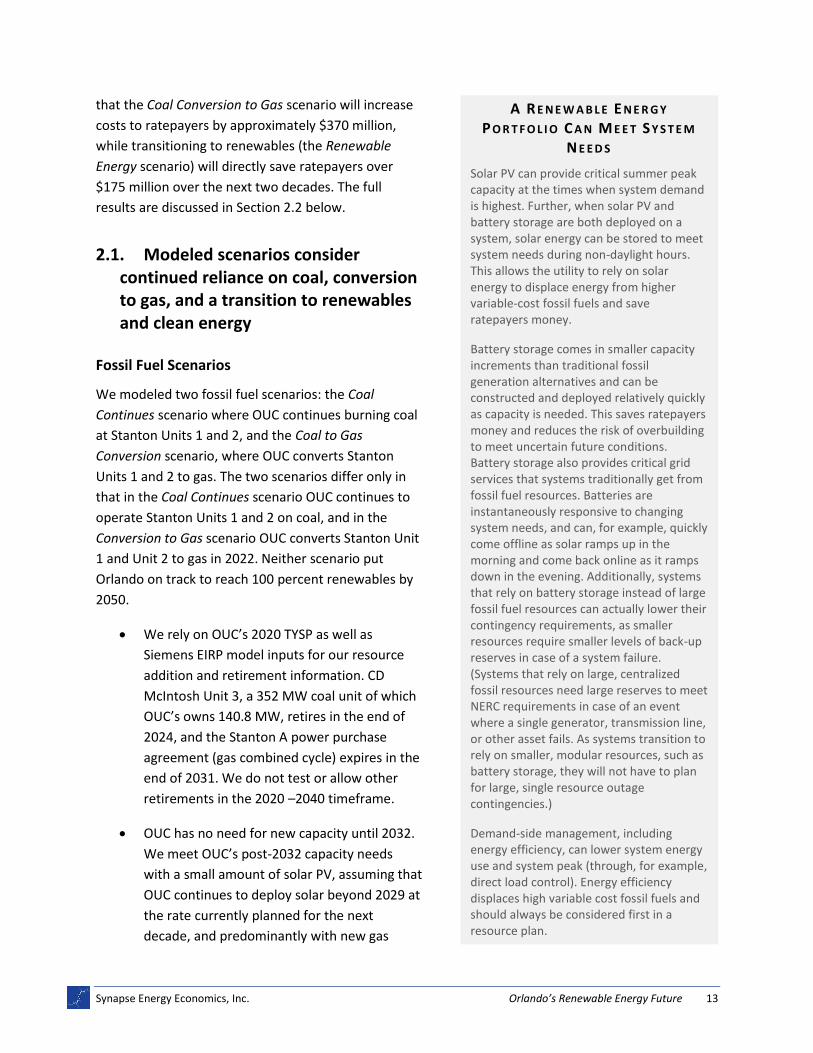
Table 3: Scenario net present value revenue requirement (NPVRR) 2020–2040
$2019 Million Coal
Continues Coal to Gas Conversion
Renewable Energy
Portfolio Cost $4,217 $4,584 $4,041
Difference from Coal Continues - $367 ($176)
Difference from Renewable Energy $176 $543 -
Note: Negative value = savings. Discount rate = OUC WACC of 6.3 percent. NPVRR does not include landfill gas costs, which were not available and do not differ across scenarios.
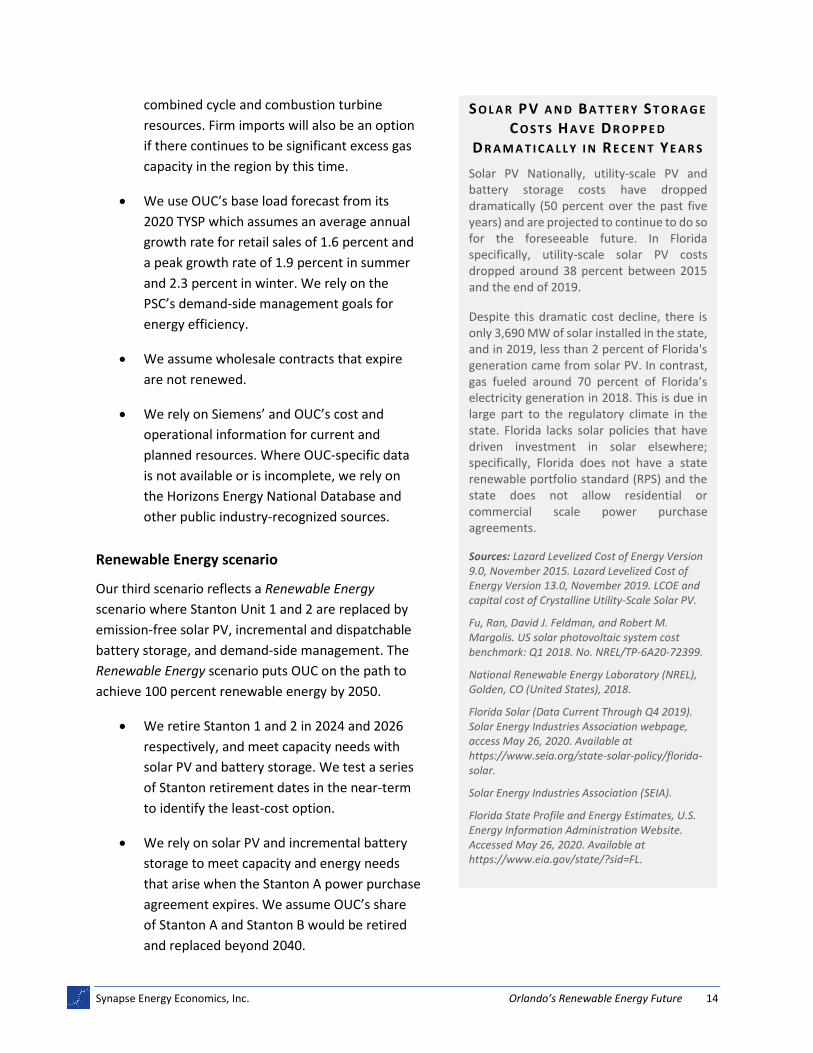
Revenue requirement results
Figure 1 shows the total annual revenue requirement for the Coal Continues scenario. In the Coal
Continues scenario, the majority of spending is focused on coal and gas resources over the next two
decades. The picture looks very similar for the Coal to Gas Conversion scenario (not displayed here),
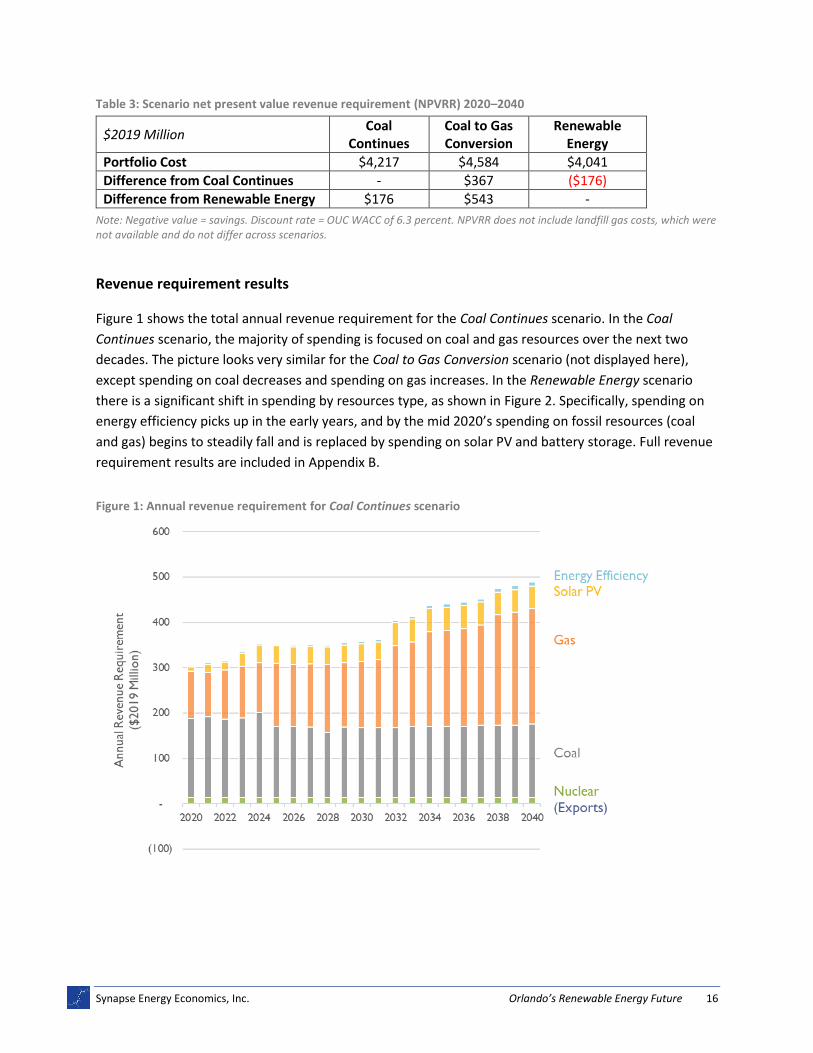
except spending on coal decreases and spending on gas increases. In the Renewable Energy scenario
there is a significant shift in spending by resources type, as shown in Figure 2. Specifically, spending on
energy efficiency picks up in the early years, and by the mid 2020’s spending on fossil resources (coal
and gas) begins to steadily fall and is replaced by spending on solar PV and battery storage. Full revenue
requirement results are included in Appendix B.
Figure 1: Annual revenue requirement for Coal Continues scenario
Synapse Energy Economics, Inc. Orlando’s Renewable Energy Future 17
Figure 2: Difference in annual revenue requirement for Renewable Energy scenario relative to Coal Continues scenario
Capacity Results
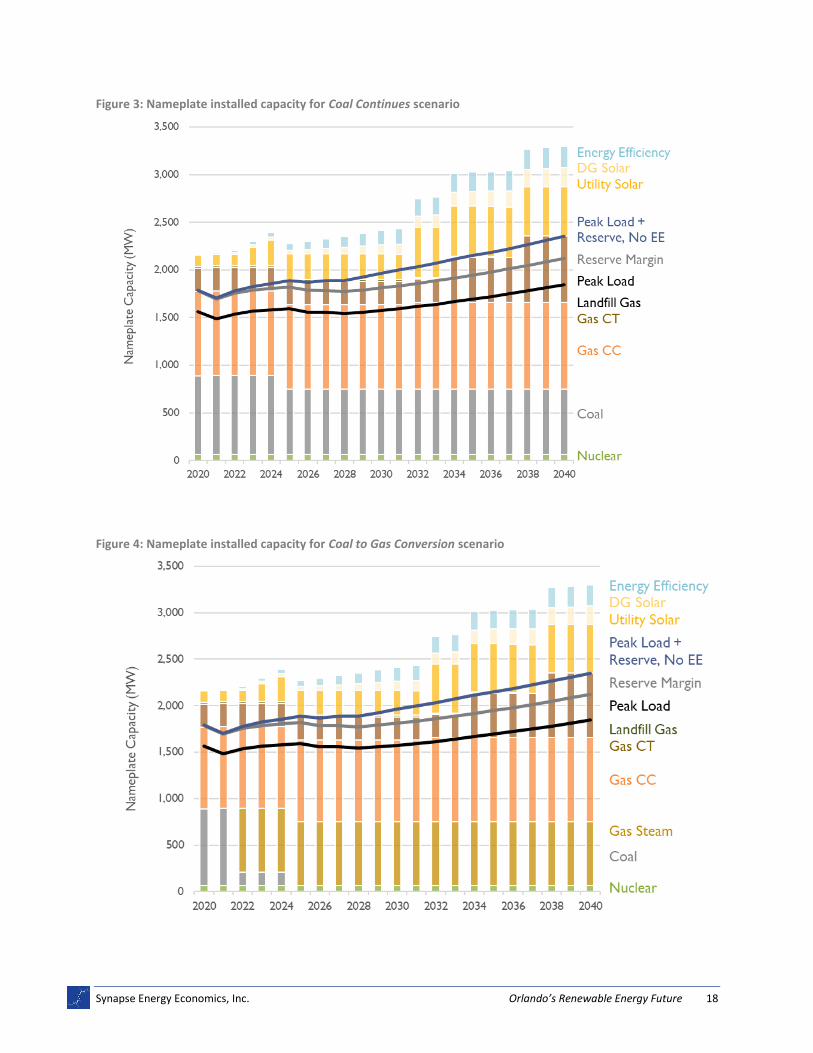
As shown in Figure 3 and Figure 4, in the Coal Continues and Coal to Gas Conversion scenarios OUC
continues to rely predominately on existing fossil fuel resources to meet system capacity needs while
maintaining a 15 percent reserve margin. We assume that Stanton 1 and 2 do not retire in either
scenario, and future capacity needs and load growth are met by a small amount of solar PV, and new gas
capacity. Specifically, we build 260 MW of solar PV between 2030 and 2040 consistent with OUC’s
current installation trajectory for solar PV. When the Stanton A power purchase agreement expires in
2032, we build a new 385 MW combined cycle gas plant and then two additional 225 MW combustion
turbines to meet OUC’s projected continued load growth in 2035 and 2038. Fossil fuel resources account
for around 80 percent of OUC’s capacity in 2040 in these two scenarios (see Appendix B for winter and
summer firm capacity results for all scenarios).
Synapse Energy Economics, Inc. Orlando’s Renewable Energy Future 18
Figure 3: Nameplate installed capacity for Coal Continues scenario
Figure 4: Nameplate installed capacity for Coal to Gas Conversion scenario

Synapse Energy Economics, Inc. Orlando’s Renewable Energy Future 19
In contrast with the fossil fuel scenarios, in the Renewable Energy scenario we build out over 2 GW of
solar, 1.2 GW battery storage, and increase investment in energy efficiency over the next two decades
to meet firm peak demand while maintaining a 15 percent reserve margin (Error! Not a valid bookmark
self-reference.). We assume Stanton 1 retires at the end of 2024 and Stanton 2 at the end of 2026. This
creates a small capacity need starting in 2025, which can be met with less than 40 MW of battery
storage (or firm imports), and a larger capacity need starting in 2027 that can be met by a little over 300
MW of battery storage. By 2040, fossil fuel capacity accounts for only 20 percent of summer and 35
percent of winter firm capacity.
Figure 5: Nameplate installed capacity for Renewable Energy scenario
We meet energy needs through the deployment of 510 MW of solar PV in 2025 and another 750 MW in
2027. Some of OUC’s energy need could also be met by ramping up existing fossil fuels or buying non-
firm imports. However, based on the power purchase agreement prices provided by Siemens, after
2025, solar from power purchase agreements is cheaper than the variable cost of most, if not all, of
OUC’s other resources. We meet subsequent energy and capacity needs beyond 2027 that result from
the expiration of the Stanton A power purchase agreement and projected regional load growth through
additional incremental deployments of solar and battery storage. The modular nature of battery storage
makes it particularly well-suited to meet OUC’s incremental future capacity needs. Unlike fossil
resources which are constructed in large blocks, battery storage can be deployed in the size needed at
the time needed. This saves ratepayers money and reduces the risk associated with building a large
asset to meet projected future needs that may or may not materialize.

Synapse Energy Economics, Inc. Orlando’s Renewable Energy Future 20
It is important to note that although summer peak is higher than winter peak on OUC’s system, we
conservatively assign solar a firm capacity contribution of zero percent in the winter and 50 percent in
the summer. Therefore, the system is built to meet OUC’s winter peaking needs and there is excess
capacity in the summer.
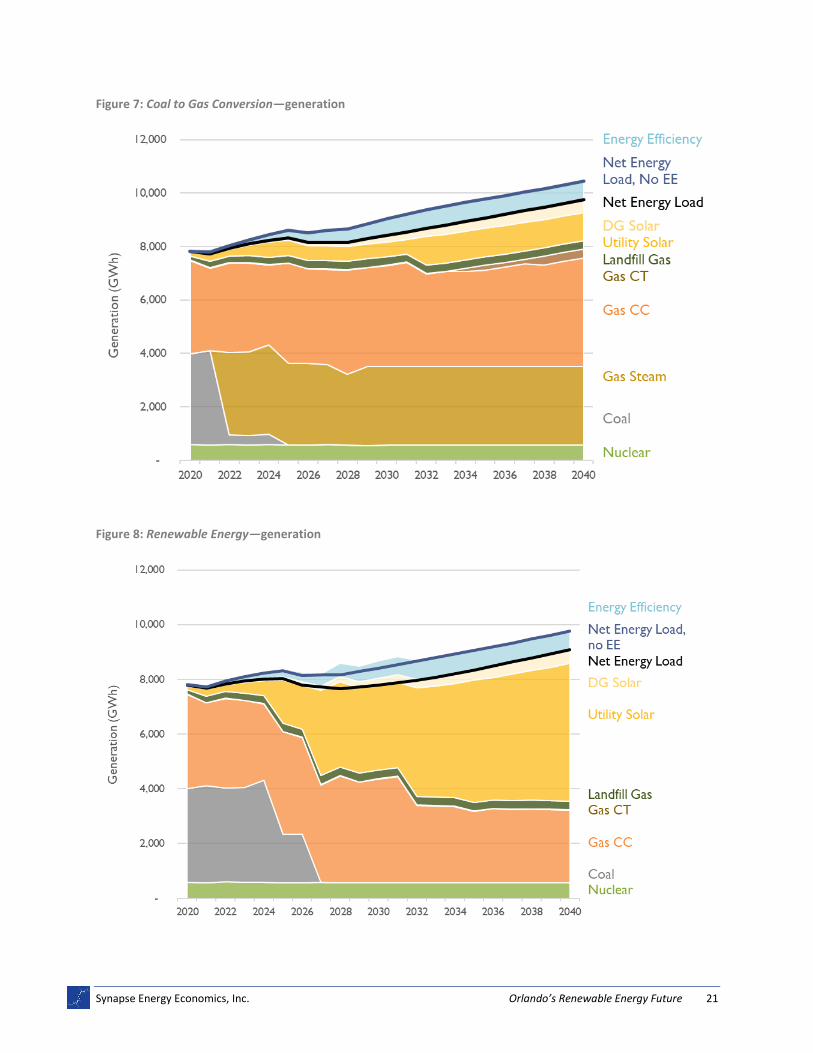
Energy results
In both the Coal Continues and Coal to Gas Conversion scenarios, OUC’s fuel mix gradually expands
between 2020 and 2040. Despite this small shift, OUC continues to rely on coal and gas for 75 percent of
its generation, as shown in Figure 6 and Figure 7, and is not on track to reach its renewable energy goal
in either scenario. In contrast, in the Renewable Energy scenario, OUC’s fuel mix shifts dramatically over
the study period, transitioning from majority fossil fuels in 2020 to majority renewable energy by 2040.
OUC relies on non-fossil resources for nearly 70 percent of its generation by 2040 and is on track to
meet its renewable energy goal of 100 percent renewables by 2050, as shown in Figure 8.
Figure 6: Coal Continues—generation results
Synapse Energy Economics, Inc. Orlando’s Renewable Energy Future 21
Figure 7: Coal to Gas Conversion—generation
Figure 8: Renewable Energy—generation
Synapse Energy Economics, Inc. Orlando’s Renewable Energy Future 22
3. CONTINUED OPERATION OF STANTON 1 AND 2 ON COAL OR
CONVERSION TO GAS IS NOT CONSISTENT WITH ORLANDO’S
CLIMATE GOALS AND SUBJECTS RATEPAYERS TO UNNECESSARY
RISKS
3.1. OUC must retire Stanton and transition to renewables to reach its climate goals
For the City of Orlando to reach its goal of 100 percent renewable energy by 2050, OUC must begin
taking action to steadily reduce its CO2 emissions. The Renewable Energy scenario shows a cost-effective
resource portfolio that will put OUC on track to reach 100 percent renewable energy and zero emissions
by 2050. In fact, the Renewable Energy scenario puts OUC’s emissions levels 20 percent below the level
required for a zero-emission trajectory by 2040.
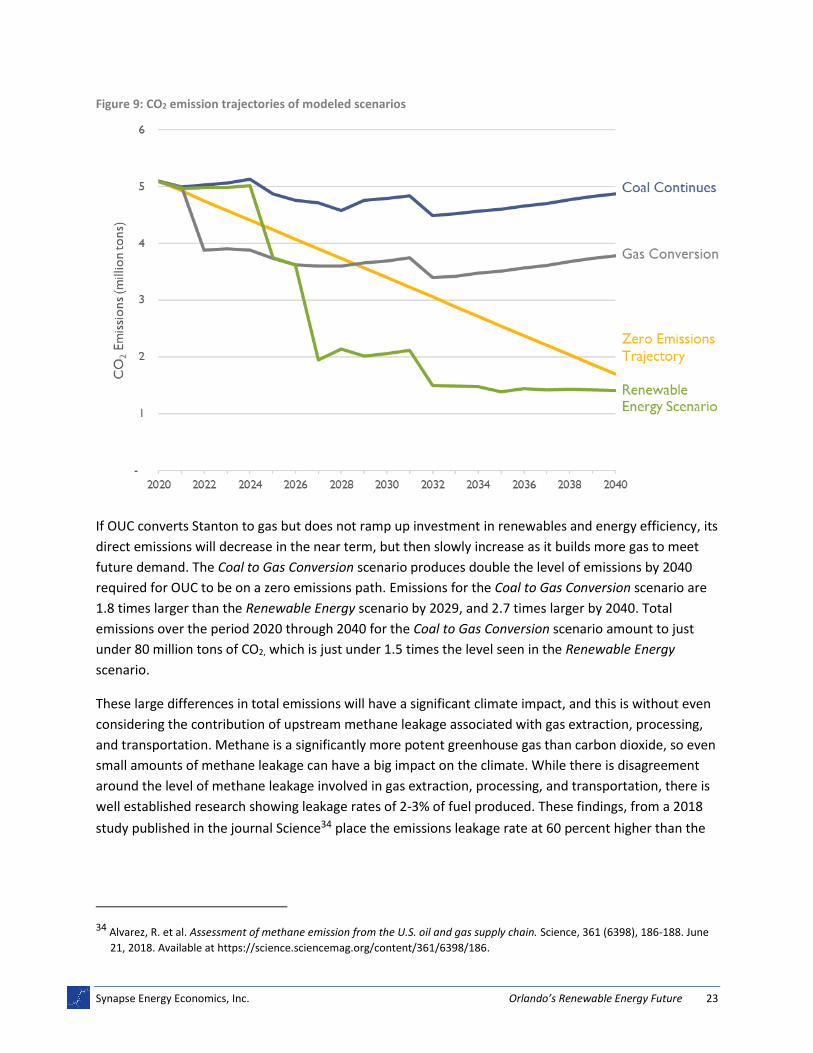
However, as discussed above and shown in Figure 9 below, OUC’s current resource plan does not put
the utility on track to reach zero emissions. In fact, under its current plan, its emissions are likely to go
up relative to current emissions levels. OUC’s resource mix as expressed in its 2020 TYSP produces
emissions levels in 2029 that are 30 percent above the level required for a zero-emission trajectory, and
our modeling of the Coal Continues scenario finds that, if OUC continues on its current path, emission
levels in 2040 will be nearly three times the level needed for a zero-emission trajectory. Emissions in the
Coal Continues scenario are 2.5 times levels seen in the Renewable Energy scenario by 2029, and 3.5
times larger than levels in the Renewable Energy scenario by 2040. Total emissions over the period 2020
through 2040 for the Coal Continues scenario amount to over 100 million tons of CO2, which is nearly
double the level seen in the Renewable Energy scenario.
Synapse Energy Economics, Inc. Orlando’s Renewable Energy Future 23
Figure 9: CO2 emission trajectories of modeled scenarios
If OUC converts Stanton to gas but does not ramp up investment in renewables and energy efficiency, its
direct emissions will decrease in the near term, but then slowly increase as it builds more gas to meet
future demand. The Coal to Gas Conversion scenario produces double the level of emissions by 2040
required for OUC to be on a zero emissions path. Emissions for the Coal to Gas Conversion scenario are
1.8 times larger than the Renewable Energy scenario by 2029, and 2.7 times larger by 2040. Total
emissions over the period 2020 through 2040 for the Coal to Gas Conversion scenario amount to just
under 80 million tons of CO2, which is just under 1.5 times the level seen in the Renewable Energy
scenario.
These large differences in total emissions will have a significant climate impact, and this is without even
considering the contribution of upstream methane leakage associated with gas extraction, processing,
and transportation. Methane is a significantly more potent greenhouse gas than carbon dioxide, so even
small amounts of methane leakage can have a big impact on the climate. While there is disagreement
around the level of methane leakage involved in gas extraction, processing, and transportation, there is
well established research showing leakage rates of 2-3% of fuel produced. These findings, from a 2018
study published in the journal Science34 place the emissions leakage rate at 60 percent higher than the
34 Alvarez, R. et al. Assessment of methane emission from the U.S. oil and gas supply chain. Science, 361 (6398), 186-188. June
21, 2018. Available at https://science.sciencemag.org/content/361/6398/186.
Synapse Energy Economics, Inc. Orlando’s Renewable Energy Future 24
current leak rate of 1.4 percent used by U.S. EPA.35 A more recent study published in April 2020
evaluated methane leaks from the Permian Basin located in New Mexico and Texas and found that 3.7
percent of gas produced in this basin is leaked into the atmosphere. This means that the emissions
associated with all fossil scenarios is understated in our results.36
3.2. Continued reliance on fossil fuels resources exposes ratepayers to significant economic and health risks
There are many risks associated with reliance on fossil fuel resources that we have not factored into our
analysis. We have omitted them here due to either the level of uncertainty associated with if and how
they will materialize or the challenge with monetizing the risks to incorporate into analysis. However,
these risks do not exist to the same extent if OUC transitions toward renewables, battery storage, and
demand-side management. Therefore, OUC should consider and incorporate these risks into its analysis
and decision-making processes.
First, future environmental regulations could require OUC to invest in capital upgrades to existing fossil
infrastructure to comply, or otherwise increase the costs of operating existing fossil fuel units. This could
take the form of an emissions or pollutant limitation, or implementation of a CO2 price at the state or
federal level. Further, reliance on resources that require fossil fuels to operate (gas especially) present
the risk of fuel price volatility.
Investment in the coal to gas conversion at Stanton Energy Center, or in any future gas assets, presents
a stranded asset risk as well. Declining renewable energy and storage costs, state or federal policy,
future gas price increases, or other future plant costs may make it uneconomic to continue operating
gas plants long before OUC’s investment in the plant is depreciated. If it is no longer legal or economic
for OUC to operate a specific asset, either the OUC ratepayers or the citizens of Orlando will be stuck
paying the bill for an asset that is no longer providing any value.
Further, continued reliance on fossil fuels subjects community members (ratepayers) to health risks
from air pollution. This exposure exacerbates lung and heart conditions37 and increases vulnerability to
certain diseases, including COVID-19.38
35 U.S. EPA, Inventory of U.S. Greenhouse Emission and Sinks, 1990 – 2016. April 12, 2018. Available at
https://www.epa.gov/sites/production/files/2018-01/documents/2018_complete_report.pdf.
36 Zhang, Yuzhong, Ritesh Gautam, et al. Quantifying methane emissions from the largest oil-producing basin in the United
States from space. Science Advances, Vol 6, No. 17. 22 April 2020. Available at https://advances.sciencemag.org/content/6/17/eaaz5120.
37 Centers for Disease Control and Prevention, Air Quality webpage. Accessed June 4, 2020. Available at
https://www.cdc.gov/air/air_health.htm.
38 Wu, X., Nethery, R. C., Sabath, B. M., Braun, D., & Dominici, F. 2020. “Exposure to air pollution and COVID-19 mortality in the
United States.” medRxiv. April 27, 2020. Available at https://www.medrxiv.org/content/10.1101/2020.04.05.20054502v2.
Synapse Energy Economics, Inc. Orlando’s Renewable Energy Future 25
4. REPLACING STANTON’S COAL UNITS WITH RENEWABLE ENERGY
RESOURCES CREATES HIGH QUALITY LOCAL JOBS
Synapse conducted an analysis of the
economic benefits of OUC investing in
renewable energy, battery storage, and
energy efficiency. This evaluation focuses on
the change in jobs that would result from a
transition in the utility’s electricity supply-
and demand-side resources. The core of the
analysis compares current spending on
existing resources in the Coal Continues
scenario to a future in which OUC pursues
one of the two alternative scenarios
described in Section 2: Coal to Gas
Conversion, or Renewable Energy. We find
that the Coal to Gas Conversion scenario is
expected to lose around 2,000 net job-years
while the Renewable Energy scenario is
expected to create around 11,000 net job-
years over the period 2020–2040 relative to
the Coal Continues scenario. Full results are
discussed in Section 4.2 below.
4.1. Investment in renewable energy delivers more local benefits than continued reliance on fossil fuels
Investments in energy efficiency, solar
power, wind power, and batteries can
strengthen local and state economies while
saving ratepayers money. Together, there
are nearly three million U.S. jobs dedicated
to these energy resources.39 Over half of
39 National Association of State Energy Officials and Energy Futures Initiative. The 2019 U.S. Energy & Employment Report.
2019.
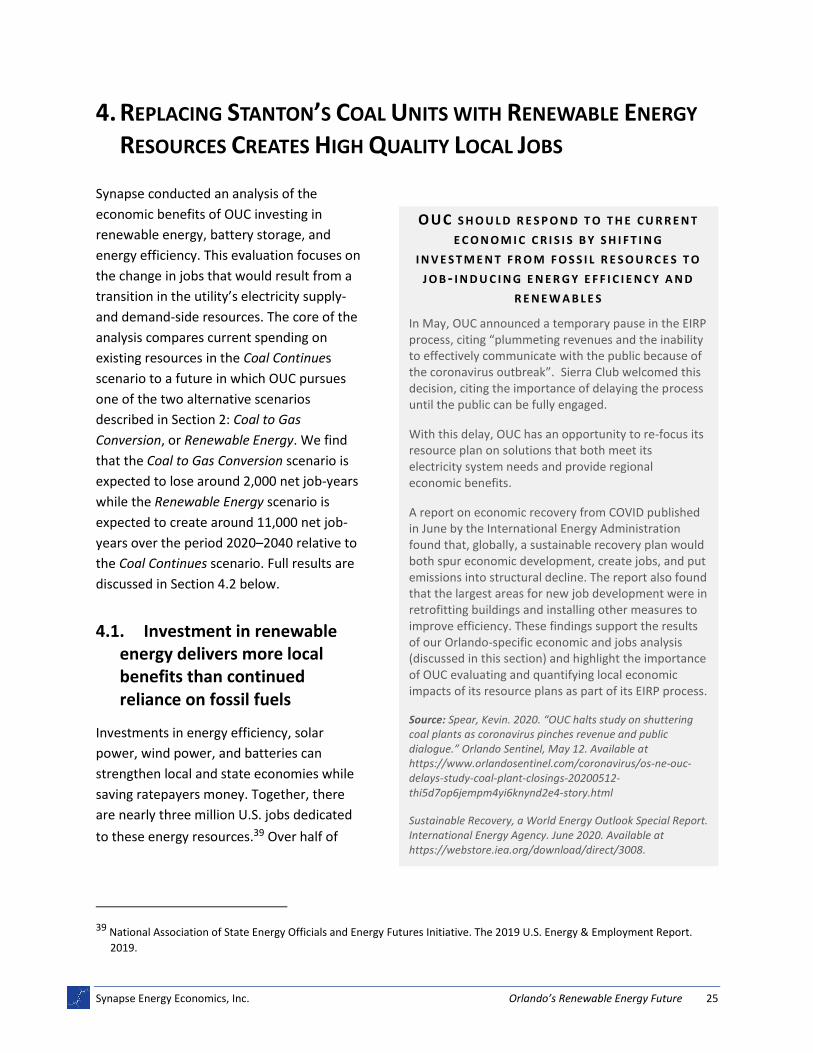
OUC S H O U L D R E S P O N D T O T H E C U R R E N T
E C O N O M I C C R I S I S B Y S H I F T I N G
I N V E S T M E N T F R O M F O S S I L R E S O U R C E S T O
J O B - I N D U C I N G E N E R G Y E F F I C I E N C Y A N D
R E N E W A B L E S
In May, OUC announced a temporary pause in the EIRP process, citing “plummeting revenues and the inability to effectively communicate with the public because of the coronavirus outbreak”. Sierra Club welcomed this decision, citing the importance of delaying the process until the public can be fully engaged.
With this delay, OUC has an opportunity to re-focus its resource plan on solutions that both meet its electricity system needs and provide regional economic benefits.
A report on economic recovery from COVID published in June by the International Energy Administration found that, globally, a sustainable recovery plan would both spur economic development, create jobs, and put emissions into structural decline. The report also found that the largest areas for new job development were in retrofitting buildings and installing other measures to improve efficiency. These findings support the results of our Orlando-specific economic and jobs analysis (discussed in this section) and highlight the importance of OUC evaluating and quantifying local economic impacts of its resource plans as part of its EIRP process.
Source: Spear, Kevin. 2020. “OUC halts study on shuttering coal plants as coronavirus pinches revenue and public dialogue.” Orlando Sentinel, May 12. Available at https://www.orlandosentinel.com/coronavirus/os-ne-ouc-delays-study-coal-plant-closings-20200512-thi5d7op6jempm4yi6knynd2e4-story.html
Sustainable Recovery, a World Energy Outlook Special Report. International Energy Agency. June 2020. Available at https://webstore.iea.org/download/direct/3008.

Synapse Energy Economics, Inc. Orlando’s Renewable Energy Future 26
those jobs are in the construction sector,40 which support the economies where these energy resources
are installed. Additionally, energy efficiency investments save ratepayers money by reducing utility bills,
which can create new jobs when the savings are re-spent in the economy.41
Transitioning away from fossil-fuel-based electricity generation can create a net increase in jobs
associated with low-carbon energy supply and energy efficiency. Compared with investment in fossil
fuels, renewables and energy efficiency create between two and three times as many jobs for the same
quantity of spending.42 Further, a large portion of expenditures on coal and gas leave the Florida
economy, as there are relatively few in-state jobs in these industries. The mining and extraction jobs
sector represented 0.18 percent of all Florida jobs in 2018, which is one-quarter of the national share for
this sector.43 Reduced spending on coal and gas generation will result in job loss in these sectors.
However, this should be considered alongside the increase in renewable and energy efficiency jobs to
understand the overall net impact. Thoughtful consideration should be given to how to transition any
workers who lose jobs.
4.2. In Orlando, transitioning to renewables will create over 11,000 net job-years over the next two decades
Synapse created an economic input/output model to evaluate the number of jobs that would be created
under the Coal to Gas Conversion and Renewable Energy scenarios. Our model converts changes in OUC
spending by energy resource into job impact outcomes. We consider job losses associated with declining
investment in fossil fuel generation. Additionally, we quantify the jobs that would be created by
ratepayer re-spending of (1) utility savings from energy efficiency and (2) rate reductions resulting from
lower cost energy resources. A description of the model, our methodology, and the economic
parameters we use are included in Appendix C.
We estimate job creation in units of “net job-years.” Each job-year represents a single full-time
equivalent job for a single year. Some jobs are temporary, such as construction jobs for one-time
projects. Others are longer term and involve ongoing operation and maintenance or program
implementation (e.g. a weatherization program that is funded for numerous years). Therefore, defining
the job creation in terms of “job-years” is a way to equally account for both temporary and long-term
jobs. Our results are “net” because they represent (1) the increase in jobs due to new investment in
40 Id.
41 See, for example: Camp, E., J. Hall, P. Knight, C. Odom. 2020. Investing in Public Infrastructure in Massachusetts: Impacts of
Investment in Clean Energy, Water, and Transportation. Synapse Energy Economics for Labor Network for Sustainability.
42 Garrett-Peltier, H., 2017. “Green versus brown: Comparing the employment impacts of energy efficiency, renewable energy,
and fossil fuels using an input-output model.” Economic Modelling, 61, pp.439-447.
43 Bureau of Economic Analysis. 2019. Regional Data, Total Full-Time and Part-Time Employment by NAICS Industry. Available
at https://www.bea.gov/data/employment/employment-by-state.
Synapse Energy Economics, Inc. Orlando’s Renewable Energy Future 27
renewables and energy efficiency and (2) the decrease in jobs due to reduced spending for fossil-fuel-
based generation.
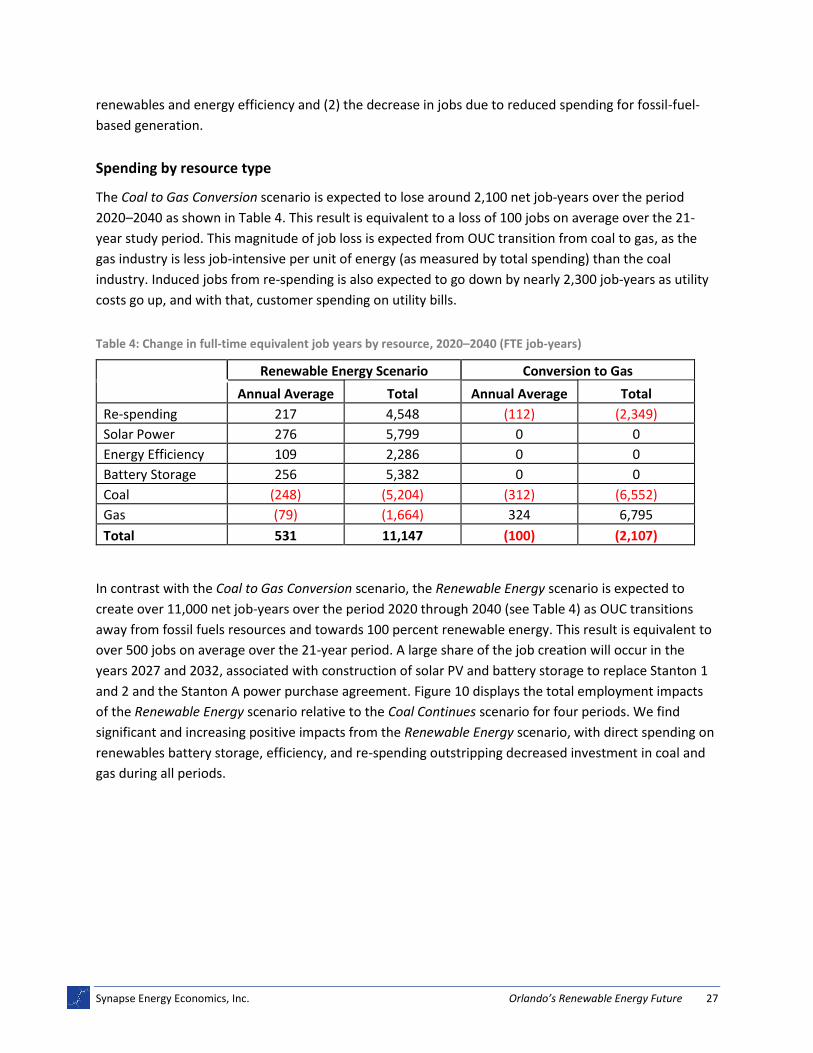
Spending by resource type
The Coal to Gas Conversion scenario is expected to lose around 2,100 net job-years over the period
2020–2040 as shown in Table 4. This result is equivalent to a loss of 100 jobs on average over the 21-
year study period. This magnitude of job loss is expected from OUC transition from coal to gas, as the
gas industry is less job-intensive per unit of energy (as measured by total spending) than the coal
industry. Induced jobs from re-spending is also expected to go down by nearly 2,300 job-years as utility
costs go up, and with that, customer spending on utility bills.
Table 4: Change in full-time equivalent job years by resource, 2020–2040 (FTE job-years)
Renewable Energy Scenario Conversion to Gas
Annual Average Total Annual Average Total
Re-spending 217 4,548 (112) (2,349)
Solar Power 276 5,799 0 0
Energy Efficiency 109 2,286 0 0
Battery Storage 256 5,382 0 0
Coal (248) (5,204) (312) (6,552)
Gas (79) (1,664) 324 6,795
Total 531 11,147 (100) (2,107)
In contrast with the Coal to Gas Conversion scenario, the Renewable Energy scenario is expected to
create over 11,000 net job-years over the period 2020 through 2040 (see Table 4) as OUC transitions
away from fossil fuels resources and towards 100 percent renewable energy. This result is equivalent to
over 500 jobs on average over the 21-year period. A large share of the job creation will occur in the
years 2027 and 2032, associated with construction of solar PV and battery storage to replace Stanton 1
and 2 and the Stanton A power purchase agreement. Figure 10 displays the total employment impacts
of the Renewable Energy scenario relative to the Coal Continues scenario for four periods. We find
significant and increasing positive impacts from the Renewable Energy scenario, with direct spending on
renewables battery storage, efficiency, and re-spending outstripping decreased investment in coal and
gas during all periods.

Synapse Energy Economics, Inc. Orlando’s Renewable Energy Future 28
Figure 10: Total employment impacts of the Renewable Energy scenario relative to Coal Continues
Solar PV accounts for the largest economic impact at nearly 5,800 job-years, followed by Battery Storage
at around 5,400 job-years. Energy efficiency also has a strong economic impact of around 2,300 job-
years. Induced jobs from customer re-spending of utility savings accounts for 2,800 job-years based on
efficiency savings, and an additional 1,000 job-years based on other decreased utility spending (and
therefore lower customer spending). See Appendix C for discussion of induced jobs. Job losses in coal
and gas are expected to be 5,200 and 1,700 job-years, respectively. However, as discussed above, a
large portion of these jobs are expected to be based outside of the state of Florida.
Job impacts by sector
Investment in energy efficiency, renewables, and energy storage creates high-quality jobs. The average
worker income for the new jobs will vary by resource and sector. At the low end, jobs in the “other
services” sector (non-professional and non-business services) will earn an average income of $53,865. At
the high end, solar power manufacturing jobs will earn $149,149 on average. In our Renewable Energy
scenario, the weighted average income for the created jobs across all resources and all sectors is
estimated to be $72,976 as compared to an economy-wide average of $62,977.
Many of the jobs created by investment in energy efficiency, renewable energy, and batteries would be
local. As shown in Table 5, nearly 70 percent of these new jobs would occur in the construction sector,
which we expect would be in the OUC service territory and surrounding area where the new resources
would be installed. Additionally, new local jobs will be created to the extent that ratepayers reinvest
utility savings back into the local economy. Transitioning away from fossil-fuel-based generation will
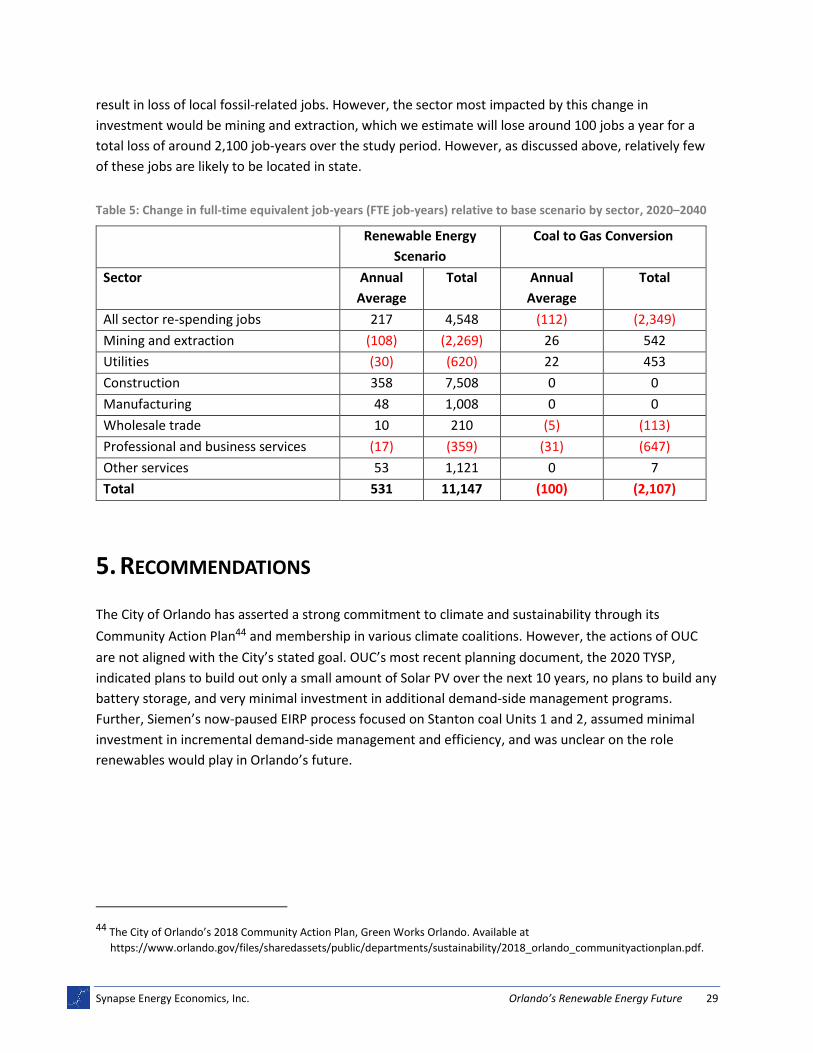
Synapse Energy Economics, Inc. Orlando’s Renewable Energy Future 29
result in loss of local fossil-related jobs. However, the sector most impacted by this change in
investment would be mining and extraction, which we estimate will lose around 100 jobs a year for a
total loss of around 2,100 job-years over the study period. However, as discussed above, relatively few
of these jobs are likely to be located in state.
Table 5: Change in full-time equivalent job-years (FTE job-years) relative to base scenario by sector, 2020–2040
Renewable Energy
Scenario
Coal to Gas Conversion
Sector Annual
Average
Total Annual
Average
Total
All sector re-spending jobs 217 4,548 (112) (2,349)
Mining and extraction (108) (2,269) 26 542
Utilities (30) (620) 22 453
Construction 358 7,508 0 0
Manufacturing 48 1,008 0 0
Wholesale trade 10 210 (5) (113)
Professional and business services (17) (359) (31) (647)
Other services 53 1,121 0 7
Total 531 11,147 (100) (2,107)
5. RECOMMENDATIONS
The City of Orlando has asserted a strong commitment to climate and sustainability through its
Community Action Plan44 and membership in various climate coalitions. However, the actions of OUC
are not aligned with the City’s stated goal. OUC’s most recent planning document, the 2020 TYSP,
indicated plans to build out only a small amount of Solar PV over the next 10 years, no plans to build any
battery storage, and very minimal investment in additional demand-side management programs.
Further, Siemen’s now-paused EIRP process focused on Stanton coal Units 1 and 2, assumed minimal
investment in incremental demand-side management and efficiency, and was unclear on the role
renewables would play in Orlando’s future.
44 The City of Orlando’s 2018 Community Action Plan, Green Works Orlando. Available at
https://www.orlando.gov/files/sharedassets/public/departments/sustainability/2018_orlando_communityactionplan.pdf.
Synapse Energy Economics, Inc. Orlando’s Renewable Energy Future 30
Given the significant disconnect between Orlando’s stated climate commitments and the action of its
electric utility, the City must now act to align all plans and actions that impact climate and energy use
with the City’s stated goals. OUC must provide Orlando a clear plan on how it will transition from its
current reliance on fossil fuels to a clean system that relies on solar PV, battery storage, and energy
efficiency. A renewable portfolio will not only provide environmental benefits, but as we have shown in
this report, will save the citizens of Orlando hundreds of millions of dollars directly, in addition to
providing significant local jobs and economic stimulus, and protecting public health.
Our specific recommendations are as follows:
1. OUC must use the EIRP being prepared by Siemens to chart a path to 100 percent renewables by 2050. The plan should include a transparent evaluation of the economic retirement dates for OUC’s coal plants at Stanton and all other fossil fuel resources; should include no new fossil fuel resources; and should replace all retired resources and meet any future load growth with solar PV, battery storage, and demand-side management solutions.
2. OUC needs to develop best-in-class energy efficiency programs to reduce load and target peak demand, and dramatically scale up investment in these programs to achieve incremental savings of at least one percent of retail sales per year.
3. OUC and the City of Orlando should evaluate the risk of any further investments in coal and gas plants being rendered uneconomic before the end of their useful life by policy changes and continued clean energy cost declines.
4. OUC and the City of Orlando should quantify the job and community impacts of its selected resource plan and ensure that OUC’s resource plan yields local investment and local clean energy jobs. Especially now, as the City of Orlando battles a public health crisis and the resulting impact of job losses, OUC’s has the ability to choose a path that can lead to cleaner air and create locally-based, high-quality jobs for Orlando residents.
Synapse Energy Economics, Inc. Orlando’s Renewable Energy Future A-1
Appendix A. RESOURCE PLAN METHODOLOGY AND INPUTS
Model description
Synapse designed a spreadsheet model to evaluate the NPVRR of three scenarios. Our analysis
compares a series of capacity expansion scenarios to determine the lowest cost resource plan. We do
not perform optimized capacity expansion and production cost modeling; rather we screen several likely
scenarios. We evaluate energy balance and capacity needs for the summer and winter season of each
year.
Peak load and annual energy
For peak load and annual energy, Synapse relied on OUC’s 2020 TYSP for the period 2020–2029. For the
years 2030–2040, Synapse applied the compound annual growth rate (CAGR) from the period 2025–
2029 to the OUC’s project 2029 values. We did not make any changes to OUC’s embedded electric
vehicle load assumptions.
We matched generation values between 2020 and 2029 to the energy balance by resource type as
displayed in Schedule 6.1 of OUC’s TYSP for the Coal Continues scenario. We adjusted Stanton B up and
down as needed to calibrate the model. We assumed that going forward, system energy needs would be
met if each existing resource continues to operate at the approximate capacity factor observed during
the period 2025–2029.
We designed all portfolios to meet a 15 percent reserve margin in both the summer and winter.
Fuel prices
Synapse relied on the coal price forecast that Siemens prepared for OUC with local delivery charges
calculated. We are not including the specifics of the forecast here due to confidentiality concerns.
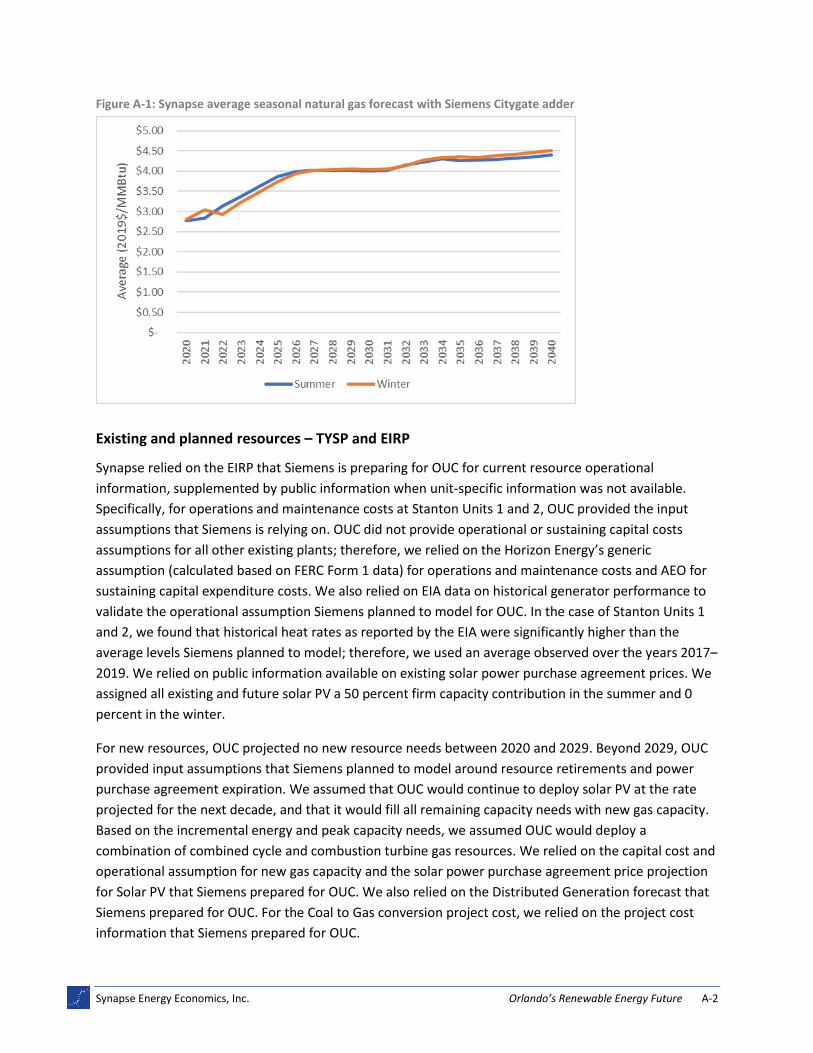
Synapse relied on our own internal gas price forecast for Henry Hub base prices and applied Siemens
FGT Citygate basis for the local delivery adder (Figure A-1). Our Henry Hub gas price forecast relies on
NYMEX futures for monthly prices through December 2021. Starting in January 2025, we use the annual
average prices projected in the U.S. Energy Information Administration’s Annual Energy Outlook (AEO)
2020. For 2022–2024, we linearly interpolate the annual price from the NYMEX (2021) value to the AEO
(2025) value. We then apply a monthly shape for 2022–2024 prices that is based on the average
monthly prices from 2017 to 2020. We apply trends in average monthly prices observed in the NYMEX
futures to the longer-term gas price to develop long-term monthly trends.
Synapse Energy Economics, Inc. Orlando’s Renewable Energy Future A-2
Figure A-1: Synapse average seasonal natural gas forecast with Siemens Citygate adder
Existing and planned resources – TYSP and EIRP
Synapse relied on the EIRP that Siemens is preparing for OUC for current resource operational
information, supplemented by public information when unit-specific information was not available.
Specifically, for operations and maintenance costs at Stanton Units 1 and 2, OUC provided the input
assumptions that Siemens is relying on. OUC did not provide operational or sustaining capital costs
assumptions for all other existing plants; therefore, we relied on the Horizon Energy’s generic
assumption (calculated based on FERC Form 1 data) for operations and maintenance costs and AEO for
sustaining capital expenditure costs. We also relied on EIA data on historical generator performance to
validate the operational assumption Siemens planned to model for OUC. In the case of Stanton Units 1
and 2, we found that historical heat rates as reported by the EIA were significantly higher than the
average levels Siemens planned to model; therefore, we used an average observed over the years 2017–
2019. We relied on public information available on existing solar power purchase agreement prices. We
assigned all existing and future solar PV a 50 percent firm capacity contribution in the summer and 0
percent in the winter.
For new resources, OUC projected no new resource needs between 2020 and 2029. Beyond 2029, OUC
provided input assumptions that Siemens planned to model around resource retirements and power
purchase agreement expiration. We assumed that OUC would continue to deploy solar PV at the rate
projected for the next decade, and that it would fill all remaining capacity needs with new gas capacity.
Based on the incremental energy and peak capacity needs, we assumed OUC would deploy a
combination of combined cycle and combustion turbine gas resources. We relied on the capital cost and
operational assumption for new gas capacity and the solar power purchase agreement price projection
for Solar PV that Siemens prepared for OUC. We also relied on the Distributed Generation forecast that
Siemens prepared for OUC. For the Coal to Gas conversion project cost, we relied on the project cost
information that Siemens prepared for OUC.

Synapse Energy Economics, Inc. Orlando’s Renewable Energy Future A-3
Renewable Energy scenario projects
Synapse developed our own energy efficiency forecast for the Renewable Energy scenario. We ramped
up investment in energy efficiency between now and 2025 to reach the national average of 1.03 percent
annual incremental savings from energy efficiency as a percent of total retail sales. We relied on data
from the U.S. EIA and ACEEE 2020 Utility Energy Efficiency report card for average program performance
metrics.
We estimated energy efficiency program costs by comparing OUC’s energy efficiency program
performance to those of other Florida utilities. We made the conservative assumption that energy
efficiency program costs in the early years will mirror those of other Florida utilities with poor energy
efficiency performance (Florida Power and Light) and will decline as energy efficiency programs ramp up
to more closely approximate those of other Florida utilities with more average energy efficiency
performance (Duke Energy Florida). We relied on data from the U.S. EIA and ACEEE 2020 Utility Energy
Efficiency report card for cost and performance data.
We relied on the cost data that Siemens provided to OUC for solar power purchase agreement costs,
and Annual Technology Baseline (ATB) from NREL for utility-owned solar PV and battery storage cost
assumptions. We assumed that solar contributes 50 percent firm capacity in the summer and 0 percent
firm capacity in the winter based on OUC’s current modeling assumption.
Synapse Energy Economics, Inc. Orlando’s Renewable Energy Future B-1
Appendix B. DETAILED RESOURCE PLAN SCENARIO RESULTS
In this section we provide additional results to supplement the results provided in the report and
executive summary. Specifically, we provide:
Annual revenue requirement for each scenario broken down by resource type:
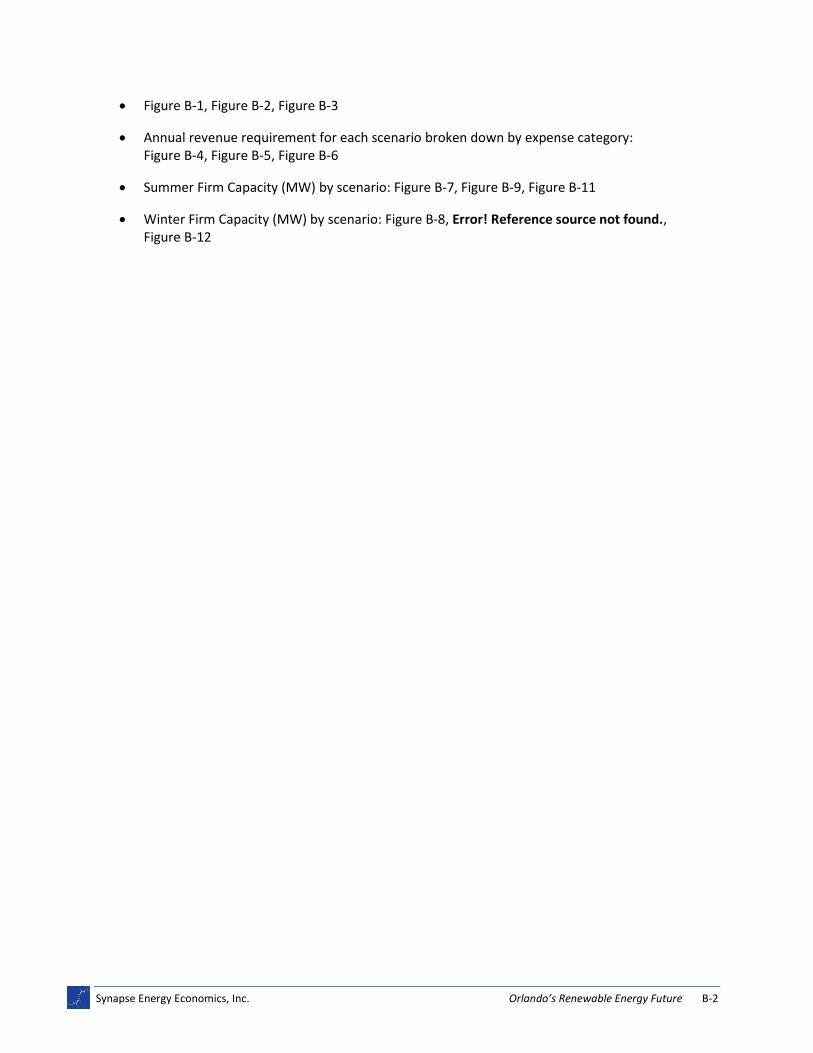
Synapse Energy Economics, Inc. Orlando’s Renewable Energy Future B-2
• Figure B-1, Figure B-2, Figure B-3
• Annual revenue requirement for each scenario broken down by expense category: Figure B-4, Figure B-5, Figure B-6
• Summer Firm Capacity (MW) by scenario: Figure B-7, Figure B-9, Figure B-11
• Winter Firm Capacity (MW) by scenario: Figure B-8, Error! Reference source not found., Figure B-12
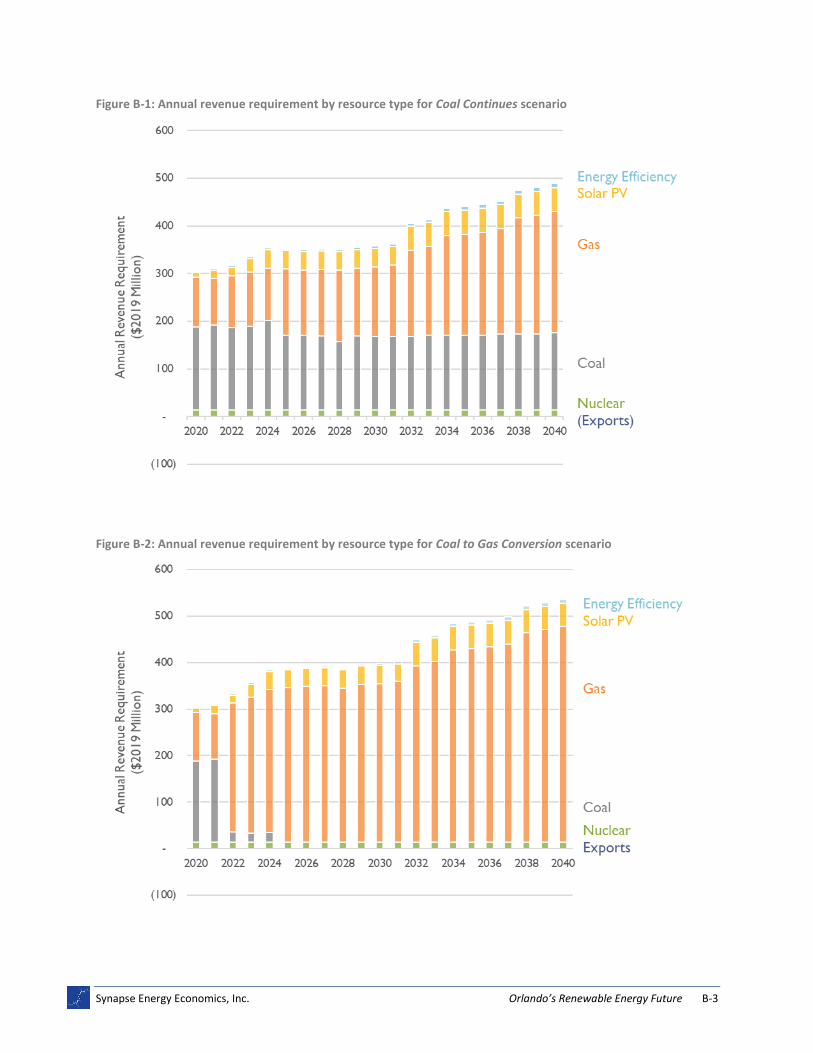
Synapse Energy Economics, Inc. Orlando’s Renewable Energy Future B-3
Figure B-1: Annual revenue requirement by resource type for Coal Continues scenario
Figure B-2: Annual revenue requirement by resource type for Coal to Gas Conversion scenario
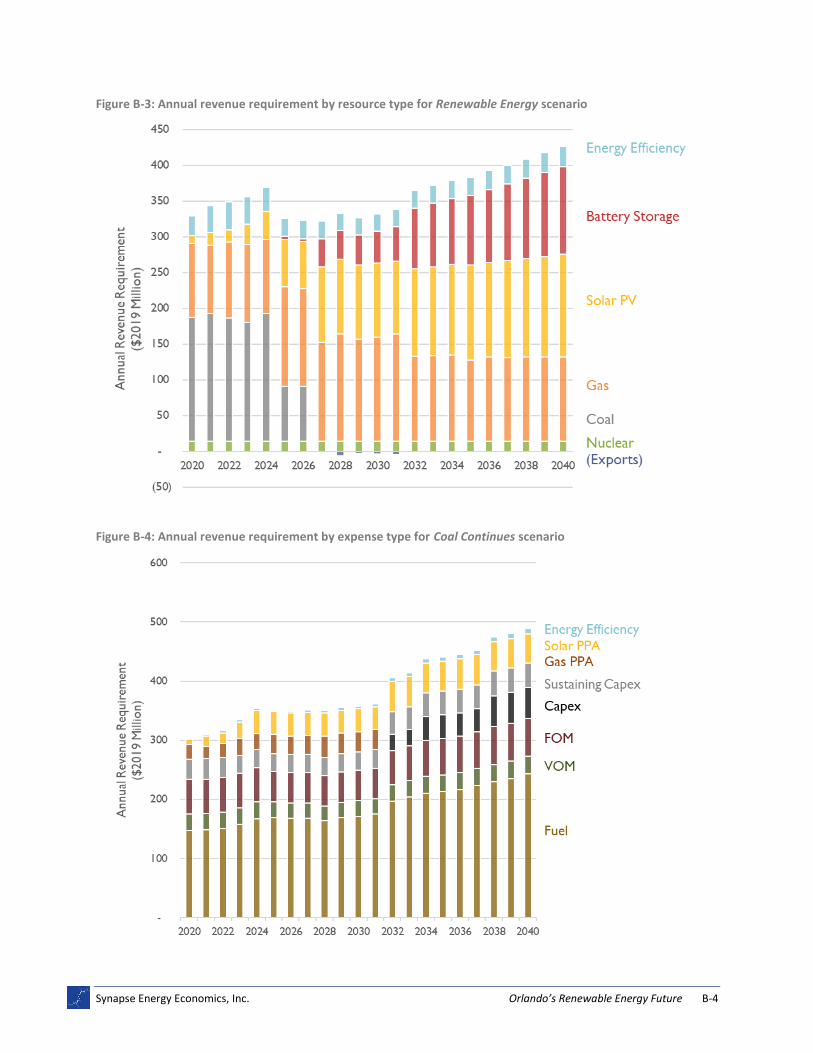
Synapse Energy Economics, Inc. Orlando’s Renewable Energy Future B-4
Figure B-3: Annual revenue requirement by resource type for Renewable Energy scenario
Figure B-4: Annual revenue requirement by expense type for Coal Continues scenario
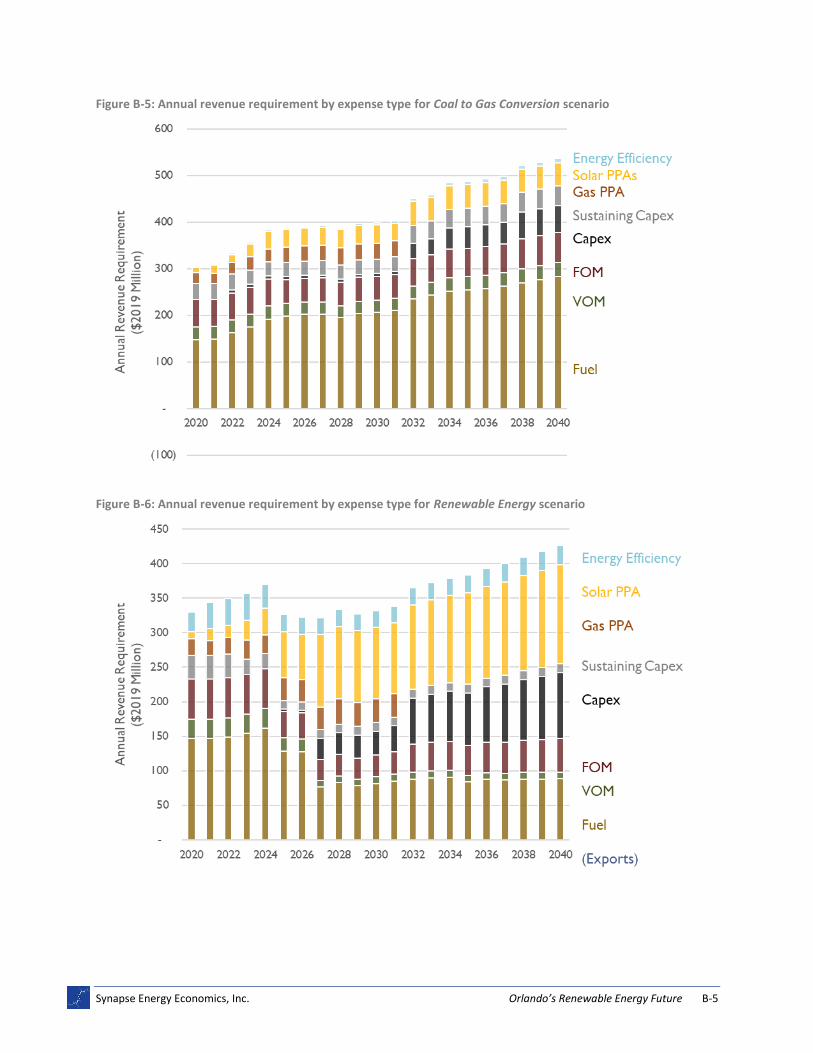
Synapse Energy Economics, Inc. Orlando’s Renewable Energy Future B-5
Figure B-5: Annual revenue requirement by expense type for Coal to Gas Conversion scenario
Figure B-6: Annual revenue requirement by expense type for Renewable Energy scenario
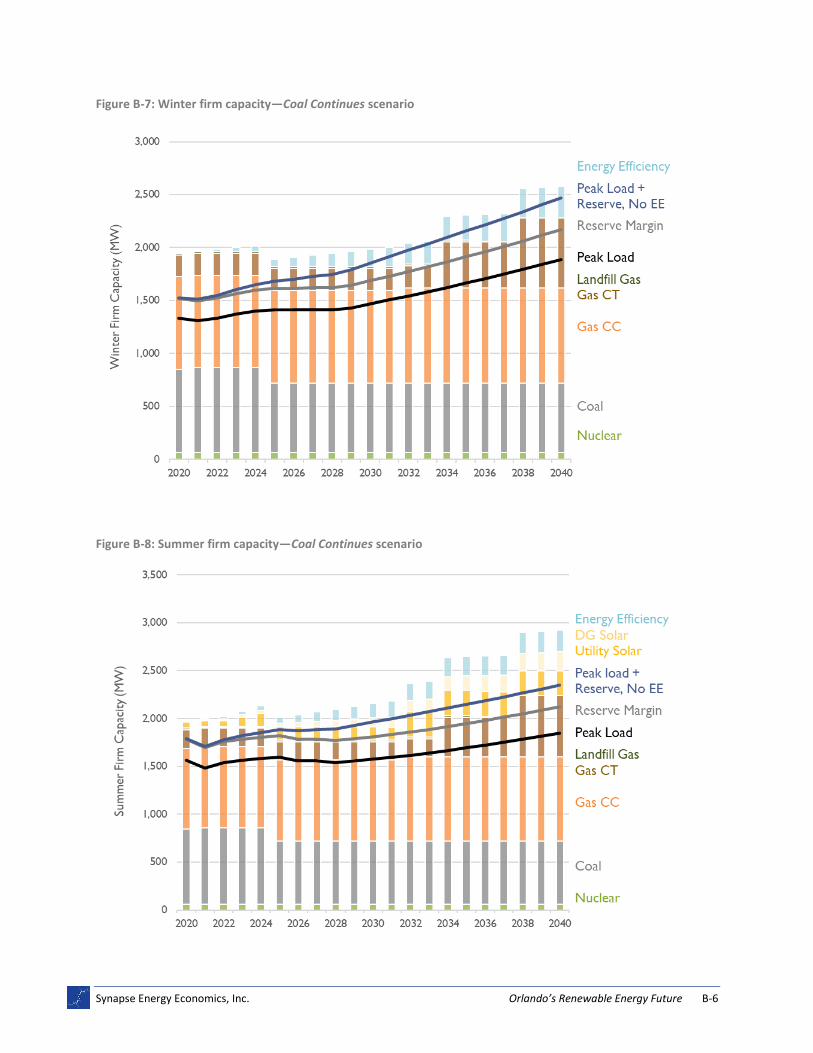
Synapse Energy Economics, Inc. Orlando’s Renewable Energy Future B-6
Figure B-7: Winter firm capacity—Coal Continues scenario
Figure B-8: Summer firm capacity—Coal Continues scenario
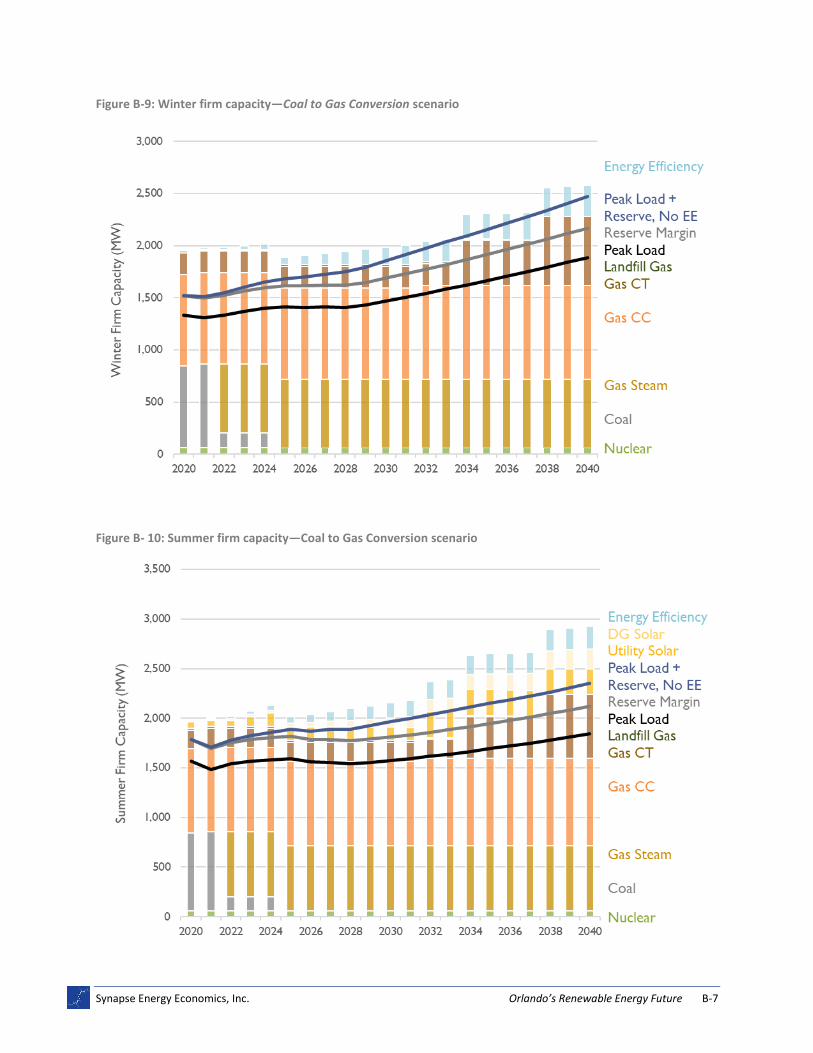
Synapse Energy Economics, Inc. Orlando’s Renewable Energy Future B-7
Figure B-9: Winter firm capacity—Coal to Gas Conversion scenario
Figure B- 10: Summer firm capacity—Coal to Gas Conversion scenario

Synapse Energy Economics, Inc. Orlando’s Renewable Energy Future B-8
Figure B-11: Winter firm capacity—Renewable Energy scenario
Figure B-12: Summer firm capacity—Renewable Energy scenario
Synapse Energy Economics, Inc. Orlando’s Renewable Energy Future C-1
Appendix C. JOBS AND ECONOMIC IMPACTS ANALYSIS
METHODOLOGY AND INPUTS
Synapse developed an input/output model to quantify the jobs that would be created by changes in
OUC investment across a range of energy resources. Figure C-1 provides an overview of this model. Our
analysis uses three sets of economic parameters to estimate the employment impact of investment in
an energy resource:
1. Total U.S. jobs, where one job is a full-time equivalent employment opportunity for one person
2. Labor expenditure share, the fraction of total resource expenditures that is used to pay worker wages
3. Average labor wage, the annual income earned by a full-time worker
We identify U.S. employment levels through economic literature specific to the energy sector.45 For
labor expenditure share and average labor wage, we use data from an industry-standard economic
impact model, IMPLAN.46 Our data are differentiated by resource and sector for each set of economic
parameters:
Energy resources: Sectors:
● Wind Power ● Mining and extraction ● Solar Power ● Utilities ● Energy Efficiency ● Construction ● Battery Storage ● Manufacturing ● Coal ● Wholesale trade ● Natural Gas ● Professional and business services
● Other services
We compute direct, indirect, and induced jobs for each resource. Direct jobs include contractors and
construction workers (among others) working on the construction or operation of the resource. Solar
panel installers and energy efficiency auditors are examples of direct jobs. Indirect jobs are created at
the supplier level, which produces parts, tools, and other inputs to support the construction and
operation of the resource. For instance, an investment in a wind power plant not only creates direct jobs
at the plant site, but also indirect jobs up the supply chain for structural, mechanical, and other
45 National Association of State Energy Officials and Energy Futures Initiative. The 2019 U.S. Energy & Employment Report.
2019.
46 IMPLAN is a commercial model that evaluates job creation and re‐spending associated with a set of costs. It is developed by
IMPLAN Group LLC. Information on IMPLAN is available at: http://implan.com/.
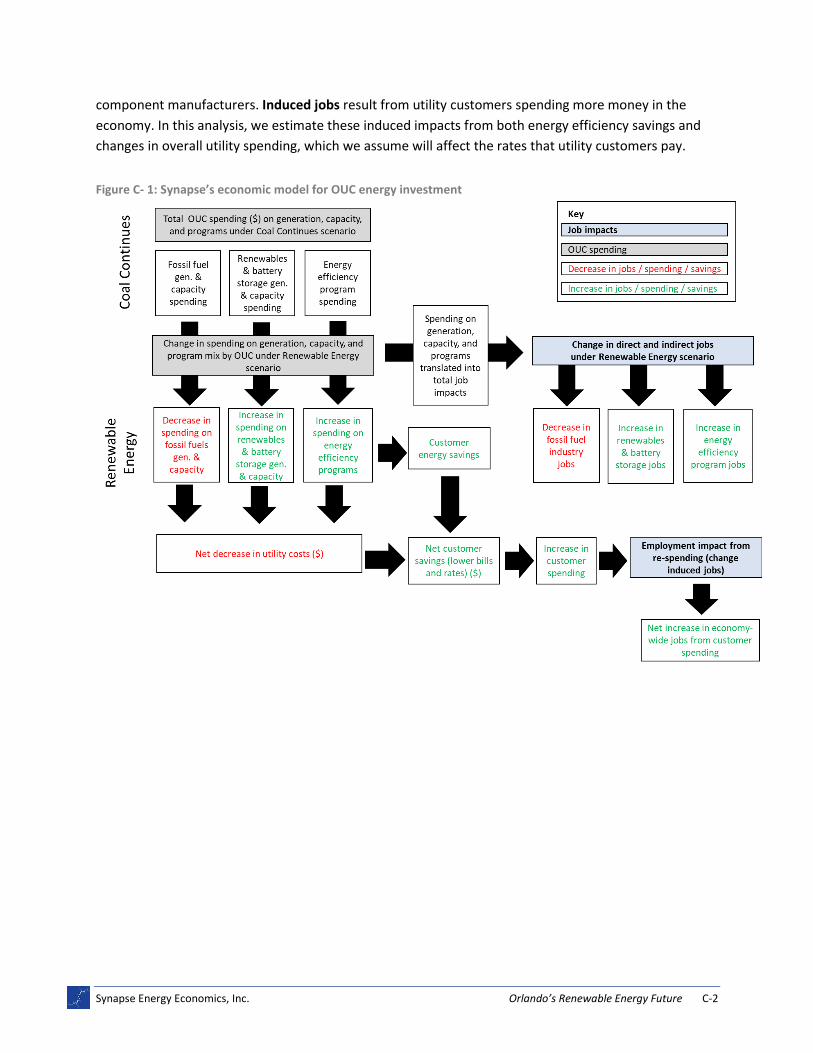
Synapse Energy Economics, Inc. Orlando’s Renewable Energy Future C-2
component manufacturers. Induced jobs result from utility customers spending more money in the
economy. In this analysis, we estimate these induced impacts from both energy efficiency savings and
changes in overall utility spending, which we assume will affect the rates that utility customers pay.
Figure C- 1: Synapse’s economic model for OUC energy investment
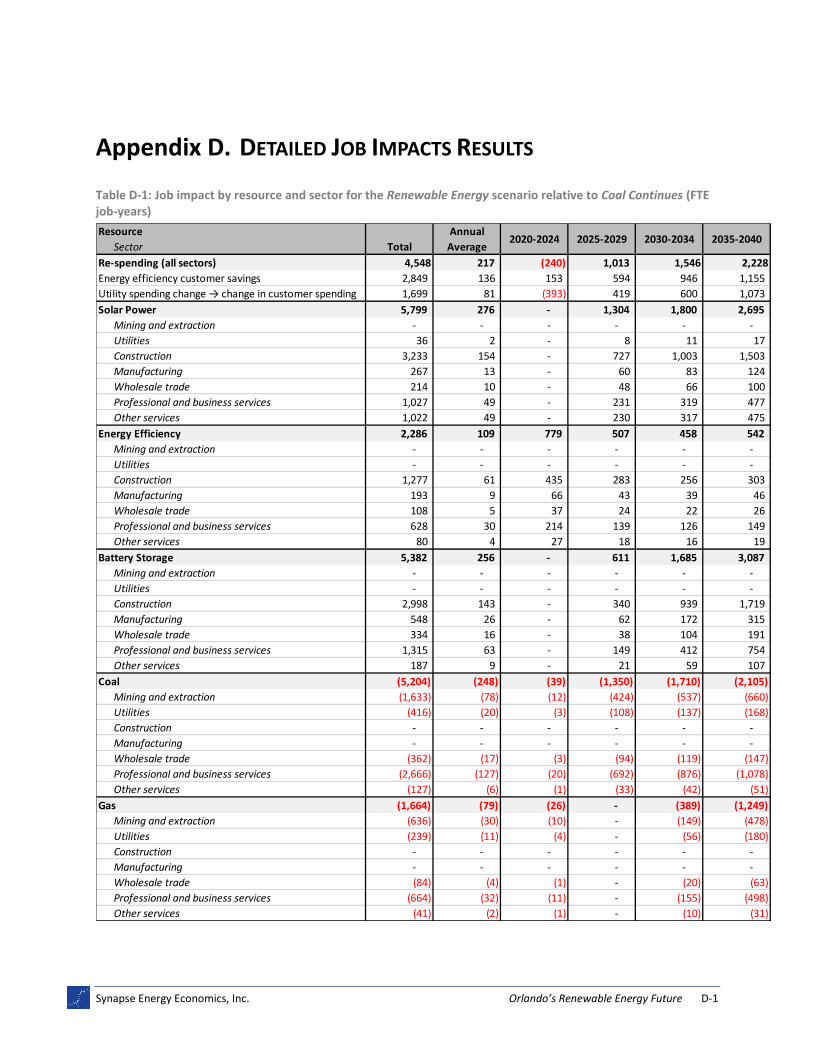
Synapse Energy Economics, Inc. Orlando’s Renewable Energy Future D-1
Appendix D. DETAILED JOB IMPACTS RESULTS
Table D-1: Job impact by resource and sector for the Renewable Energy scenario relative to Coal Continues (FTE job-years)
Resource
Sector Total
Re-spending (all sectors) 4,548 217 (240) 1,013 1,546 2,228
Energy efficiency customer savings 2,849 136 153 594 946 1,155
Utility spending change → change in customer spending 1,699 81 (393) 419 600 1,073
Solar Power 5,799 276 - 1,304 1,800 2,695
Mining and extraction - - - - - -
Utilities 36 2 - 8 11 17
Construction 3,233 154 - 727 1,003 1,503
Manufacturing 267 13 - 60 83 124
Wholesale trade 214 10 - 48 66 100
Professional and business services 1,027 49 - 231 319 477
Other services 1,022 49 - 230 317 475
Energy Efficiency 2,286 109 779 507 458 542
Mining and extraction - - - - - -
Utilities - - - - - -
Construction 1,277 61 435 283 256 303
Manufacturing 193 9 66 43 39 46
Wholesale trade 108 5 37 24 22 26
Professional and business services 628 30 214 139 126 149
Other services 80 4 27 18 16 19
Battery Storage 5,382 256 - 611 1,685 3,087
Mining and extraction - - - - - -
Utilities - - - - - -
Construction 2,998 143 - 340 939 1,719
Manufacturing 548 26 - 62 172 315
Wholesale trade 334 16 - 38 104 191
Professional and business services 1,315 63 - 149 412 754
Other services 187 9 - 21 59 107
Coal (5,204) (248) (39) (1,350) (1,710) (2,105)
Mining and extraction (1,633) (78) (12) (424) (537) (660)
Utilities (416) (20) (3) (108) (137) (168)
Construction - - - - - -
Manufacturing - - - - - -
Wholesale trade (362) (17) (3) (94) (119) (147)
Professional and business services (2,666) (127) (20) (692) (876) (1,078)
Other services (127) (6) (1) (33) (42) (51)
Gas (1,664) (79) (26) - (389) (1,249)
Mining and extraction (636) (30) (10) - (149) (478)
Utilities (239) (11) (4) - (56) (180)
Construction - - - - - -
Manufacturing - - - - - -
Wholesale trade (84) (4) (1) - (20) (63)
Professional and business services (664) (32) (11) - (155) (498)
Other services (41) (2) (1) - (10) (31)
Annual
Average2020-2024 2025-2029 2030-2034 2035-2040
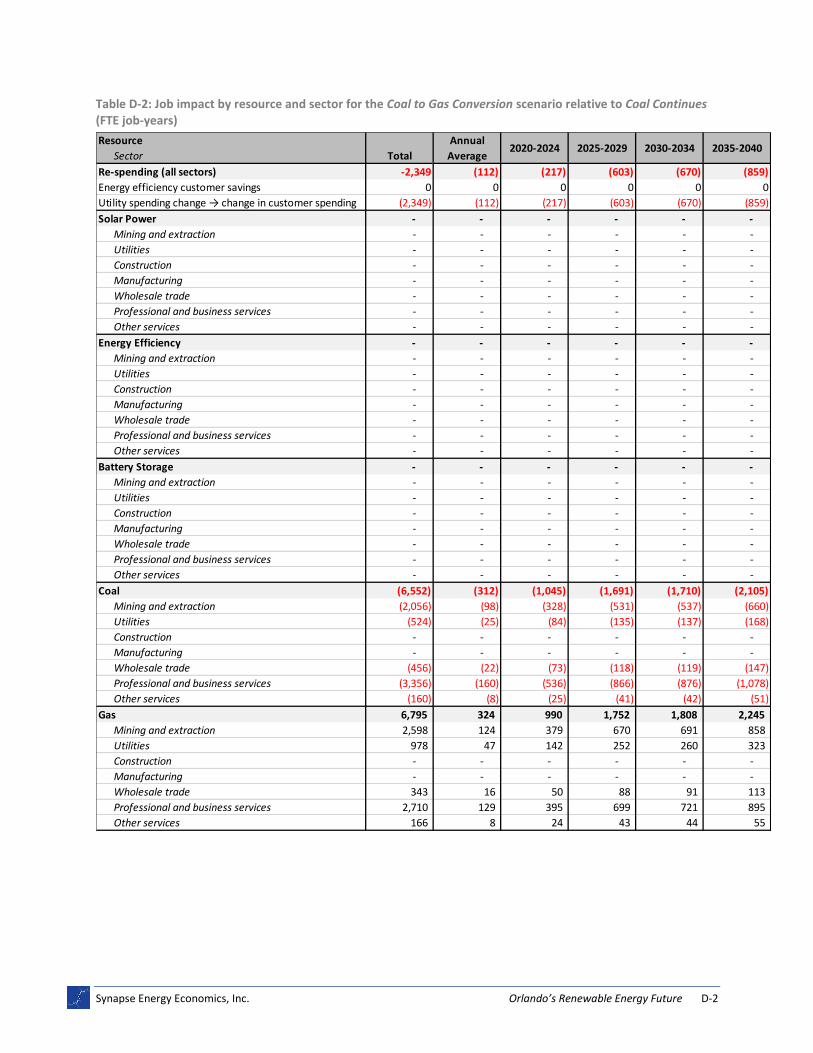
Synapse Energy Economics, Inc. Orlando’s Renewable Energy Future D-2
Table D-2: Job impact by resource and sector for the Coal to Gas Conversion scenario relative to Coal Continues (FTE job-years)
Resource
Sector Total
Re-spending (all sectors) -2,349 (112) (217) (603) (670) (859)
Energy efficiency customer savings 0 0 0 0 0 0
Utility spending change → change in customer spending (2,349) (112) (217) (603) (670) (859)
Solar Power - - - - - -
Mining and extraction - - - - - -
Utilities - - - - - -
Construction - - - - - -
Manufacturing - - - - - -
Wholesale trade - - - - - -
Professional and business services - - - - - -
Other services - - - - - -
Energy Efficiency - - - - - -
Mining and extraction - - - - - -
Utilities - - - - - -
Construction - - - - - -
Manufacturing - - - - - -
Wholesale trade - - - - - -
Professional and business services - - - - - -
Other services - - - - - -
Battery Storage - - - - - -
Mining and extraction - - - - - -
Utilities - - - - - -
Construction - - - - - -
Manufacturing - - - - - -
Wholesale trade - - - - - -
Professional and business services - - - - - -
Other services - - - - - -
Coal (6,552) (312) (1,045) (1,691) (1,710) (2,105)
Mining and extraction (2,056) (98) (328) (531) (537) (660)
Utilities (524) (25) (84) (135) (137) (168)
Construction - - - - - -
Manufacturing - - - - - -
Wholesale trade (456) (22) (73) (118) (119) (147)
Professional and business services (3,356) (160) (536) (866) (876) (1,078)
Other services (160) (8) (25) (41) (42) (51)
Gas 6,795 324 990 1,752 1,808 2,245
Mining and extraction 2,598 124 379 670 691 858
Utilities 978 47 142 252 260 323
Construction - - - - - -
Manufacturing - - - - - -
Wholesale trade 343 16 50 88 91 113
Professional and business services 2,710 129 395 699 721 895
Other services 166 8 24 43 44 55
Annual
Average2020-2024 2025-2029 2030-2034 2035-2040
Recommended