Organization of PJM States, Inc.Gas/Electric Panel
Stan ChapmanSVP, Marketing & Customer Services Oct 8, 2013
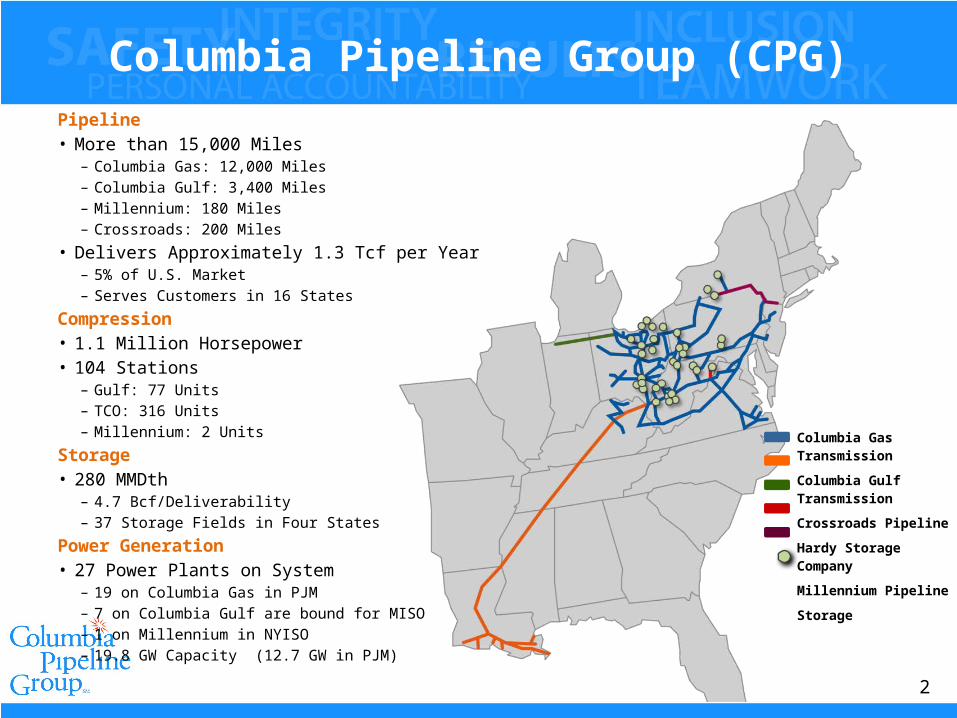
Columbia Pipeline Group (CPG)Pipeline• More than 15,000 Miles
– Columbia Gas: 12,000 Miles– Columbia Gulf: 3,400 Miles– Millennium: 180 Miles– Crossroads: 200 Miles
• Delivers Approximately 1.3 Tcf per Year– 5% of U.S. Market– Serves Customers in 16 States
Compression • 1.1 Million Horsepower• 104 Stations
– Gulf: 77 Units– TCO: 316 Units– Millennium: 2 Units
Storage• 280 MMDth
– 4.7 Bcf/Deliverability– 37 Storage Fields in Four States
Power Generation• 27 Power Plants on System
– 19 on Columbia Gas in PJM– 7 on Columbia Gulf are bound for MISO– 1 on Millennium in NYISO– 19.8 GW Capacity (12.7 GW in PJM)
Columbia Gas Transmission
Columbia Gulf Transmission
Crossroads Pipeline
Hardy Storage Company
Millennium Pipeline
Storage
2

Collaboration
3
Columbia Gas Transmission & PJM Collaboration Non Disclosure Agreement Joint Gas/Electric Harmonization Interests
3

Power Generation along TCO System
44
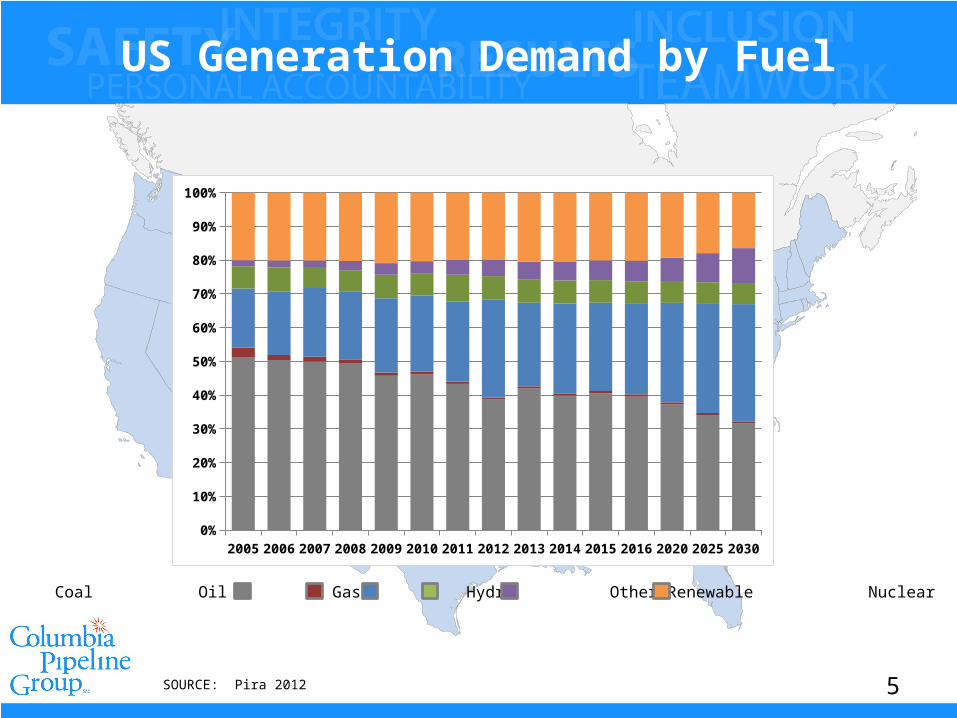
US Generation Demand by Fuel
5
2005 2006 2007 2008 2009 2010 2011 2012 2013 2014 2015 2016 2020 2025 20300%
10%
20%
30%
40%
50%
60%
70%
80%
90%
100%
Coal Oil Gas Hydro Other Renewable Nuclear
SOURCE: Pira 2012
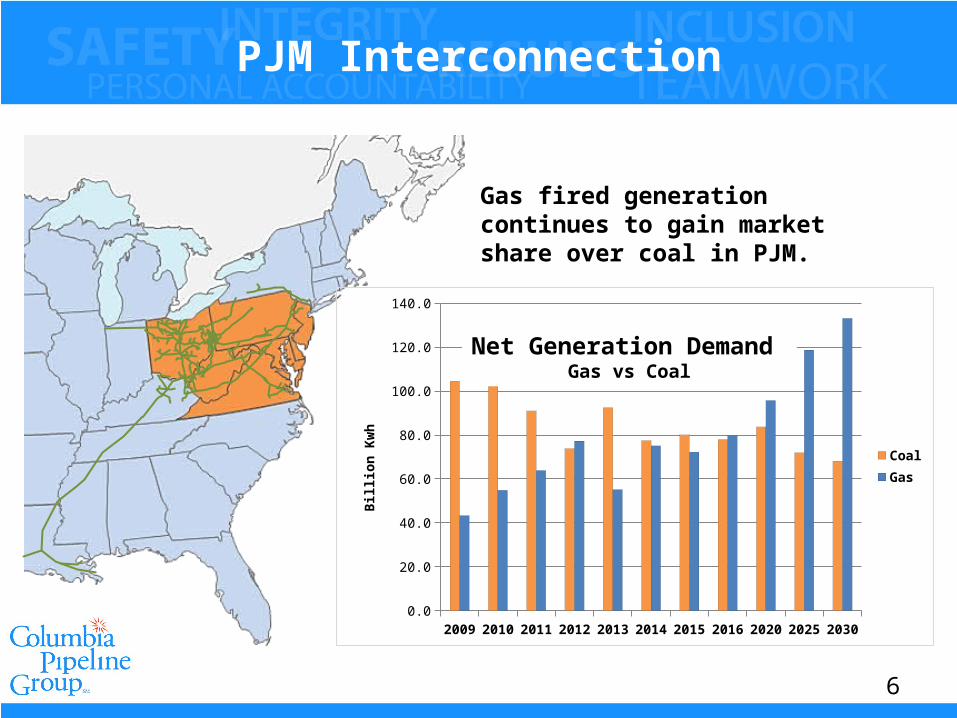
PJM Interconnection
6
2009 2010 2011 2012 2013 2014 2015 2016 2020 2025 20300.0
20.0
40.0
60.0
80.0
100.0
120.0
140.0
CoalGasBi
llion
Kw
hNet Generation Demand
Gas vs Coal
Gas fired generation continues to gain market share over coal in PJM.
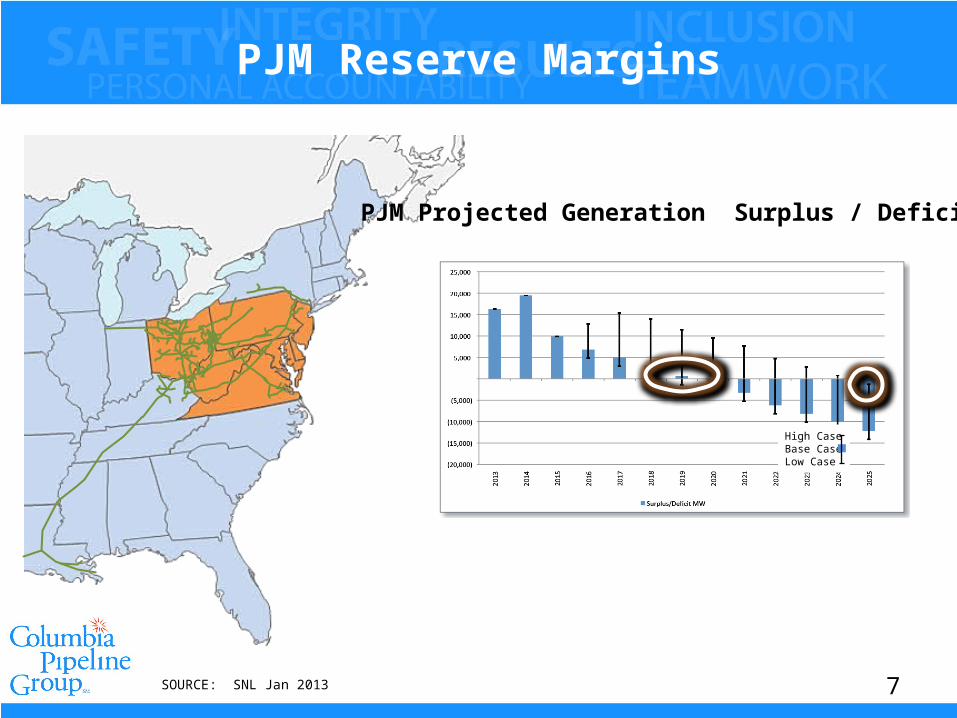
PJM Reserve Margins
7
PJM Projected Generation Surplus / Deficit
High CaseBase CaseLow Case
SOURCE: SNL Jan 2013
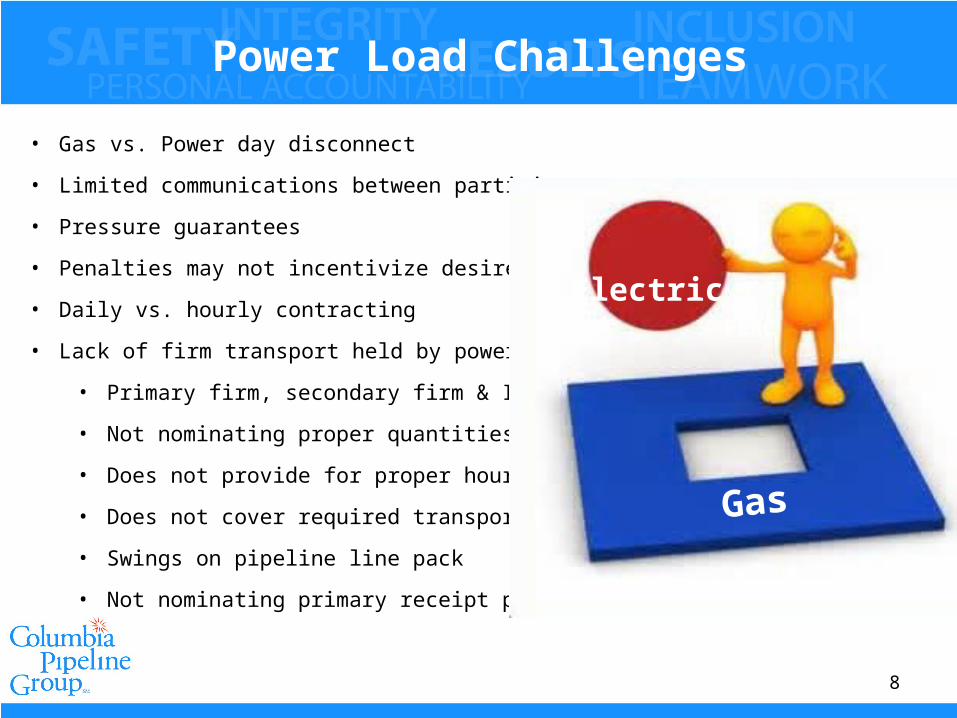
Power Load Challenges
• Gas vs. Power day disconnect
• Limited communications between participants
• Pressure guarantees
• Penalties may not incentivize desired behavior
• Daily vs. hourly contracting
• Lack of firm transport held by power generators
• Primary firm, secondary firm & Interruptible
• Not nominating proper quantities
• Does not provide for proper hourly flows
• Does not cover required transport quantity
• Swings on pipeline line pack
• Not nominating primary receipt points
8
Gas
Electric FERC
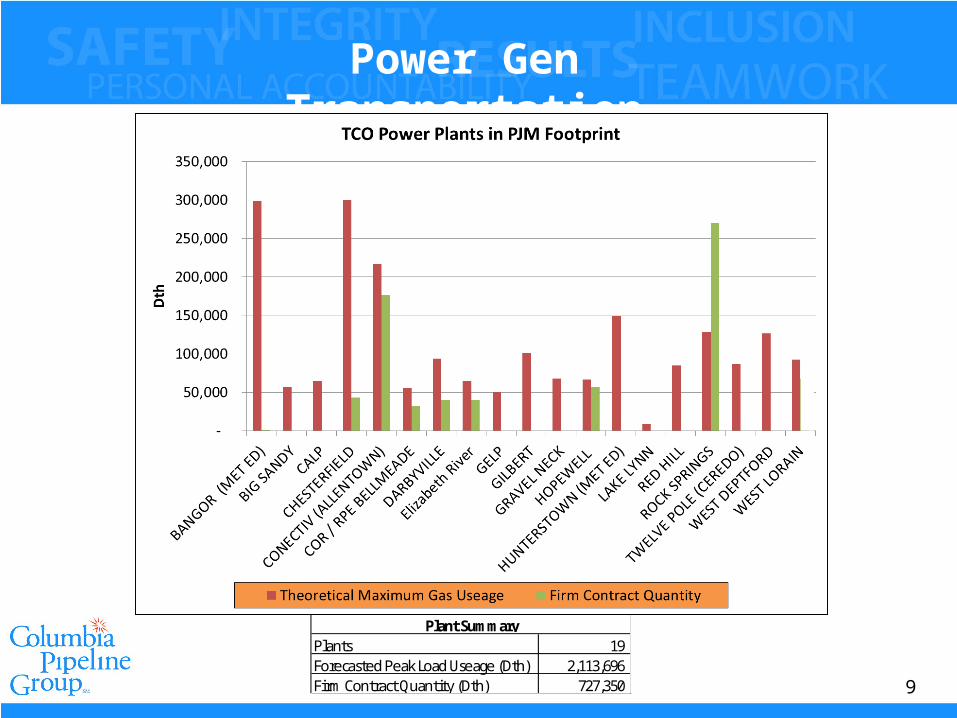
Power Gen Transportation
Plants 19 Forecasted Peak Load Useage (Dth) 2,113,696 Firm Contract Quantity (Dth) 727,350
Plant Summary
9
10
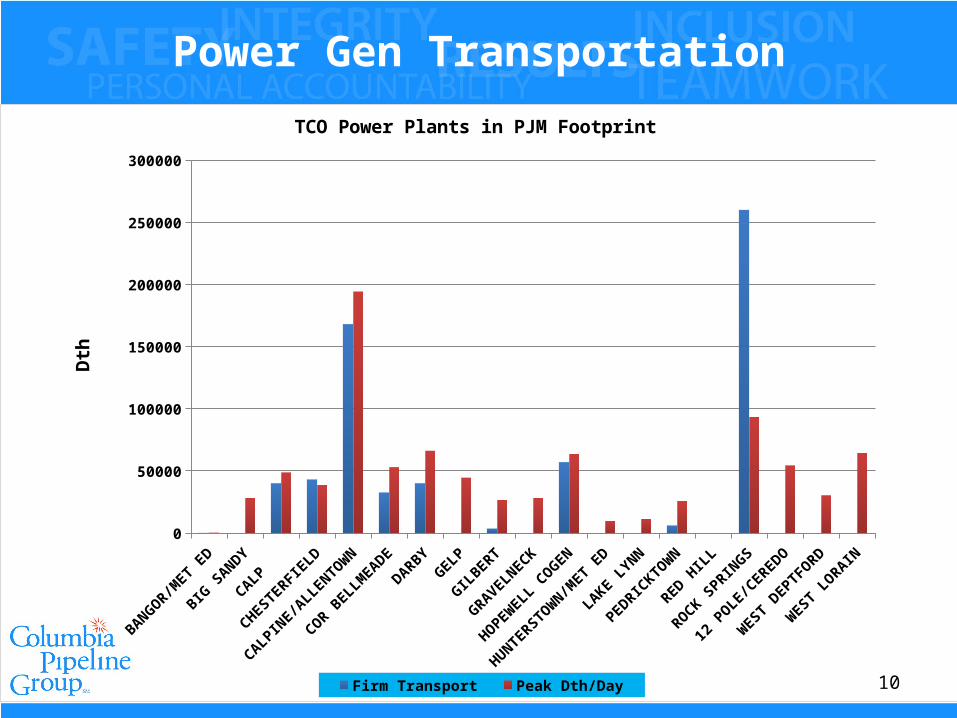
Power Gen Transportation
BANGO
R/MET E
D
BIG S
ANDY
CALP
CHESTERFIE
LD
CALPINE/A
LLENTOW
N
COR B
ELLMEADE
DARBY
GELP
GIL
BERT
GRAVELNECK
HO
PEWELL C
OG
EN
HUNTERSTO
WN/M
ET ED
LAKE L
YNN
PEDRICK
TOW
N
RED HIL
L
ROCK
SPRIN
GS
12 PO
LE/CEREDO
WEST D
EPTFORD
WEST L
ORAIN
0
50000
100000
150000
200000
250000
300000
Firm Transport Peak Dth/Day
Dth
TCO Power Plants in PJM Footprint

The Puzzle
11
FERC
MARKETERS ISO/RTO PIPELINES
POWER GENERATORS
?
PRODUCERS
Things to Consider• Encourage use of adequate transportation agreements:
o PJM to hold transport and release to generators?
o Flow through mechanism for transportation charges?
• Ask gas supply questions when dispatching:
o What type of transport (FT or IT)?
o What Priority (in the path or out of path)?
o Do you have supply for your transport?
• Develop new services if needed – customer driven effort.
• Encourage new and needed infrastructure
• Address disconnects between Gas & Electric communications & and energy days.
12
Recommended