ORF467 Final Project Group 3: Transit TripsNew York Region -- NY, NJ, CT
Jessica Deng & Julia Ni1/13/17
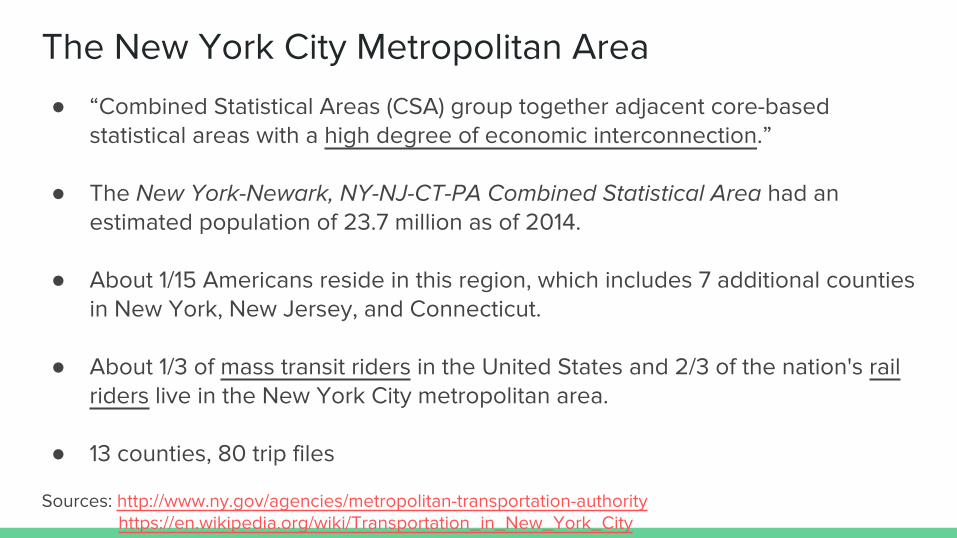
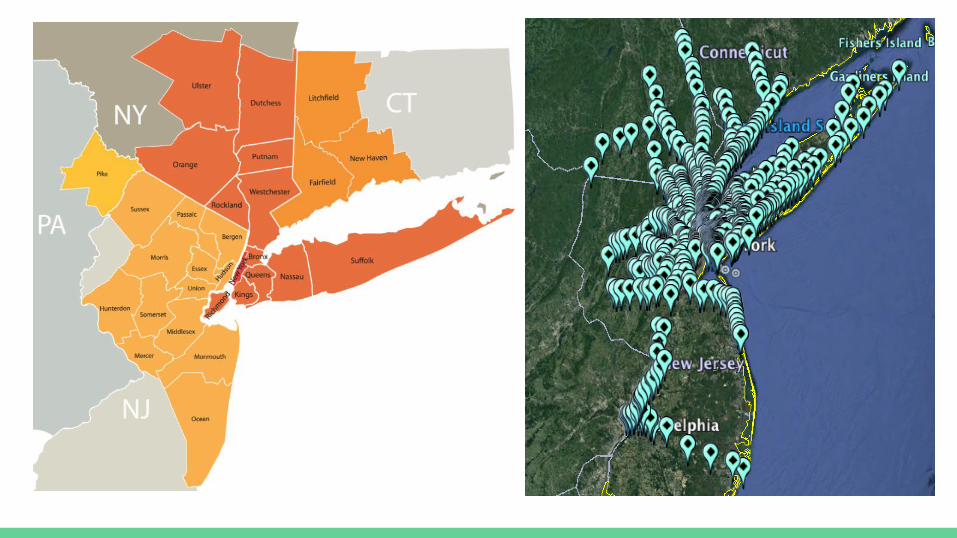
The New York City Metropolitan Area
● “Combined Statistical Areas (CSA) group together adjacent core-based statistical areas with a high degree of economic interconnection.”
● The New York-Newark, NY-NJ-CT-PA Combined Statistical Area had an estimated population of 23.7 million as of 2014.
● About 1/15 Americans reside in this region, which includes 7 additional counties in New York, New Jersey, and Connecticut.
● About 1/3 of mass transit riders in the United States and 2/3 of the nation's rail riders live in the New York City metropolitan area.
● 13 counties, 80 trip files
Sources: http://www.ny.gov/agencies/metropolitan-transportation-authority https://en.wikipedia.org/wiki/Transportation_in_New_York_City
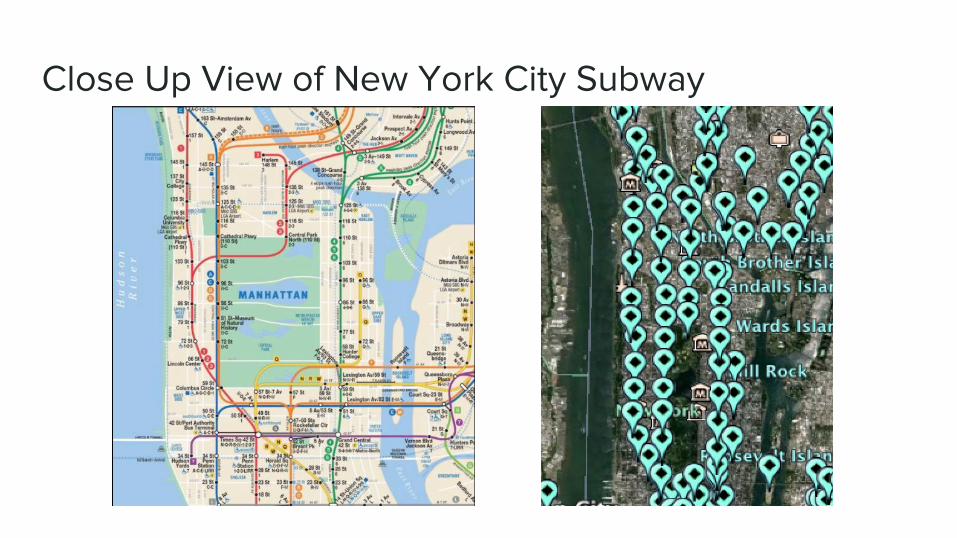
Close Up View of New York City Subway
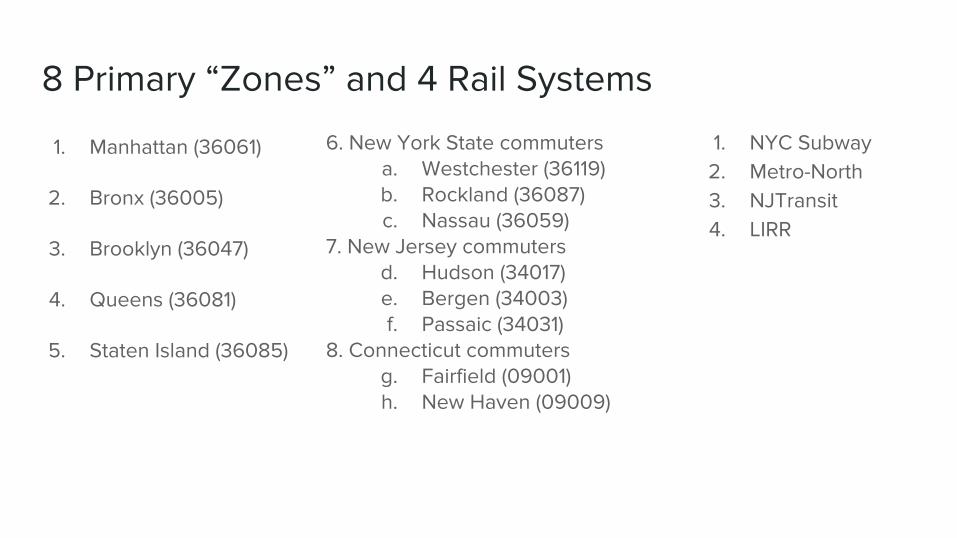
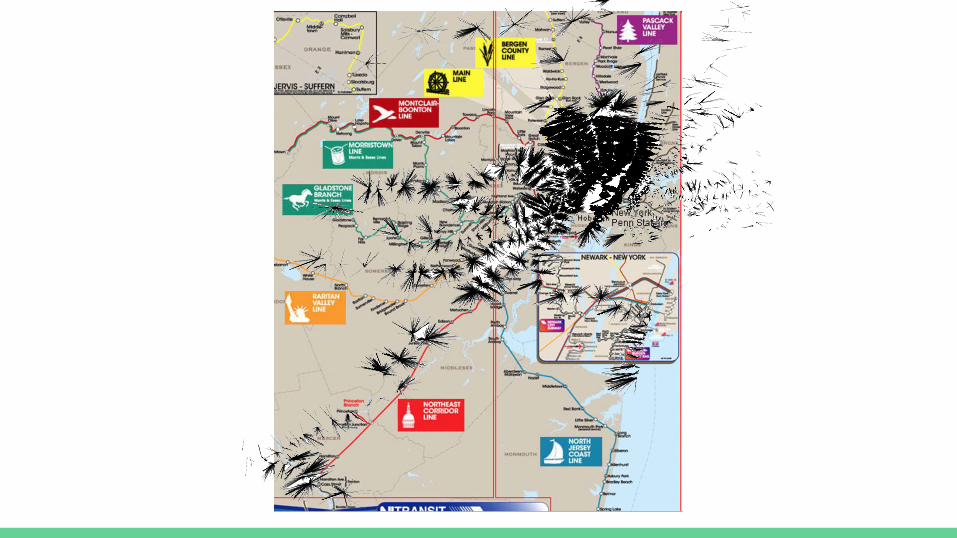
8 Primary “Zones” and 4 Rail Systems
1. Manhattan (36061)
2. Bronx (36005)
3. Brooklyn (36047)
4. Queens (36081)
5. Staten Island (36085)
1. NYC Subway2. Metro-North3. NJTransit4. LIRR
6. New York State commutersa. Westchester (36119)b. Rockland (36087)c. Nassau (36059)
7. New Jersey commutersd. Hudson (34017)e. Bergen (34003)f. Passaic (34031)
8. Connecticut commutersg. Fairfield (09001)h. New Haven (09009)
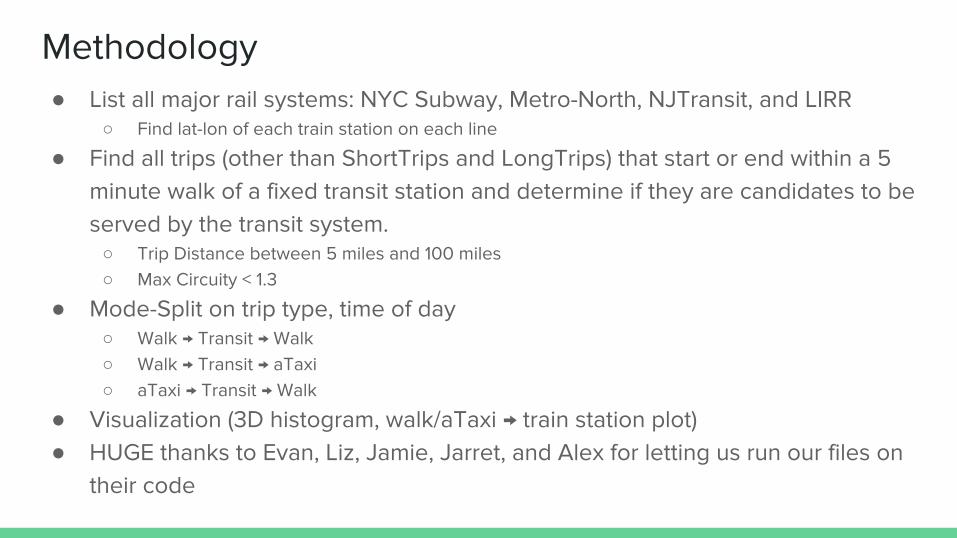
Methodology● List all major rail systems: NYC Subway, Metro-North, NJTransit, and LIRR
○ Find lat-lon of each train station on each line
● Find all trips (other than ShortTrips and LongTrips) that start or end within a 5 minute walk of a fixed transit station and determine if they are candidates to be served by the transit system. ○ Trip Distance between 5 miles and 100 miles○ Max Circuity < 1.3
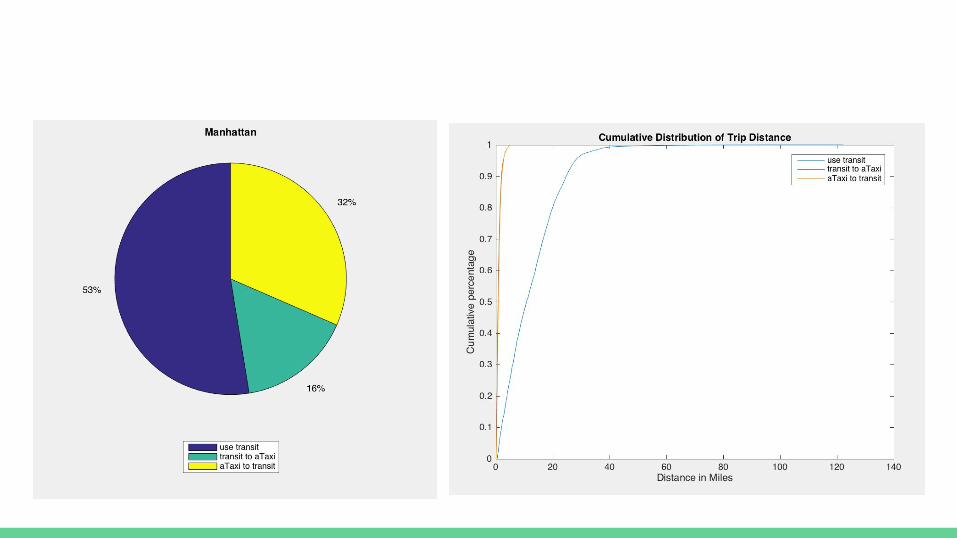
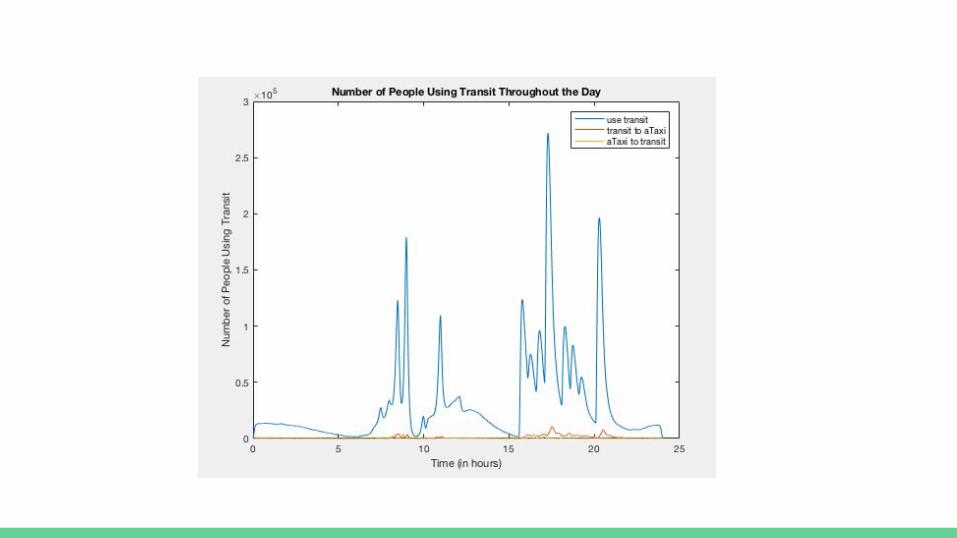
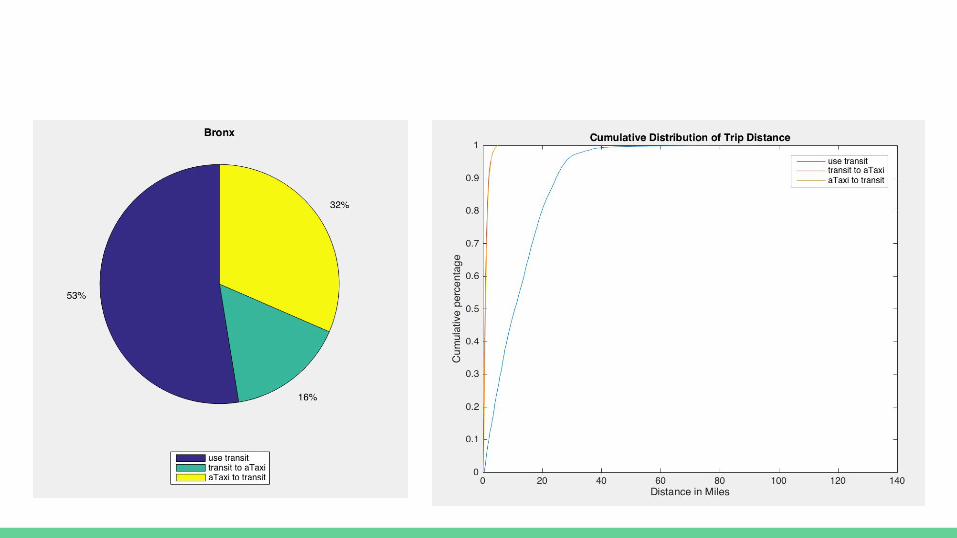
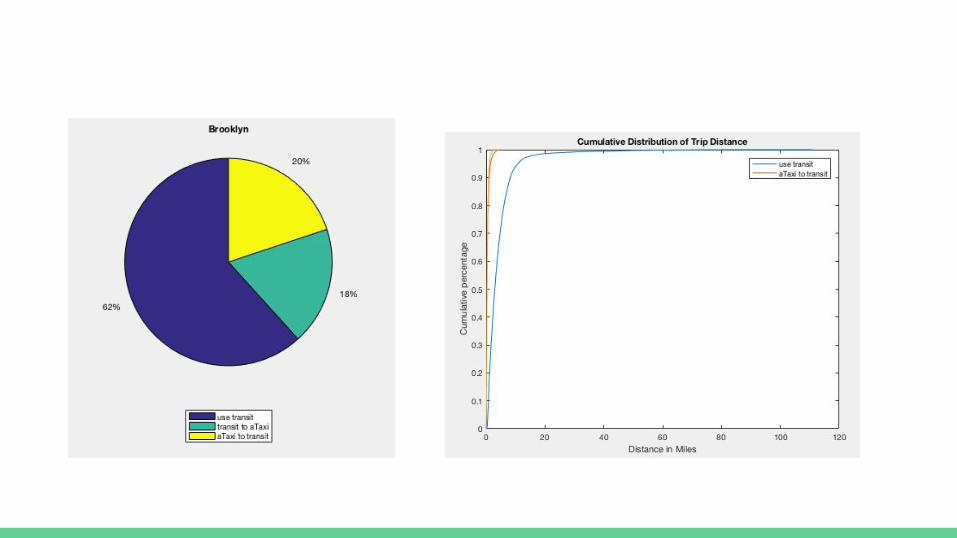
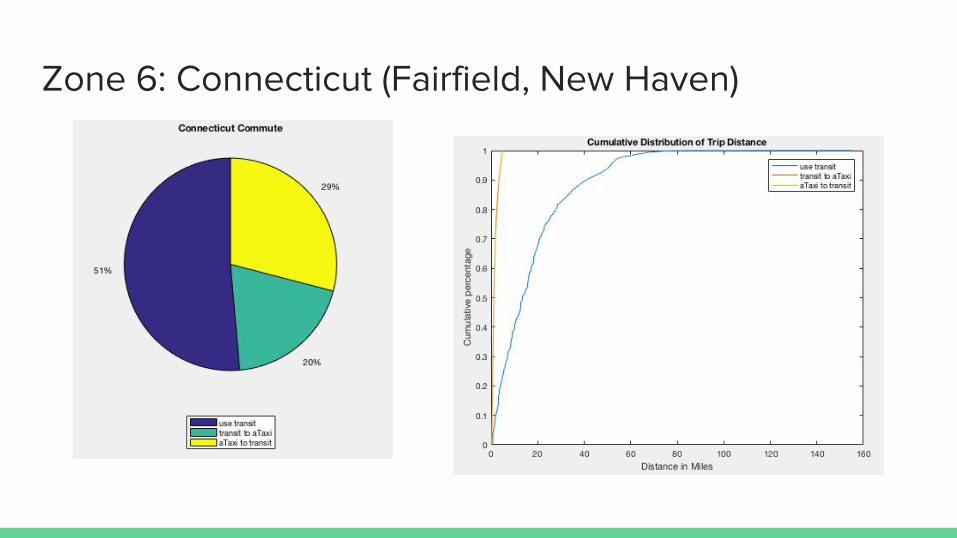
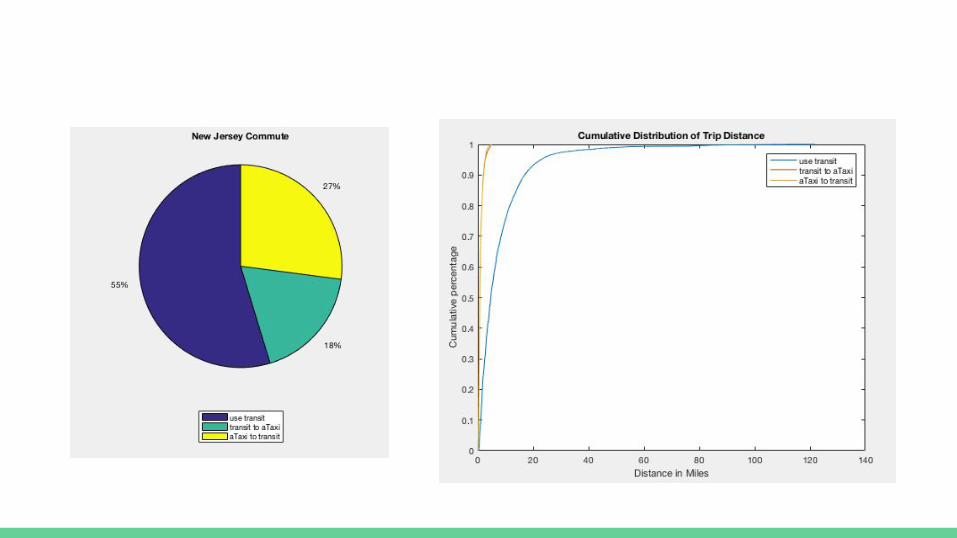
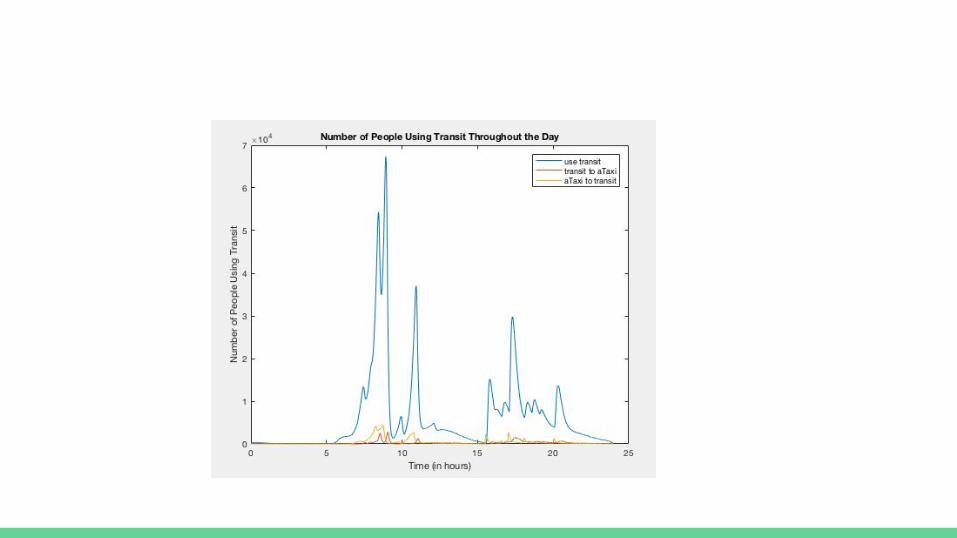
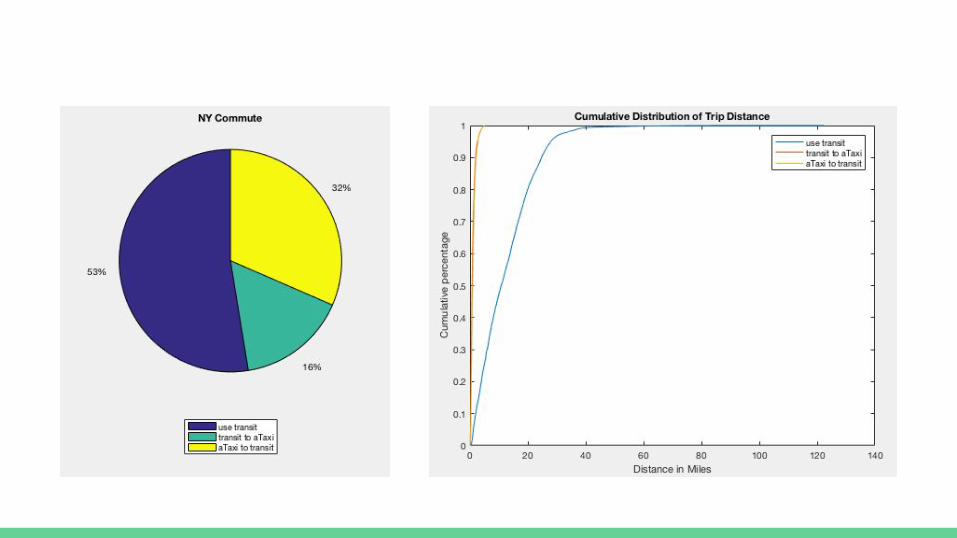
● Mode-Split on trip type, time of day○ Walk → Transit → Walk○ Walk → Transit → aTaxi○ aTaxi → Transit → Walk
● Visualization (3D histogram, walk/aTaxi → train station plot)● HUGE thanks to Evan, Liz, Jamie, Jarret, and Alex for letting us run our files on
their code
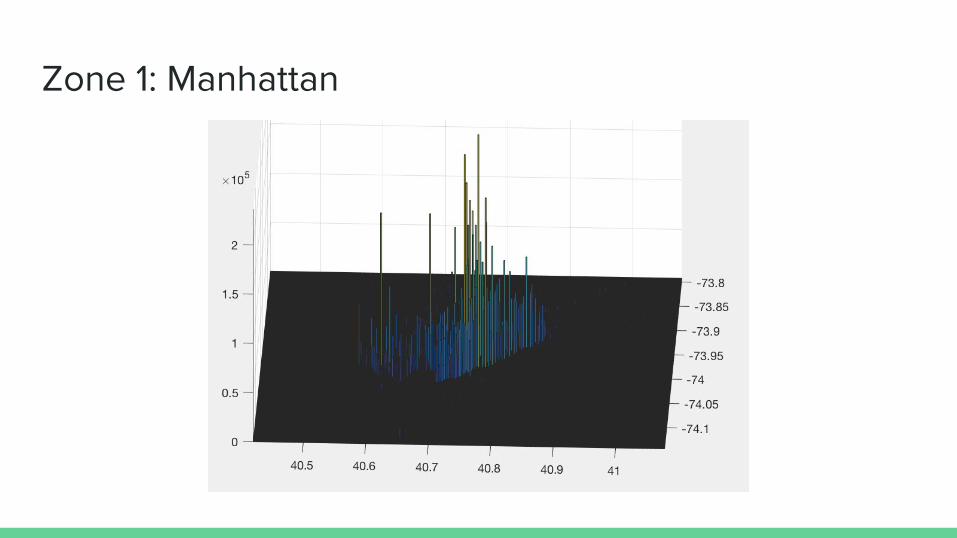
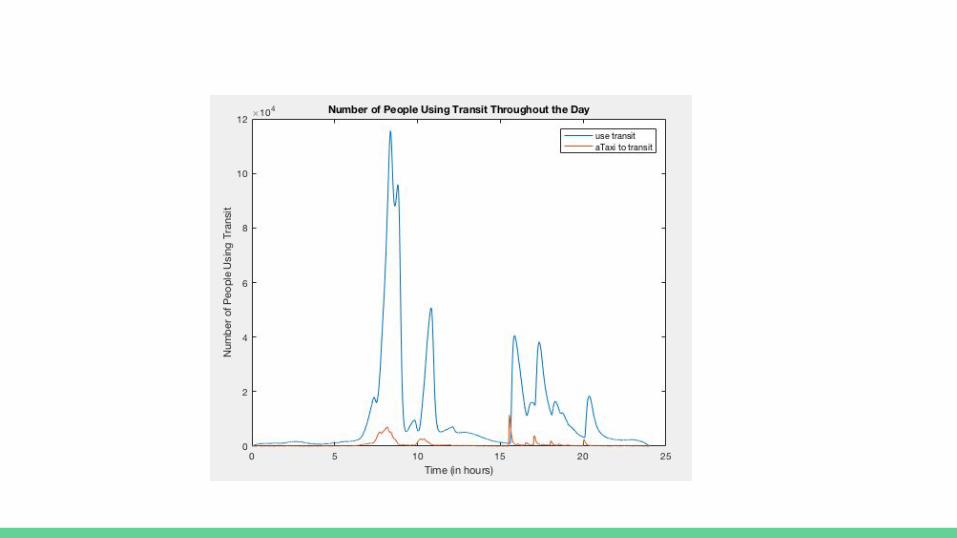
Zone 1: Manhattan
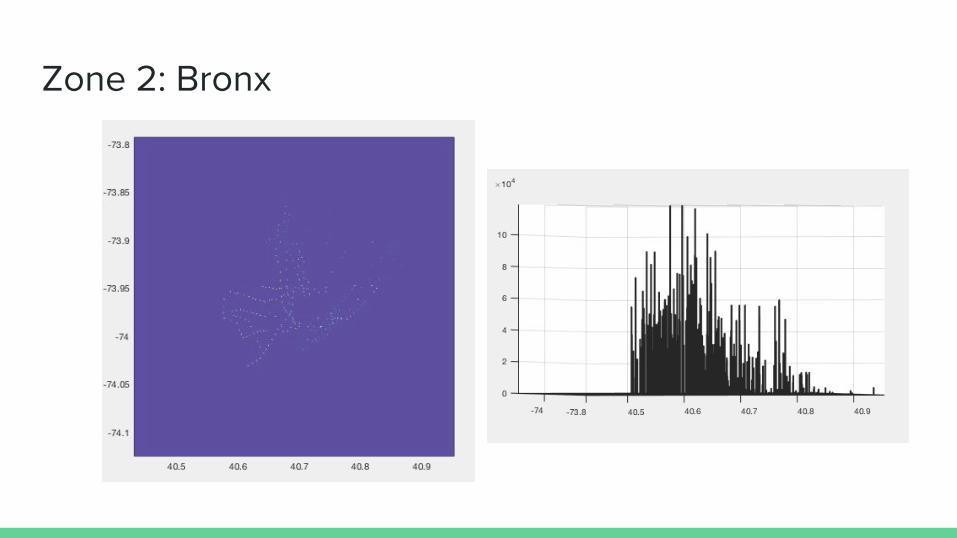
Zone 2: Bronx
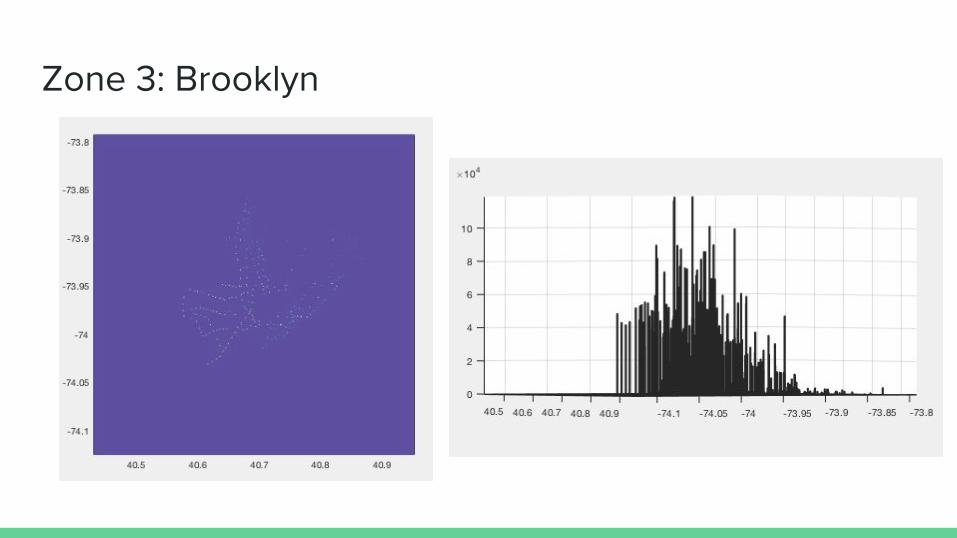
Zone 3: Brooklyn
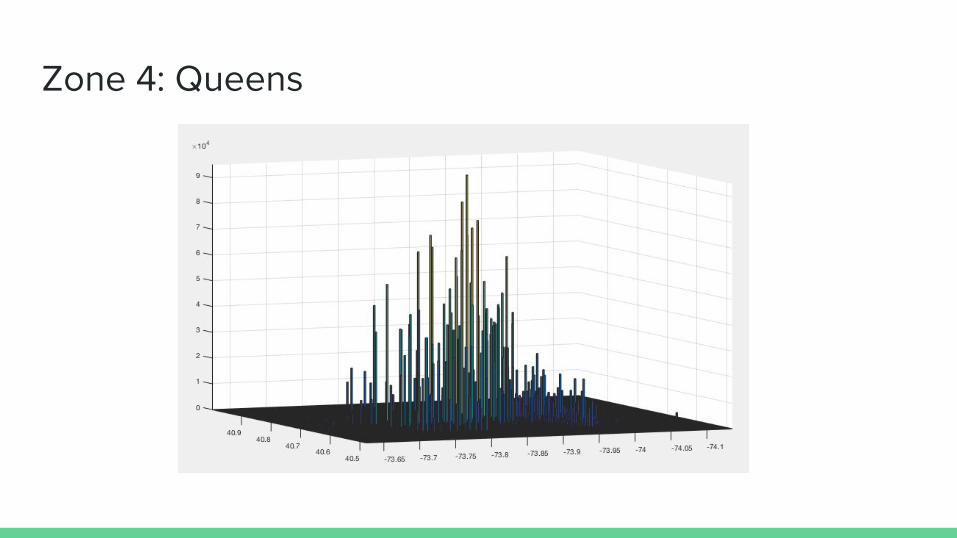
Zone 4: Queens
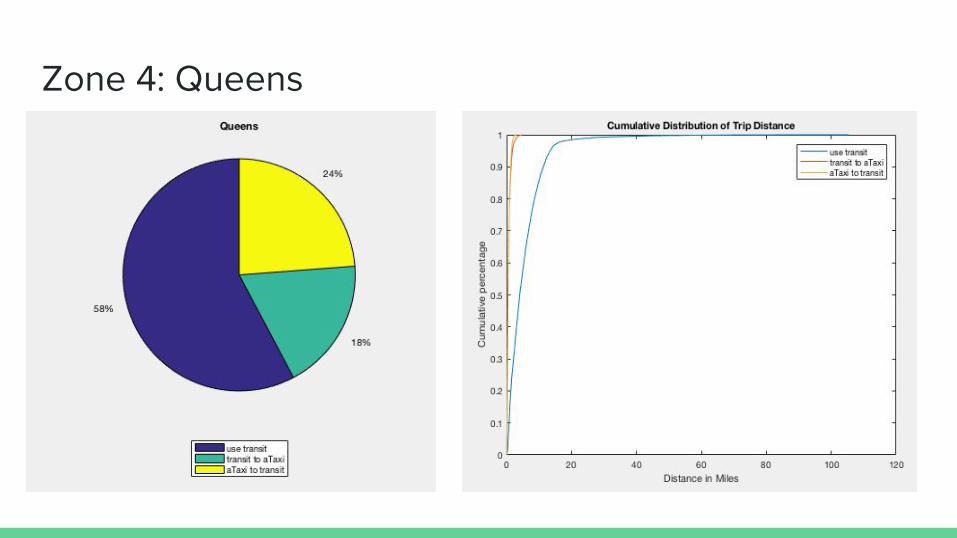
Zone 4: Queens
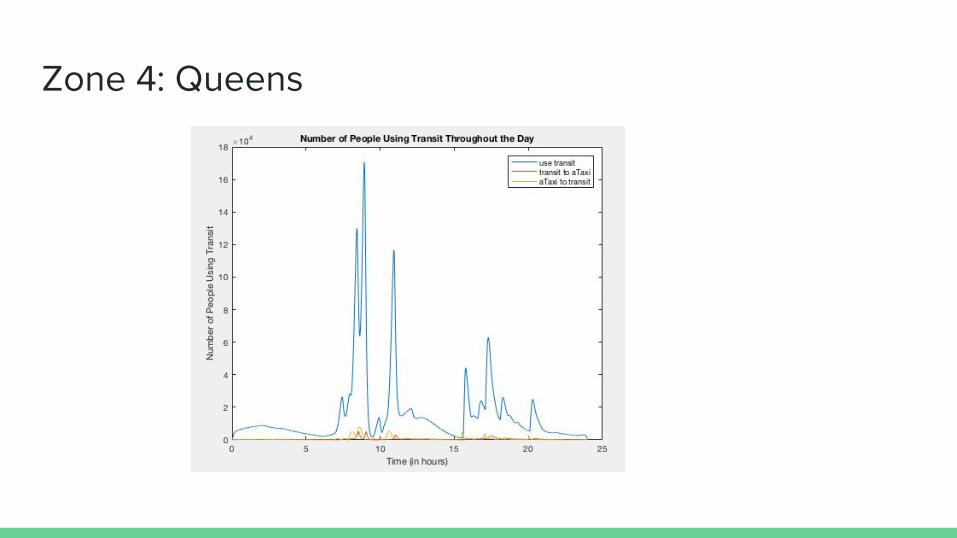
Zone 4: Queens
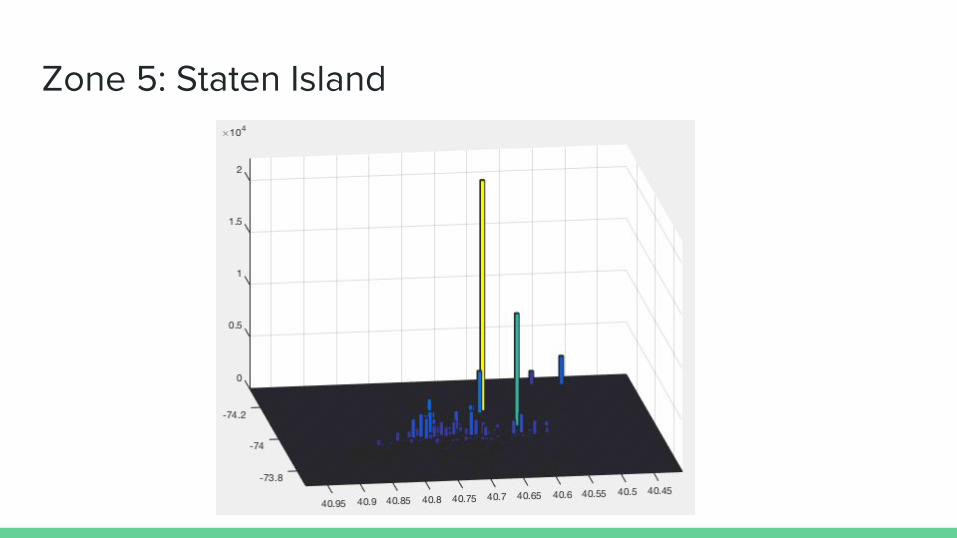
Zone 5: Staten Island
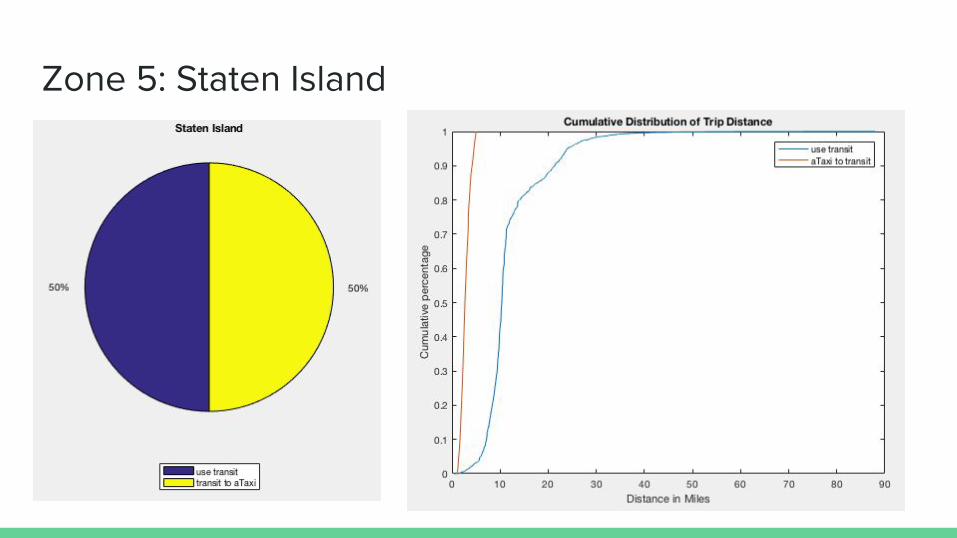
Zone 5: Staten Island
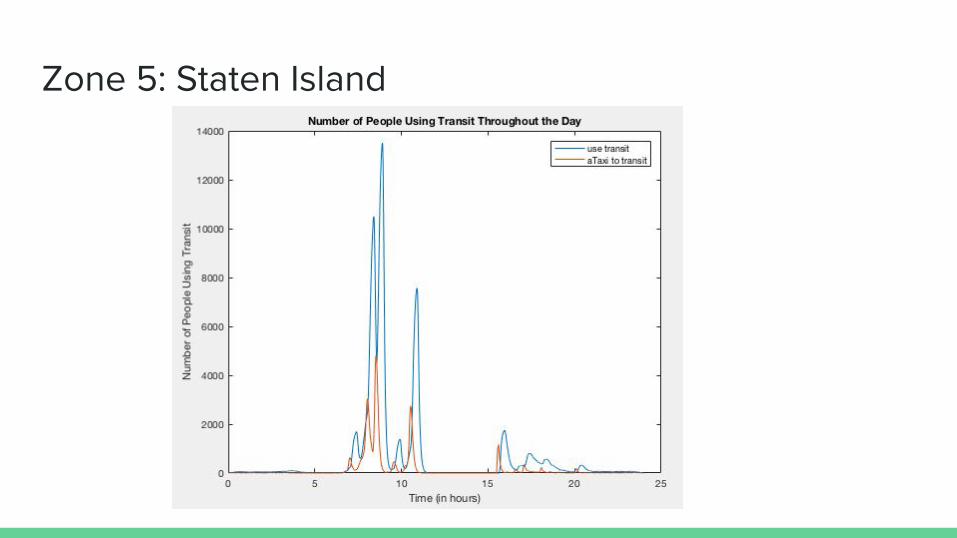
Zone 5: Staten Island
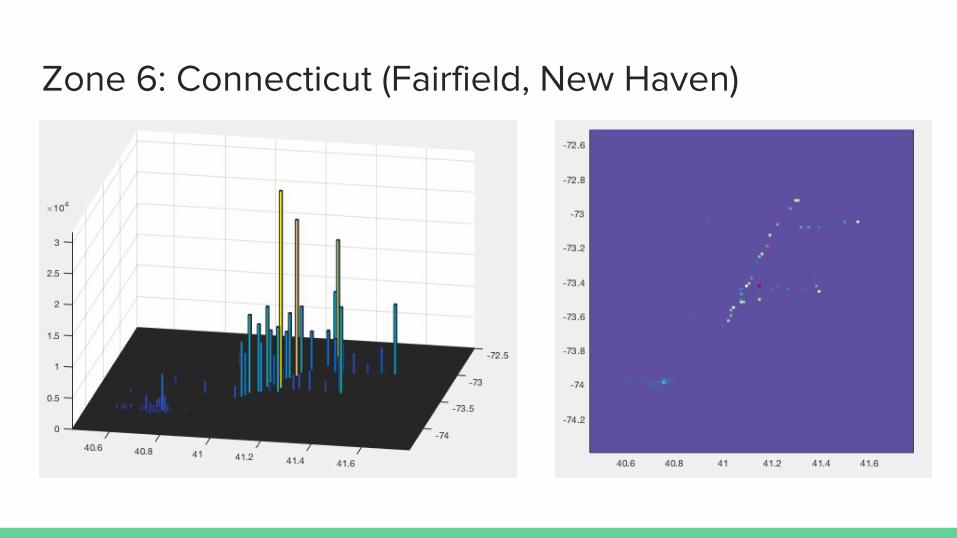
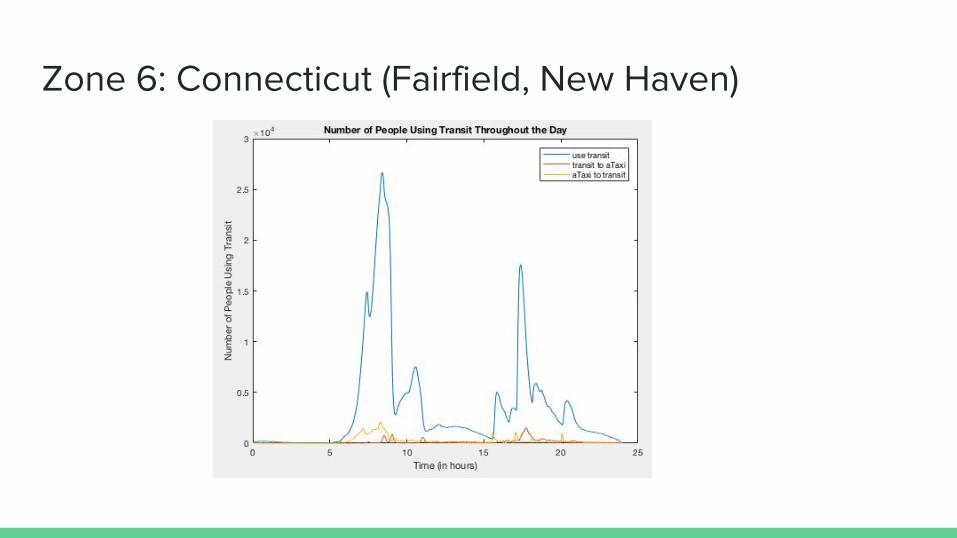
Zone 6: Connecticut (Fairfield, New Haven)
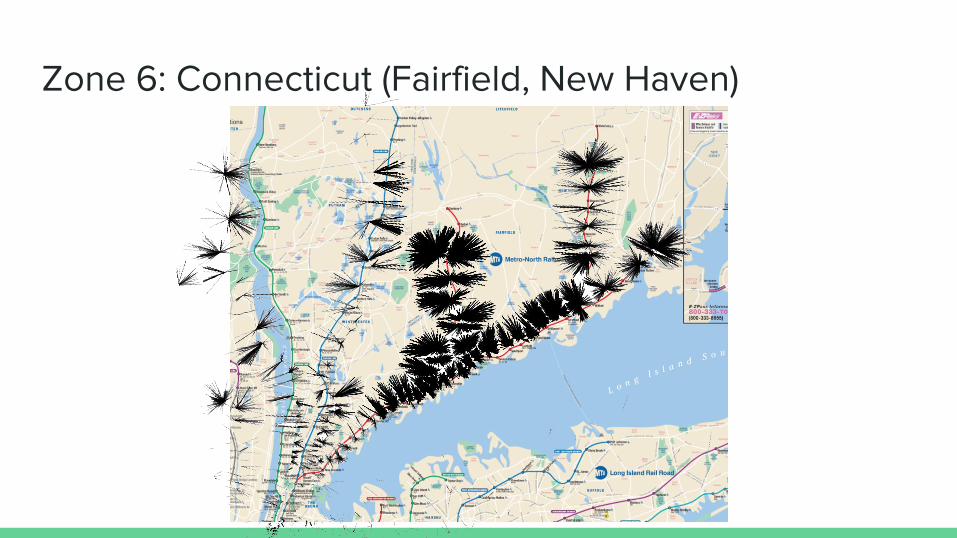
Zone 6: Connecticut (Fairfield, New Haven)
Zone 6: Connecticut (Fairfield, New Haven)
Zone 6: Connecticut (Fairfield, New Haven)
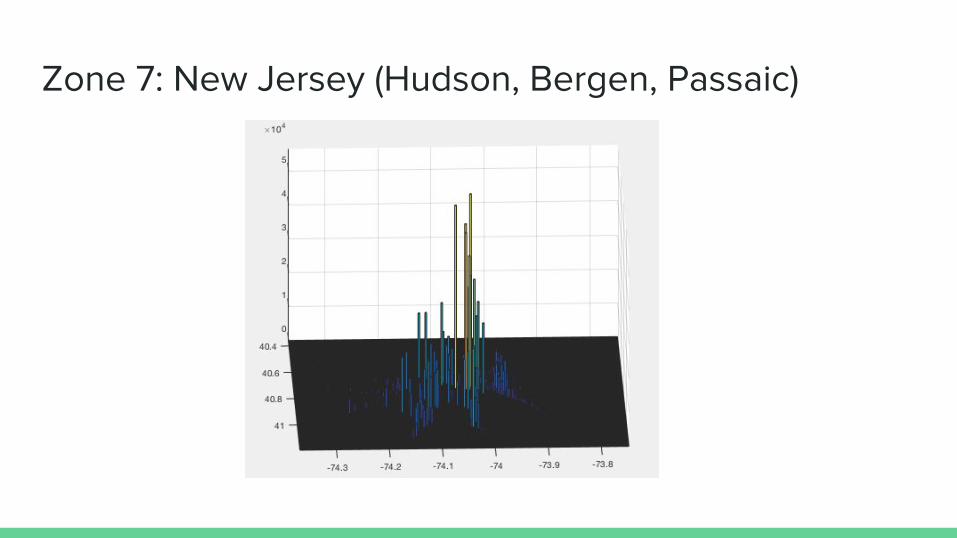
Zone 7: New Jersey (Hudson, Bergen, Passaic)
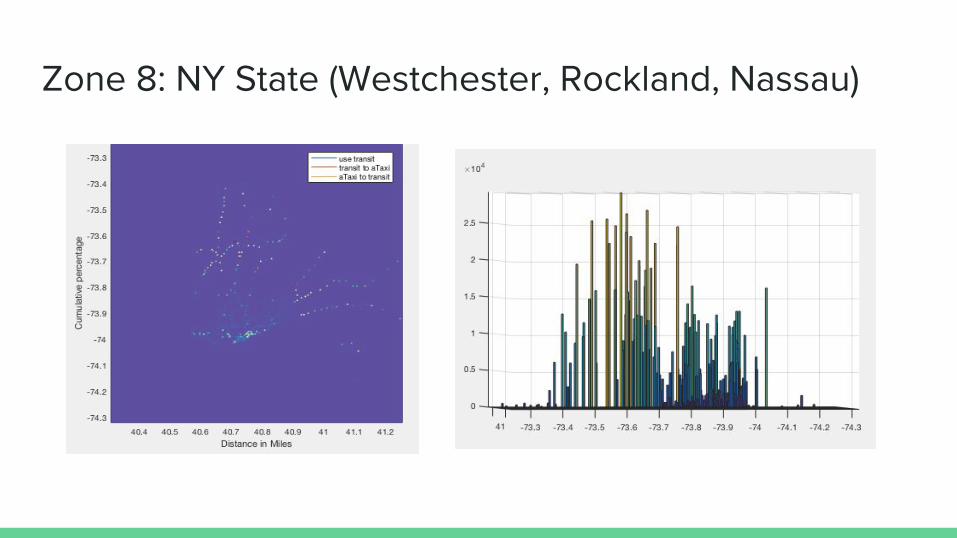
Zone 8: NY State (Westchester, Rockland, Nassau)
Challenges and Lessons Learned
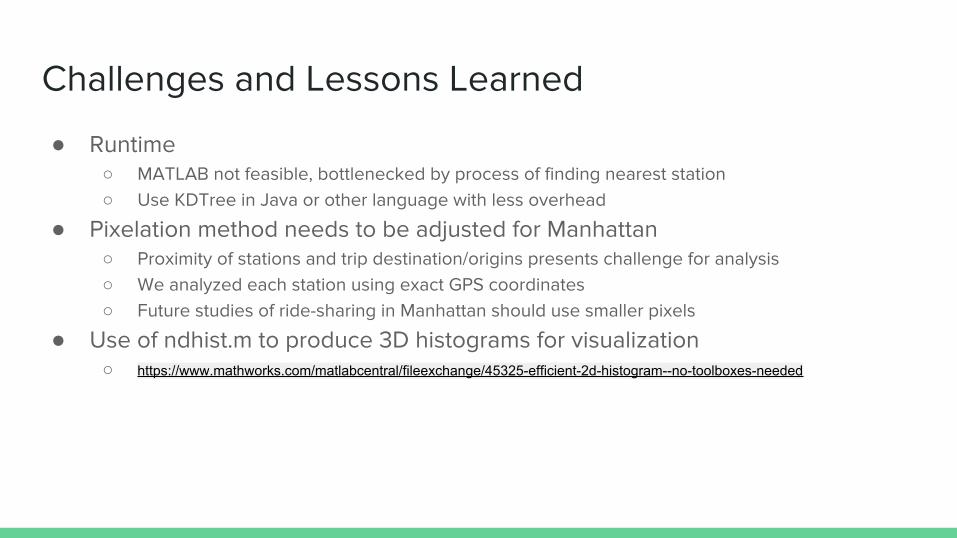
● Runtime○ MATLAB not feasible, bottlenecked by process of finding nearest station○ Use KDTree in Java or other language with less overhead
● Pixelation method needs to be adjusted for Manhattan ○ Proximity of stations and trip destination/origins presents challenge for analysis ○ We analyzed each station using exact GPS coordinates○ Future studies of ride-sharing in Manhattan should use smaller pixels
● Use of ndhist.m to produce 3D histograms for visualization○ https://www.mathworks.com/matlabcentral/fileexchange/45325-efficient-2d-histogram--no-toolboxes-needed
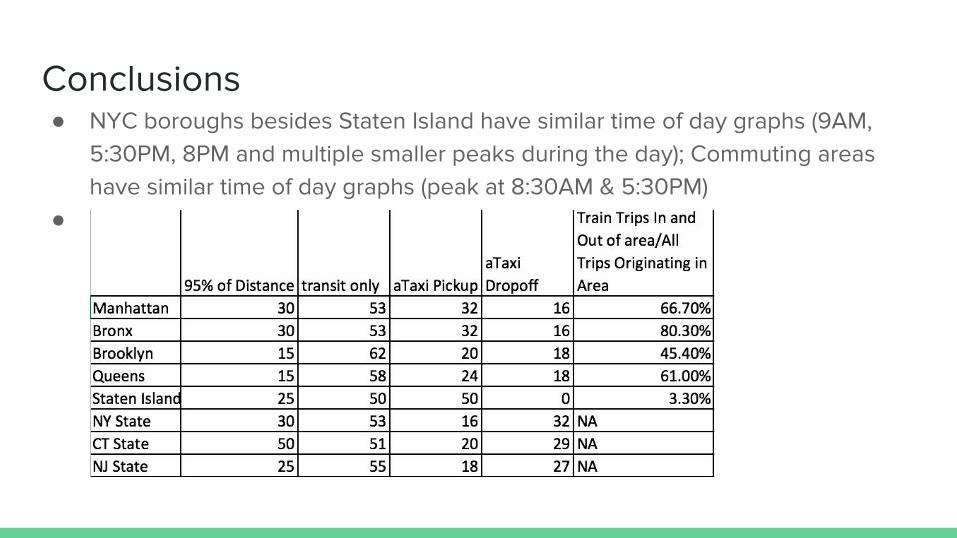
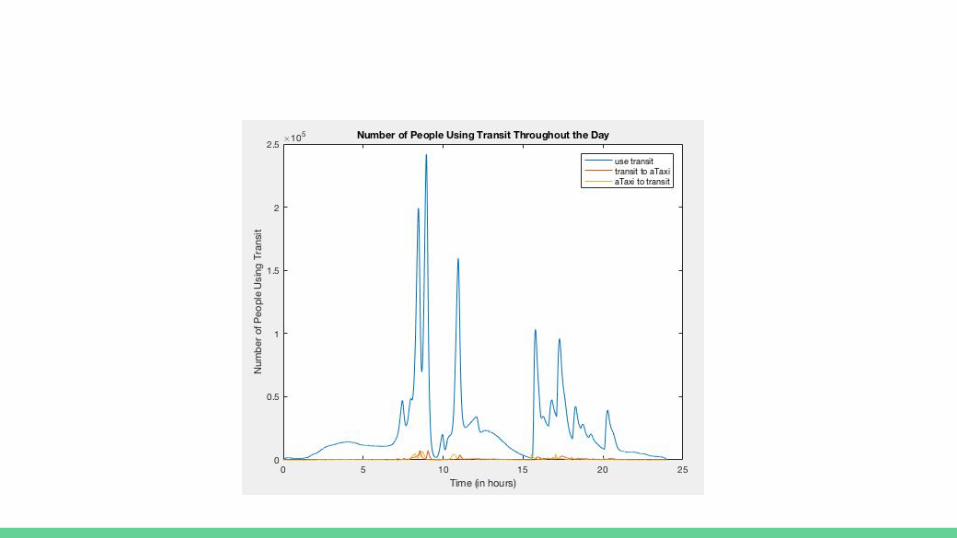
Conclusions● NYC boroughs besides Staten Island have similar time of day graphs (9AM,
5:30PM, 8PM and multiple smaller peaks during the day); Commuting areas have similar time of day graphs (peak at 8:30AM & 5:30PM)
●
Recommended