Orbital-Scale Changesin Carbon Dioxide and Methane
• Ice Cores
• Orbital-Scale Changes in CO2
• Carbon in the Deep Ocean
• Orbital-Scale Changes in CH4
• Orbital-Scale Climatic Roles: CO2 and CH4
Adrienne, Ally, Chase, Mohamed, Patrick, Travious
Ice Cores
Ice Cores Break Down
http://www.nsf.gov/news/special_reports/science_nation/icecorelab.jsp
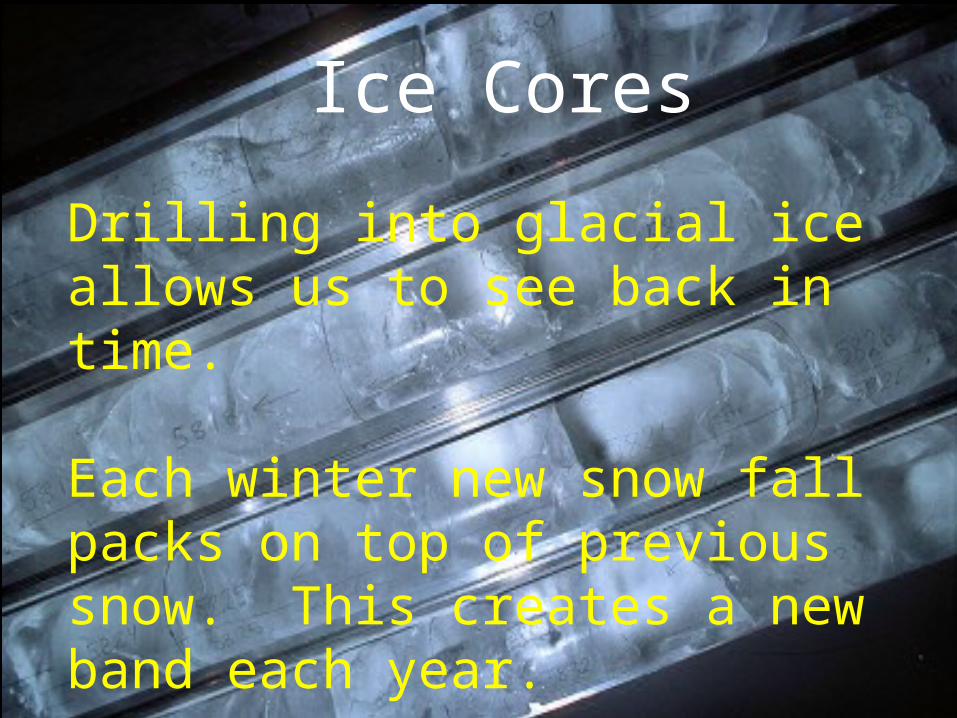
Ice Cores
Drilling into glacial ice allows us to see back in time.
Each winter new snow fall packs on top of previous snow. This creates a new band each year.
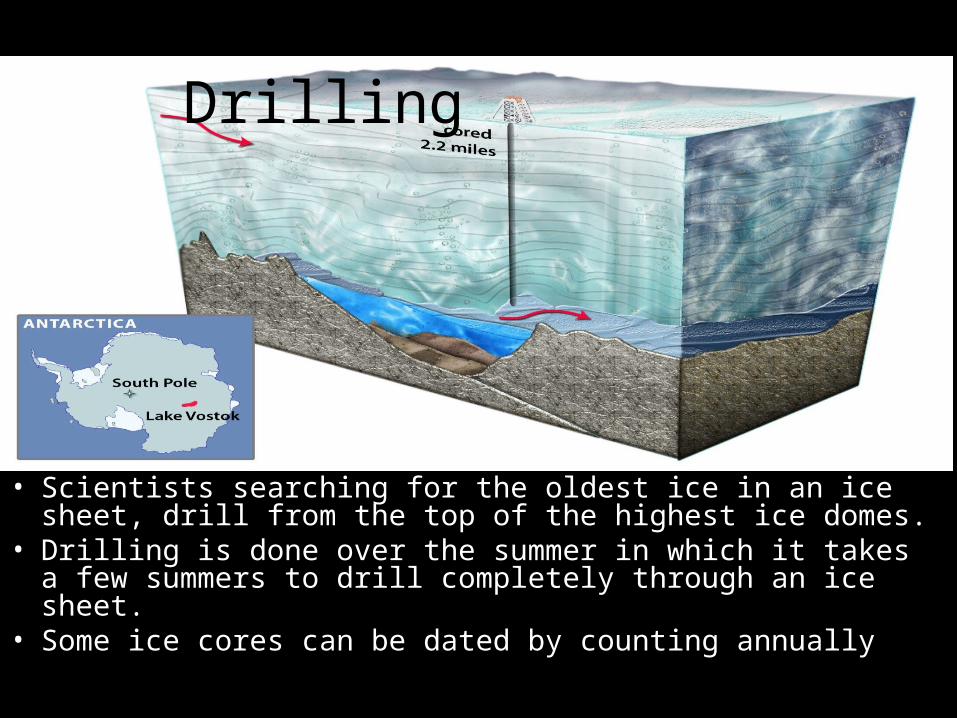
Drilling
• Scientists searching for the oldest ice in an ice sheet, drill from the top of the highest ice domes.
• Drilling is done over the summer in which it takes a few summers to drill completely through an ice sheet.
• Some ice cores can be dated by counting annually deposited layers.
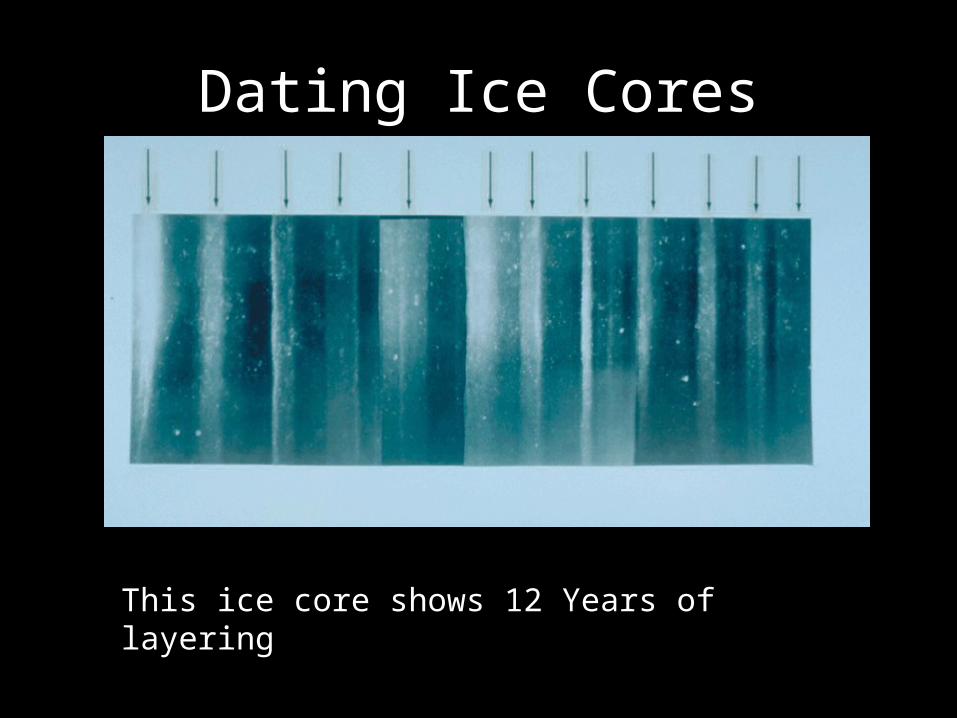
Dating Ice Cores
This ice core shows 12 Years of layering
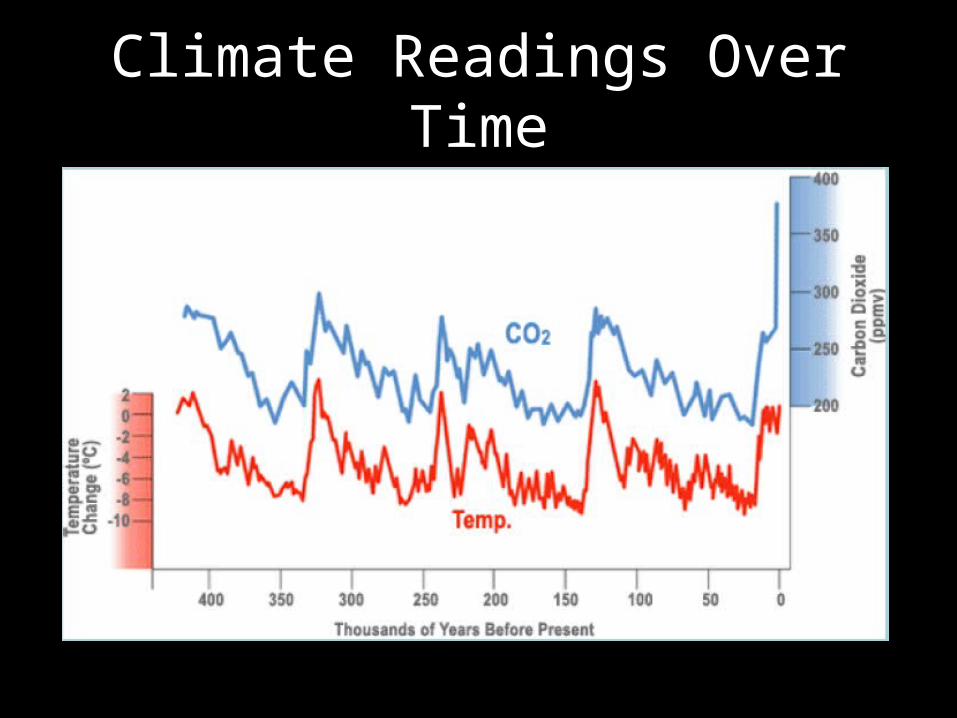
Climate Readings Over Time
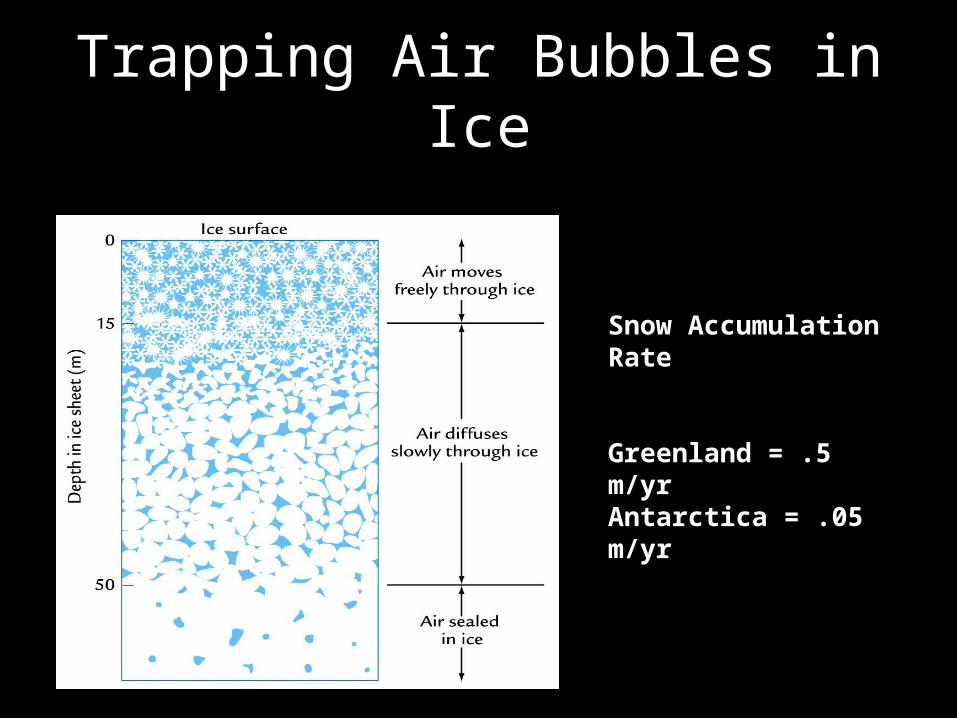
Trapping Air Bubbles in Ice
Snow Accumulation Rate
Greenland = .5 m/yrAntarctica = .05 m/yr
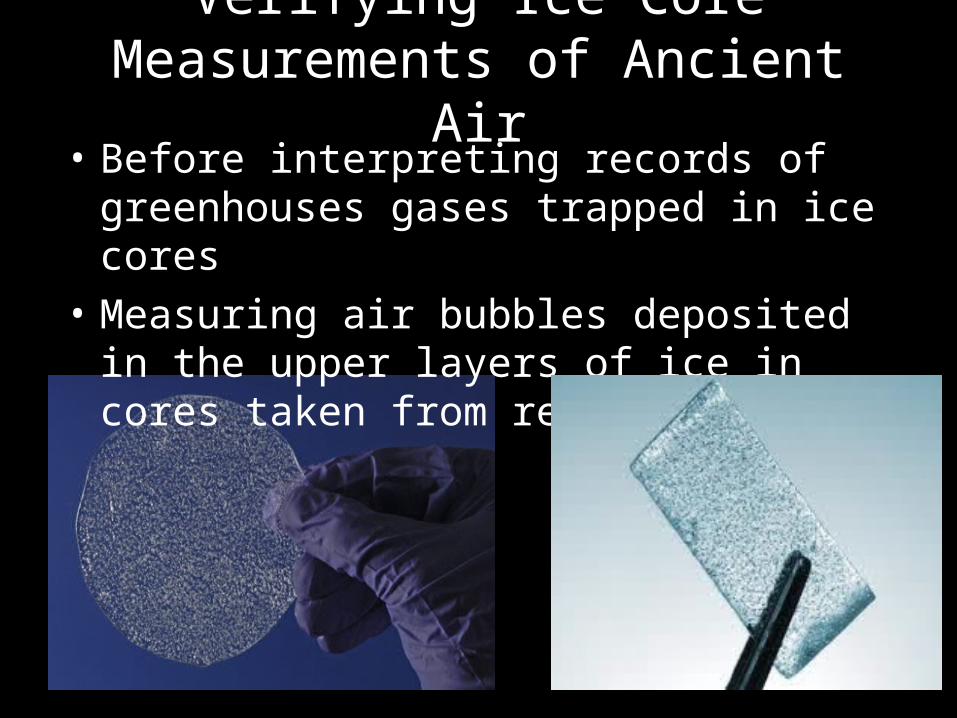
Verifying Ice Core Measurements of Ancient Air
• Before interpreting records of greenhouses gases trapped in ice cores
• Measuring air bubbles deposited in the upper layers of ice in cores taken from recent years
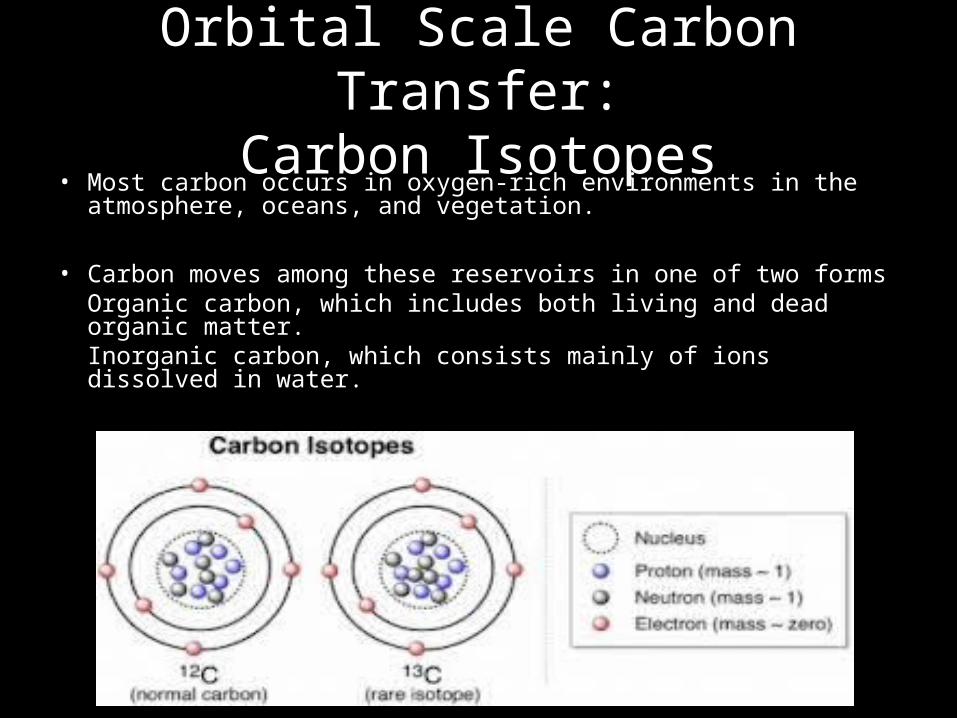
Orbital Scale Carbon Transfer:Carbon Isotopes
• Most carbon occurs in oxygen-rich environments in the atmosphere, oceans, and vegetation.
• Carbon moves among these reservoirs in one of two formsOrganic carbon, which includes both living and dead organic matter. Inorganic carbon, which consists mainly of ions dissolved in water.
How Ice Cores Are Dated
– Ice layers are counted from the top layer down starting from the year ice coring began.
– Ice flow models are based on the physical properties of the ice sheet.
• Why are air bubbles in ice cores younger than the ice in which they are sealed?
– Because the surrounding ice was deposited many years earlier. If deposition of ice is fast the age difference between the bubbles and the ice enclosing them will only be a few hundred years. If the deposition is slow the age offset can be as large as 2000 years or more.
Orbital-Scale Changes in CO2
Orbital-scale Changes in CO2
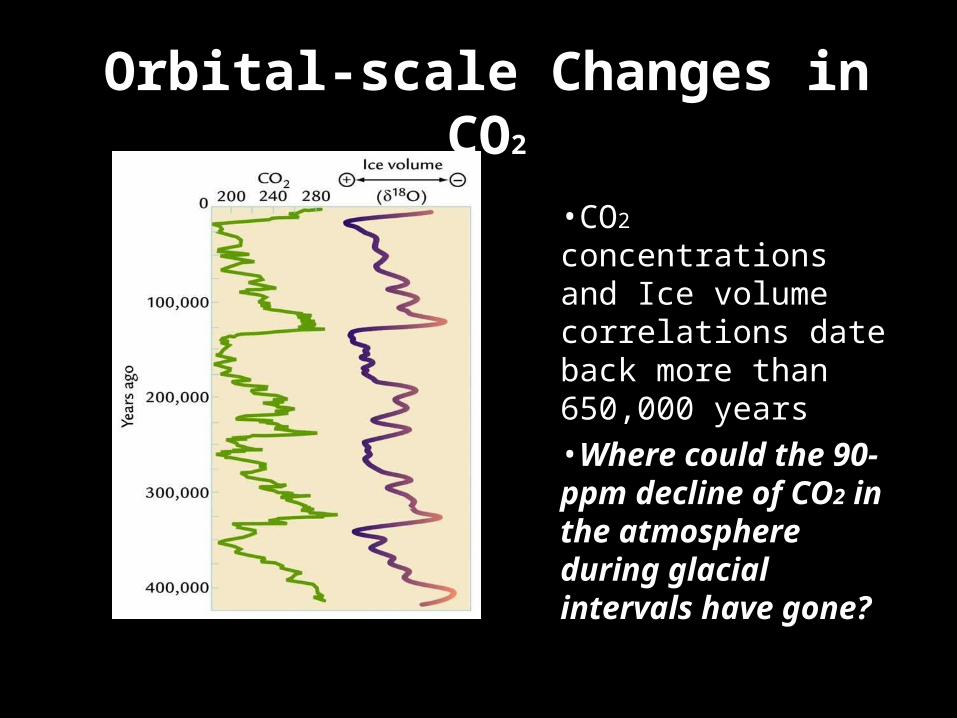
•CO2 concentrations and Ice volume correlations date back more than 650,000 years
•Where could the 90-ppm decline of CO2 in the atmosphere during glacial intervals have gone?
Vegetation-soil Reservoirs• Extensive information on vegetation and soil carbon stores e.g.
lake cores containing pollen
• Shows that continents had less vegetation during glaciations than during interglaciations not like today
• Totals ~25% less vegetation (2160-1630 tons)
1. Expansive ice sheets displaced or covered forests
2. Forests then replaced by grassland
This means there is additional carbon
missing from land vegetation and soil
on top of that missing from the atmosphere!
Ocean Reservoirs• 30ppm CO2 values in surface ocean waters
• Surface waters exchange CO2 too rapidly (within a few years) with the atmosphere
Question: If glacial atmosphere CO2 values were
to decrease by 30%, what would happen
soon after to surface ocean values?
Answer: Surface ocean CO2 values would
also decrease by ~30%.
Deep-ocean waters are only remaining available carbon reservoir
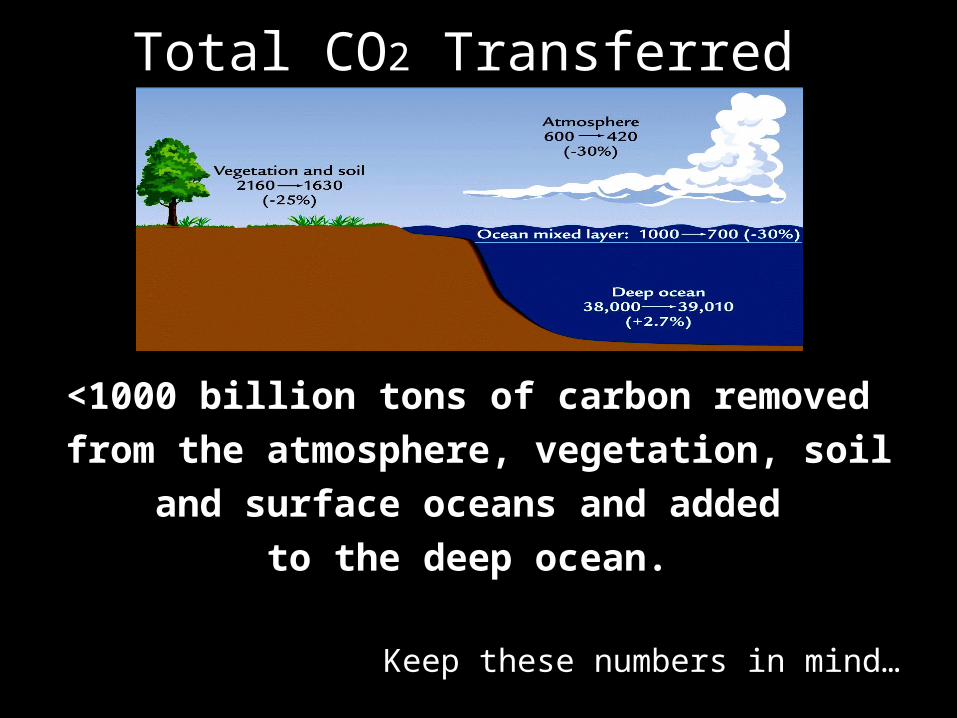
Total CO2 Transferred
<1000 billion tons of carbon removed
from the atmosphere, vegetation, soil
and surface oceans and added
to the deep ocean.
Keep these numbers in mind…
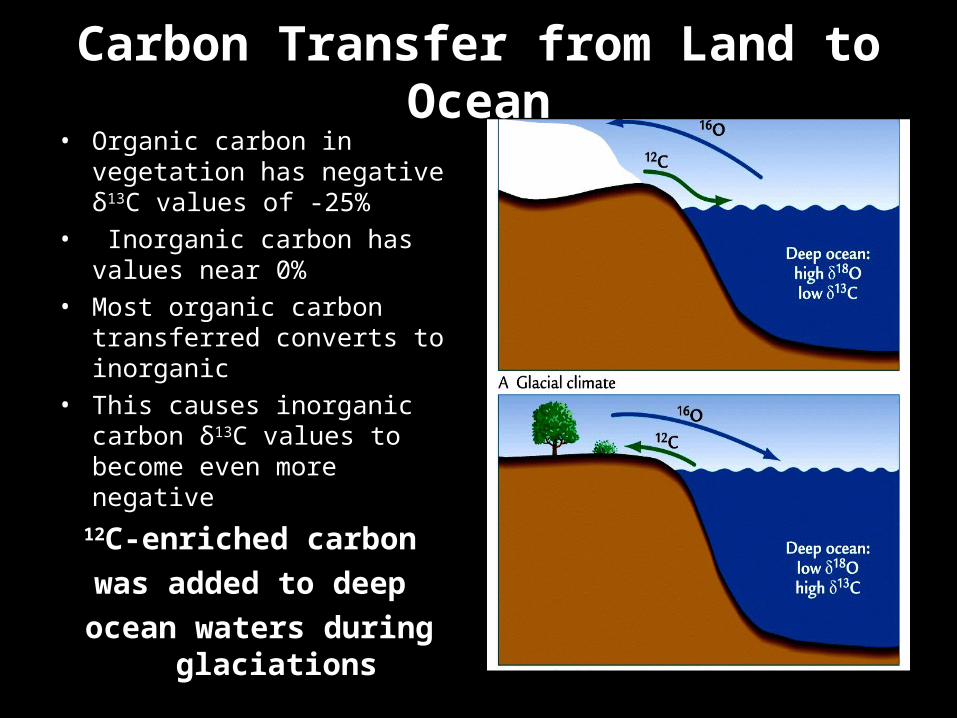
Carbon Transfer from Land to Ocean• Organic carbon in vegetation has
negative δ13C values of -25%
• Inorganic carbon has values near 0%
• Most organic carbon transferred converts to inorganic
• This causes inorganic carbon δ13C values to become even more negative
12C-enriched carbon
was added to deep
ocean waters during glaciations
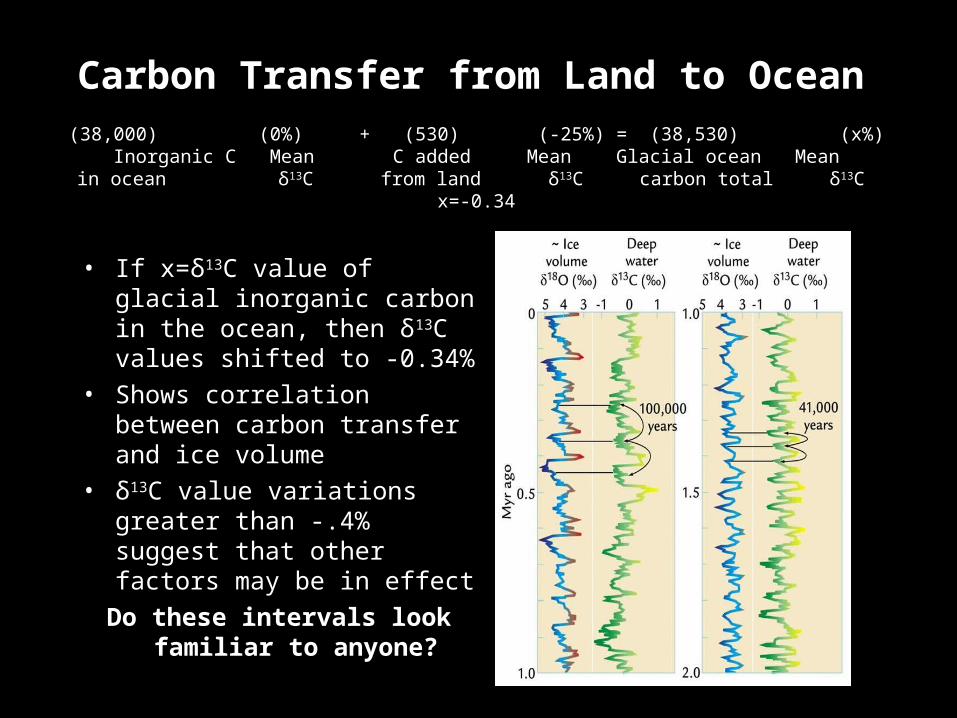
Carbon Transfer from Land to Ocean (38,000) (0%) + (530) (-25%) = (38,530) (x%) Inorganic C Mean C added Mean Glacial ocean Mean in ocean δ13C from land δ13C carbon total δ13C
x=-0.34
• If x=δ13C value of glacial inorganic carbon in the ocean, then δ13C values shifted to -0.34%
• Shows correlation between carbon transfer and ice volume
• δ13C value variations greater than -.4% suggest that other factors may be in effect
Do these intervals look familiar to anyone?
To Re-Cap
• Ice core samples show a decrease in atmospheric CO2 of 90 ppm (~30%)
• Terrestrial vegetation was ~25% less, as well
• Surface oceans (in equilibrium with the atmosphere) also had less CO2 (~30)
• CO2 must have gone into deep-ocean waters
• Determined using evidence obtained from ice cores, continental lake floor cores, Pacific ocean seafloor cores, δ13C measurements in foraminifera and δ13C/δ18O correlations
Carbon in the Deep Ocean
CO2 Solubility in Seawater • Changes in ocean temperature affect solubility of
CO2
• CO2 dissolves faster in cold water ~10 ppm per 1ºC drop
• Surface water has cooled from 2º C to -4ºC in last 20k years
• Deep sea cooled an avg. 2ºC to -3ºC• Should cause a ~20-30 ppm drop in atmospheric
CO2 levels
Effect of Salinity on CO2 Solubility
• CO2 dissolves easier in low salinity water
• Glacial oceans were saltier because of freshwater locked in ice (avg. increase of 1.1‰)
Increase in ocean salinity would raise atmospheric CO2 by 11 ppm
11 ppm increase offsets 20-30 ppm decrease from temp. change to ~14 ppm CO2 decrease
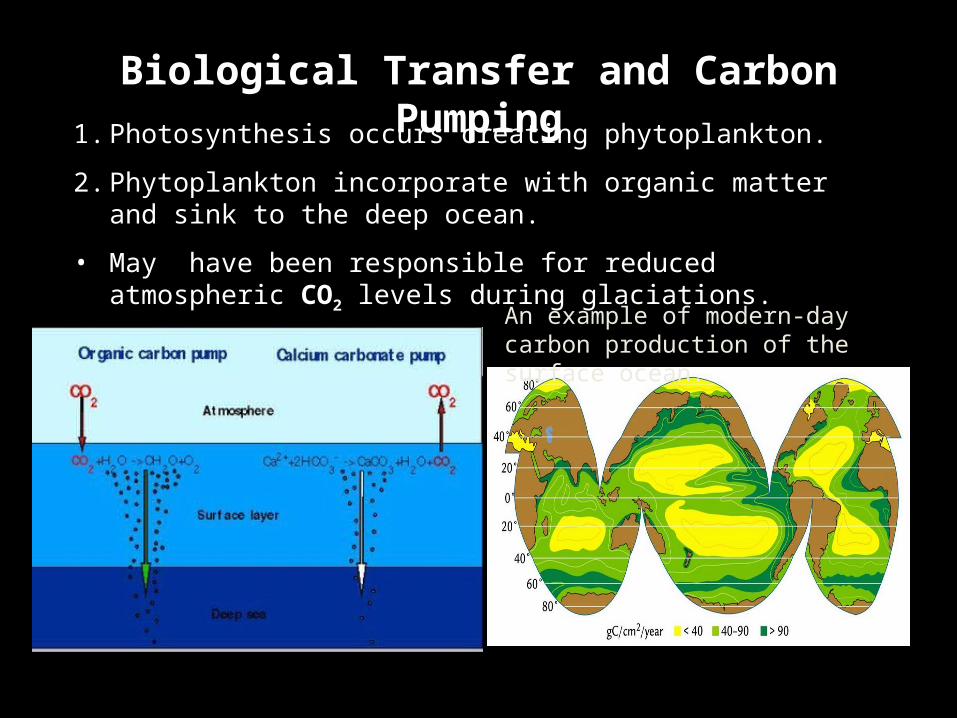
An example of modern-day carbon production of the surface ocean.
1. Photosynthesis occurs creating phytoplankton.
2. Phytoplankton incorporate with organic matter and sink to the deep ocean.
• May have been responsible for reduced atmospheric CO2 levels during glaciations.
Biological Transfer and Carbon Pumping
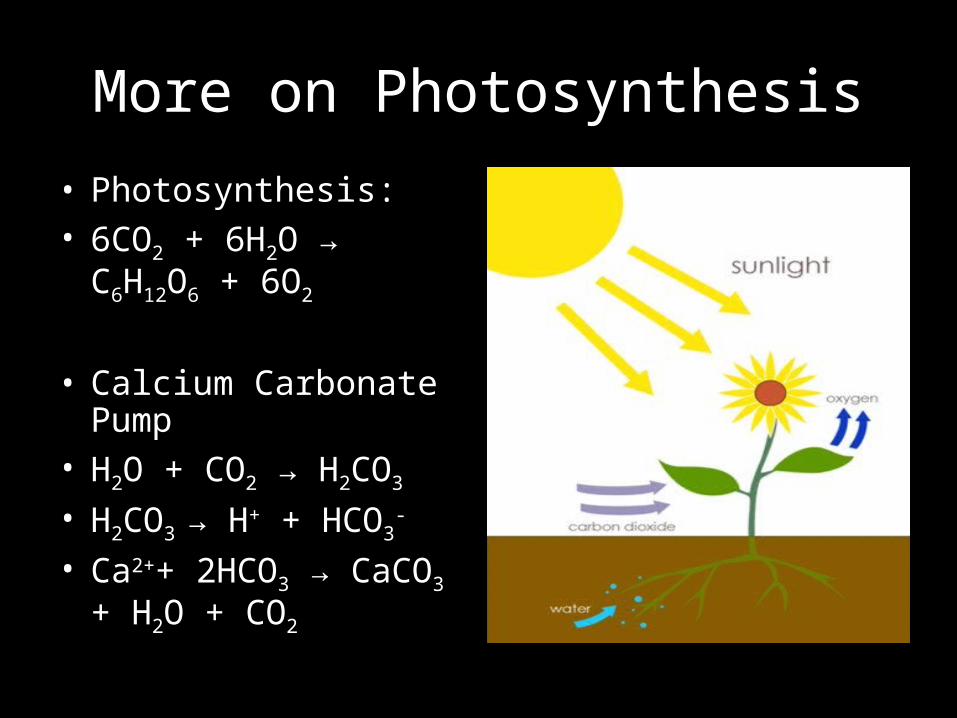
More on Photosynthesis
• Photosynthesis:• 6CO2 + 6H2O →
C6H12O6 + 6O2
• Calcium Carbonate Pump
• H2O + CO2 → H2CO3
• H2CO3 → H+ + HCO3-
• Ca2++ 2HCO3 → CaCO3 + H2O + CO2
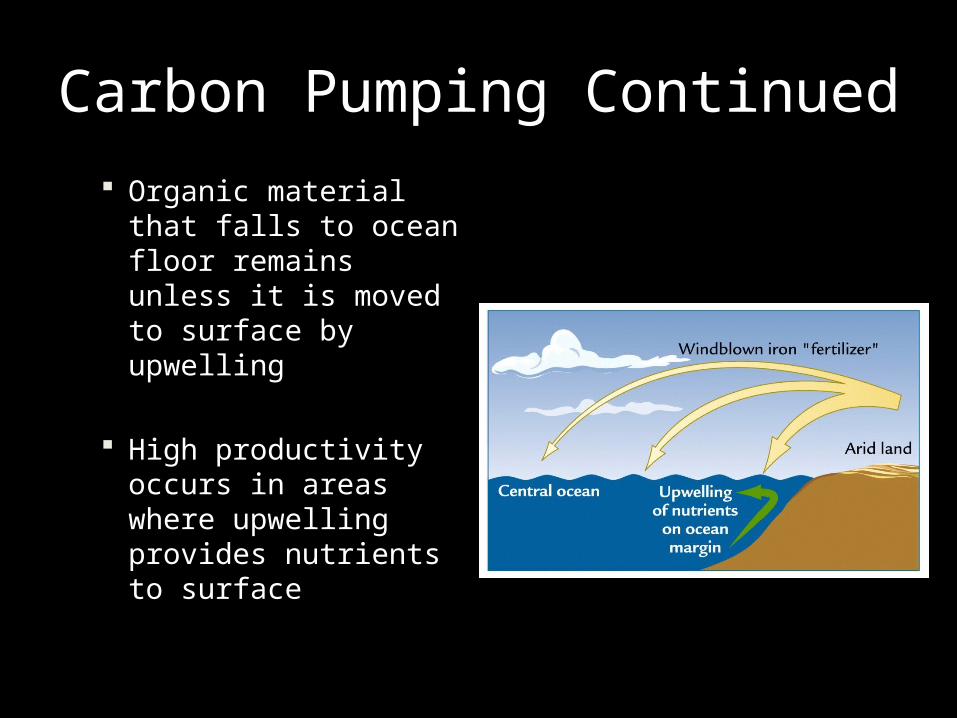
Carbon Pumping Continued
Organic material that falls to ocean floor remains unless it is moved to surface by upwelling
High productivity occurs in areas where upwelling provides nutrients to surface
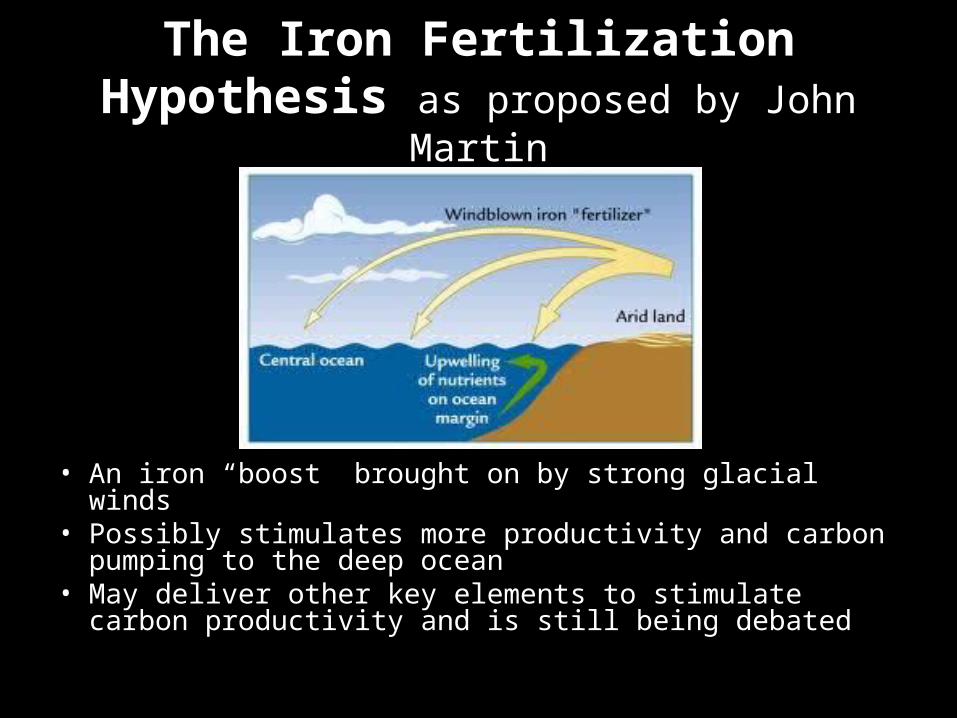
The Iron Fertilization Hypothesis as proposed by John Martin
• An iron “boost” brought on by strong glacial winds • Possibly stimulates more productivity and carbon pumping to
the deep ocean• May deliver other key elements to stimulate carbon
productivity and is still being debated
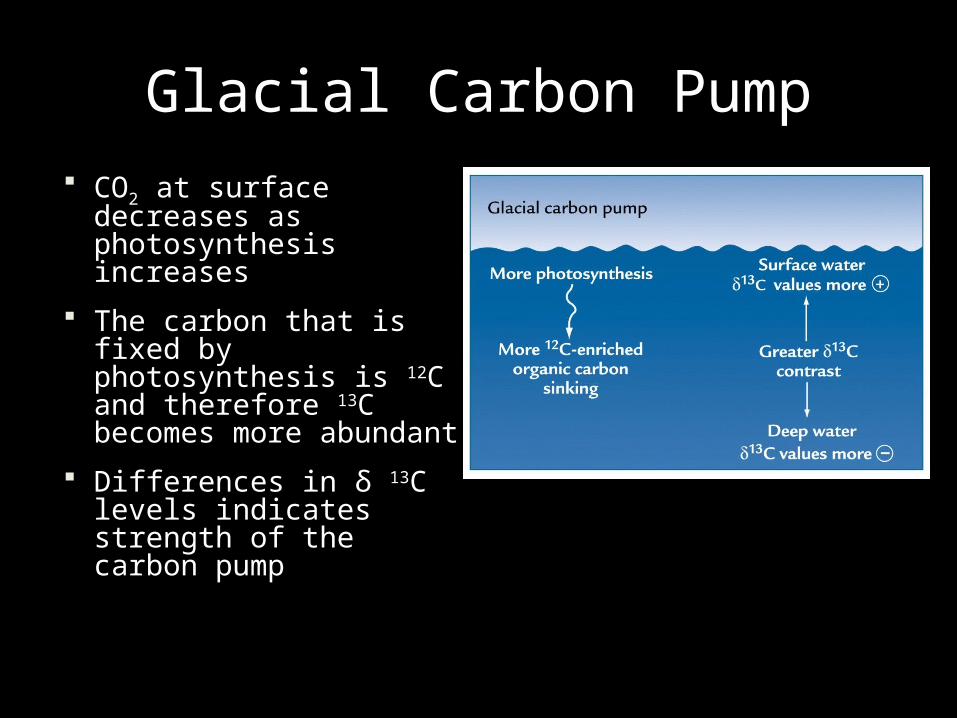
Glacial Carbon Pump CO2 at surface
decreases as photosynthesis increases
The carbon that is fixed by photosynthesis is 12C and therefore 13C becomes more abundant
Differences in δ 13C levels indicates strength of the carbon pump
Changes in Deep Water CirculationHow it's measured
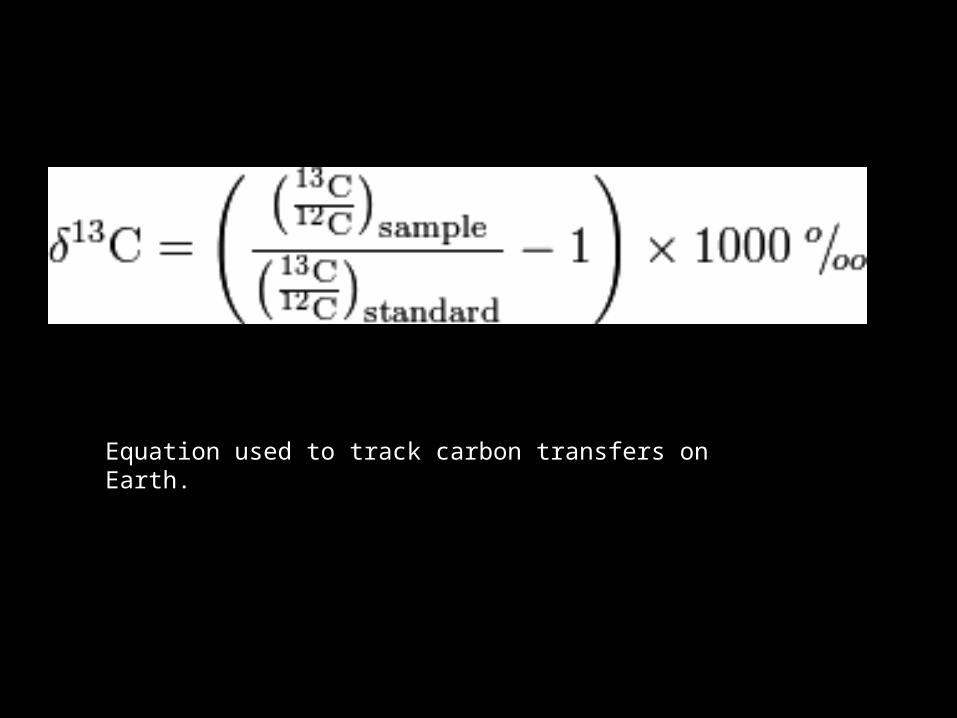
Equation used to track carbon transfers on Earth.
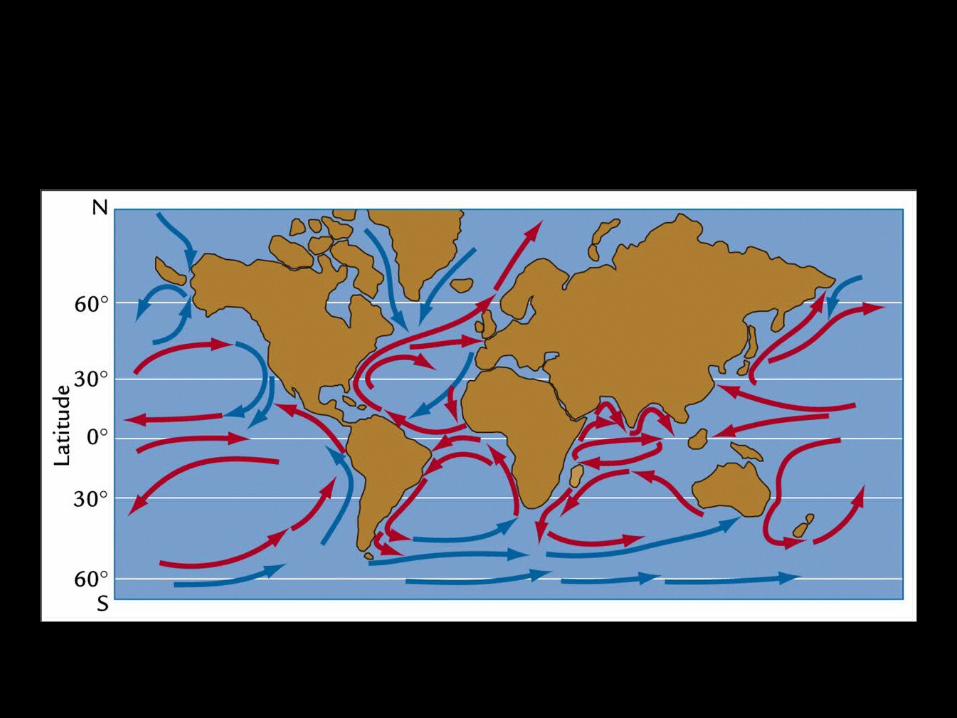
Circulation of Ocean
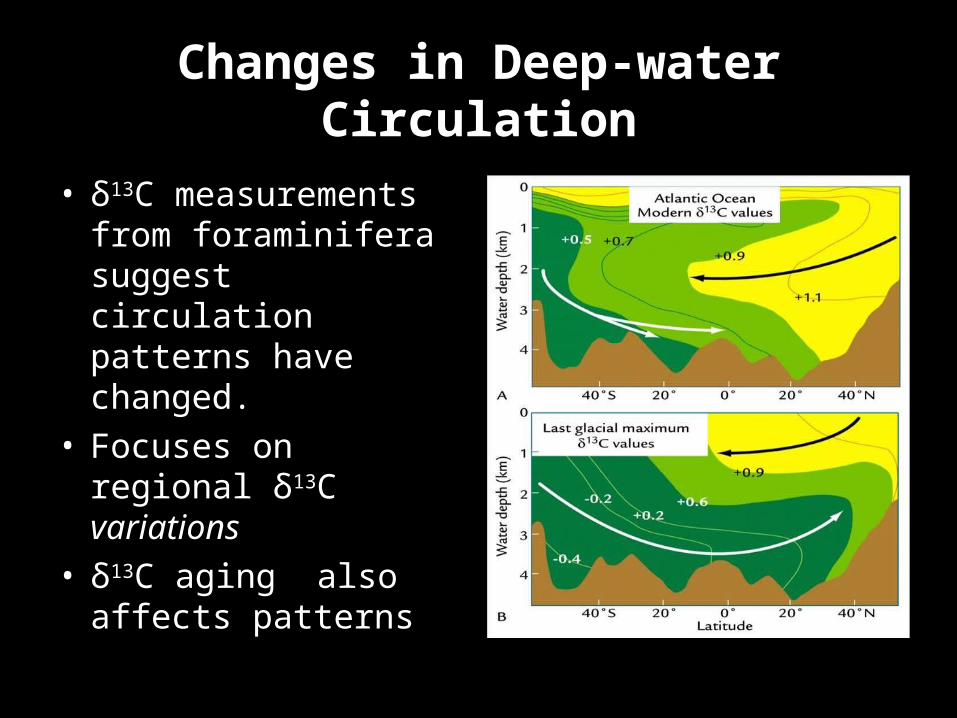
Changes in Deep-water Circulation
• δ13C measurements from foraminifera suggest circulation patterns have changed.
• Focuses on regional δ13C variations
• δ13C aging also affects patterns
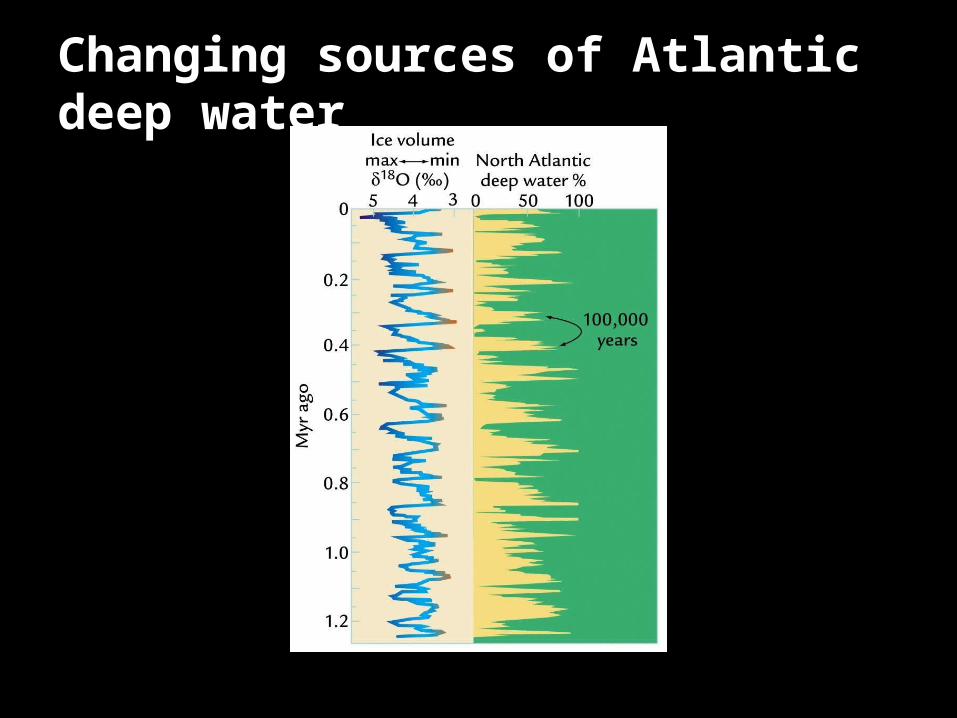
Changing sources of Atlantic deep water
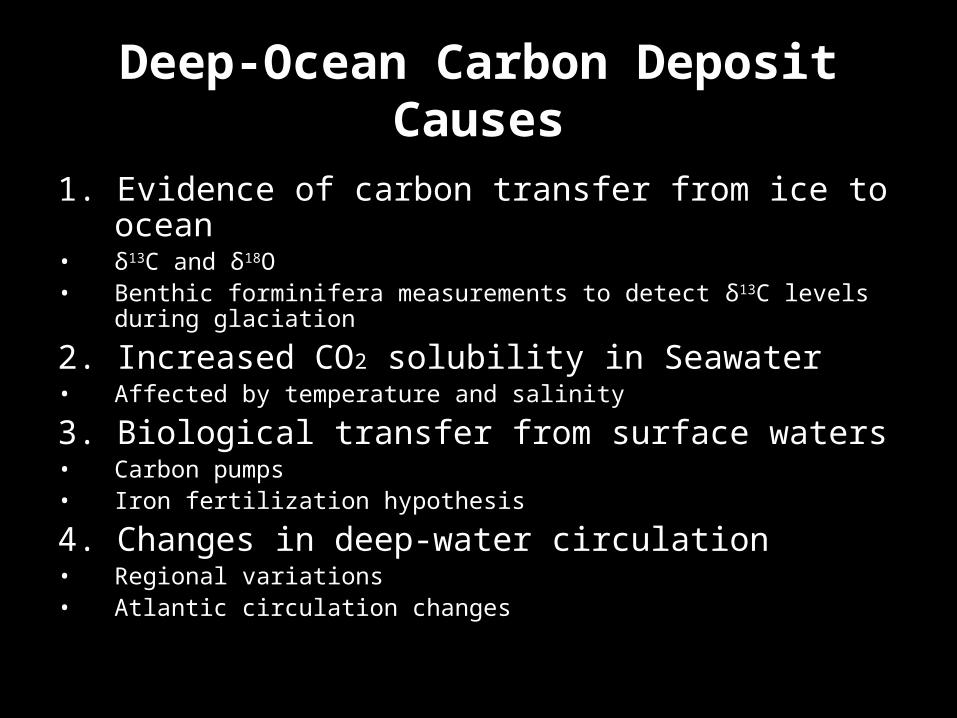
Deep-Ocean Carbon Deposit Causes
1. Evidence of carbon transfer from ice to ocean• δ13C and δ18O • Benthic forminifera measurements to detect δ13C levels during glaciation
2. Increased CO2 solubility in Seawater• Affected by temperature and salinity
3. Biological transfer from surface waters• Carbon pumps• Iron fertilization hypothesis
4. Changes in deep-water circulation• Regional variations• Atlantic circulation changes
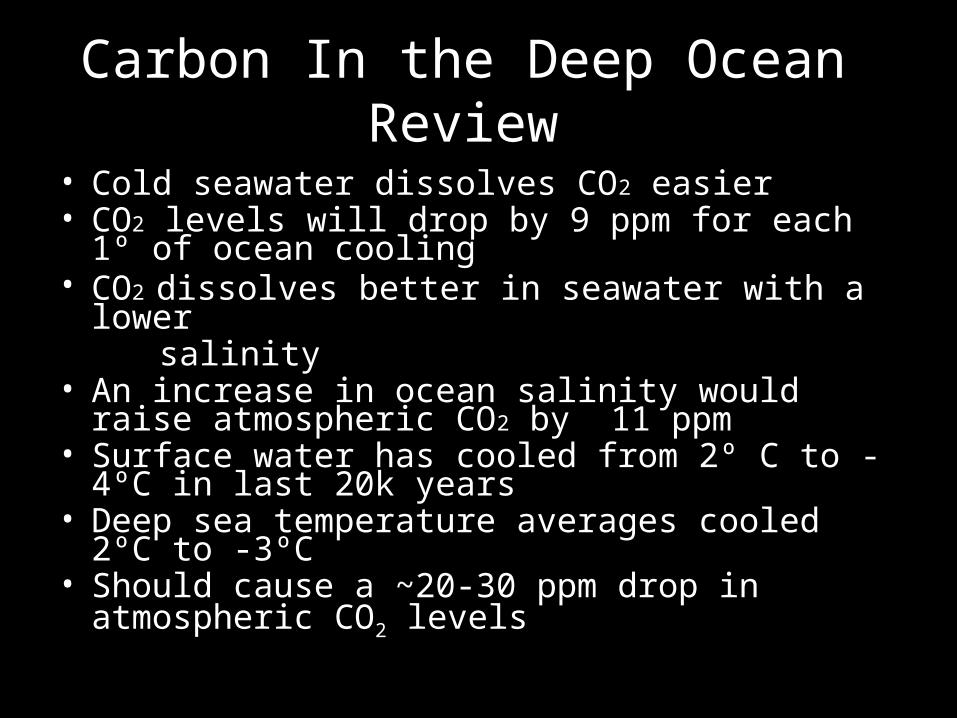
Carbon In the Deep Ocean Review
• Cold seawater dissolves CO2 easier• CO2 levels will drop by 9 ppm for each 1º of ocean
cooling• CO2 dissolves better in seawater with a lower salinity• An increase in ocean salinity would raise atmospheric
CO2 by 11 ppm• Surface water has cooled from 2º C to -4ºC in last 20k
years• Deep sea temperature averages cooled 2ºC to -3ºC• Should cause a ~20-30 ppm drop in atmospheric CO2
levels
Orbital Scale Changes in CH4
Orbital Scale Changes in CH4
• Most natural Methane production occurs in wetlands
• Requires oxygen poor environments
• Microbes in wetlands consume oxygen quicker than it can diffuse from the atmosphere
• Fermentation occurs -microorganisms (methanogens) ferment acetate and H2-CO2 into methane and carbon dioxide
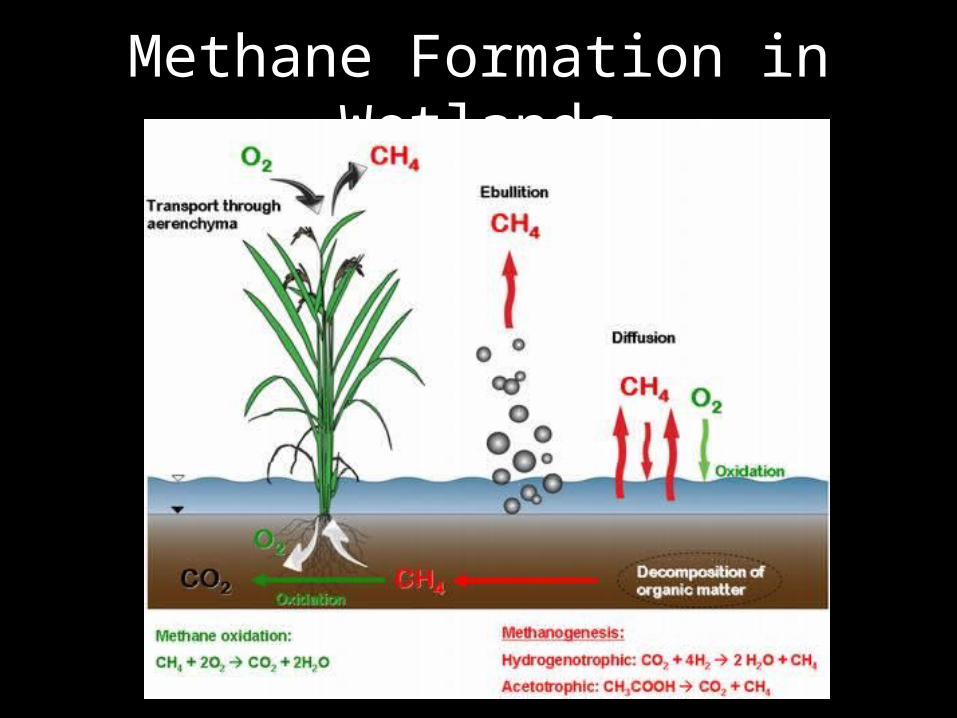
Methane Formation in Wetlands
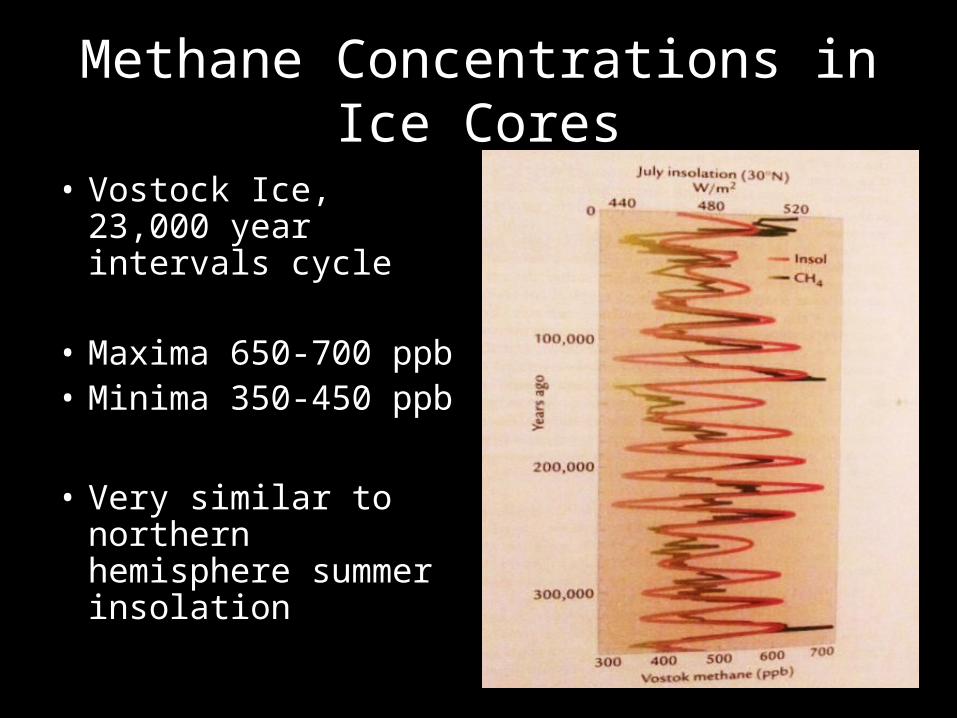
Methane Concentrations in Ice Cores
• Vostock Ice, 23,000 year intervals cycle
• Maxima 650-700 ppb• Minima 350-450 ppb
• Very similar to northern hemisphere summer insolation
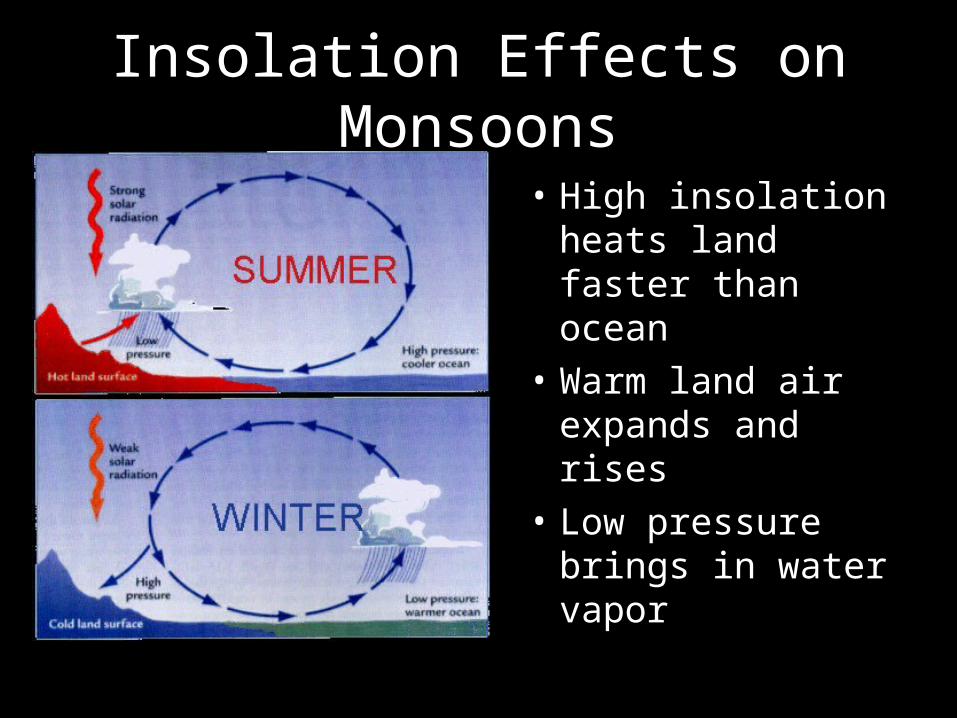
Insolation Effects on Monsoons
• High insolation heats land faster than ocean
• Warm land air expands and rises
• Low pressure brings in water vapor
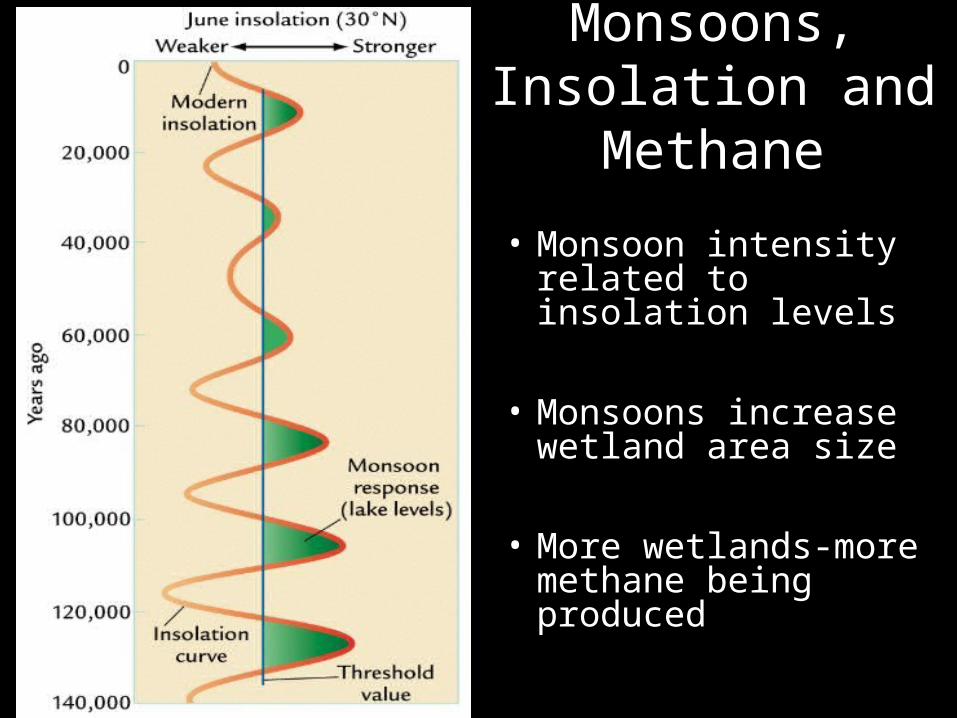
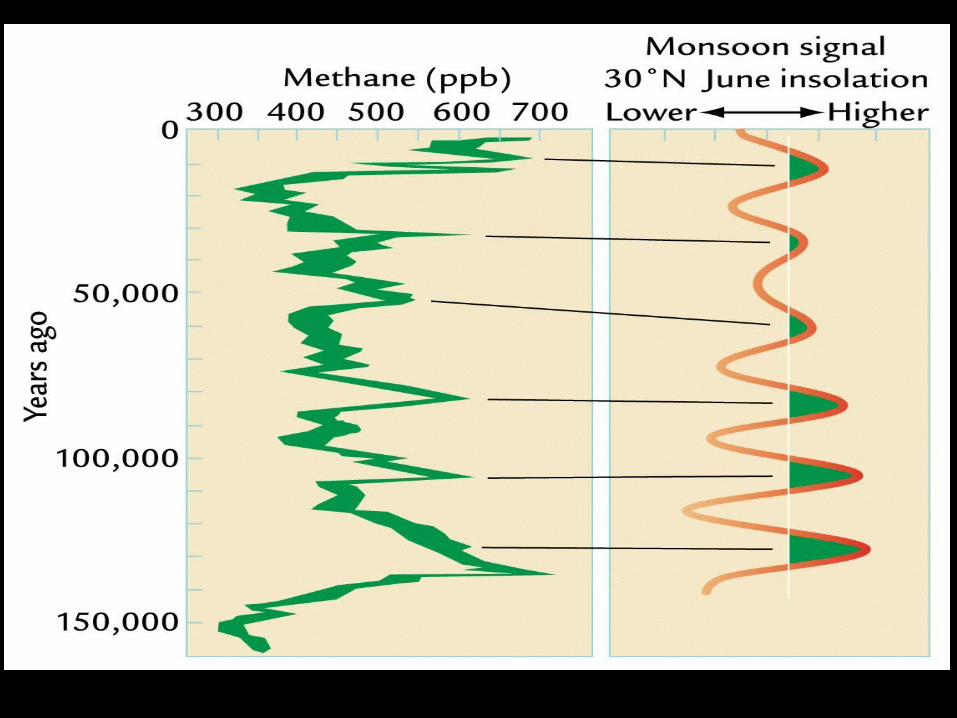
Monsoons, Insolation and
Methane
• Monsoon intensity related to insolation levels
• Monsoons increase wetland area size
• More wetlands-more methane being produced
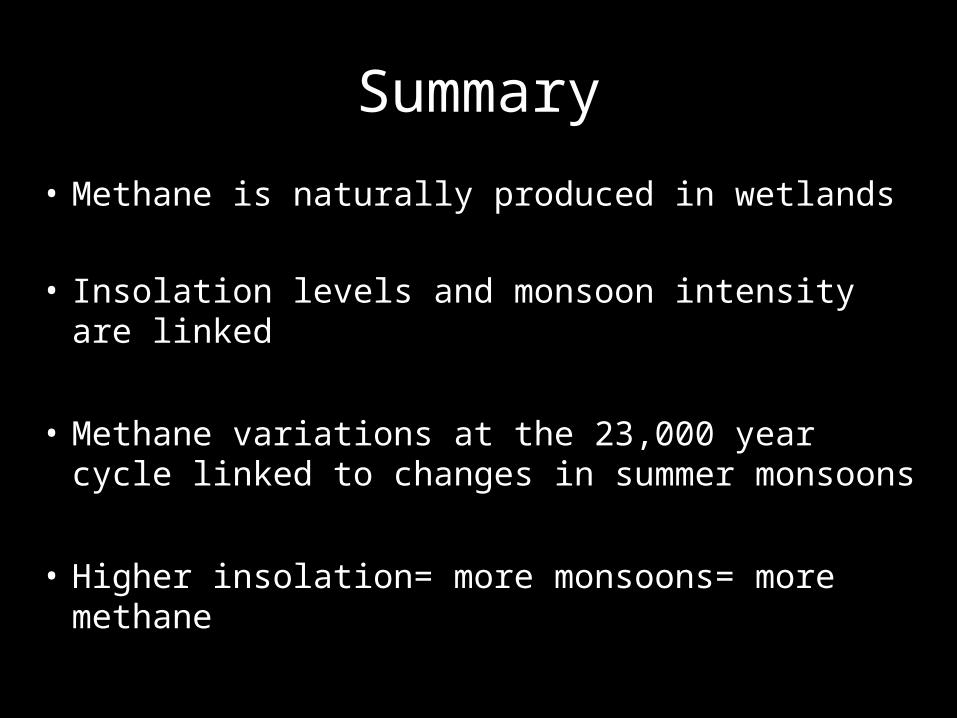
Summary
• Methane is naturally produced in wetlands
• Insolation levels and monsoon intensity are linked
• Methane variations at the 23,000 year cycle linked to changes in summer monsoons
• Higher insolation= more monsoons= more methane
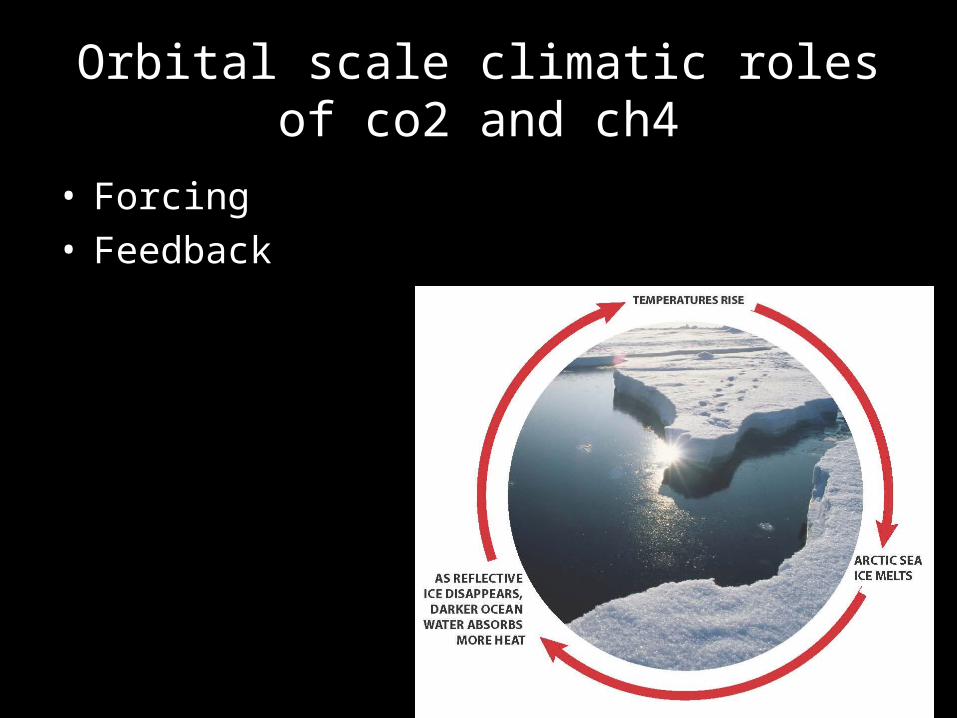
Orbital scale climatic roles of co2 and ch4
• Forcing
• Feedback
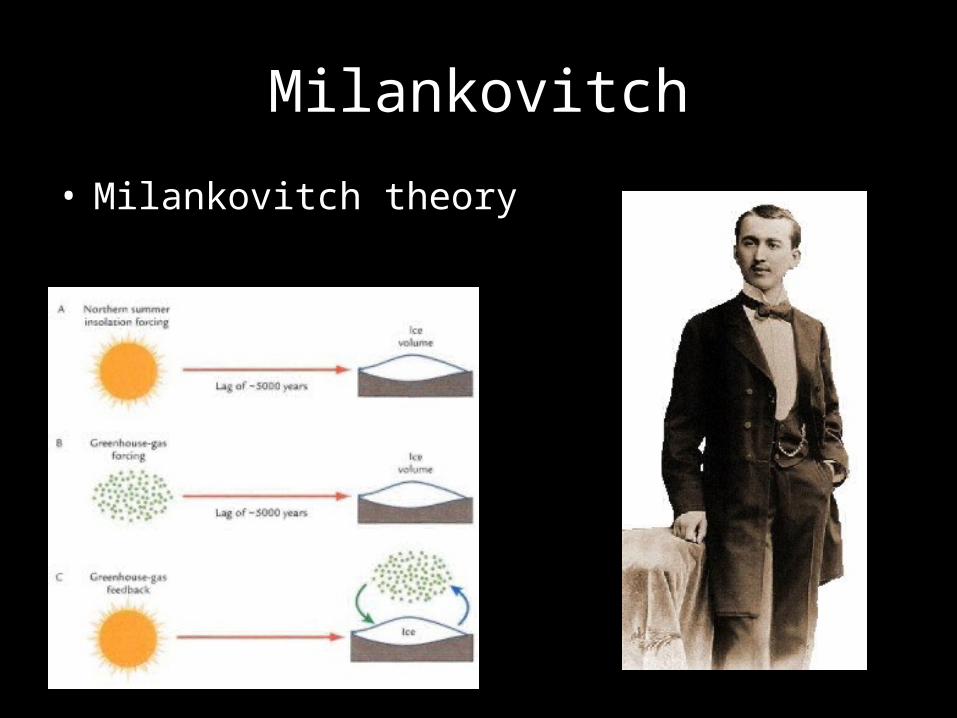
Milankovitch
• Milankovitch theory
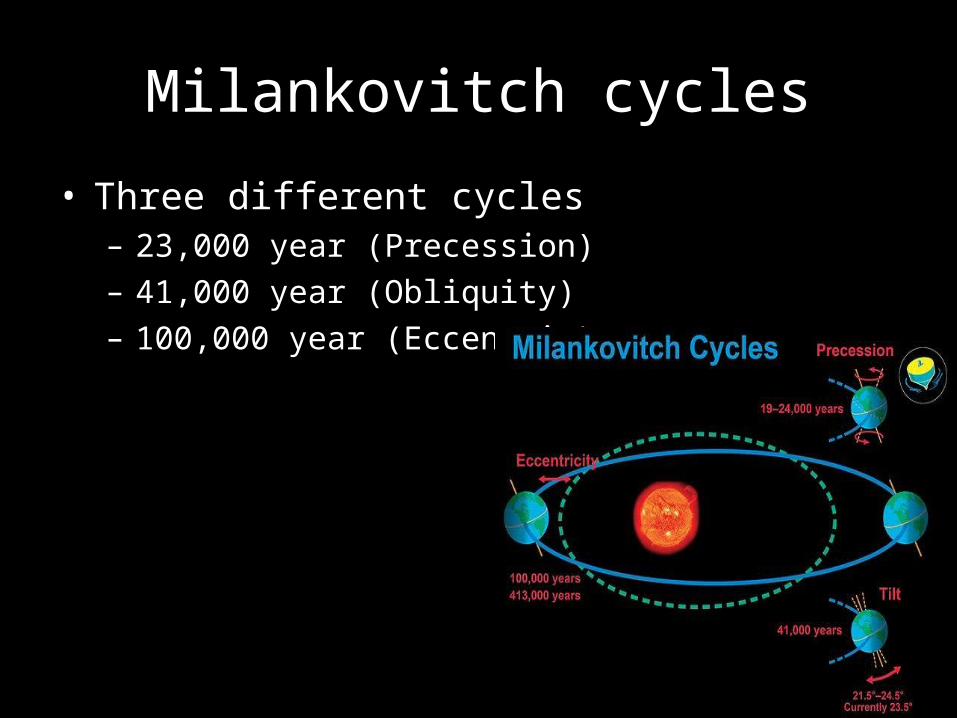
Milankovitch cycles
• Three different cycles– 23,000 year (Precession)
– 41,000 year (Obliquity)
– 100,000 year (Eccentric)
Summary of cycles
• 23,000 year cycle– Co2 and methane act as a forcing
• 41,000 year cycle– Co2 and methane act as a feedback
• 100,000 year cycle– Co2 and methane act as a combination of a large feedback
role and a smaller forcing role.
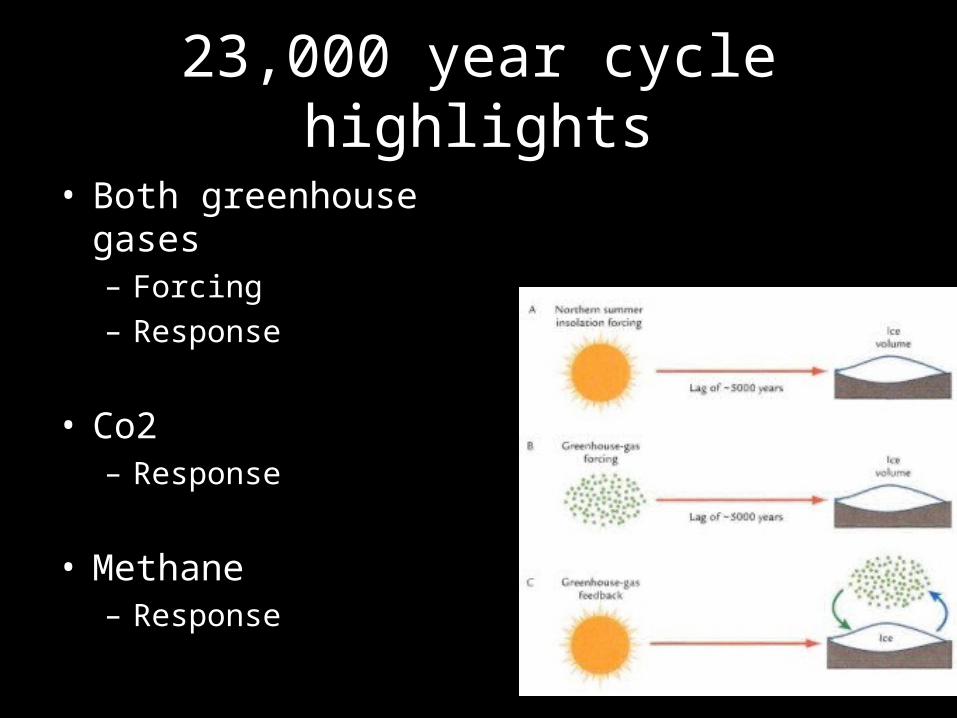
23,000 year cycle highlights
• Both greenhouse gases– Forcing
– Response
• Co2– Response
• Methane– Response
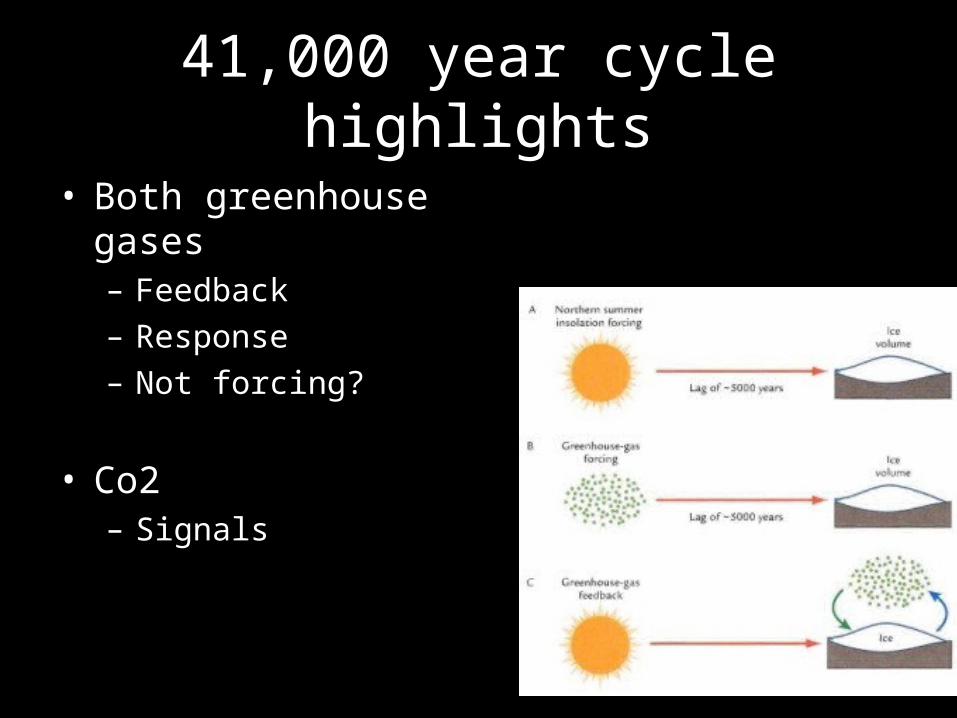
41,000 year cycle highlights
• Both greenhouse gases– Feedback
– Response
– Not forcing?
• Co2– Signals
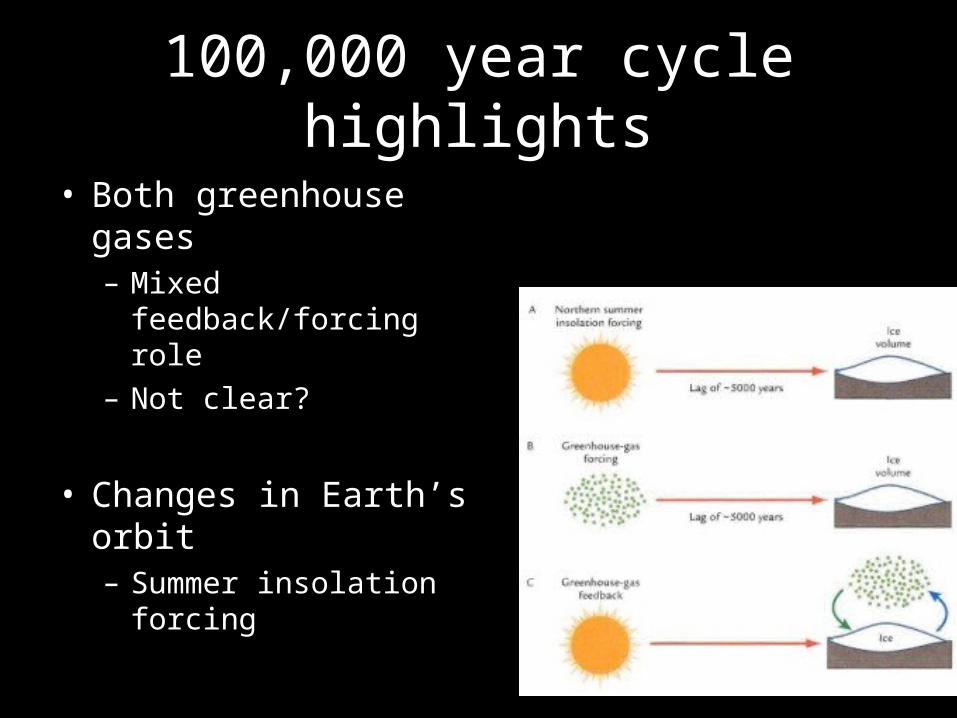
100,000 year cycle highlights
• Both greenhouse gases– Mixed feedback/forcing role
– Not clear?
• Changes in Earth’s orbit– Summer insolation forcing
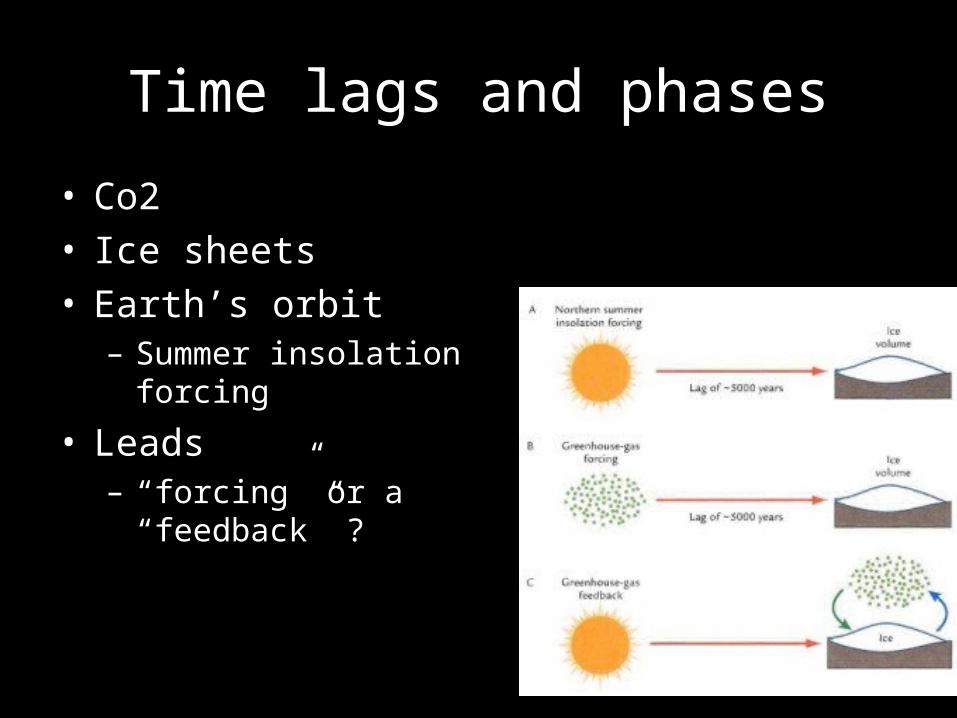
Time lags and phases
• Co2
• Ice sheets
• Earth’s orbit– Summer insolation forcing
• Leads– “forcing” or a “feedback” ?
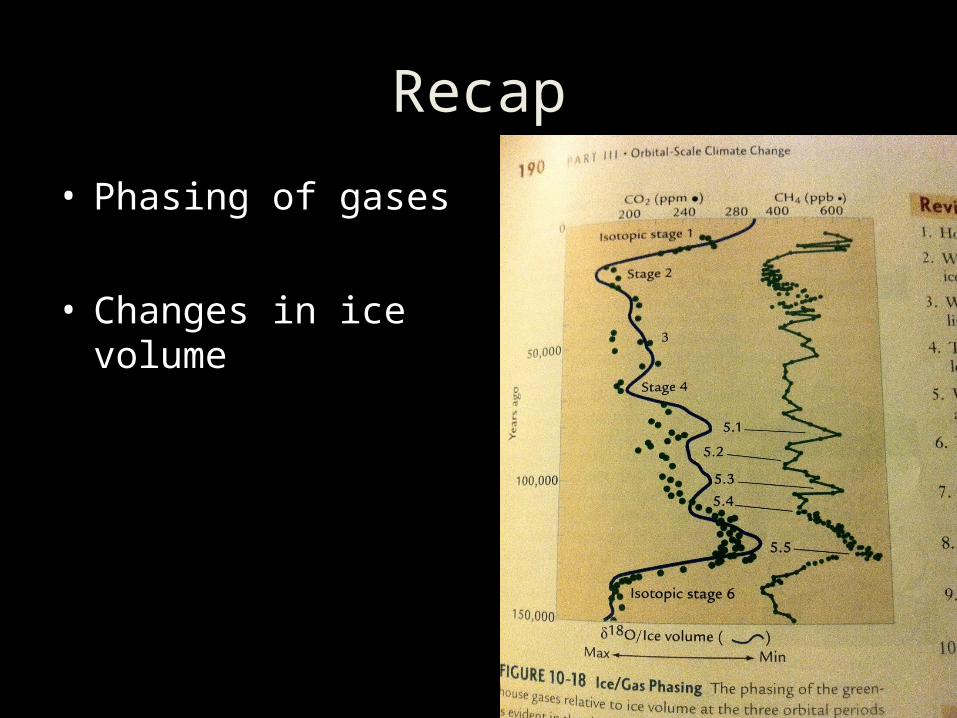
Recap
• Phasing of gases
• Changes in ice volume
Recap
• Ice Cores
• Orbital-Scale Changes in CO2
• Carbon in the Deep Ocean
• Orbital-Scale Changes in CH4
• Orbital-Scale Climatic Roles: CO2 and CH4
http://en.wikipedia.org/wiki/D13C
http://bcs.whfreeman.com/ruddiman/con_index.htm?11
http://www.nsf.gov/news/special_reports/science_nation/icecorelab.jsp
Ruddiman, W. (2008). Earth's climate past and future. (2 ed.). New York: W.H. Freeman and Company.
Works Cited

Recommended