arX
iv:1
504.
0603
4v1
[ph
ysic
s.pl
asm
-ph]
23
Apr
201
5
Optimization of the Combined Proton Acceleration Regime with
a Target Composition Scheme
W. P. Yao,1 B. W. Li,2, ∗ C. Y. Zheng,2, 3 Z. J. Liu,2, 3 and X. Q. Yan3, 4, 5
1Graduate School, China Academy of Engineering Physics, Beijing 100088, China
2Institute of Applied Physics and Computational Mathematics, Beijing 100088, China
3Key Laboratory of HEDP of Ministry of Education,
CAPT, Peking University, Beijing 100871, China
4State Key Laboratory of Nuclear Physics and Technology,
Peking University, Beijing 100871, China
5International Centre for Zetta- Exawatt Science and Technology (IZEST)
(Dated: April 24, 2015)
Abstract
A target composition scheme to optimize the combined proton acceleration regime is presented
and verified by two-dimensional particle-in-cell (2D PIC) simulations by using an ultra-intense
circularly-polarized (CP) laser pulse irradiating an overdense hydrocarbon (CH) target, instead of a
pure hydrogen (H) one. The combined acceleration regime is a two-stage proton acceleration scheme
combining the radiation pressure dominated acceleration (RPDA) stage and the laser wakefield
acceleration (LWFA) stage sequentially together. With an ultra-intense CP laser pulse irradiating
an overdense CH target, followed by an underdense tritium plasma gas, protons with higher energies
(from about 20 GeV up to about 30 GeV) and lower energy spreads (from about 18% down to
about 5% in full-width at half-maximum, or FWHM) are generated, as compared to the use of a
pure H target. It is because protons can be more stably pre-accelerated in the first RPDA stage
when using CH targets. With the increase of the carbon-to-hydrogen density ratio, the energy
spread is lower and the maximum proton energy is higher. It also shows that for the same laser
intensity around 1022 Wcm−2, using the CH target will lead to a higher proton energy, as compared
to the use of a pure H target. Additionally, proton energy can be further increased by employing
a longitudinally negative gradient of a background plasma density.
PACS numbers: 52.38.Kd, 41.75.Jv, 52.35.Mw,52.59.-f
1

INTRODUCTION
Proton acceleration from laser-plasma interaction has been of great interest to researchers
over the past few decades [1–3] because of its importance for a low-cost tabletop acceler-
ators [4], fast ignition in inertial confinement fusion [5], high resolution radiographing [6],
cancer radiation therapy [7, 8] and laboratory astrophysics [9]. Radiation pressure domi-
nated acceleration (RPDA) [10–21] has been proposed as an effective mechanism to obtain
hundreds of MeV of monoenergetic and collimated proton beams. Unfortunately, RPDA
suffers from multi-dimensional effects, such as the target deformation and the transverse
”Rayleigh-Taylor-like” instability. The acceleration process cannot be as stable as predicted
by theory or 1D PIC simulations, which results in a shortening of the acceleration length, a
reduction of maximum energy and a broadening of the energy spectrum of the proton beam.
As a result, a lot of attempts have been made to suppress those multi-dimensional effects,
among which are, the laser mode scheme [22–24], shaped target scheme [25, 26] and target
composition scheme [27–33], etc. Specifically speaking, with the optimized laser pulse (like
the transverse super-Gaussian pulse or the Laguerre-Gaussian pulse) and the corresponding
shaped target structure, the target deformation problem can be prevented, effectively. De-
spite all these efforts mentioned above, it is still difficult to obtain ultra-energetic protons,
for instance, of the order of tens of GeV or even higher. So, it is necessary to look for an
alternative long-distance and stable proton acceleration mechanism.
It is known that electrons can be accelerated stably over a very long distance in a plasma
wakefield [34–36]. This laser wakefield acceleration (LWFA) regime was proved to be theo-
retically capable to accelerate protons as long as they can get trapped by the fast-moving
wakefield [37]. Further, a more specific theory about the trapping condition of protons was
established by Shen and his group [38, 39] . Generally speaking, a proton pre-acceleration
stage, which is used to increase the proton velocity, and a high plasma gas density, which is
used to decrease the wakefield velocity, are needed to satisfy that trapping condition. Above
theory has been verified by 2D PIC simulations and optimized by adding a mass-limited tar-
get in the plasma gas region to improve the monochromaticity of the ultra-energetic proton
beams, by combining LWFA with RPDA.
The combined acceleration regime has been further developed in many studies by using
optimized laser modes [40–42] and modulated underdense plasma gas [43, 44], in order to get
2

ultra-energetic and collimated proton beams. Most recently, to further improve the energy
spectrum of the proton beams, the target composition scheme has also been proposed and
verified by 1D PIC simulations [45]. With the use of a multi-component target, on one
hand, the heavy ions can supply excess co-moving electrons for protons, provide them with
a negative-gradient ”bunching” electrostatic field and preserve their stable acceleration. On
the other hand, the heavy ion layer will be separated from the lighter proton layer, because
of its smaller charge-to-mass ratio, and will expand in space. The expansion of the heavy ion
layer behind the proton layer will protect it from the ”Rayleigh-Taylor-like” instability. In
such target composition scheme, the pure H target is replaced by a CH target to ensure that
a more stable RPDA stage can be realized. With a more stable first stage, the protons in
the CH target can be more efficiently injected into the wakefield than in the pure H target
case. Thus, improvement of the monochromaticity of the proton beams can be achieved
after the second LWFA stage.
In this paper, multi-dimensional effects in above target composition scheme in combined
proton acceleration regime are investigated and verified by 2D PIC simulations. It is found,
in 2D cases, that using a CH target can not only lower the energy spread of the proton
beam, but can also increase the maximum proton energy, as compared to the use of a pure
H target. Additionally, it is worth mentioning that the combined regime using H target
requires an ultra-high laser intensity to get protons pre-accelerated strong enough by RPDA
in the first stage, so that they can get trapped by the fast-moving wakefield in the second
stage and be further accelerated to ultra-high energy. By replacing the pure H target with
a CH one, this high requirement for the laser intensity can be eased down. Moreover, the
proton energy can be further increased by employing a longitudinally negative gradient of
the background plasma density.
SIMULATION MODEL
A two-dimensional spatial and three-velocity fully relativistic electromagnetic particle-
in-cell (2D3V PIC) code KLAP [46, 47] is used to verify this optimized combined proton
acceleration regime. The total simulation box is 80λ(y)× 50λ(z) with λ = 1 µm, which is
the wavelength of the laser pulse, corresponding to a 1000× 2000 cells moving window.
The model is shown in Fig.1. A laser pulse is injected initially and propagates along z-axis
3

FIG. 1. (Color online) The model of the combined proton acceleration regime. The initial density
of the hydrocarbon target is ne/nc = 50, the thickness is 1µm and the transverse size is 4µm. The
density of the background plasma is ne/nc = 0.25, the length is 600µm and the transverse size is
80µm. The tritium background plasma has an effective Z/A ratio of the order of 1/3. A circular
polarized (CP) laser pulse with a transverse super-Gaussian (SG) profile enters the simulation box
from the left boundary.
from the left of the simulation box. The normalized amplitude of the circularly polarized
(CP) laser amplitude is a = a0exp(−r/r0)κsin2(πt/t0), with a0 = eA/mec
2, r0 = 10λ, κ = 4
(super-Gaussian, transversely) [40] and t0 = 20τ , where A is the vector potential, c is the
vacuum light speed, e and me are the charge and mass of electrons, and τ is the laser period,
respectively.
512 particles per cell are used in the overdense regions (10λ < z < 11λ,−2λ < y < 2λ)
and 16 particles in the underdense plasma gas region (11λ < z < 600λ,−40λ < y < 40λ).
The density of the mass-limited overdense target is ni = ne = 50nc (corresponding to
5.5 × 1022 cm−3 with λ = 1 µm), where ni = np + ZnC , np is the density of protons, nC of
carbon ions and nc is the critical density. Z = 6 as we assume that carbon ions are fully
ionized in such an intense laser pulse. Different ratio of nC to np will be examined. For an
4
underdense plasma gas, the density is ni = ne = 0.25nc (corresponding to 2.8× 1020 cm−3).
The density of this plasma gas is higher than in previous works [38–42], in order to ensure
a formation of a slower and more stable wakefield, so that protons can be injected into the
wakefield more efficiently. The tritium plasma gas with an effective Z/A ratio of the order
of 1/3 is chosen for the same reason.
SIMULATION RESULTS
time/τ0 100 200 300 400 500 600 700
Ene
rgy/
GeV
0
5
10
15
20
25 nC
:np=9:1
nC
:np=7:3
nC
:np=5:5
nC
:np=3:7
nC
:np=1:9
nC
:np=0:10
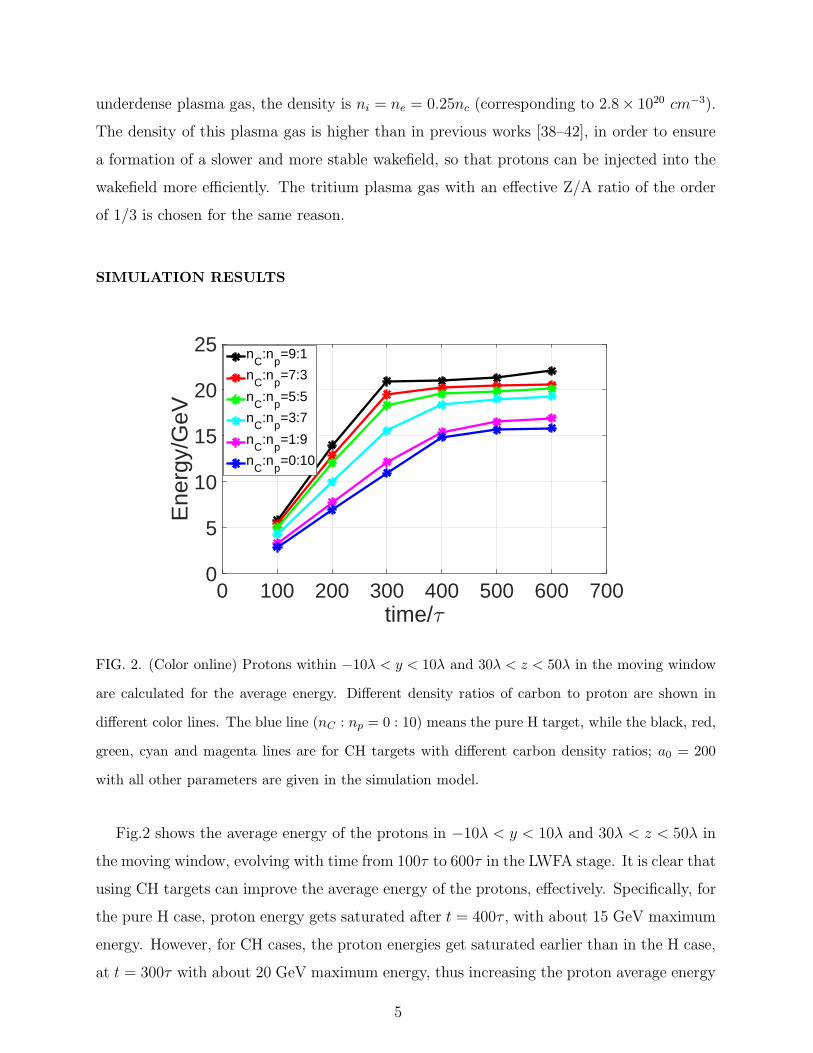
FIG. 2. (Color online) Protons within −10λ < y < 10λ and 30λ < z < 50λ in the moving window
are calculated for the average energy. Different density ratios of carbon to proton are shown in
different color lines. The blue line (nC : np = 0 : 10) means the pure H target, while the black, red,
green, cyan and magenta lines are for CH targets with different carbon density ratios; a0 = 200
with all other parameters are given in the simulation model.
Fig.2 shows the average energy of the protons in −10λ < y < 10λ and 30λ < z < 50λ in
the moving window, evolving with time from 100τ to 600τ in the LWFA stage. It is clear that
using CH targets can improve the average energy of the protons, effectively. Specifically, for
the pure H case, proton energy gets saturated after t = 400τ , with about 15 GeV maximum
energy. However, for CH cases, the proton energies get saturated earlier than in the H case,
at t = 300τ with about 20 GeV maximum energy, thus increasing the proton average energy
5

by about 33%. This also indicates that the acceleration efficiency of CH targets is higher
than that of H target. Additionally, by increasing the percentage of the carbon ions density,
the averaged energy and the effectiveness will increase, as well.
Energy(GeV)0 10 20 30
Num
ber
100
101
102
103
104n
C:n
p=0:10
nC
:np=9:1
nC
:np=7:3
nC
:np=5:5
(a)
z/λ380 385 390 395 400
Pz/m
pc
5
10
15
20
25
30 nC
:np=0:10
nC
:np=9:1
nC
:np=7:3
nC
:np=5:5
(b)
FIG. 3. (Color online) The energy spectrum of protons is shown in (a) and proton phase space is
shown in (b) at t = 400τ , when the acceleration gets saturated in all cases. All parameters are the
same as for Fig.2.
Fig.3 shows the energy spectrum and the phase space of protons at t = 400τ , when the
LWFA stage ends for all cases. In Fig.3 (a), the energy spectra of different targets clearly
show the optimization effects by using CH targets. Not only are the proton maximum
energies increased, but also their energy spreads are decreased. The full-width at half-
maximum (FWHM) of pure H case is about 18%, while that of the CH cases is about 10%
for nC : np = 5 : 5 case, 7% for nC : np = 7 : 3 case and 5% for nC : np = 9 : 1 case,
respectively. All of above are smaller than that for pure H case.
In Fig.3 (b), the phase space of the ultra-energetic protons shows the similar results as
that in Fig.3 (a). Despite a larger number of protons in pure H target, the beam structure
is quite spread in space and the maximum energy is only about 20 GeV. On the contrary,
the beam structures from the CH targets are very compact and almost all of the maximum
energies are larger than 27 GeV. Thus, increasing the proton maximum energy by more than
35%. This result is in accordance with that in Fig.2. More importantly, it is these compact
beam structures of the CH target that lead to the improvement of the monochromaticity.
6

EXPLANATIONS AND DISCUSSIONS
z/λ0
250 260 270 280 290 300
y/λ
0
-40
-20
0
20
40Protons
-40
-20
0
20
40(a)
z/λ0
250 260 270 280 290 300
y/λ
0
-40
-20
0
20
40Protons
-40
-20
0
20
40(b)
FIG. 4. (Color online) The normalized longitudinal electrostatic fields Ez for (a) pure H target
and (b) nC : np = 5 : 5 CH case at t = 300τ . Mass-limited target proton positions are dotted in
blue for the pure H target and in green for the CH case. All parameters are the same as for Fig.2.
The normalized longitudinal electrostatic fields shown in Fig. 4 can explain why the use
of CH targets can accelerate protons to a higher energy in the LWFA stage. As can be seen
from Fig. 4 (a), for the pure H case at t = 300τ , protons with the highest energy have been
accelerated out of the wakefield region. In contrast, for the CH target, most protons are still
located at the front of the wakefield, where Ez is the largest, in Fig.4 (b). Additionally, it
is clearly seen that protons in H target are distributed sparsely in space, resulting in a tail
structure with a lower energy behind the most energetic part. While the distribution of the
CH protons is very compact with the equal high energy. When averaging around the region
−10λ < y < 10λ and 280λ < z < 300λ at t = 300τ , there is no doubt that CH protons will
get a higher energy, as compared to the pure H target protons.
The longitudinal electrostatic field is also improved in CH target, as compared to the
H case. As can be seen from Fig.4 (a), Ez is smaller in size and weaker in strength, as
compared to that in Fig.4 (b). In the pure H target, because much of the laser energy is
transferred to the relatively low-energy protons, which are distributed in the tail structure
of the proton beam, the size and strength of the wakefield are decreased, as compared to
those in CH case. Moreover, when using a CH target, an optimized beam injection effect
is realized. The proton beam has a compact structure, without the tail and such relatively
7

low-energy protons in it. As a result, the laser energy can be transferred to the trapped
protons more effectively.
Similarly, Fig.4 can also explain why the use of CH target can optimize the proton
energy spectrum. In the positive gradient ”debunching” wakefield, protons at the front of
the beam will experience a larger longitudinal electrostatic field and will be accelerated to
a higher velocity, while those at the back of the beam will experience a smaller longitudinal
electrostatic field and a lower speed. Thus, the energy spread of the tail-structured proton
beam of H target becomes broader than that of the compact-structured proton beam of CH
target.
8 10 12 14 16-50
0
50
100E
zn
p/2
12 14 16 18 20-25
0
25
50E
zn
p/4
16 18 20 22 24-20
0
20
40E
zn
p/3
8 10 12 14 16
Ez(m
eω
c/e)
& n
p(n
c)
-50
0
50
100 Ez
np×5
12 14 16 18 20-25
0
25
50E
zn
p×5
16 18 20 22 24-20
0
20
40 Ez
np×5
Z/λ
t = 18τ t = 22τt = 14τ(a) (b) (c)
(d) (e) (f)
FIG. 5. (Color online) Snapshots of the normalized longitudinal electrostatic fields Ez (red dashed
line) and proton densities for the pure H target (blue solid line) and the nC : np = 5 : 5, CH target
(green solid line) are presented; (a), (b) and (c) are the pure H case and (d), (e) and (f) are the
CH case. Furthermore, (a) and (d) are the result at t = 14τ , (b) and (e) are at t = 18τ , and (c)
and (f) are at t = 22τ . All parameters are the same as for Fig.2.
By comparing the evolution of the electrostatic field in RPDA stage, we can gain further
understanding of the physical mechanisms leading to a proton beam quality improvement,
8

when using a CH target instead of a H one. Fig.5 shows the snapshots of Ez and np at
t = 14τ , t = 18τ and t = 22τ , respectively. Although the value of the Ez for both targets
is almost the same at the same time, there is a distinctive difference in the location of the
proton beams. For CH target, the protons are always located at the negative-gradient part,
or the ”bunching” part of Ez, leading to the compact proton beam structure in Fig.4 (b),
and resulting in a narrower energy spectrum. It is because there are heavy carbon ions
behind protons, pushing them with Coulomb repulsion effects. This will also lead to a larger
Ez, as can be seen in Fig.5 (e), as compared to that in Fig.5 (b) at t = 18τ . However, for
the pure H target, the protons are located at the ”bunching” part of Ez at t = 14τ , then at
the peak part at t = 18τ and finally at the ”debunching” part. From then on, the stability
of RPDA stage for pure H target becomes lower than that for the CH target.
In short, our 2D PIC simulation results agree with our former 1D analysis [45] very well,
indicating that the target composition scheme has an optimization effect on the combined
proton acceleration regime. Moreover, when considering multi-dimensional effects (2D PIC),
the optimization scheme performs even better, as compared to 1D scenario. Not only are
the monochromaticity of the energetic proton beams optimized, but also their maximum
energies are improved.
PARAMETER STUDIES
Aiming at discovering the best set of laser and target parameters, which could improve the
maximum energy and monochromaticity of the proton beam, parameter studies by varing
the CH ratio, the laser intensity and the underdense plasma gas density profile have been
done.
Effects of Number Density Ratio of CH Target
Fig.6 shows the influence of a number density ratio of carbon-to-hydrogen on the quality
of the proton beam in the combined proton acceleration regime. By a series of 2D PIC sim-
ulations with different density ratio of carbon-to-hydrogen, we found that, as the percentage
of number density of H+ increases, the maximum energy of the protons is decreasing, while
the energy spread of the proton beam is increasing. For nC : np = 1 : 9 case, i.e., when
9

the percentage of H+ gets 90%, the maximum energy is only about 22 GeV and the energy
spread is about 18%. However, for nC : np = 9 : 1 case, or the percentage of H+ is only 10%,
the maximum energy is almost 30 GeV and the energy spread is limited to only 5%. The
result clearly indicates that using a hydrocarbon target in the combined proton acceleration
regime can largely improve the acceleration quality.
Percentage of H+(%)0 20 40 60 80 100
Max
imum
Ene
rgy(
GeV
)
20
22
24
26
28
30
Ene
rgy
Spr
ead(
%)
0
5
10
15
20(a)
FIG. 6. (Color online) The scaling of the maximum energy (red line) and energy spread (blue line)
of the accelerated proton beams with the different percentage of the hydrogen in the CH target.
The data are calculated at t = 400τ . All other parameters are the same as for Fig.2.
Effects of Laser Amplitude
In addition to the CH ratio, here we also investigated the influence of laser intensity on
the quality of the proton beam in the combined proton acceleration regime. As shown in
Fig.7, by a series of 2D PIC simulations within a given laser intensity range (from a0 = 100
to a0 = 250) , the averaged proton energy is also increased, which is easy to understand.
What interests us is that within above laser intensity range, the averaged proton energy
of the CH target case is always larger than that of the H target case. The above results
indicate that, if we want to accelerate the protons to a certain energy, we can use a lower
laser intensity by replacing the H target with a CH one. On the other hand, at a fixed laser
intensity, by using a CH target instead of a H one, we could get a higher proton energy.
10

a0
75 125 175 225 275
Ave
rage
d E
nerg
y(G
eV)
10
15
20
25
30
35n
C:n
p=0:10
nC
:np=5:5
FIG. 7. (Color online) The scaling of the maximum energy of the accelerated proton beams with
the laser intensity. The green line is for the CH target case and the blue line is for the H target
case. The data are calculated at t = 400τ . All other parameters are the same as for Fig.2.
Effects of Underdense Plasma Gas Density Profile
At last, the influence of underdense plasma gas density profile on the proton beam quality
is also investigated. In the electron LWFA regime, the dephasing length of the trapped
electrons can be much longer by employing a positive density gradient[49]. Inspired by this
improvement scheme, we can expect to improve the proton energy in the combined proton
acceleration regime by using a negative gradient of the underdense background plasma (BP)
gas.
Fig. 8 (a) shows the average proton beam energy for different underdense background
plasma (BP) profiles. A linearly (ne/nc = −0.0006(z − 200) + 0.25) and an exponentially
(ne/nc = 0.25 exp [−(z − 200)/125]) decreasing background plasma density are used to com-
pare with the uniform case (ne/nc = 0.25). As we expected, using a negative gradient of a
background plasma can improve the average proton energy in the combined proton accel-
eration regime. And larger negative gradient results in a higher proton energy. From the
energy spectrum of proton beams in Fig. 8 (b), the same result can be seen apparently.
These results can be explained by analyzing the details of above acceleration carefully.
For the uniform case, the trapped protons will catch up with the accelerating field at the laser
11

time/τ0 200 400 600 800
Ene
rgy/
GeV
0
5
10
15
20
25UniformLinearExp
(a)
Ek(GeV)
10 15 20 25 30 35
Num
ber
100
101
102
103
104
UniformLinearExp
(b)
FIG. 8. (Color online) (a) The average proton energy with time for CH target for different BP, and
(b) the energy spectrum of CH target proton for different BP, the data are calculated at t = 600τ .
The green solid line is for the uniform BP case, while the black and red solid line are for the linearly
and exponentially decreasing gradient BP case, respectively. All other parameters are the same as
for Fig.2.
front at about t = 400τ , and then these protons will stop acceleration and their energy will
get saturated. However, for the negative gradient case, the phase velocity of the accelerating
field becomes higher than before when it comes into the low density region. This theory
has been well established in a number of former works [42, 43, 50] and the velocity can be
estimated as, vf ≈ 1− 3
2
ne
γanc
, and γa =√
1 + a20. As the accelerating field moves faster, the
trapped protons will stay in it for a longer time, and their energy will keep growing without
getting saturated.
Finally, it is worth mentioning that in the electron LWFA regime, as well as, in combined
proton acceleration regime, the collimation quality is, as important as, the monochromatic-
ity. However, the long acceleration distance in these regimes make it difficult to keep the
energetic protons well collimated. Moreover, laser-plasma instabilities and filamentation
will also affect the transport of a laser pulse in the underdense background plasma. To
improve the collimation quality, a lot of attempts have been made, including the famous
plasma channeling scheme [36] in the electron LWFA regime, and the transversely modu-
lated background plasma density scheme [44], as well as, the LG laser pulse scheme [51] in
the combined proton acceleration regime. Efforts of employing a channel-guided scheme in
the combined proton acceleration regime have been made by our group and the result will
be presented in future publications.
12

SUMMARY
In conclusion, a target composition scheme is proposed, based on 2D PIC simulations,
to optimize the maximum energy and energy spectrum of the combined proton acceleration
regime (RPDA and LWFA). With the use of a CH target, instead of a H one, not only
can the proton maximum energy be increased, but also the proton energy spread can be
narrowed. For example, with the same laser intensity of 1.1 × 10²³ Wcm−2 and a tritium
plasma gas density of 2.8 × 1020 cm−3, the use of nC : ne = 5 : 5 CH target can improve
the proton maximum energy by more than 35%, from about 20 GeV to about 27 GeV.
Moreover, it can also optimize the energy spread by more than 50% from about 18% down
to 7%. Explanations of the acceleration effectiveness and monochromaticity improvement
have been made in both the RPDA and LWFA stages. From the physical consideration,
the carbon ion here plays a key role, leading to a more stable pre-acceleration of protons
and then to a more compact beam structure in the LWFA stage. Scaling studies of the
CH ratio, laser intensity and background plasma density have been investigated in order to
further limit the energy spread, to reduce the high requirement for the laser intensity and
to increase the proton energy.
ACKNOWLEDGMENTS
The project was sponsored by the NSFC (Grants No. 11375032, No.11175030) and the 973
project (Grant No.61319403). The authors would like to gratefully acknowledge Professor M.
M. Skoric, Lihua Cao, Bin Qiao and Xiantu He for their valuable suggestions. And we also
thank Fanglan Zheng, Dong Wu, Taiwu Huang and Chengzhuo Xiao for useful discussions.
∗ li [email protected]
[1] E. L. Clark, K. Krushelnick, J. R. Davies, M. Zepf, M. Tatarakis, F. N. Beg, A. Machacek, P.
A. Norreys, M. I. K. Santala, I. Watts and A. E. Dangor, Phys. Rev. Lett. 84, 670 (2000a);
[2] A. Maksimchuk, S. Gu, K. Flippo and D. Umstadter, Phys. Rev. Lett. 84, 4108 (2000);
[3] R. A. Snavely, M. H. Key, S. P. Hatchett, T. E. Cowan, M. Roth, T. W. Phillips, M. A. Stoyer,
E. A. Henry, T. C. Sangster, M. S. Singh, S. C. Wilks, A. MacKinnon, A. Offenberger, D. M.
13

Pennington, K. Yasuike, A. B. Langdon, B. F. Lasinski, J. Johnson, M. D. Perry and E. M.
Campbell, Phys. Rev. Lett. 85, 2945 (2000).
[4] J. W. Shearer, J. Garrison, J. Wong and J. E. Swain, Phys. Rev. A 8, 1582 (1973).
[5] M. Roth, T. E. Cowan, M. H. Key, S. P. Hatchett, C. Brown, W. Fountain, J. Johnson, D.
M. Pennington, R. A. Snavely, S. C. Wilks, K. Yasuike, H. Ruhl, F. Pegoraro, S. V. Bulanov,
E. M. Campbell, M. D. Perry, and H. Powell, Phys. Rev. Lett. 86, 436 (2001).
[6] M. Borghesi, A. Schiavi, D. H. Campbell, M. G. Haines, O. Willi, A. J. Mackinnon, P. Patel,
M. Galimberti, L. A. Gizzi, Rev. Sci. Instrum. 74, 1688 (2003).
[7] E. Fourkal, B. Shahine, M. Ding, J. S. Li, T. Tajima and C. M. Ma, Med. Phys. 29, 2788
(2002) and references therein.
[8] K. M. Hofmann, S. Schell, and J. J. Wilkens, J. Biophotonics 5, 903 (2012) and references
therein.
[9] B. A. Remington, R. P. Drake, H. Takabe and D. Arnett, Phys. Plasmas 7, 1641 (2000).
[10] A. Pukhov, Phys. Rev. Lett. 86, 3562 (2001).
[11] B. F. Shen and Z. Z. Xu, Phys. Rev. E 64, 056406 (2001).
[12] T. Esirkepov, M. Borghesi, S. V. Bulanov, G. Mourou and T. Tajima, Phys. Rev. Lett. 92,
175003 (2004).
[13] J. Fuchs, P. Antici, E. d’Humieres, E. Lefebvre, M. Borghesi, E. Brambrink, C. A. Cecchetti,
M. Kaluza, V. Malka, M. Manclossi, S. Meyroneinc, P. Mora, J. Schreiber, T. Toncian, H.
Pepin and P. Audebert, Nature Physics 2, 48-54 (2006).
[14] B. M. Hegelich, B. J. Albright, J. Cobble, K. Flippo, S. Letzring, M. Paffett, H. Ruhl, J.
Schreiber, R. K. Schulze and J. C. Fernandez, Nature 439, 441-444 (2006).
[15] L. Yin, B. J. Albright, B. M. Hegelich, K. J. Bowers, K. A. Flippo, T. J. T. Kwan and J. C.
Fernandez, Phys. Plasmas 14, 056706 (2007).
[16] X. Q. Yan, C. Lin, Z. M. Sheng, Z. Y. Guo, B. C. Liu, Y. R. Lu, J. X. Fang, and J. E. Chen.,
Phys. Rev. Lett. 100, 135003 (2008).
[17] A. P. L. Robinson, M. Zepf, S. Kar, R. G. Evans and C. Bellei, New J. Phys. 10, 013021
(2008).
[18] O. Klimo, J. Psikal, J. Limpouch and V. T. Tikhonchuk, Phys. Rev. ST Accel. Beams 11,
031301 (2008).
[19] B. Qiao, M. Zepf, M. Borghesi, and M. Geissler, Phys. Rev. Lett. 102, 145002 (2009).
14

[20] A. Henig, S. Steinke, M. Schnurer, T. Sokollik, R. Hurlein, D. Kiefer, D. Jung, J. Schreiber,
B. M. Hegelich, X. Q. Yan, J. Meyer-ter-Vehn, T. Tajima, P. V. Nickles, W. Sandner, and D.
Habs, Phys. Rev. Lett. 103, 245003 (2009).
[21] A. Macchi, S. Veghini and F. Pegoraro, Phys. Rev. Lett. 103, 085003 (2009).
[22] S. S. Bulanov, A. Brantov, V. Y. Bychenkov, V. Chvykov, G. Kalinchenko, T. Matsuoka,
P. Rousseau, S. Reed, V. Yanovsky, D. W. Litzenberg, K. Krushelnick and A. Maksimchuk,
Phys. Rev. E 78, 026412 (2008).
[23] M. Chen, A. Pukhov, Z. M. Sheng, and X. Q. Yan, Phys. Plasmas 15, 113103 (2008).
[24] M. L. Zhou, S. Zhao, H. Y. Wang, C. Lin, H. Y. Lu, Y. R. Lu, T. Tajima, X. T. He, C. E.
Chen, Y. Q. Gu and X. Q. Yan, Eur. Phys. J. Special Topics 223, 1031-1035 (2014).
[25] M. Chen, A. Pukhov, Z. M. Sheng, and T. P. Yu, Phys. Rev. Lett. 103, 024801 (2009).
[26] Z. M. Zhang, X. T. He, Z. M. Sheng and M. Y. Yu, Appl. Phys. Lett. 100, 134103 (2012).
[27] T. P. Yu, A. Pukhov, G. Shvets and M. Chen, Phys. Rev. Lett. 105, 065002 (2010).
[28] B. Qiao, M. Zepf, M. Borghesi, B. Dromey, M. Geissler, A. Karmakar and P. Gibbon, Phys.
Rev. Lett. 105, 155002 (2010).
[29] T. P. Yu, A. Pukhov, G. Shvets, M. Chen, T. H. Ratliff, S. A. Yi and V. Khudik, Phys.
Plasmas 18, 043110 (2011).
[30] B. Qiao, M. Geissler, S. Kar, M. Borghesi and M. Zepf, Plasma Phys. Control. Fusion 53,
124009 (2011).
[31] B. Qiao, M. Zepf, P. Gibbon, M. Borghesi, B. Dromey, S. Kar, J. Schreiber and M. Geissler,
Phys. Plasmas 18, 043102 (2011).
[32] Ujjwal Sinha, Phys. Plasmas 19, 043104 (2012).
[33] T. C. Liu, X. Shao, C. S. Liu, M. Q. He, B. Eliasson, V. Tripathi, J. J. Su, J. Wang, and S.H.
Chen, New J. Phys. 15, 025026 (2013) and reference there in.
[34] T. Tajima and J. M. Dawson, Phys. Rev. Lett. 43, 267 (1979).
[35] W. Lu, C. Huang, M. Zhou, W. B. Mori and T. Katsouleas, Phys. Rev. Lett. 96, 165002
(2006).
[36] W. P. Leemans, B. Nagler, A. J. Gonsalves, Cs. Toth, K. Nakamura, C. G. R. Geddes, E.
Esarey, C. B. Schroeder and S. M. Hooker, Nature Physics 2, 696-699 (2006).
[37] A. Pukhov, S. Kiselev, I. Kostyukov, O. Shorokhov and S. Gordienko, Nucl. Fusion 44, S191-
S201 (2004).
15

[38] B. F. Shen, Y. L. Li, M. Y. Yu and J. Cary, Phys. Rev. E 76, 055402 (2007).
[39] B. F. Shen, X. M. Zhang, Z. M. Sheng, M. Y. Yu and J. Cary, Phys. Rev. ST Accel. Beams
12, 121301 (2009).
[40] X. M. Zhang, B. F. Shen, L. L. Ji, F. C. Wang, M. Wen, W. P. Wang, J. C. Xu and Y. H.
Yu, Phys. Plasmas 17, 123102 (2010).
[41] L. L. Yu, H. Xu, W. M. Wang, Z. M. Sheng, B. F. Shen, W. Yu and J. Zhang, New J. Phys.
12, 045021 (2010).
[42] F. L. Zheng, H. Y. Wang, X. Q. Yan, T. Tajima, M. Y. Yu and X. T. He, Phys. Plasma 19,
023111 (2012).
[43] M. A. Bake, S. Zhang, B. S. Xie, X. R. Hong and H. Y. Wang, Phys. Plasmas 19, 083103
(2012).
[44] F. L. Zheng, S. Z. Wu, H. C. Wu, C. T. Zhou, H. B. Cai, M. Y. Yu, T. Tajima, X. Q. Yan
and X. T. He, Phys. Plasmas 20, 013107 (2013).
[45] W. P. Yao, B. W. Li, L. H. Cao, F. L. Zheng, T. W. Huang, C. Z. Xiao and M. M. Skoric,
Laser Part. Beams 32, 583-589 (2014).
[46] Z. M. Sheng, K. Mima, Y. Sentoku, K. Nishihara and J. Zhang, Phys. Plasmas 9, 3147 (2002).
[47] M. Chen, Z. M. Sheng, J. Zheng, Y. Y. Ma and J. Zhang, Chin. J. Comput. Phys. 25, 43
(2008).
[48] See http://www.extreme-light-infrastructure.eu for the detailed information about the
extreme-light-infrastructure, 2009.
[49] M. Wen, B. F. Shen, X. M. Zhang, F. C. Wang, Z. Y. Jin, L. L. Ji, W. P. Wang, J. C. Xu and
K. Nakajima, New J. Phys. 12, 045010 (2010).
[50] D. Decker, W. B. Mori, K. C. Tzeng and T. Katsouleas, Phys. Plasmas 3, 2047 (1996).
[51] X. M. Zhang, B. F. Shen, L. G. Zhang, J. C. Xu, X. F. Wang, W. P. Wang, L. Q. Yi and Y.
Shi, New J. Phys. 16, 123051 (2014).
16
Recommended